Collaborative Research on Fluid Pathways and Metal Transport in Carlin-type Gold Deposits: Insights from the Getchell deposit Final Report for the US Geological Survey 2006 Mineral Resources External Research Program (MRERP) Research supported by the U.S. Geological Survey (USGS), Department of the Interior, under USGS award number 06HQGR0179. The views and conclusions contained in this document are those of the authors and should not be interpreted as necessarily representing the official policies, either expressed or implied, of the U.S. Government. Submitted by: Jean Cline, University of Nevada Las Vegas (Principal Investigator) John Muntean, Nevada Bureau of Mines and Geology (Co-Investigator) Anthony Longo, University of Nevada Las Vegas Mike Cassinerio, University of Nevada Reno October, 2008
Transcript
Collaborative Research on Fluid Pathways and Metal Transport in Carlin-type Gold Deposits:
Insights from the Getchell deposit
Final Report for the US Geological Survey 2006 Mineral Resources External Research Program (MRERP)
Research supported by the U.S. Geological Survey (USGS), Department of the Interior, under USGS award number 06HQGR0179. The views and conclusions contained in this
document are those of the authors and should not be interpreted as necessarily representing the official policies, either expressed or implied, of the U.S. Government.
Submitted by: Jean Cline, University of Nevada Las Vegas (Principal Investigator)
John Muntean, Nevada Bureau of Mines and Geology (Co-Investigator) Anthony Longo, University of Nevada Las Vegas
Mike Cassinerio, University of Nevada Reno
October, 2008
INTRODUCTION Carlin-type gold deposits in Nevada account for about 8% of annual worldwide gold production, making the United States the second largest gold producer in the world (NBMG, 2005). Despite their importance, several aspects of their origin remain enigmatic. Lack of agreement centers around the source, pathways, and depositional mechanisms of the auriferous hydrothermal fluids that formed the deposits. Current genetic models for the sources of ore fluids and components include: 1) metal leaching and transport by convecting meteoric water; 2) epizonal intrusions, 3) and deep metamorphic and/or magmatic fluids (Muntean et al., 2004). In addition to source, other controversial issues include: 1) the hydrology of the hydrothermal systems including vertical versus lateral flow, fracture versus intergranular flow, the pervasiveness of fluid flow, and the role of impermeable rock units, and 2) the relative importance of depositional mechanisms that form high gold grades including sulfidation, fluid mixing and the role of organic carbon. These issues can be better addressed if time-space models for Carlin-type deposits are available. Patterns of ore mineralogy and alteration in time and space have not been identified for Carlin-type deposits as they have for other ore systems such as porphyry copper deposits (e.g., Gustafson and Hunt, 1975) and porphyry molybdenum deposits (e.g., Seedorff and Einaudi, 2004). Establishing such patterns has been hampered by multiple overprinting hydrothermal events that pre-dated and post-dated formation of Carlin-type deposits, and difficulties in identifying and analyzing the fine-grained, volumetrically minor ore and gangue minerals. We proposed a 2-year research project addressing these issues by integrating a detailed geologic framework, available at the Getchell deposit and generated from data collected during many years of mining and exploration, with microanalyses and conventional analyses to provide information on the flow and chemical evolution of hydrothermal fluids over time and in space in a major Carlin-type deposit. Our goal was to develop a four-dimensional geologic and geochemical time-space framework in which we identify pathways along which ore fluids traveled to sites of deposition, precipitated gold, and exited the ore zones. Pilot studies have shown that ore-stage and late-ore stage minerals recorded the movement of ore fluids across the Getchell District, making Getchell an excellent site to learn about the distribution of ore fluids in space. Furthermore, the minerals at Getchell, despite their fine grain size, exhibit zoning, reflecting the evolution of ore fluids in time. The project is building on previous studies at Getchell as the next logical step to tackle key scientific problems that have broader implications and applicability to other districts. Results are now contributing to a four-dimensional geologic framework through the following project objectives:
1. Identify patterns of hydrothermal fluid flow and metal transport in time and space by conducting state-of-the-art geochemical and isotopic microanalyses on paragenetically well-constrained samples that were collected using a field-based, three-dimensional geologic model of the Getchell deposit.
2. Evaluate viable genetic models for Carlin-type deposits regarding the source of fluids by establishing at Getchell the three-dimensional geometry of conduits for incoming auriferous hydrothermal fluids below or lateral to orebodies and by
2
determining the distribution of fluid types including exchanged and unexchanged meteoric waters and magmatic/metamorphic waters.
3. Constrain depositional mechanisms for the formation of high gold grades in Carlin-type gold deposits by monitoring the physical and chemical evolution of auriferous hydrothermal fluids in incoming conduits before they deposited gold, within ore zones where they deposited gold, and in outflow zones lateral to or above orebodies after they deposited gold.
The first year of our project was funded by the USGS Minerals Research External Research Program and we here report results of this research. We have since obtained additional funding from NSF to continue this project and we have expanded our efforts into a three-year project, which is still underway. Year 1 deliverables outlined in our USGS proposal include a report summarizing year 1 results and the following items:
a. Cross-section i. to include interpreted lithologic packages, structures, hydrothermal
ii. location map for cross-sections b. Screen captures of GOCAD model that illustrate interpreted flow paths c. Petrographic descriptions and supporting micro-photographs d. All microprobe, cathodoluminescence, and chemical analyses obtained in
year 1 e. All C and O isotope results
We have accomplished all of our goals and provide the above deliverables in this report.
DISTRICT AND DEPOSIT GEOLOGY
District History
The Getchell deposit is located on the northeastern flank of the Osgood Mountains, 30 miles northeast of Winnemucca, Nevada. Mining in the area began in 1883, when copper, lead and silver were exploited from skarn deposits. Tungsten was discovered in the skarns in 1916 and was mined sporadically until 1957 (Horton, 1999). Gold was first discovered in 1934, making Getchell the first Carlin-type gold deposit to be discovered in Nevada, 27 years prior to the discovery of the Carlin deposit. Prospectors sampled and assayed a prominent siliceous outcrop that had been known for years, but had failed to yield any gold by panning (Hotz and Wilden, 1964). Production from an open pit commenced in 1938, when first oxide and then sulfide ores were mined until 1950 by Getchell Mine Inc. In 1960 Goldfield Consolidated Mines reopened the mine and exploited sulfide ores until 1967. The property was purchased in 1983 by First Mississippi, who formed FirstMiss Gold to put the mine back into production in 1987, first from open pits mainly along the Getchell fault. In 1994 underground production commenced in the footwall of the Getchell fault (Getchell Footwall). The Turquoise Ridge deposit, located in the hanging wall of the Getchell fault, began in 1991 as a near-surface open pit from which low-grade oxide ores were mined. A deep hole drilled in
3
1993 discovered underlying high-grade refractory sulfide ore. A production shaft was put into service in late 1998, at which time Placer Dome merged with Getchell Gold and became owner of Getchell (Horton, 1999). In late 2003, a joint venture with Newmont Mining was formed, and underground production at Turquoise Ridge commenced in 2004. Barrick Gold acquired Placer Dome in 2005. Since 1938, Getchell has produced approximately 4.5 million ounces of gold from ore with an average grade of about 0.3 oz/t gold (Horton, 1999; Muntean, 2008). At the end of 2007, proven and probable reserves were 11.239 million tons grading 0.458 oz/t gold, and the measured and indicated resource was 3.291 million tons grading 0.409 oz/t gold, for a total of 6.5 million ounces of gold (Muntean, 2008). Gold is currently being mined only from Turquoise Ridge, using a cut-off grade of about 0.35 oz/t gold.
District Geology
The geology of the Getchell district has been discussed by (Joraleman, 1951; Hotz and Wilden, 1964; Chevillon et al., 2000; Crafford, 2000; Boskie, 2001; Marlowe et al., 2007) and is summarized here (Fig. 1). Ore bodies are hosted primarily by Cambrian-Ordovician carbonates and clastic rocks with interlayered basaltic rocks. In the past, these rocks have been assigned to the Cambrian Preble, Ordovician Comus or Ordovician Valmy formations. Gradational contacts, facies changes, absence of marker units and lack of age control in the Getchell area, as discussed below, prevent assignment of the rocks to these three established formations. The primary ore-controlling structure in the district is the Getchell fault zone, which runs along the northeastern flank of the Cretaceous Osgood granodiorite stock. The fault zone dips between 30 and 80º east, mainly between 40 and 55º, and has a complex history with evidence for normal, reverse, and strike-slip motion. Horizontal to very gently north- and south-dipping mullions and slickenlines are overprinted by steeply plunging slickenlines. The Getchell fault and other faults highlighted in Figure 1 were proposed by Cline et al. (2005) and Muntean et al. (2007) to be Paleozoic faults linked to underlying basement faults that originated during rifting of western North America during the Proterozoic. The Cambrian-Ordovician rocks were then complexly deformed prior to the deposition of the Pennsylvanian-Permian Etchart Limestone, likely during the Antler Orogeny. Basalt, chert, and siltstone, which have been traditionally assigned to the Valmy Formation, commonly have tight, locally recumbent, east to southeast-verging folds (e.g., Summer Camp Pit, Megapit at Twin Creeks) consistent with thin-skinned tectonics, whereas rocks traditionally assigned to the Preble and Comus formations commonly show west-verging more upright folds at Getchell and elsewhere in the Osgood and Edna Mountains (Madden-McGuire and Marsh, 1991; Crafford, 2000). These folds are well expressed in seismic lines across the hangingwall of the Getchell fault. The west-verging structures are consistent with thick-skinned tectonics and are interpreted by Cline et al. (2005) and Muntean et al. (2007) to be the result of inversion of east-dipping high-angle faults, including the Getchell fault zone. Havallah Sequence siliciclastic and basaltic rocks occur to the northwest of the Getchell mine area. They were emplaced over the Cambrian-Ordovician rocks and Etchart
4
Limestone along the Golconda thrust during the late Permian to early Triassic Sonoma orogeny. The Etchart Limestone is broadly folded along northeast-trending fold axes during the Sonoma and/or subsequent Mesozoic orogenies. The Paleozoic rocks were intruded by the Cretaceous Osgood stock, which consists predominantly of medium-grained equigranular to porphyritic granodiorite and related dikes and sills of dacite porphyry, which were commonly emplaced along structures sub-parallel to the Getchell fault zone (i.e. Berger and Taylor, 1980). 40Ar/39Ar dates on hornblende and biotite suggest emplacement between 91 and 98 Ma (Groff et al., 1997). The contact metamorphic aureole extends up to 3 km from the stock and, in carbonate rocks, zones outward from calcite-wollastonite-diopside-garnet-tremolite skarnoids to marble. Siliciclastic rocks, depending upon the protolith, can contain cordierite, andalusite and/or biotite. Metasomatic skarn associated with the stock is expressed mainly by tungsten mineralization associated with scheelite, andraditic garnet and iron-rich diopside and retrograde tremolite/actinolite-epidote-quartz-scheelite-sulfides. Later and/or more distal metasomatic mineralization is expressed by quartz veins that contain variable amounts of carbonate, pyrite, pyrrhotite, arsenopyrite, and base metal sulfides (Cline, 2001). The Osgood stock appears to be part of a protracted magmatic-hydrothermal event as evidenced by dates ranging from 115-80 Ma based on 40Ar/39Ar dates and a U-Pb zircon date from Twin Creeks (Hall et al., 2000; Breit et al., 2005) and 40Ar/39Ar dates on hydrothermal K-feldspar and sericite at Getchell (Groff et al., 1997). No intrusive rocks in the Getchell area have been identified or dated as Tertiary. The mined out open pits of the original deposit are located along the Getchell fault, whereas the Getchell Underground and Turquoise Ridge deposits, which are currently being mined underground, are in the footwall and hanging wall, respectively (Figs. 1, 2). The open pits and Getchell Underground are largely within the contact metamorphic aureole of the Osgood stock, whereas Turquoise Ridge straddles the contact aureole, as defined by the presence of calc-silicates. Turquoise Ridge contains mineralization from the surface to a depth of over 3500 feet. The main ore body plunges north, and the highest grades and tonnages are located at the north end at depths greater than 1700 feet. Post-mineral rocks in the hanging wall of the Getchell fault include an Oligocene felsic tuff (27.1±1.3 Ma, 40Ar/39Ar, biotite, Ken Hickey, written communication, 2008), about 50 to 60 feet thick, in the North Pit as well as alluvium up to about 25 feet thick. Boskie (2001) reported that right-oblique and horizontal slickenlines and along the Getchell fault smeared orpiment and fine-grained pyrite, indicating movement after ore formation.
Mineral Paragenesis and Wallrock Alteration
Ores in the Getchell district are largely devoid of supergene oxidation, which, although detrimental to economics, aids geologic studies. Gold grade is most closely correlated with the abundance of fine-grained gold-bearing arsenian pyrite associated with variable amounts of decalcification, argillization and silicification. Mineralization is Eocene in age, based on a 39.0±2.1 Ma Rb-Sr age on galkhaite (Tretbar et al., 2000). Ore-stage mineralization consists of ore-stage Au- and trace-element-rich pyrite, and is accompanied by varying abundances of kaolinite, illite, and jasperoid quartz (Cail and
5
Cline, 2001; Cline, 2001). Textural relationships suggest that this assemblage formed largely in response to fluid rock reaction and replacement. Late-ore-stage minerals consist of, in order of deposition where they are all present, drusy quartz, orpiment, fluorite, stibnite and realgar, and calcite (Cline, 2001). Numerical modeling (Hofstra et al., 1991) indicates that sulfidation of wall rock iron by an ore fluid containing bisulfide-complexed Au and other trace metals best replicates the observed ore-stage minerals in observed abundances. Modeling further indicates that the late-ore stage most likely precipitated in response to fluid cooling.
GEOLOGY OF THE TURQUOISE RIDGE DEPOSIT The geologic framework presented here is mainly built upon the foundation established by Getchell Gold and Placer Dome from 1995 to 2002, which was developed mainly from surface diamond drill holes drilled on an average spacing of 200 feet. In 2004 and 2005, prior to this study, Muntean and others refined the geologic model of Turquoise Ridge using information from hundreds of closely spaced underground diamond drill holes. Detailed 1:600 scale underground, east-west geologic cross-sections, spaced 50 feet apart, were constructed from existing detailed core logs, core photos, and spot inspection of drill core and underground exposures (Fig. 3). Subsequently, contacts of interpreted lithologic packages were modeled using GOCAD – a 3D software package. Later Muntean made more detailed lithologic, alteration, and mineralization cross-sections of cross-sections 2360300N and 2360200N. The detailed cross-sections were put into GOCAD and interpreted in the context of the greater Getchell district. During the current study, several core holes were inspected and sampled in detail to help substantiate the geologic model and carry out laboratory studies described below. The geology of the Turquoise Ridge deposit is complex. It is characterized by stratigraphy that lacks marker units and exhibits rapid facies changes and soft sediment deformation features. The stratigraphy is overprinted by numerous compressive and extensional structural features. In addition, the stratigraphy was thermally metamorphosed and locally mineralized during emplacement of Cretaceous intrusions, prior to ore formation. Given these complexities, understanding of the stratigraphy and structure of Turquoise Ridge continues to evolve. The basic stratigraphic framework of Turquoise Ridge is laid out in the north-south cross-section displayed in Figure 4. The lowermost unit is predominantly carbonaceous mudstones and recrystallized micritic limestones with interlayers of calcarenite limestone turbidites. This lower unit typically has organic carbon contents greater than 0.5 weight percent, whereas higher lithologic packages have carbon contents less than 0.2 weight percent (Fig. 5). Overlying the carbonaceous unit is a series of sedimentary debris flow breccias that pinch out to the south. Above this unit are slumped micrites and tuffaceous mudstones. At the north end of Turquoise Ridge, basalt, referred to as the northern pillow basalt, overlies the slumped limestones and mudstones. The basalt has a blunt southern edge that strikes west-northwest across the north end of Turquoise Ridge. Further up section the rocks are predominantly tuffaceous mudstone with thin basalt flows and diabase sills. It needs to be stressed that the units described thus far are lithologic packages. In fact, one can see every lithology mentioned above in each of the
6
units, albeit with varying proportions. Overall, the lime content of the sequence decreases upward, whereas the volcanic component increases upward. The units have been traditionally assigned to the Ordovician Comus Formation. Despite many efforts, no conodonts have been found in carbonates at Turquoise Ridge. A similar package of rocks is present at Twin Creeks, where 40Ar/39Ar dates of 500.5 Ma and 481.6 Ma were obtained from phlogopite from peridotite and gabbro sills. The dates are right at the Cambrian-Ordovician boundary (Breit et al., 2005). Overlying the mudstone unit are basalt, chert and siltstone that have been customarily assigned to the Ordovician Valmy Formation. If the Roberts Mountains thrust is present at Getchell, it likely occurs at the base of the upper basalt. The upper basalt-chert-siltstone sequence is unconformably overlain by the Pennsylvanian-Permian Etchart limestone. Cretaceous dacite dike cut the section. Figure 6A is one of the detailed 1:600 scale east-west cross-sections through the guts of the high-grade, north end of the Turquoise Ridge deposit. Note the close-spaced fans of underground core holes. The top of the section is about 1,500 feet below the surface, whereas the bottom of the section is at a depth of approximately 3,000 feet. Figure 6B shows the interpreted geology. The lowermost purple unit on the west side of the cross-section is carbonaceous mudstones and limestones (Fig. 7). The mudstones are either siliceous and non-calcareous or argillaceous and variably calcareous. They are commonly planar laminated with local disruption of bedding. The limestone is recrystallized micrite, medium gray to black in color and beds are generally centimeters in width. All of the limestones at Turquoise Ridge are recrystallized, and the mudstones contain muscovite that formed under low-grade metamorphism related to Cretaceous intrusive events and/or earlier regional metamorphism. Locally, turbidites to tens of centimeters in width are present and consist of sand-sized grains of limestone that are commonly graded. These rocks were originally interpreted as a basin plain facies by Placer Dome geologists, though a distal slope depositional environment is more likely. Further to the east and overlying the relatively undisturbed carbonaceous rocks are the same lithologies, but the rocks are much more disturbed. They mark the base of the sedimentary breccia unit (Fig. 8), and show features that are consistent with slumping and soft sediment deformation. The limestone interlayers have been commonly stretched into disc shapes, which typically have the same orientation for 100’s of feet of core (Fig. 8A). The discs are interpreted to be parallel to primary bedding and are analogous to pinch and swell structures or boudins, which form in layers showing strong contrast in ductility. The limestone, having undergone a greater degree of lithification than the carbonaceous mud, preferentially pinched and necked during compaction and transport down a depositional slope. Cementation and lithification of limestone starts very early in diagenesis, while mudstones are still unlithified. Cementation of limestone near the depositional surface, even in a deep margin setting, can begin within 10,000 years after deposition (e.g., Grammer et al., 1993; Grammer et al., 1999). Alternatively the discs could be interpreted to have formed by ductile deformation long after the entire package had lithified. Such deformation would require elevated pressures and temperatures, likely at depths greater than 10 kilometers. Breccias commonly occur at the base of the
7
sedimentary breccia and are characterized by rotated, unoriented, cm-scale gray micrite fragments supported by carbonaceous mud (Fig. 8B). Further to the east, in the lower part of the sedimentary breccia unit, breccias are much more abundant and the rocks, in general, are much more disturbed and chaotic, making correlation between close-spaced core holes very difficult. Greater than 50% of the upper part of the sedimentary breccia unit is marked by a series of finer grained breccias, characterized by subangular to subrounded gray micrite fragments, mostly <3 cm long, that are supported by carbonaceous, non-calcareous mudstone (Fig. 8C-D). The fragments are commonly elongated and oriented, and, in hand sample, the muddy matrix can appear foliated. In addition, calcite veinlets are truncated at fragment margins. These observations led some of the Getchell Gold and Placer Dome geologists to interpret the breccia as a mylonite. However in thin section (Fig. 8E), none of the fragments contain recrystallized tails (i.e. pressure shadows). The muddy matrix does appear foliated in thin section; the foliation is accentuated by carbonaceous material. There is variation to this foliation, though, with common tortuous whirls in the muddy matrix. An alternative interpretation (Vic Chevillon and Jon Thorson, Placer Dome geologists, personal communication) was that the breccia was originally sedimentary in origin. Figure 9, an even more detailed interpretation of the upper part of the breccia, reveals that the geometries of the individual breccia bodies are complex and are more akin to channels rather than planar fault zones. Truncation of calcite veins had to occur prior to brecciation of the limestone. If the brecciation occurred soon after brecciation, the limestone had to be sufficiently lithified to periodically hold up fractures at high strain rates to form the calcite veins. The monolithologic nature of the clasts, the lack of cataclastic texture, the local laminated nature of the breccia matrix, the lack of recrystallized tails, the lack of folded calcite veins, and the geometry of individual bodies and the overall spatial distribution of the breccia point to a sedimentary origin rather than a later tectonic event marked by ductile deformation. Overlying the sedimentary breccia unit are much less carbonaceous rocks consisting of thin bedded (millimeters to centimeters thick), light gray micritic limestone with thin interlayers of brown mudstone and poorly bedded to massive brown mudstone (Figs. 10A, B). The brown mudstone contains unoriented biotite that formed from contact metamorphism of what is interpreted to have been a tuffaceous mudstone. The bedding in the limestones is commonly complexly, ductily folded (Figs. 10C-G). Much like the breccias, there is debate whether the folds represent tectonic folds resulting from ductile deformation or slump folds formed during soft sediment deformation. To illustrate this controversy, Figure 11 shows a small-scale example of one of these folds, albeit in the underlying carbonaceous mudstone and limestone. From a soft-sediment perspective, the discordant black cracks in the limestone (Fig. 11A) could be explained as mud injection features; however, in thin section, the discordant cracks are axial plane features defined by aligned muscovite and carbonaceous material, which suggests a tectonic origin (Fig. 11B). However, axial plane cleavages have been documented in syn-sedimentary folds, both in the field and in the laboratory (e.g., Williams et al., 1968;
8
Woodcock, 1976; Maltman, 1977). They can also result from realignment of clay minerals during soft sediment shearing or fluid expulsion related to compaction (e.g., Tobisch, 1984; Maltman, 1994) with later metamorphism of aligned clays to muscovite. In the absence of an erosional truncation of an upper surface of a fold within a given sedimentary unit, the origin of such folds is indeterminate at this time. The northern pillow basalt overlies the limestone and tuffaceous mudstones on the east end of the cross-section (Figs. 7, 12). Although the contact is commonly broken, it is locally depositional, indicating the basalt erupted onto the sediments, and was not tectonically emplaced (Figs. 12A, B). Again, the thickest part of this basalt has a sharp west-northwest boundary that runs obliquely through the cross-section. The cross-section shows that some of the flows near the top of the basalt spilled over to the southwest. Dacite porphyry dikes cross-cut the Cambrian-Ordovician section. The most prominent dike cuts across the entire cross-section and ranges from 1 to 6 meters in thickness (Figs. 7, 13). The dike is sub-parallel to the Getchell fault, but has a shallower dip. Zircons from the dike have been dated by U-Pb at 115±2.3 Ma (Ken Hickey, written commun., 2008), significantly older than the Osgood stock, but similar in age to a dacite porphyry dike dated at Twin Creeks (Breit et al., 2005). The continuity of the dike indicates little Tertiary extensional faulting in the area of the cross-section in Figure 7, at least none with displacements of more than about 5 meters. The only high-angle fault with a greater displacement, cuts the basalt but does not appear to cut the underlying Cretaceous dike. Contacts between these lithologic packages were modeled in GOCAD. These include the top of the lowermost carbonaceous mudstone-limestone unit, the top of the sedimentary breccia unit and the bottom of the northern pillow basalt. Figure 14 shows the surface projection of these three surfaces. Note the west-northwest-trending southern boundaries to the northern pillow basalt and sedimentary breccia. Figure 15 shows plan views, with structural contours, of the top of the carbonaceous mudstone-limestone unit and the top of the breccia. The surfaces are irregular, especially the top of the carbonaceous mudstone-limestone unit. The basin/synform morphologies are not artifacts of the logging (based on rechecking) and are interpreted to be erosional channels whose walls were subsequently over-steepened during later tectonic shortening, as discussed below. The upper surface of the breccia unit has definite west-northwest trending breaks that are related to the changes in the slope of the surface. Figure 16 is a three-dimensional view looking west-northwest along strike of all three surfaces, plus the top of the northern pillow basalt. The evidence provided above for soft sediment deformation and the southward linear pinch-outs of the sedimentary breccia unit and the northern pillow basalt support the hypothesis originally proposed by Placer Dome geologists Vic Chevillon and Jon Thorson that there was a west-northwest trending active basin margin during deposition of the sedimentary host rocks at Turquoise Ridge. Figure 17 is a schematic block diagram illustrating the three-dimensional geometry of the basin margin and how it may have formed. Based on bedding trends, the lowermost carbonaceous mudstones and limestones were folded into a west-northwest trending monocline that is interpreted to
9
have formed by syn-depositional normal movement along a buried west-northwest-striking, northeast-dipping fault (Figs. 2 and 4). There may have been more than one fault as evidenced from the west-northwest trending breaks on the upper contact of the carbonaceous mudstone and limestone unit, as mentioned above. The buried fault zone is interpreted to be linked to underlying basement rift faults of the same orientation that formed during the Proterozoic (Muntean et al., 2007). The normal faulting caused local topographic instability and the emplacement of slide blocks and sedimentary debris flow breccias, mainly of carbonaceous mud and partially to fully lithified limestone. These were localized in erosional channels, which are now represented as thickened portions of breccia in synforms, accentuated by later shortening. In addition, blocks of less carbonaceous mudstone and tuffaceous mudstone slid northward over the breccia unit. Similar sedimentary debris flow breccias and slide blocks in Cambrian-Ordovician rocks have been documented in the Tybo district in the Hot Creek Range in central Nevada by Cook and Taylor (1977). Soon after, basalt erupted and flowed up against the west-northwest-trending topographic barrier. The submarine eruptions did not occur along the basin margin, as evidenced by the lack of basaltic diking in the vicinity of the margin. The transition from relatively deep quiet water sediments to disturbed sediments to volcanic rocks represents the onset of Cambrian-Ordovician extension in the Getchell area, which has been proposed for upper plate rocks of similar age elsewhere in north-central Nevada (e.g., Madrid, 1987). As mentioned above, rocks at Turquoise Ridge were later tectonically deformed. As stated above debate persists over how much of the folding and brecciation is syn-depositional versus tectonic. The overprinting makes distinction of individual features very difficult. A definite tectonic cleavage is variably developed in the rock at Turquoise Ridge (Fig. 18). It occurs as a spaced crenulation cleavage that is generally oriented at a high angle to bedding and is observed to be upright on the surface (Fig. 18A). The crenulation cleavage is defined by sub-parallel wispy planes of carbonaceous material and muscovite and kinking of muscovite (Figs. 18B,C). Numerous high-angle faults of several different orientations exist in underground mine exposures at Turquoise Ridge. Faults lack continuity along strike and down dip, and displacements are generally less than 5 meters. They locally exhibit strong control to gold grade, but commonly do not. Deep core holes that cut the Getchell fault at depth below Turquoise Ridge do not show juxtaposition of different lithologic packages. Seismic lines across the north end of Turquoise Ridge and the Getchell fault zone show a series of west-verging folds that appear to climb the Getchell fault, as if were a thrust ramp (Fig. 19). If the base of the upper basalt is the Roberts Mountain thrust, the seismic data and drill holes suggest it is folded as well (Fig. 19). These features suggest apparent reverse motion along the Getchell fault zone after the emplacement of the Roberts Mountain thrust but prior to deposition of the Etchart limestone. Subsequent apparent normal motion along the Getchell fault zone is indicated by juxtaposition of basalts and cherts against the lower carbonaceous mudstones and limestones in the North pit. The seismic data and limited drilling indicate the apparent normal displacement could be as much as 1000 feet. How
10
much of this normal movement is post-mineral is uncertain; some of it could be synchronous with the deposition of the Etchart Limestone (Muntean et al., 2007).
DISCUSSION
Controls on Gold Mineralization and Hydrothermal Alteration at Turquoise Ridge
Inspection of gold grades at a variety of scales utilizing the gold grade thickness maps, block models of gold grade, GOCAD district model, and detailed cross-sections indicate the controls on mineralization at Turquoise Ridge are complex intersections between: 1) north-northwest-striking high-angle faults and fracture zones that are subparallel to the Getchell fault, 2) the west-northwest-trending basin margin and sedimentary breccia unit, 3) margins of north-northeast trending synforms and antiforms, 4) northeast-trending faults and fracture zones and, in general, 5) calcareous lithologies. Many of these controls are illustrated in Figure 20, which is map produced by summing vertically the blocks of a gold grade model that Placer Dome constructed for Turquoise Ridge in 2003. Note the strong west-northwest trending pattern that is parallel and occurs just south of the southern boundary of the northern pillow basalt. There is another smaller, west-northwest trending zone of gold mineralization just north of the pinch-out of the sedimentary breccia unit, which also corresponds to an abrupt increase in the north dip of the underlying carbonaceous mudstone and limestone unit. The more eastern of the two north-northeast trends at the north end of Turquoise Ridge corresponds to the synform that likely represents an original channel containing a greater thickness of the sedimentary breccia unit. As pointed out above, the channel was then subsequently over-steepened during tectonic folding. A three dimensional model of the gold, called a voxet, was constructed in GOCAD using an algorithm based on inverse distance and a cell size of 50 feet. The limits of the voxet, which is analogous to a block model, as well as the drill control, are shown in Figure 21. From this model, gold grade shells at 0.01 opt gold and 0.05 opt gold were constructed in GOCAD. The shells clearly show the Turquoise Ridge deposit and the gold mineralization along the Getchell fault, which trends about N15ºW (Fig. 22). Closer inspection of the shells within Turquoise Ridge and along the Getchell fault reveals a N30-40ºW fabric that cannot be easily discounted as an artifact of the GOCAD algorithm or the drill pattern. The general three-dimensional patterns of gold mineralization at Turquoise Ridge and along the Getchell fault can also be determined by looking at sectional planar slices of the voxet model (Figures 23, 24). The slices show the same N30-40ºW fabric, sub-parallel to the Getchell fault, both in the footwall and hanging wall. Also, a northeast fabric is apparent in the hanging wall of the Getchell fault, especially near the surface (see slices 5500 to 4500 foot elevation in Figure 24). There is an apparent northeast-trending southeast boundary to the gold mineralization that is especially apparent in the deeper, northern part of Turquoise Ridge (see slices 3500 and 3000 foot elevation in Figure 24). The slices show that gold mineralization along the Getchell fault occurs mainly above elevations of 4200 feet; however, this is likely a function of the depth of drilling. Drill
11
intercepts of the Getchell fault directly down-dip of ore along the fault are very limited below 4200 feet. Nevertheless, the bulk of the higher grade mineralization (>~0.05 opt gold) along the Getchell fault occurs between elevations of 4600 and 5200 feet. Drilling below the underground ore in the footwall of the Getchell fault (e.g., 194 orebody) has gone down to 3600 to 3700 feet, but only in a limited of holes. Gold mineralization at Turquoise Ridge in the hanging wall of the Getchell fault occurs from 2600 feet to the surface (~5300-5400 feet elevation), but is mainly below 4700 feet elevation. Most of the higher-grade mineralization (>~0.05 opt gold) occurs between elevations of 3300 to 4700 feet at the south end of Turquoise Ridge (near the shafts) and between 2500 and 3600 feet at the larger, and higher grade, north end of Turquoise Ridge, locally known as the North Zone. Several holes have been drilled below Turquoise Ridge, with many piercing the Getchell fault. The higher-grade zones at Turquoise Ridge are connected to the underlying Getchell fault by steeply plunging plumes of lower grade mineralization (see slices 2359000N to 2360500N in Fig. 23). As pointed out in Figure 20, west-northwest trends of gold mineralization at the north end of Turquoise Ridge coincide with the west-northwest basin margin defined by the pinch-out of the sedimentary breccia unit and the blunt edge of the northern pillow basalt. Looking west-northwest along strike of the basin margin with the three-dimensional GOCAD model clearly shows gold mineralization is preferentially hosted in the sedimentary breccia unit, especially where the unit dips steeply (Fig. 25A, B). Looking north-northeast, down dip into the breccia unit reveals that gold is not uniformly distributed, but rather has the same northwest fabric, sub-parallel to the Getchell fault, discussed above (Fig. 25C, D). Figure 26A not only illustrates this internal northwest fabric within and above the sedimentary breccia unit, but also shows that the dominant trend of gold mineralization at Turquoise Ridge is west-northwest. The zone that is parallel to the Getchell fault persists, but is not as wide. Also apparent is the north-northeast control imparted by the synform (steepened channel discussed above). Figure 26B, an upside down view of the top of the carbonaceous mudstone/limestone unit, shows that the west-northwest trends persist below the breccia suggesting fracture zones associated with the basin margin acted as pathways for the auriferous hydrothermal fluids. Figure 26C shows the “exhaust” pathways of the hydrothermal fluids above the sedimentary breccia unit. The west-northwest patterns of gold mineralization suggest fractures parallel with the basin margin persisted upward through the sedimentary breccia unit. The GOCAD model is valuable in delineating the overall patterns and controls on gold mineralization. However, the model is too coarse to define individual fluid pathways or controls on specific ore zones. In addition, no suitable hydrothermal alteration model could be derived from the existing drill database using GOCAD because of the complexity of the alteration patterns and the inconsistency in logging the alteration features associated with the Carlin-type gold mineralization. In order to outline the fluid pathways in more detail, hydrothermal alteration was plotted and gold grades were hand-contoured on two detailed east-west 1:600 scale underground cross-sections at the north end of Turquoise Ridge, using existing logs, high-resolution digital core photos (prior to
12
sawing and assaying), and logging and sampling of selective holes that still existed. The closed-spaced nature of the fans of underground core holes allows confident correlation of individual alteration and gold zones, which is difficult to do using only surface holes spaced 200-500 feet apart or from underground exposures. Underground exposures are limited mostly to ore zones, difficult to work with, and are shotcreted very quickly after they are made. The locations of the two cross-sections are shown in Figure 3. One of the cross-sections is 2360300N, which is the same section shown in Figure 6. The other is 2360200N, 100 feet to the south. Section 2360200 extends further westward, and has drill intercepts across the Getchell fault. East-west cross-sections were constructed because almost all the fans of underground core holes were drilled in east-west planes. Decalcification and argillization are the alteration types most closely associated with gold mineralization as described above in the section on alteration. They both represent hydrolytic alteration by low pH fluids. Decalcification is the result of alteration of the calcareous lithologies, whereas alteration by similar fluids of mudstones and igneous rocks produces argillization. Therefore, they were combined on the cross-sections. Attempts to plot silicification were unsuccessful, because it was logged inconsistently and it is difficult to recognize in the core photos. Realgar and orpiment were plotted. Orpiment is much less abundant than realgar and only occurs where there is realgar. Figure 27 shows moderate to strong decalcification/argillization plotted on the interpreted geology of section 2360300N. Rocks outside the yellow areas are visibly unaffected by Carlin-type alteration (no evidence of decalcification, argillization or silicification) or are only locally weakly altered. Intervals of weak alteration were too narrow and scattered to allow any interpretation. The dacite porphyry dike marks a zone of continuous argillization along its margins and decalcification in its footwall and hanging wall. Larger alteration zones are mainly in the hanging wall of the dike as are high-angle zones which trend north-northwest drilling, based on other sections. The very narrow, steeply dipping alteration zone on the east side of the section strikes N20ºE. The current drilling below the dike does not preclude narrow high-angle alteration zones below the dike. Alteration is much more extensive and realgar is abundant on the west side of the section. The Getchell fault zone, not shown, clips the bottom left corner of Figure 27. Figure 28 shows hand-contoured gold grades, which were completed after alteration zones were interpreted. Note the strong correlation between the moderate to strong decalcification/argillization and gold grades greater than 0.01 opt. There are only a few places on Figure 28 where there is alteration with gold less than 0.01 opt and vice versa. Such strong spatial correlation is compelling evidence that the alteration is tied temporally in time with the ore event. Note that the area of extensive alteration and abundant realgar has grades ranging predominantly between 0.1 and 0.5 opt. However, as mentioned above the cut-off grade for the mine is about 0.35 oz/t gold, essentially the solid areas (>0.5 opt Au) on the map. The largest zone of greater than 0.5 opt gold occurs just east of the zone of abundant realgar and is referred to as the High Grade Bullion (HGB) zone, the most productive portion of the Turquoise Ridge mine to date. The HGB zone and many of the other zones of >0.5 opt gold occur near the top of the sedimentary breccia unit between elevations of 2800 and 3200 feet. Again, the rocks
13
above the sedimentary breccia unit are much less carbonaceous than the sedimentary breccia and underlying units. The alteration patterns in section 2360200N are comparable to 2360300N suggesting some continuity at short length scales in the north-south direction (Fig. 29). The patterns along the dike, the narrow, steeply dipping N20ºE zone on the east side of the section, and the high-angle, north-northwest, upward-branching zone in the middle of the section are similar. It is important to note, though, that the N20ºE zone persists below the dike. Also, on the very east side of the cross-section, the alteration deviates from the dike, diving below the dike. Alteration is stronger and more extensive along 2360200N, as are zones of abundant realgar. Weak alteration was sufficiently extensive to interpret. Nevertheless, the patterns are very complex. The east-dipping zone in the deep, west corner of the section is associated with the Getchell fault zone. The zones on the west side of the section are currently interpreted to be west-dipping and antithetic to the Getchell fault. Some of these zones underlie the HGB zone. The west-dipping zones are only based on surface holes but are consistent with the steep plumes off the Getchell fault evident from the GOCAD model. Like the alteration, the patterns of gold grade contours are very complex (Fig. 30). However, as in 2360300, a strong correlation between strong decalcification/argillic alteration is present. Most of the gold zones are very narrow and show sharp gradients in grade, commonly dropping from >0.5 opt to <0.01 opt in tens of feet. Like 2360300N, most of the high grade zones occur at the top of the sedimentary breccia unit, but at elevations between 3000 and 3400 feet, reflecting the north dip of the orebody pointed out in Figure 25. Unlike 2360300N, weak alteration with local zones of low-grade gold mineralization occur in the hanging wall of the HGB ore zone.
Pathways of Auriferous Hydrothermal Fluids
A main conclusion to take away from the patterns of alteration and gold grade deduced from the GOCAD model and detailed cross-sections is that the patterns are complex and appear to be fracture controlled. Extensive replacement of individual lithologic units appears to be absent. The complexity can be used to our advantage in that each fracture-controlled zone can be interpreted to be an individual fluid pathway. Fluid pathways were deduced for cross-sections 2360300N and 2360200N, which are combined in Figure 31. Section 2360300N is shown in the forefront. Section 2360200N, in the background, better shows the patterns along and above the Getchell fault on the west side, below the HGB in the center, and below the dacite porphyry dike on the east side. On the west side of the section, hydrothermal fluids are interpreted to have come up the Getchell fault and migrated up north-northwest-trending steep to west-dipping fracture zones in the hangingwall. These appear to have fed the overlying large HGB ore zone. On the eastern end of the section, there appears to be a steeply dipping upwelling zone that also could be tapping the Getchell fault at zone at depth. Other steep upwelling zones that tapped the Getchell fault between the HGB and the upwelling zone on the east cannot be ruled out. Such zones may have been numerous but narrow, as depicted below the HGB in Figures 28 and 31.
14
The upwelling fluids either punched through the dacite porphyry dike and continued flowing upward along steeply dipping fracture zones (steep N20ºE zone on east side of cross-section, aka 148 zone) or they traveled westward up-dip along the margins of the dike and periodically escaped upward along the high-angle fracture systems or formed large replacement bodies in the hanging wall of the dike (e.g., HGB zone). Fluids traveling in the fracture systems above the ore zones appear to have been opportunistic. For example, the middle of the three steep zones on the eastern half of Figure 31 suggests fluids flowed upward until the basalt was encountered. Fluids then followed the footwall contact of the basalt until a steeply dipping dacite porphyry dike (see Fig. 6) was encountered, along which it flowed upward across the basalt. In most cases, fluid flow was discordant to stratigraphy. Abundant realgar is more extensive on the west side of both 2360300N and 2360200N, in zones where gold grades normally range from 0.05 to 0.2 opt. Figure 32 shows an example of typical realgar-rich mineralization. As pointed out above, realgar is part of the late-ore stage, post-dating deposition of gold-bearing pyrite. In addition, chemical modeling by Hofstra et al. (1991) indicates cooling promotes deposition of realgar. These data and modeling strongly suggest realgar forms late, during incursion of low-temperature, near-surface meteoric waters attendant with collapse of the hydrothermal system. Therefore, spatial patterns of realgar in the Getchell district may lend insight to the hydrology of the hydrothermal system. Figure 33 shows the spatial distribution of realgar at Turquoise Ridge by summing the thickness of realgar zones in every surface hole drilled to depths of greater than 500 feet. Indeed, realgar is abundant on the west side of the entire Turquoise Ridge deposit along a north-northwest trending zone. As is well known, realgar was very abundant in the open pit ore along the Getchell fault and in the underground ore in the footwall of the Getchell fault. The observations suggest collapse of the Getchell hydrothermal system resulted in cooling by incursion of meteoric waters down and into the Getchell fault zone. Given the fluid pathways interpreted from the 2360300N and 2360200N and the patterns of gold grade in the GOCAD model, flow paths at the scale of the Getchell fault and Turquoise Ridge were deduced. Figure 34A, which is a plan view in GOCAD, shows gold values along the Getchell fault, constructed by taking the intersection of the Getchell fault surface and the gold voxet model. The Getchell open pit ore bodies are clearly shown to the west. There is no large zone of low-grade gold mineralization (≥ 0.003 opt gold) down-dip from the open pit ore bodies. This is mainly a result of drill density (Fig. 34B). Zones of gold mineralization along the Getchell fault, however, likely do indicate where there was relatively greater fluid flux along the fault zone. Gold values along the Getchell fault below Turquoise Ridge show N15-25ºE and N0-20ºW trends. The northeast trend is parallel to the southeast boundary of Turquoise Ridge, which is most apparent in the plan view of the 0.01 opt gold shells (Fig. 22). The north-northwest trend is underneath the western side of sections 2360300N and 2360200N. It is the west-dipping antithetic zones that connect the Getchell fault with the HGB ore zone (e.g., Fig. 29). We interpret that gold bearing fluids flowed up the
15
Getchell fault and encountered intersections with northeast- and north-northwest-trending low-displacement faults and fracture systems. Fluids were focused into these intersections zones and into upwelling north-east and north-northwest-trending plumes. Figure 35 illustrates the proposed model of fluid flow, which shows that the north-northwest-trending antithetic zones are likely vertical to steeply east-dipping rather than west-dipping as currently interpreted. Additional detailed section work should clarify this inconsistency. The upwelling plumes were then focused into more local features such as steep west-northwest-trending fracture zones associated with the basin margin and north-northeast fractures zones associated with the tectonically tightened channels. Deposition of ore at Turquoise Ridge in secondary hanging wall structures rather than the Getchell fault is consistent with observations of other ore systems such as orogenic gold deposits where ore is hosted in secondary shears rather than the major shear zone. The flow paths proposed for Getchell are consistent with the model put forward by Cox et al. (2001), which explains why ore is typically hosted along low displacement faults and fracture systems. Their model describes percolation networks, comprising faults, fractures and shear zones, in terms of three types of elements: backbone, dangling and isolated elements (Fig. 36). Backbone elements provide a direct connection from source of fluids and metals to the deposit. The Getchell fault zone is the backbone of the Turquoise Ridge-Getchell system. Dangling elements branch from the flow backbone and act as fluid feeders to the backbone in the upstream part of the system, or as discharge structures in the downstream part of the system. The north-northwest and northeast-trending plumes at Turquoise Ridge in Figure 34A, as well as the dike and hanging wall exhaust pathways in Figure 31 are excellent examples of dangling elements. Isolated elements are low-flux structures disconnected from any backbone or dangling elements. As pointed out by Cox et al. (2001), at low bulk crustal strains of only a few percent, a percolation threshold is reached when enough elements connect to allow fluid flow across the entire width of the network. Just above the percolation threshold, the flow backbone, in this case the Getchell fault zone, is a very small fraction of the total fault/fracture population, and flow is localized on relatively few structures, which link the source of fluids and metals with the site of deposition and discharge. This situation maximizes fluid/rock interaction in downstream/dangling elements where fluid is discharged into surrounding fractured, reactive host rocks, as in the case of the sedimentary breccia unit at Turquoise Ridge. Such small strain changes that result in percolation networks and tapping of fluid reservoirs likely occurred during the change from largely compressional to tensional tectonism in the middle Eocene in northern Nevada (cf. Cline et al., 2005).
CARBONATE STAINING AND ISOTOPE STUDY Figure 31 illustrates the apparent strong control of fluid flow by fractures at Turquoise Ridge, leading to an important exploration-related question about whether or not the rocks outside the visibly altered zones experience fluid-rock interaction or were they “high and dry” during the formation of Carlin-type gold ore? Although there is visible decalcification, argillization, bleaching or silicification, it is possible visibly unaltered rocks some distance from the ore/alteration zones were cryptically altered by ore fluids.
16
In order to investigate this question we tested whether there were any patterns in the staining characteristics and oxygen and carbon isotopes of the carbonate host rocks related to distance from visible alteration and gold mineralization.
Introduction to Carbonate Staining
Zones of iron-bearing carbonate peripheral to ore zones have been reported at Jerritt Canyon in the Jerritt Canyon district (Hofstra, 1994), Deep Star on the Carlin trend (Heitt et al., 2003) and at other deposits in unpublished reports. As pointed out by Hofstra and Cline (2000), iron-bearing carbonate zones can be associated with pre-ore hydrothermal events or the distal parts of Carlin-type systems. The distal zones are consistent with carbonation of iron-bearing minerals by CO2-rich, sulfide-depleted fluids formed by decalcification and sulfidation of limestones in Carlin ore zones. To test whether there are any patterns in the distribution of iron-bearing carbonates around the ore zones at Turquoise Ridge, about 470 samples from the combined 2360300N-2360200N cross-section (Fig. 31) were stained using Alizarin red S and potassium ferricyanide. Alizarin red S stains calcite pink, but does not stain dolomite. Potassium ferricyanide stains iron-bearing carbonates (calcite and dolomite) blue (Fig. 37). Stock solutions of 250 ml of 2% HCl and 0.3 g of alizarin red S and 250 ml of 2% HCl and 1.25 g of potassium ferricyanide were mixed in equal amounts. The 50-50 solution stains the carbonates a variety of shades of pink, red, purple and blue. Carbonates and their resultant color upon staining with the 50:50 solution are as follows: Carbonate Colorcalcite pink to red ferroan calcite lavender-purple to royal blue dolomite no stain ferroan dolomite blue to sky blue A recent summary of the staining characteristics of carbonates in hydrothermal ore deposits can found in Hitzman (1999). The stock solutions of alizarin red S and potassium cyanide were commonly applied separately in samples where distinguishing pink from purple from lavender was difficult (e.g., Fig. 37A). Also, casual painting of core with the solution can give misleading results. Non-carbonate iron-bearing minerals can cause “iron bleeding”. For example staining of iron-bearing clays/micas and fine-grained pyrite can cause adjacent carbonate to stain purple or blue and possibly lead one to think ferroan calcite or ferroan dolomite is present. Most of our samples were examined with a binocular microscope during staining to check for such complications. Results of the staining characteristics of carbonate-bearing lithologies and carbonate-bearing veins were recorded separately.
Results of Carbonate Staining
Before staining the samples from the combined 2360300N-2360200N cross-section, an orientation survey was conducted by staining 48 samples from 8 core holes and 5 surface
17
localities located at least 2000 feet from known mineralization. Samples showed no signs of decalcification, silicification or fine-grained pyrite. All of the background samples from core holes came from intervals that assayed ≤10 ppb gold. Figure 38 shows variation in the background results and no distinct spatial patterns. Eleven of the 13 background localities contain calcite-bearing lithologies. Ferroan calcite was present in 8 of the localities; ferroan dolomite was present in 5 localities and dolomite was present in 3 localities. In contrast, the staining characteristics of the samples from the combined 2360300N-2360200N cross section show a distinct pattern. Figure 39 shows zonation in the carbonates in the rock from deep calcite on the west side of the cross-section to ferroan calcite to the east and higher elevations. Ferroan dolomite was detected in a few samples from partially decalcified rock in the HGB ore zone. It was difficult to assess whether this was the result of bleeding from fine-grained pyrite. More work is planned to confirm the presence of this ferroan dolomite. Figure 40 shows a very similar pattern in the vein carbonates. The calcite-bearing rock and veins are concentrated along the interpreted Getchell fault zone and in the footwall of the HGB ore zone below the main through-going dacite porphyry sill. Ferroan calcite is widespread above the sill but is also present below the sill toward the east side of the cross-section. We are pursing determining whether or not these patterns persist at Turquoise Ridge beyond the combined 2360300N-2360200N cross section. Currently, we are considering two hypotheses to explain the pattern. One explanation is that the pattern formed prior to ore formation. Possibly iron was remobilized into the carbonates during contact metamorphism and hydrothermal activity associated with the emplacement of the Osgood stock. Similarly, the spatial association between the ferroan calcite and the northern pillow basalt suggests iron may have been remobilized out of the basalt for a distance into the underlying carbonates during diagenesis or emplacement of the stock. Alternatively, the ferroan calcite could have formed during ore formation. High fluxes of CO2-rich, sulfide-rich fluids along the Getchell fault zones and in proximal pathways in the hangingwall may have prevented formation of iron carbonate, but allowed precipitation of ferroan calcite in and above ore zones and away from the Getchell fault due to low fluid fluxes, depletion of sulfide in the fluid, and reaction of CO2-rich fluids with iron-bearing minerals in the rock. However, much of the ferroan calcite occurs in clean micrite with no evidence of replacement of any precursor iron minerals, suggesting there was iron metasomatism rather than carbonation of iron-bearing minerals. We are continuing to test these hypotheses. Thin sections of some of the samples were analyzed with energy dispersive spectroscopy (EDS) using a scanning electron microscope at UNLV in order to confirm our staining results. As expected, calcite (pink) samples did not show anything besides calcium. Unexpectedly, the ferroan calcite (purple stain) samples that we analyzed did not show any recognizable iron peaks in the EDS spectra. However, EDS is generally sensitive to only 1 wt% of a given element. Stains are reportedly sensitive to 0.1 wt%. We have plans to further confirm our staining results and obtain quantitative analyses using
18
wavelength dispersive spectroscopy (WDS), using an electron microprobe at the University of Michigan.
Oxygen and Carbonate Isotopes/Trace Elements: Introduction
Stable isotope signatures of carbonate rocks can record the passage of hydrothermal fluids such as base metal-silver manto deposits (e.g., Vazquez et al., 1998) as well as Carlin-type deposits (Rye et al., 1974; Radtke et al., 1980; Stenger et. al., 1998; Hofstra and Cline, 2000; Arehart and Donelick, 2006). Interaction of hydrothermal fluid with rock can shift the oxygen and carbon isotopes of the rock or the fluid or both, depending upon the temperature and the water to rock ratio, which is largely dependent upon the fluid flux through a given volume of rock. The effect in carbonate rocks is going to be greater in the oxygen isotopes, because oxygen is a major component in the fluid. As pointed out by Arehart (1996), Hofstra and Cline (2000) and Arehart and Donelick (2006), δ18O values in carbonates are typically shifted to lower values in Carlin-type deposits, whereas δ13C values can increase or decrease. Carbonate rocks, that are otherwise visually unaltered or not anomalous in metallic trace elements, may undergo isotopic shifts. In order to test the extent of hydrothermal fluid flow in the carbonate rocks surrounding alteration and gold-bearing zones at Turquoise Ridge, we collected calcite samples from 124 samples of drill core along the combined 2360300N-2360200N cross-section and submitted them for oxygen and carbon isotope analyses. The geologic control afforded by the mapped fluid pathways in Figure 31 provided an excellent opportunity to target ideal locations to test the extent of hydrothermal fluid flow away from Turquoise Ridge ore bodies. Samples were collected along transects across visually altered, gold-bearing zones. Each transect utilized multiple drill holes to establish greater sampling control above, within, and below orebodies and both distal and proximal to mineralized zones. Sampling focused on three zones, 1) the High Grade Bullion (HGB) ore body, 2) the Getchell fault and the north-south trending feeder zones in its hanging wall, and 3) the deep northeast feeder zone on the east side of the cross-section, down-dip of the High Grade Bullion. Both iron-bearing and iron-free calcite were sampled. In addition, we collected 12 calcite samples from 10 of the background holes/sites, described in the discussion on carbonate staining. The background samples that were chosen were calcite-bearing lithologies from the same Cambrian-Ordovician package of rocks that host ore and included micrite, calcareous mudstone, and calcarenite. Although the background samples showed no visual evidence of alteration related to gold mineralization (no decalcification, argillization, bleaching or silicification), they were recrystallized, presumably due to the effects of the Osgood intrusion. One of the background samples (00WM202_1839 BG CS) contained calc-silicate minerals in addition to recrystallized calcite. Calcite samples were hand-drilled (4 to 5 representative holes) from carbonate lithologies in a given sample of drill core. Only rock carbonate was sampled; veins were avoided. Samples were analyzed with the assistance of Simon Poulson at the Nevada Stable Isotope Laboratory at the University of Nevada Reno using a technique modified slightly from that of McCrea (1950), by reacting calcite with phosphoric acid to generate CO2 gas
19
for mass spectrometric analysis. Typical reproducibility for isotope analyses is ±0.1‰ for both oxygen and carbon. Greg Arehart, director of the Nevada Stable Isotope Laboratory, assisted with interpretation. In addition, a representative piece of the core from which an isotope sample was collected (~5 cm long that, in many cases, included carbonate veins and other lithologies) and submitted to ALS Chemex for multi-element analyses by ICP-MS, using a 4 acid near-total digestion (50 elements) as well as fire assay for gold, and a cold vapor atomic absorption analysis for mercury. The degree of alteration was recorded for each of the analyzed samples. Only alteration interpreted as resulting from Carlin-type gold mineralization and including decalcification, argillization, bleaching, and/or silicification was recorded. The sample locations, degree of alteration, carbonate staining characteristics, δ18O and δ13C values, and values of gold, arsenic and mercury are shown in Table 1; background samples are listed last and keyed with “BG” in their sample label. Eleven samples in Table 1, mainly from strongly altered, high-grade ore zones, did not have sufficient carbonate contents, due to decalcification, to yield isotopic analyses.
Oxygen and Carbonate Isotopes/Trace Elements: Results
Results are shown on Figure 41, a graph of δ13C versus δ18O, and Figure 42, which is a cumulative distribution curve for δ18O. The δ13C values show no clustering of values, ranging rather continuously from -8.2 to 1.2 ‰. The δ18O values range from 12.5 to 20.3‰, but most of the data are clustered between 17.6 and 19.0 ‰ (91 of the 125 samples). Figures 43 and 44 show the spatial distribution of δ18O and δ13C values from the background samples. The δ18O values of the background samples range from 15.1 to 20.3‰. There is a crude pattern in Figure 43 that the δ18O values are decreasing towards the Osgood stock and its contact aureole. The δ18O values are significantly lower than typical unaltered Paleozoic carbonates in northern Nevada that range from 22 to 28‰ (cf. Hofstra and Cline, 2000). As discussed in more detail below, the lower values are likely the result of contact metamorphism during Cretaceous magmatism. Several Cretaceous dikes have been identified between the Osgood stock and Twin Creeks deposit located to the northeast. Effects of Cretaceous magmatism are present throughout the Osgood Range and the Edna Mountains to the south, making establishment of the original sedimentary value difficult. The δ13C values range from -5.9 ‰ to 0 ‰ typical of unaltered Paleozoic carbonates that range from -8 to 3‰. There is no obvious pattern in the δ13C background values with respect to Turquoise Ridge or the Osgood stock and its contact aureole in Figure 44. Figures 45 and 46 show the distribution of the δ18O and δ13C values on the combined 2360300-2360200N cross-sections and their relationship to visual alteration and gold mineralization. There are recognizable general patterns in the δ18O data. Lower isotopic values are spatially associated with the Getchell fault zone and in the deep feeder zone on the east side of the section (upwelling northeast-trending plume) down-dip of the HGB ore body. Values are, on average, higher in the footwall of the main dacite porphyry dike. Values are slightly lower, on average, above the HGB ore body. The δ13C values are generally lower on the west side of the cross-section, which could reflect increasing proximity to the Osgood stock. However, many of the samples with low δ13C values
20
(<3‰) are spatially associated with interpreted fluid pathways. The low values on the west side could reflect instead increased fluid flux during gold mineralization within the north-south-trending plume upwelling off the Getchell fault. Though general patterns are present on the 2360300-2360200N cross-section, there is a lack of consistent patterns in the individual samples transects across alteration and gold-bearing zones. Inspection of Figure 45 shows relatively high δ18O values (>18‰) adjacent to the HGB and within the Getchell fault zone. Figure 42 shows that most visually altered samples have relatively low δ18O values (<17.5‰); however, several have values above 17.5‰. In addition, five of the twelve background samples have δ18O values less than 17.5‰. A major issue with the application of oxygen and carbon isotopes of carbonates to the Getchell district and most other large Carlin-type deposits is their close proximity to Mesozoic intrusions and their metamorphic contact aureoles. As noted above, Figure 42 shows a major grouping of δ18O values between 17.6 and 19.0‰, with a distinct break in the cumulative distribution curve at 17.5‰. This narrow range of values could represent local background established during emplacement of Cretaceous intrusions and recrystallization of limestones prior to Eocene gold mineralization. Taylor and O’Neil (1977) reported the stable isotope systematics of the tungsten skarns associated with the Osgood stock. Figure 47, taken from their paper, shows the δ18O and δ13C values for calcite from marble, calc-silicate hornfels, and skarn. Presumably they did not sample material that was altered by the Carlin gold hydrothermal system. Their data show that marbles, some of which are described as fine-grained and very likely similar to the recrystallized limestones at Turquoise Ridge, have δ18O values ranging from 16.6 to 20.7%, with all but one data point above 17.5‰ – not that dissimilar from the cluster of 17.6 and 19.0 ‰ at Turquoise Ridge. The lightest background sample of ours, 15.1‰ (00WM202_1839 BG CS), contained calc-silicate minerals. This value is similar to the δ18O values in calc-silicate hornfels reported by Taylor and O’Neil (1977). Thus, a reasonable assumption is that local background along the 2360300-2360200N cross-section, prior to Carlin-type gold mineralization, was between 17.5 and 19‰. Of the 22 samples along the 2360300-2360200N cross-section that have δ18O values less than 17.5‰, 10 are not visually altered; the remaining 12 are recognizably decalcified, argillized, bleached or silicified. Given that five background samples have isotopic signatures less than 17.5‰, it is difficult to determine with any certainly whether the 10 visually unaltered samples with signatures less than 17.5% experienced isotopic exchange during the Carlin-type gold mineralization event. The issue at Getchell is that the difference between the δ18O value of the gold-bearing hydrothermal fluids may not have been that different from the 17.5 to 20‰ of the recrystallized limestones at Turquoise Ridge. For example, δ18O values of the fluid inclusion waters in ore-stage quartz from the Getchell open pit range from 7 to 11‰ (Cline and Hofstra). Water could have circulated through the visually unaltered limestones with values greater than 17.5‰ at very low water to rock ratios (low flux) and may have lowered the δ18O value of the limestone only slightly. The amount of the shift is dependent upon the δ18O value of the hydrothermal fluid, the δ18O value of the host rock, the temperature, and the water:rock mass ratio. We will be calculating a matrix of possible isotopic shifts based those
21
parameters. The overall pattern of low δ18O values on the west side within and above the Getchell fault zone and in the deep upwelling zone on the east side of the cross-section could likely indicate higher fluid flux and water:rock ratios, which would be expected in the backbone (Getchell fault) and directly dangling elements (north-south-trending upwelling zone on west side of section and northeast-trending zone on east side of section) of the flow network (see Fig. 36). Rocks along dangling elements furthest from the backbone (e.g., exhaust zones, hanging wall of the HGB) should show lesser shifts to lower δ18O values because of lower fluid fluxes. Given we cannot rule out fluid flow in the visually unaltered rocks surrounding altered zones with gold mineralization, we tried to test the possibility that fluid flow in such rocks might be limited to fractures. The visually unaltered limestones commonly have bleached fractures surfaces. In order to test whether such fracture surfaces served as pathways for significant fluid flux, we separately sampled individual limestone beds at 1 cm spacings to see if isotopic values changed with distance from the fracture (Fig. 48). This was for 4 core samples along the along the 2360300-2360200N cross-section (Table I1). Results are tabulated here:
The samples do show minor, but consistent increases, in δ18O values away from fractures, with TU929_536.5 showing the largest variation, increasing from 17.9‰ to 18.8‰. The δ13C values do not show a consistent pattern. These preliminary results strongly suggest fluid flow along fractures with local exchange of oxygen isotopes between the fluid and the wall rocks. The isotope patterns described above and shown in Figures 45 and 46 are not sufficiently consistent to serve as an exploration tool to vector into altered and ore zones at the scale of the 2360300-2360200N cross-section. The reasons are the relatively low contrast in δ18O values between the hydrothermal fluid and the recrystallized limestone and likely highly variable water:rock ratios in the backbone and dangling elements of the flow network. The trace element analyses performed on the isotope samples, however, appear
22
to be a more reliable vectoring tool and shed additional light on the extent of hydrothermal fluid flow around the visually altered and gold-bearing zones. Gold, arsenic and mercury all show crude trends of increasing values with decreasing δ18O values (Figs. 49-51). As expected samples with high values of gold, arsenic and mercury are visually altered. However, there are many samples that are not recognizably altered that contain strongly anomalous values of gold (up to 653 ppb), mercury (up to 3260 ppb), and arsenic (up to 638 ppm). Interestingly, several of these samples with high values have δ18O values greater than 17.5‰. The spatial distribution of the trace elements along the 2360300-2360200N cross-section appears to be more coherent and systematic than the oxygen and carbon isotopes. Gold values appear to systematically increase toward the interpreted fluid pathways but form narrow halos to the altered zones (<~25 feet, Fig. 52). The zone of anomalous gold is wider in the footwall of ores zones than in the hanging wall, at least for the HGB ore body. All the samples collected from the Getchell fault zone assayed greater than 10 ppb gold, again reflecting greater fluid flux along the main backbone element of the flow network. Mercury forms a very similar pattern to gold, but forms a wider halo (~25-50 feet, Fig. 53). Arsenic systematically increases towards visually altered, gold-bearing zones with >100 ppm values commonly extending about 50 to 100 feet into the visually unaltered hangingwall and footwall (Fig. 54). Interpretation of the trace element data continues with plans for factor analysis and plotting factor scores on the 2360300-2360200N cross-section. Also, attempts will be made to identify the location of anomalous gold, mercury, arsenic and other elements associated with the Carlin-type mineralization in visually unaltered rocks, using petrography, SEM work, and possibly LAICPMS analyses of carbonate veins.
PYRITE CHEMISTRY
Introduction
Primary Au in Carlin-type deposits occurs in trace element-rich pyrite in ore-stage rims on earlier-formed pyrite cores. Auriferous pyrite at Getchell was first described by Joralemon (1951) who recognized tiny particles (0.3 µm) of visible gold in the outer margins of pyrite grains and correctly hypothesized that the greatest amount of gold in the deposit was submicroscopic, or as “solid solution”, in pyrite. More than twenty years later, the term ore-stage pyrite was defined as pyrites with gold present in arsenic-rich rims on gold- and arsenic-free cores (Wells and Mullins, 1973; Arehart et al., 1993; Cline et al., 1997). Two types of ore-stage pyrites were observed (Cline and Hostra, 2000; Cline, 2001; Cline et al., 2003):
1. Core-rim (CR) pyrites with 5-35µm-size trace element-rich rims on earlier-
formed syngenetic, diagenetic, and hydrothermal pyrites,
2. Fuzzy pyrites are small 1-4µm-size spheroidal-shaped pyrites with fuzzy rims.
23
Detailed trace element chemistry of these two types suggested that ore fluids evolved chemically in time and space (Cline, 2001; Weaver 2001; Henklemen 2004; Lubben 2004; Longo et al., 2007). Variations in core to rim chemistry were interpreted to reflect temporal and spatial evolution in ore fluid composition related to changing fluid flow paths within the deposit (Longo et al., 2008). Multiple rims with variable chemistries in ore-stage pyrites recorded an evolving ore fluid through time and the chemistry indicates a chemical paragenesis (Cline, 2001; Weaver, 2001; Cline, 2003; Longo et al., 2008). Building on these earlier observations, the current study addresses the following research questions:
1. Are the world-class Carlin-type Au deposits the result of one evolving ore-stage
fluid or multiple ore fluid events over time?
2. Can we track the fluid flow paths of the ore-stage fluid(s) through the deposit
using trace element chemistry from ore-stage pyrites?
3. Do ore-stage pyrites in the high-grade gold ore have distinct trace element
signatures reflecting special deposition processes?
4. What contributes to high grade Au ore? When and where? Structure? Lithology?
Is the chemistry related to the magmatic processes?
In this study, pyrites from three ore zones in the Turquoise Ridge deposit were examined using a JEOL JXA-8900 electron microprobe with a 1µm beam diameter. We observed that ore pyrite compositions display distinct patterns in As, Au, Hg, Tl, Sb, Te, Cu, Zn, ± Sn that are characteristic of various parts of the deposit. Pyrite zoning is visible in back scatter electron mode where increasing brightness reflects increased trace element enrichment. In general, trace elements are enriched in the outer core (OC), increase through the inner rim (IR), and increase or decrease through the outer rim (OR). These patterns indicate that ore pyrite chemistries did record trace element variations in the ore fluid in time and space, permitting tracking of ore fluid flow across the deposits. Pyrites from three separate zones in the Turquoise Ridge deposit at Getchell (Figs. 55 and 56) were analyzed using a JEOL electron probe microanalyzer JXA-8900 (EPMA) at the University of Nevada-Las Vegas operated with the following probe conditions: 1) accelerating voltage = 20kV, 2) beam current = 5nA (5.0E-08A), and 3) a beam diameter of 1µm. A suite of major and trace elements designed to identify chemical patterns in Carlin-type Au deposits at Getchell were used in the analyses and measured simultaneously using four wavelength dispersive (WDS) X-ray spectrometers as specified in Table 2. Total time is ~ 32 minutes/spot analysis using the format for the Getchell suite of elements in Table 2. If gold is measured using the LIF-H analysis then times increase to ~50 minutes/spot analysis (discussed below). The lengthy analysis times are due to the extended counting times required to achieve low detection limits on gold. Analysis times are shorter with the PET-H format because Au is simultaneously analyzed with 13 other elements (Table 2).
24
Standards include pure metals CM1 standards for Ag, Bi, Sb, Se, Sn, W; CM2 metal complexes for HgS, TlBr, ZnTe; pure metal Geller standards for Au, Co, Mo, Ni; MAC sulfide standards for Arsenic, Chalcocite, Chalcopyrite, Pyrite, Galena, Sphalerite; and SMH standards for Ilmenite, and Plagioclase. The MAC pyrite, Geller Au, and ASBell glass standards were run as unknowns using our Getchell element suite and EPMA measurement order (Table 2). Analyses from the glass standard were within acceptable limits. Both the Geller Au and MAC pyrite showed elevated Au and Co. The Geller Au standard delivered 119.7wt% Au and 60 ppm Co, and the MAC1 pyrite 80 ppm Au and 610 ppm Co. MAC1 pyrite also had anomalous Cu to 390 ppm and Si to 140 ppm (Fig. 55; comparisons to MAC pyrite). Experimental results for the MAC1 pyrite report 500 ppm Cu and 1000 ppm Co, but do not indicate that there is any anomalous gold. Geller Au and MAC pyrite standards were also analyzed as unknowns using the LIF-H configuration. Peak overlaps were studied for each element using documented peak positions for the wavelengths from the characteristic x-rays in each line K, L, M. The differences in peak positions for the characteristic wavelengths in each line were recorded for the peak overlap in each element pair. Those with differences < ±0.3 were considered problematic and the background positions were adjusted accordingly and input as peak search criteria. Probe conditions used by the University of Maryland and calibrations for the proper peak positions of Cu, Ag, Au, Mo, and W in sulfides were adjusted for the UNLV electronprobe microanalyses (Table 3). Potential problems in peak overlaps were considered for W-Se, W-Bi, W-Hg, Au-W, Te-W, Hg-Sn, Se-Mo. For the Hg-Sn overlap the Hg PHA settings were optimized and the differential mode window set to exclude Sn. A minor peak interference was observed with W-Se and Au-W on the LIF-H. Peak positions were optimized for Au in pyrite using both the PET-H and LIF-H configurations. In a Getchell ore-stage pyrite, the PET-H peak position for Au is 186.20 mm and at low concentrations can interfere with the broad peak for Fe whose position is 185.20 mm. Fe-peak interference may explain the low concentrations of gold (70-120 ppm) in the MAC pyrite when using the PET-H configuration. The LIF-H peak position for Au is 88.65 mm with no interference from other peak positions, and no gold is detected when MAC pyrite is analyzed as an unknown; however, analysis times increase by 20 minutes/spot. Due to time constraints Au analyses with PET-H are preferred, and for every 10-20 analyses, a MAC-1 pyrite standard was analyzed as an unknown. A correction was applied by subtracting the Au value of the MAC pyrite from the neighboring unknowns surrounding the standard (ie. 5 before and 5 after if a MAC pyrite is analyzed every 10 analyses). A typical EPMA traverse across a CR pyrite grain is from core to rim with spot analyses every ~5µm in the core and every ~2µm at the rim. Analyses of fuzzy pyrites depend on the grain size that ranges from ~1-4µm (rare >10µm) and generally are 1 to 3 spot analyses from core to rim. Coordinates for core analyses with 5µm spacings are set and run on automated mode analyzed overnight, whereas, spots for rim analyses are selected and run manually to assure accuracy. EPMA analyses with totals between 96% and 103% are reported in this study. Pyrite totals above 103% include ~2% of the data and those below 96% include ~20% of the data collected to date.
25
Results: Petrography
Reflected plane-polarized light petrography is very useful in identifying the presence of the spheroidal fuzzy pyrites, and ore-stage pyrite rims around trace-element poor pyrite cores (Figs. 57 and 58). Rims that are 1-2 µm wide are readily visible with high power objectives (40 and 100X), and rims ≥2µm can sometimes be recognized with lower power (10X). Properties such as hardness, reflectance, and color of ore-stage rims and fuzzy pyrites are distinct and contrast with earlier stages of pyrite. Spheroidal pyrites with fuzzy rims generally display reflectance patterns that appear bright in contrast to the surrounding matrix. Variable degrees in hardness between rims and cores produce differences in the polished surfaces that are discernable in reflected plane-polarized light. Hardness of the trace-element poor pyrite cores is homogeneous in contrast to rims that are generally inhomogeneous in terms of hardness and color. Variations in reflectance and color related to inhomogeneities in polishing hardnesses in ore-stage pyrite produce distinct textures. Some rims are brighter yellow than the cores, others appear dull, and some display bright and dull zonation related to the multi-zoned rims in contrast to cores.
Results: Electron Probe Microanalyses (EMPA)
Microprobe analyses for this study began in May 2007 at the University of Nevada Las Vegas (UNLV) Electron Microanalysis and Imaging Laboratory. Currently we are analyzing pyrites from two cross sections (2360300N and 2360000N) through the Turquoise Ridge deposit (TR) at Getchell. A total of 603 EMPA spot analyses on 107 separate pyrites from nine different samples have been completed to date. The nine samples test three discrete mineralized zones, the 148 Zone, Better Be There (BBT) and High Grade Bullion (HGB), at different elevations and Au grades within the TR deposit (Figs. 55 and 56). Many varieties of trace element rich pyrite have been observed in both reflected plane-polarized light and EPMA backscatter electron images (BEI). Ore-stage pyrites have been observed with both multistage rims and single-stage rims called core-rim (CR) pyrites (grain size varies from 25µm to 0.25mm) and smaller spheroidal fuzzy and “spoked” pyrite with a radial texture (grain size of 1-5µm, rarely >10µm). Multistage rims are >5-30 µm wide, are typical of high-grade ore, and display diverse trace element compositions across the rim (Fig. 59). Single-stage rims are 1-5 µm wide, are more typical of low-grade gold ore, and have similar trace element chemistry throughout the rim. Spheroidal pyrites occur with both high and low grade gold, but most commonly present with higher grades. Each of the nine samples is described below for three zones in the Turquoise Ridge gold deposit, and the locations are shown on Figures 55 and 56. Sample labels reflect drill hole number and footage and samples are described from deepest to shallowest within each zone.
148 zone
TU00791 354 feet – 2740’ level, Section 60300N: Silicified carbonaceous black limestone and mudstone was collected at the 2740 foot level ~725’ below Powder Hill limestone in a zone assaying 2.9 oz/t Au from a deep extension north of the 148 zone.
26
The sample is hanging wall to the Dacite Dike and ~300’ north of 148 Zone at 68975E and ~700 feet east of the HGB (Figs. 1 and 2). No core-rim pyrites were found in this sample, and only a few spheroidal fuzzy pyrites were observed in backscatter mode. The fuzzy pyrites were anomalous in As >1000 to >10,000 ppm, trace elements Hg-Sb±Cu±Tl that have concentrations between 100-1000 ppm, and Au-Tl-Cu-Te >100 ppm (Fig. 60). TU00664 211.5 feet – 3298’ level, Section 60000N: Moderate to high-grade gold ore (2.272 oz/t Au) in the 148 zone was sampled at the 3298 foot level in the 148 zone (Figs. 55 and 56). The rock is a highly deformed, thin laminated, silty and muddy carbonate crosscut by pre-ore quartz veins and late chalcedony filling cavities. The mudstone shows crenulation cleavage defined by biotite in S1 foliations and S2 cleavage planes. Siliceous laminae of mosaic- and jigsaw-patterned quartz, typical of jasperoidal quartz, are interlayered with laminae of decalcified siltstone. Siliceous laminae and older pre-ore quartz were recrystallized and are not jasperoidal. Ore-stage pyrites found in decalcified muddy limestones display a moderately bright core with 10-25µm rims zoned from an inner dull to a bright lace- and spoke-textured outer rim, and spheroidal pyrites are also lace- and spoke-textured (Fig. 61). EPMA traverses from core to rim show elevated As >10,000 ppm and Au >1000 ppm from the inner rim (IR) that decrease through the outer rim (OR) with Au <1000 ppm (Figs. 61, 62, 63 and 64). Cu and Te also decrease from the inner rim through the outer rim, and Hg, Sb, and Si ±Zn are anomalous in the rims >100ppm but <1000 ppm (Figs. 62 and 63). Analyses show that As concentrations are highest with Au in the 148 Zone in comparison with other zones at Turquoise Ridge, and Tl is absent. TU00664 219.8 feet – 3304’ level, Section 60000N: High-grade gold ore with 1.213 oz/t Au was collected in thin bedded to laminated silty and muddy carbonate at the 3304 foot level in the 148 zone (Fig. 55). Laminae are made up of alternating rhythmically bedded decalcified and siliceous mudstones. Silty mudstones are decalcified and contain fine sooty spheroidal fuzzy pyrites. Only small fuzzy pyrites were found with trace element anomalies in Au to 600 ppm, As to 22 wt.%, Hg to 4,000 ppm, Sb to 500 ppm, and Cu to 1500 ppm, and both cores and rims were anomalous. Arsenic concentrations from this sample are the highest recorded for fuzzy pyrites (up to 22 wt.%), and as observed in sample TU00664 211ft, thallium is absent. Ore-stage pyrites, in another sample in this interval that predates this study, display the largest multistage rims observed to date and have an outer bright core with 35µm rims zoned from inner dull to middle bright to outer dull (Cline et al., 2003; and Longo et al. 2008). Pyrites with large multistage rims were not found from similar samples used in this study. Nine pyrites have been analyzed to date, and more work is required on samples from this interval. TU00699 235.5 feet- 3500’ level, Section 60300N: This sample was collected to test the upper levels of the Turquoise Ridge deposit interpreted to extend into the overlying basalt section. The 3500-foot level is the highest level in the deposit analyzed in this study. The sample is silicified basalt with quartz veins in a zone with 0.125 oz/t Au that lies ~750’ above sample TU00791 and ~400 feet above the level of the HGB zone. Some anhedral (resorbed) pyrites have inclusions of sphalerite (Fig. 65) and display a distinct
27
geochemistry elevated in Zn, Cu, W, Co and Ni and depleted in As, Hg, Tl, and Sb (Fig. 60). EPMA analyses found trace Au to 50 ppm, Zn to 58 wt.%, Co to 850 ppm, Ni to 340 ppm, and Ag to 150 ppm. Trace elements As, Hg, Tl, and Sb characteristic of Carlin deposits are <0.10 wt.% or not detectable. The composition suggests a very different geochemical signature, unlike pyrites characteristic of Carlin deposits. These pyrites are likely related to quartz veins found in basalts higher in the stratigraphic section at Turquoise Ridge and Getchell. These pyrite textures are distinctive and have not been observed in other examined samples (Figs. 65, 66 and 67).
High Grade Bullion (HGB) Zone – High Grade
TU00936 881 feet- 3100’ level, Section 60300N: High grade ore (5.68 oz/t Au) in silicified and decalcified tuffaceous muddy limestone and mudstone was collected near the 3100 foot level in the High Grade Bullion (HGB) zone. Two types of ore-stage pyrites are present in this zone: 1) multistage core-rim pyrites and 2) spheroidal fuzzy pyrites. HGB core-rim pyrites in matrix jasperoidal quartz display an outer dull core with 10µm rims zoned from inner bright to middle dull to outer bright fuzzy rims (Figs. 59 and 69). Trace element concentrations increase dramatically in the rims relative to cores. Inner rims show increased As, Au, Cu, and Sb that decrease in the middle rims, and increase again in outer rims with As>10,000 ppm, Au>1,000 ppm, Hg>1,000 ppm, Tl>1,000 ppm, and decreased Cu and Te (Figs. 68 and 70). Pyrite cores at HGB represent early diagenitic pyrite with low trace element concentrations generally <0.01 wt.%. Fuzzy pyrites (Fp) from HGB in decalcified limestone, jasperoidal quartz, fractured Mesozoic intrusion-related vein quartz, and realgar show anomalous Au (>1,000 ppm) throughout from core to rim (Fig. 71). They display erratic bright and dull patchy zones and lack distinct rims (Figs. 59 and 72). Fuzzy pyrites in realgar are depleted in Sb-Tl-Hg, but enriched in Sn. Fuzzy pyrites in decalcified rocks are depleted in Cu-Sb, but enriched in Tl-Hg-Te relative to fuzzy pyrite in silica (Fig. 72). 00NZ188 2310 feet- 3175’ level, Section 60300N: Low grade gold (0.10 oz/t Au) is associated with ore-stage rims around pyrite veinlets in argillized (illitic) dacite dike rocks. Late realgar-filled fractures and surrounds the ore-stage rims. The sample was collected ~400 feet west of the HGB deposit near the 3175 foot level. Pyrite veinlets in this sample have very narrow single-stage rims <1µm in width; none-the-less, the rims show elevated concentrations of As >1,000 to 10 wt. %, Hg > 1,000 ppm, and Au-Sb-Tl all >100 ppm (Fig. 60).
Better Be There (BBT) Zone – Low Grade
TU00929 894 feet- 3153’ level, Section 60300N: Moderate to low-grade gold (0.39 oz/t Au) in acicular pyrites is found in carbonaceous limestone footwall to the dacite dike at Turquoise Ridge. The thin section reveals that limestone was silicified with jasperoidal quartz and later brecciated to a fine crackle-like breccia. Trace element rich, acicular to glomero-acicular pyrites are found in the jasperoidal quartz (Fig. 58). Large cellular, spongy and euhedral pyrites are not in quartz but in open spaces, some with late realgar. The sample is from the 3153’ level in the footwall of the BBT zone. The acicular and glomero-acicular pyrites are compositionally homogeneous from core to rim with anomalous trace elements as follows: As>1 wt%, Au>1,000 ppm, Hg>1,000 ppm, Cu and
28
Tl are variable from near ~800 ppm to >1,000 ppm, Au, Te and Sb are >100 ppm (Fig. 73). TU00929 761 feet- 3250’ level, Section 60300N: Low-grade gold (0.06 oz/t Au) is associated with core-rim pyrite veinlets partially rimmed by late realgar in fractures of argillized (illitic) dacite dike rocks near the 3250’ level. Pyrite veinlets are symmetrically zoned from massive cores to spongy zones to massive dull pyrite completely rimmed by single-stage, 1-2 µm bright fuzzy pyrite (Fig. 74). The rims display a dramatic increase in Tl, Hg, Sb, Au, Te, Cu in contrast to the massive and spongy cores. Rims are anomalous in As>10 wt.%, Au>1,000 ppm, Tl>1,000 ppm, Hg>1,000 ppm, Cu>1,000 ppm, and Sb and Te ~1,000 ppm (Figs. 75 and 76). Barren pyrite also replaced titaniferous magnetite disseminated in the matrix of the dacite and is anomalous in titanium (1-2 wt %). 99NZ022 2120.5 feet- 3396’ level, Section 60300N: Low grade gold (0.087 oz/t Au) in the hanging wall to the argillized dacite dike is associated with core-rim and spheroidal fuzzy pyrites in a calcite vein at the 3396’ level. Ore stage pyrites in calcite include single-stage, core-rim pyrites with fuzzy rims (<10 um) on large homogeneous pyrite cores, and small (5-10 um) fuzzy pyrites (Figs. 57D and 77). The rims are anomalous in As near 10 wt.%, Cu and Hg >1,000 ppm, Te near 1,000 ppm, Au and Sb >100 ppm, and Tl below detection (Fig. 78).
Trace Element Variation Diagrams
The trace element variation diagrams in Figures 79 and 80 compare all the pyrite EPMA analyses in this study for Au versus As-Hg-Tl-Sb-Cu-Te. In general, As, Hg, Tl, and Sb all increase with increasing Au. Spheroidal fuzzy pyrites and multistage CR pyrite generally display higher concentrations of gold and arsenic. The core-rim (CR) pyrites from HGB, 148 and the BBT dike have the highest concentrations of arsenic with highest gold. The BBT dike and HGB fuzzy pyrites show the highest concentrations of mercury and thallium with the highest gold, and also the highest antimony with elevated gold. CR pyrites from the 148 zone are low in mercury and lack thallium, and CR pyrites from both HGB and 148 have low antimony concentrations. Concentrations of copper and tellurium also increase with increasing gold. Highest concentrations of Cu with highest Au are characteristic for all pyrites but most pronounced in the BBT dike. The BBT dike and HGB fuzzy pyrites show the highest concentrations of Te with highest Au, and the HGB CR pyrites show highest Te with lower Au. Inner to outer rim variations in trace element patterns were recorded in the multistage core-rim (CR) pyrites and different types of fuzzy pyrites from the HGB zone (Fig. 72). Inner rims have high concentrations of arsenic up to ~15 wt.% with lower gold than the outer rims and the fuzzy pyrites. Middle rims have less arsenic (1-6 wt.%) with the lowest gold concentrations. Concentrations of mercury are anomalous in inner and middle rims of CR pyrites relative to core analyses, but lower than the outer rims. Outer rims at HGB have highest arsenic and mercury with highest gold relative to inner rims. Thallium concentrations in fuzzy pyrites and CR pyrites follow similar trends to mercury, but CR pyrites at HGB tend to have lower thallium (Figs. 72 and 79). In contrast,
29
concentrations of thallium are distinctly higher for the outer rims of the CR vein in the BBT dike with highest mercury and gold (Figs. 72 and 79). Fuzzy pyrites are anomalous in As, Au, Hg, Tl, Sb, Cu and Te throughout core to rim, and tend to show higher concentrations of mercury relative to CR pyrites (Fig. 72). Cores of fuzzy pyrite in silica display the highest mercury concentrations in the analyses to date (>1.2 wt. %). Fuzzy pyrites in realgar also trend toward higher concentrations of gold and mercury than CR pyrites, and lower in mercury than fuzzy pyrites in silica (Fig. 72).
Discussion
The following interpretations are supported by the current results. Ore-stage pyrites display patterns in trace element compositions from core to rim distinct to each zone within the greater Turquoise Ridge gold deposit (Tables 4 and 5). In all cases arsenic is greater than gold when gold is present in cores and rims. Gold concentrations in CR pyrites from the 148 zone increase toward the outer margins of the inner grayish rim with arsenic, copper, tellurium and mercury, and decrease in the outer-most rim with mercury and locally with As, and the highest gold concentrations (>1000 ppm) precipitated in the early inner rim with highest Cu and Te. At HGB, gold concentrations increase with As, Hg, Cu and Te in the inner bright rim, then decrease in the middle dull rim, and increase again with As, Hg and Tl in the outer bright rim; the highest gold concentrations (>1500 ppm) precipitated early with As, Cu and Te in the inner rim, and late with the highest Tl and Hg in the outer rim (Fig. 68, Tables 4 and 5). Concentrations of Au in spheroidal fuzzy pyrites at HGB are elevated in both cores and rims (Au >1000-3500 ppm), and highest gold is generally with highest As, Hg and Tl. Ore stage rims in the BBT zone are single-stage and Au increases in the rim with As, Hg and Tl. The highest Au precipitates with high Hg and Tl (Fig. 73, Tables 4 and 5). Trace element compositions from the outer rim at 148 are similar to the inner and middle rims of HGB, and the outer rim compositions at HGB are similar to the rims at BBT (Fig. 81 and Table 6). Furthermore, fuzzy pyrites at HGB are most similar to the outer rims of the multi-stage CR pyrites (Fig. 82). The multiple rims in core-rim pyrites indicate a chemical paragenesis that developed from an evolving fluid through time and space. Early fluids precipitated elevated Au, As, Hg, Cu, and Te within the inner rims at 148 and HGB (Table 6). Subsequently, later or evolved fluids precipitated decreased Au, Cu, Te, Hg±As and increased Sb in core-rim pyrites at 148 and HGB. Latest evolved fluids precipitated increased Au, As, Hg and Tl in the outer rims at HGB and in single-staged rims at BBT and also precipitated fuzzy pyrites. Multistage rims around pyrite cores from the 148 zone may provide some insight to their origin (Fig. 83). The pyrite core has a reflectivity similar to syn- and diagenetic pyrite and is interpreted as a remnant of the original host pyrite (Fig. 56A). Cores are surrounded by a grayish inner rim with trace element concentrations ≤100 ppm, with the
30
exception of elevated As >1,000 ppm (Figs. 62, 63 and 83). In plane polarized reflective light the inner rim is bright and cannot be distinguished from the outer rim (Figs. 57A and B). The inner grayish rim maintains the original pyrite morphology and may represent an early thermal reaction rim formed in response to reaction between the early pyrite core and the ore fluids. Chemical patterns observed between core and inner rim (Figs. 62 and 63), although near the detection limits may reflect chemical diffusivity of trace elements into and out of the original pyrite grain. The outer rim displays lace and spoke textures interpreted to be a growth rim deposited by the ore fluids.
Preliminary Conclusions
Trace element chemistry in ore fluids evolved in time and space across the Turquoise Ridge Deposit from SE and NW (Fig. 84 and Table 6). Conduits for ore fluids included the Getchell Fault and dacite dike (Figs. 55 and 56). Trace element-rich inner rims of core-rim pyrites formed from early fluids that precipitated high Au with highest As, Cu and Te in the 148 and HGB ore zones. Evolved ore fluids subsequently precipitated lower Au in the outer rims of core-rim pyrites in the 148 Zone, and as middle rims of multi-stage core-rim pyrites in the HGB zone. Ore fluids continued to evolve and precipitated high Au with Sb, Hg, and Tl in (a) single-stage rims on pyrite veinlets in the dacite dike at the BBT zone, (b) acicular pyrites in the dike footwall at the BBT zone, (c) single-stage rims around core-rim pyrites in a calcite vein from the dike hanging wall at the BBT zone, (d) outer rims of multi-stage core-rim pyrites at HGB, and (e) as fuzzy pyrites at HGB. These most evolved ore fluids were the first ore fluids to access the BBT zone, and appear to have been isolated from the 148 zone, perhaps owing to mineral precipitation and sealing of former fluid pathways. The HGB zone, which is the highest-grade ore zone evaluated in this section, appears to have benefitted from more protracted ore fluid access and ore deposition, suggesting that at least some high-grade ore formed in response to a lengthier period of ore flux and precipitation.
ACKNOWLEDGEMENTS We would like to thank and acknowledge the US Geological Survey for funding to conduct this study. We also want to express our appreciation to Simon Poulson and Greg Arehart, UNR, respectively, for their assistance collecting the carbon and oxygen isotope data, and interpreting those data. We are particularly indebted to the many geologists who have worked at the Getchell Deposit over the years (FirstMiss Gold, Getchell Gold, Placer Dome, and Barrick Gold) and who have generously shared their time, observations and ideas about these deposits.
31
REFERENCES Arehart, G.B., Chryssoulis, S.L., and Kesler, S.E., 1993, Gold and arsenic in iron sulfides
from sediment-hosted disseminated gold deposits: Implications for depositional processes: Economic Geology, v. 88, p. 171-185.
Arehart, G.B., 1996, Characteristics and origin of sediment-hosted disseminated gold deposits: a review: Ore Geology Reviews, vol.11, no. 6, pp 383-403 (21)
Arehart, G.B., Donelick, R.A., 2006, Thermal and isotopic profiling of the Pipeline hydrothermal system: Application to exploration for Carlin-type gold deposits: Journal of Geochemical Exploration, vol. 91, issues 1-3, pp 27-40
Boskie, R. M., 2001, Detailed structure and stratigraphy of the lower Paleozoic rocks of the Getchell trend, Osgood Mountains, Humboldt County, Nevada: unpublished MS thesis, University of Nevada Reno, 171 p.
Cail, T. and Cline, J.S., 2001, Alteration associated with gold mineralization at the Getchell Carlin-type gold deposit, Northern Nevada, USA: Economic Geology, v. 96, p. 1343-1359.
Cline, J.S., 2001, Timing of gold and arsenic sulfide mineral deposition at the Getchell Carlin-type gold deposit, North-central Nevada: Economic Geology, v. 96, p. 75-90.
Cline, J.S., Hofstra, A.H., Muntean, J.L., Tosdal, R. M., and Hickey, K.A., 2005, Carlin-type gold deposits in Nevada: Critical geologic characteristics and viable Models, in Hedenquist, J.W., Thompson, J.F.H., Goldfarb, R.J., and Richards, J.P., eds., 100th Anniversary Volume: Society of Economic Geologists, Littleton, CO, p. 451-484.
Cline, J.S., Hofstra, A., Landis, G., and Rye, R., 1997, Ore Fluids at the Getchell, Carlin-Type Gold Deposit, North-Central Nevada, in, Vikre, P., Thompson, T.B., Bettles, K., Christensen, O., and Parratt, R., eds., Carlin-Type Gold Deposits Field Conference: Society of Economic Geologists Guidebook Series, Vol. 28, p. 155-166.
Cline, J.S., Hofstra, A.A., 2000, Ore-fluid evolution at the Getchell Carlin-type gold deposit, Nevada, USA,European Journal of Mineralogy, Feb 2000; 12: 195 - 212.
Cline, J.S., Shields, D., Riciputi, L., Fayek, M., Copp, T., Muntean, J., and Hofstra, A.H., 2003, Trace element and isotope microanalyses support a deep ore fluid source at the Getchell Carlin-type gold deposit, northern Nevada: Geological Society of America Abstracts with Programs, v. 35 , p. 358.
Cook, H. E. and Taylor, M. E., 1977, Comparison of continental slope and shelf environments in the Upper Cambrian and lowest Ordovician of Nevada: in Cook, H. E. and Enos, P, eds. Deep-water carbonate environments: SEPM Special Publication 25, p. 51-81.
Crafford, E. J., 2000, Overview of regional geology and tectonic setting of the Osgood Mountains region, Humboldt County, Nevada: Society of Economic Geologist Guidebook Series, v. 32, p. 225-234
32
Chevillon, V., Berentsen, E.., Gingrich, M., Howald, B., Zbinden, E., 2000, Geologic overview of the Getchell gold mine geology, exploration, and ore deposits, Humboldt County, Nevada: Part II, Geology and gold deposits of the Getchell region, Crafford: Guidebook Series (Society of Economic Geologists (U.S.), v. 32, p. 195-201
Grammer, G. M., Ginsburg, R. N., Swart, P. K., McNeill, D. F., Jull, T., and Prezbindowski, D. R., 1993, Rapid growth rates of syndepositional marine aragonite cements in steep marginal slope deposits, Bahamas and Belize: Journal of sedimentary Petrology, v. 63, p. 983-989.
Grammer. G. M., Crescini, C. M., McNeill, D. F.and Taylor, L. H., 1999, Quantifying rates of syndepositional marine cementation in deeper platform environments – new insights into a fundamental process: Journal of Sedimentary Research, v. 69, p. 202-207.
Groff, J. A., Heizler, M. T., McIntosh, W. C., Norman, D. I., 1997, 40 Ar/ 39 Ar dating and mineral paragenesis for carlin-type gold deposits along the Getchell Trend, Nevada; evidence for Cretaceous and Tertiary gold mineralization: Economic Geology, v. 92, no. 5, p. 601-622
Gustafson, L.B. and Hunt, J.P., 1975, The porphyry copper deposit at El Salvador, Chile: Economic Geology, v. 70, p. 857-912.
Hall, C.M., Kesler, S.E., Simon, G., Fortuna, J., 2000, Overlapping Cretaceous and Eocene Alteration, Twin Creeks Carlin-Type Deposit, Nevada: Economic Geology, v. 95, no. 8, p. 1739-1752.
Heitt, D.G., Dunbar, W.W., 2003, Geology and Geochemistry of the Deep Star Gold Deposit, Carlin Trend, Nevada: Economic Geology; September 2003; v. 98; no. 6; p. 1107-1135; DOI:
Henkelman, C., 2004, Variations in Pyrite chemistry as clues to gold deposition at the Goldstrike system, Carlin Trend, Nevada USA: Unpub. M.Sc. thesis, University of Nevada, Las Vegas, 150 p.
Hitzman, McCaffrey, K., Lonergan, L., Wilkinson, J., 1999, Fractures, fluid flow and mineralization, London: Geological Society, no 155
Hofstra, A. H., Leventhal, J.S., Northrop, H.R., Landis, G.P., Rye, R.O., Birak, D.J., and Dahl, A.R., 1991, Genesis of sediment-hosted disseminated gold deposits by fluid mixing and sulfidization: Chemical-reaction-path modeling of ore-depositional processes documented in the Jerritt Canyon district, Nevada: Geology, v. 19, p. 36-40.
Hofstra, A.H., 1994, Geology and genesis of the Carlin-type gold deposits in Jerritt Canyon district, Nevada: Unpublished Ph.D. dissertation, Boulder, University of Colorado, 791 p.
Horton, R. C., 1999, History of the Getchell gold mine: Mining Engineering, v. 51, no. 7, p. 50-56.
Hotz, P.E., and Willden, R., 1964, Geology and mineral deposits of the Osgood Mountains quadrangle, Humboldt County, Nevada: U.S. Geological Survey Professional Paper 431, 128 p.
Joraleman, P., 1951, The occurrence of gold at the Getchell mine, Nevada, Economic Geology, v. 46, p. 276-310.
33
Lowers, Heather A., Breit, George N., Foster, Andrea L., 2005, Importance of pyrite as an arsenic sink in Bengal sediment: Geochimica et Cosmochimica Acta, v. 69
Longo, A.A., Cline, J.S., and Muntean, J., 2008, Compositional variations in Au-bearing pyrite from a Carlin-type Au deposit, Getchell, Nevada: Geological Society of America Abstracts with Programs, V. 40, no. 1, p. 51.
Lubben, J., 2004, Quartz as clues to paragenesis and fluid properties at the Betze-Post deposit, northern Carlin trend, Nevada: Unpub. M.Sc. thesis, University of Nevada, Las Vegas, 155 p.
Madden-McGuire, D.J., and Marsh, S.P., 1991, Lower Paleozoic host rocks in the Getchell gold belt; several distinct allochthons or a sequence of continuous sedimentation?: Geology, v. 19, p. 489-492.
Madrid, R. J. J., 1987, Stratigraphy of the Roberts Mountains allochthon in north-central Nevada: unpublished PhD thesis, Stanford University, 341 p.
Maltman, A. J., 1977, Some microstructures of experimentally deformed argillaceous sediments: Tectonophysics, v. 39, p. 417-436.
Maltman, A., 1984, On the term ‘soft-sediment deformation’: Journal of Structural Geology, v. 6, p. 589-592.
Marlowe, K., Wood, K. and Muntean, J., 2007, The Getchell mine complex: Seven decades of mining and geology: in Johnston, M. K. (ed.), Faults, folds, and mineral belts: regional structural systems, gold mineralization, and exploration potential in the Great Basin, Geological Society of Nevada Special Publication No. 46, p. 127-134.
McCrea, J.M., 1950, The isotope chemistry of carbonates and a paleotemperature scale: Journal of Chemical Physics 18 (1950), pp. 849–957.
Muntean, J.L., Cline, J., Johnston, M.R., Ressel, M.W., Seedorff, E., and Barton, M.D., 2004, Controversies on the origin of world-class gold deposits; Part I, Carlin-type gold deposits in Nevada: Society of Economic Geologists Newsletter, v. 59 p. 1-18.
Muntean, J. L., Coward, M. P., and Tarnocai, C. A., 2007, Reactivated Palaeozoic normal faults: controls on the formation of Carlin-type gold deposits in north-central Nevada: in Reis, A. C., Butler, R. W. H. and Graham, R. H. (eds.) “Deformation of the Continental Crust – The Legacy of Mike Coward,” Geological Society, London, Special Publications, v. 272, p. 573-589.
Muntean, J. L., 2008, Major precious metal deposits, in The Nevada mineral industry 2007: Nevada Bureau of Mines and Geology Special Publication MI-2007, p. 38-65.
Nevada Bureau of Mines and Geology, 2004, The Nevada mineral industry 2003: Nevada Bureau of Mines and Geology Special Publication MI-2003, 78 p.
Radtke, A.S., Rye, R.O., Dickson, F.W., 1980, Geology and stable isotope studies of the Carlin gold deposit, Nevada, Economic Geology; August 1980; v. 75; no. 5; p. 641-672
Rye, R.O., 1974, A Comparison of Sphalerite-Galena Sulfur Isotope Temperatures with Filling Temperatures of Fluid Inclusions: Economic Geology, vo. 69: 26 - 32
Stenger, D.P., Kesler, S.E., Peltonen, D.R and Tapper, C.J., Deposition of gold in Carlin-type deposits; the role of sulfidation and decarbonation at Twin Creeks, Nevada: Economic Geology 93 (1998), pp. 201–215.
34
35
Taylor, B. E., and O’Neil, J. R., 1977, stable isotope studies of metasomatic ca-fe-Al-Si skarns and associated metamorphic and igneous rocks, Osgood Mountains, Nevada: Contr. Mineralogy Petrology, v. 63, p. 1-49.
Taylor, W.D., and J. Berger. 1980. Microspatial heterogeneity in the distribution of ciliates in a small pond. Microb. Ecol. 6: 27 34.
Tobisch, O. T., 1984, Development of foliation and fold interference patterns produced by sedimentary processes: Geology, v. 12, p. 441-444.
Tretbar, D., Arehart, G.B., and Christensen, J.N., 2000, Dating gold deposition in a Carlin-type gold deposit using Rb/Sr methods on the mineral galkhaite: Geology, v. 28, p. 947-950.
Vazquez, R., Vennemann, T.W., Kesler, S.E. and Russell, N., 1998, Carbon and oxygen isotope halos in the host limestone, El Mochito Zn-Pb-(Ag) skarn massive sulfide-oxide deposit, Honduras: Economic Geology, v. 93, p. 15-32
Weaver, Kelli D., 2001, The geochemistry of gold-bearing and gold-free pyrite and marcasite from the Getchell gold deposit, Humboldt County,
Wells, J.D. and Mullins T.E., 1973, Gold-bearing arsenian pyrite determined by microprobe analysis, Cortez and Carlin gold mines, Nevada: Economic Geology, v. 68, p. 187-201.
Williams, P. F., Collins, A. R., and Wiltshire, R. G., 1969, Cleavage and penecontemporaneous deformation structures in sedimentary rocks: Journal of Geology, v. 77, p 415-425.;
Woodcock, N. H., 1976, Structural style in slump sheets: Ludlow Series, Powys, Wales: Journal of the Geological Society of London, v. 132, p. 399-415.
Coordinates: NAD27, Nevada State Plane West Alteration: 1=Visually unaltered 2=Very Weak - weak bleaching, strong reaction with 5% HCl 3=Weak - Moderate to strong bleaching, strong reaction with 5% HCl, very weak decalcification 4=Moderate - Weak to moderate decalcification, degraded textures, weak to moderate reaction with 5% HCl 5=Strong - moderate to strong decalcification, textures destroyed, very weak reaction with 5% HCl Trace elements: red type=half of the detection limit; blue type=minimum value - higher than method can measure
Table 2. Suite of elements and their measurement order used for the Getchell pyrite analyses. Probe Conditions: Accelerating Voltage = 20kV, Beam current = 5nA (5.0E-08A),
Beam diameter = 1mm WDS X-ray Spectrometers
Channel 1 2 3 4 1 Si 16 TAP Ag 64 PETH Fe 32 LIF Cu 16 TAP 2 As 16 TAP Hg 64 PETH Ti 32 LIF Se 16 TAP 3 Au 64 PETH Ni 32 LIF 4 Co 32 LIF 5 Zn 32 LIF 6 Sb 64 PETJ 7 S 64 PETJ 8 Sn 64 PETJ 9 W 64 PETJ 10 Te 64 PETJ 11 Bi 64 PETJ 12 Ca 64 PETJ 13 Tl 64 PETJ 14 Mo 64 PETJ 15 Pb 64 PETJ
(element-PHA gain-crystal) Table 3. Optimum peak conditions used for sulfide analyses at the University of Maryland
Element Crystal Line and λ
~peakposition +background -background
Cu LIF K α 107 +1 -2.5 Ag PET L α 146 +1.48 -0.8 Au LIF L α 88 +5 -2.9 Mo PET L β 165 +1.51 -0.84 W LIF L α 102 +0.5 -0.75
Table 4. Representative examples of the pyrite chemistry in this study.
42
Table 5. Trace element patterns core to rim from ore-stage pyrites from three zones within the Turquoise Ridge Carlin-style gold deposit. Both core-rim pyrites and fuzzy pyrites (FPy) are displayed for the HGB zone. C-core, R-rim, OC-outer core, IR-inner rim, MR-middle rim, OR-outer rim, IRi-inner portion of the inner rim, IRo-outer portion of the inner rim, ORi-inner portion of the outer rim, Oro-outer portion of the outer rim.
Table 6. Generalized trace element patterns through the rim in ore-stage core-rim pyrites at Turquoise Ridge. Pyrite chemistry is displayed as Au-As-Hg-Tl compositions from the inner rim (IR) to the outer rim (OR) and represents precipitation of Au, As, Hg, Tl from an evolving ore fluid through time; hence, IR represents early fluids and OR late fluids. High grade is >5 opt Au, Moderate grades are 1-2 opt Au, Low grades are generally considered <0.5 opt Au. HGB-High Grade Bullion Zone, 148-148 Zone, BBT-Better-Be-There Zone.
FIGURES
Figure 1. Simplified geology map of the Getchell district (modified from Hotz and Wilden, 1964 and unpublished Placer Dome
data). Box indicates area of focus for the project. Inset shows location of district relative to state of Nevada. Paleozoic normal faults are interpreted to be linked to basement faults at depth (Muntean et al., 2007). The contact aureole is the boundary of visible calc-silicates on the surface or in drill holes. The gold deposits are open pits or surface projections or underground deposits.
46
Figure 2. Schematic east-west geologic cross-section across the Getchell fault. Stippled positions are typical positions of ore bodies.
Figure 3. Map showing locations of cross-sections through Turquoise Ridge discussed in text. The section labeled “stratigraphic cross-section” is the location of the section in Figure 4. The sections labeled 2360300N and 2360200N are detailed 1:600 scale sections discussed in text. The section labeled “seismic section” is the location of the section in Figure 20. Blue box is area of 1:600 scale east-west cross-sections that were constructed on 50 foot spacings, mainly for modeling lithologic packages. The red outlines are the mined out Getchell open pits. The underlay is an unpublished geologic map compiled by Placer Dome in 2001 based mainly on mapping completed by Placer Dome geologists.
Figure 4. North-south cross-section (867600E) through the north part of Turquoise Ridge illustrating the stratigraphic framework of the deposits. See Figure 3 for location of section and see text for discussion. The heavier black line labeled “RMT?” marks the probable location of the Roberts Mountain thrust, if present. The cross-section is based on surface core holes (not shown) spaced about 30 meters apart.
48
Figure 5. North-south cross-section through Turquoise Ridge constructed by Placer Dome Exploration. Shows downhole inorganic carbon assays. Location of cross-section is similar to one in Figure 4. Unit highlighted in blue is the lowermost carbonaceous mudstones and limestones shown in Figure 2.
49
Figure 6. A. East-west cross-section 2360300N from underground Turquoise Ridge deposit showing detailed downhole geology. B. East-west cross-section 2360300N from underground Turquoise Ridge deposit showing interpreted geology. The top of the section is approximately 1,500 feet below the surface; the bottom 3,000 feet.
50
Figure. 7. Photographs of drill core from the lower carbonaceous mudstone and limestone unit at Turquoise Ridge. A. Finely laminated, dark gray, non-calcareous, carbonaceous mudstone and gray calcareous mudstone with cm-scale beds of gray recrystallized micrite. Likely precursor to much of the sedimentary breccia unit. Hole TU1023-732ft. B. Lower carbonaceous mudstone and limestone unit. Graded beds of calcarenite and variably calcareous mudstone (CA) overlying calcareous mudstone (CM) and siliceous mudstone (SM) with black carbonaceous laminae. Hole 00NZ135-2710.5 ft.
51
Figure 8. Examples of the sedimentary breccia unit from Turquoise Ridge. A. Gray micrite beds from the lower part of the sedimentary breccia unit that have been stretched into disc-shaped boudins. The boudins are interpreted to be parallel to primary bedding and to have formed be stretching of more competent limestone layers during compaction and slumping of the carbonaceous mudstone and limestone unit before it was completely lithified. Drill core from hole 00NZ158 at depths of 2804.5 to 2810 feet. B. Breccia from the lower part of the sedimentary breccia unit consisting of subangular to subrounded fragments of gray micrite supported by non-calcareous carbonaceous mudstone. Drill core from hole 99NZ023 at depths of 2618 to 2624 feet. C. Example of fine-grained, shear-textured breccia that originated from a thin-bedded interlayered sequence of carbonaceous mudstone and limestone. Original bedding is marked by stretched boudins of gray micrite, supported by non-calcareous, carbonaceous mudstone. Hole TU00929 448.8 feet, in the upper part of the sedimentary breccia unit.
52
Figure 8. Examples of the sedimentary breccia unit from Turquoise Ridge.D. Example of fine-grained, shear-textured breccia characterized by cm-sized, subangular fragments of gray micrite supported by non-calcareous black mudstone. Underground sample. E. Thin section of sample shown in D. Note the foliation in the muddy matrix, which is accentuated by carbonaceous material. Also note the truncation of calcite veins at the fragment margins, suggesting the limestone fragments were sufficiently lithified prior to brecciation.
53
Figure 9. – More detailed interpretation of sedimentary breccia unit in the eastern part of Figure 6. Note the complicated geometries of the fine-grained, shear-textured breccias (black stippled unit) that do not suggest planar mylonitic fault zones.
54
Figure 10. Examples of the non-carbonacous limestone/tuffaceous mudstone unit that overlies the sedimentary breccia unit at Turquoise Ridge. A. Brown tuffaceous mudstone that has been metamorphosed to a biotite hornfels. In thin section, the biotite occurs as unoriented grains that formed during contact metamorphism associated with the emplacement of the Osgood stock. Sample shows faint wavy laminations. Commonly is massive and featureless. Coin: 17.5 mm. B. Example of gray micrite interbedded with biotite hornfels. Locally known as the Powder Hill limestone. Coin: 17.5 mm. C. Ductily deformed Powder Hill limestone. Hole TU01061 731-737.5 feet. D. Ductily deformed Powder Hill limestone. Hole 00NZ144 1925-1929 feet. E. Ductile fold in Powder Hill limestone, whose upper limb is marked by tight folding which grades into fine-grained shear-textured breccia. Hole TU00915 495-502 feet.
55
Figure 10. Examples of the non-carbonacous limestone/tuffaceous mudstone unit that overlies the sedimentary breccia unit at Turquoise Ridge. F. Interpreted slump fold in carbonaceous limestones and mudstones in the footwall of the Getchell fault. West highwall of the North Pit. G. Ductilely folded limestones and tuffaceous(?) mudstones with several different orientation of fold axes. Interpreted to be the result of soft sediment deformation. Anderson Canyon, located west of the Osgood stock.
56
Figure 11. Examples of axial plane cleavage from Turquoise Ridge. A. Drill core showing folded interbedded micrite and carbonaceous mudstone. Note carbonaceous mudstone that has been injected into discordant fractures in the micrite near the hinges of the folds. Hole 99NZ009 2651 feet. B. Thin section of hinge area shown in A, which shows the mud injection features are axial plane cleavage defined by carbonaceous material and muscovite. See text for discussion on whether these folds represent tectonic or syn-depositional slump folds.
57
Figure 12. Examples of Northern Pillow Basalt from Turquoise Ridge. A. Drill core showing pillow mantled by calcite-rich inter-pillow breccia. Hole TU01300 23 feet. B. Unbroken contact between fine-grained porphyritic basalt and underlying fine-grained shear-textured sedimentary breccia. Contact is interpreted to be depositional. Hole 00NZ128 2970.5-2976.5 feet
58
Figure 13. Drill core showing main dacite porphyry dike of Cretaceous age at the north end of Turquoise Ridge. Coin: 17.5 mm.
59
Figure 14. Map showing the surface projection of the 3 main lithologic surfaces, modeled using GOCAD, that define the basin margin. The light blue surface is the top of the carbonaceous mudstone and limestone unit. The gray is the top of the sedimentary breccia unit. The green is the base of the northern pillow basalt. The white lines on the surfaces are structural contours labeled by elevation (40 foot contour intervals). The red dots on the surfaces are the drill control utilized to construct the surfaces. The GOCAD surfaces were modeled by Peter Jones. The west-northwest-trending boundaries that mark the southern limit of thick basalt and where the sedimentary breccia unit pinches out are marked as thick blue lines. The black lines are the cross-sections shown in Figure 3. The red outlines are the mined out Getchell open pits. The underlay is an unpublished geologic map compiled by Placer Dome in 2000 based mainly on mapping completed by Placer Dome geologists.
60
. Figure 15. Plan view of surfaces of the top of carbonaceous mudstone and limestone unit (left) and the top of the sedimentary breccia unit (right). The white lines on the surfaces are structural contours labeled by elevation (40 foot contour intervals). The red dots on the surfaces are the drill control utilized to construct the surfaces. See text for discussion.
61
Figure 16. Three-dimensional view in GOCAD looking west-northwest along the interpreted basin margin. Shows top carbonaceous mudstone-limestone unit (light blue), top of sedimentary breccia unit (gray) and the bottom and top of northern pillow basalt (green), and the Getchell fault (blue with structural contours, 20 foot elevation interval). The image was sliced at an easting of 868350E in order to better view the geometry of the basin margin. Note the southward pinch-out the sedimentary breccia unit. Also note the southward pinch-out of the basalt corresponds to where the breccia dips steep northward.
62
Figure 17. Schematic block diagram illustrating depositional setting of the host rocks at Turquoise Ridge. Constructed with the assistance of Tony Norman. See text for discussion.
63
Figure 18. Examples of crenulation cleavage. A. Spaced crenulation cleavage in Powder Hill limestone. Hole 00NZ135 1595feet. B. Thin section from sample in A showing crenulation cleavage defined by sub-parallel wispy planes of carbonaceous material and muscovite. C. Thin section from hole 00NZ218 showing kinking of muscovite crystals indicating the cleavage formed after the muscovite formed, demonstrating the deformation is indeed tectonic.
64
65
Figure 19. A. Approximately east-west seismic line acquired by Placer Dome Exploration across north end of Turquoise Ridge and the Getchell fault zone. See Figure 3 for location of line. The line is a migrated depth section using a simple two-layer velocity model. The Y axis represents depth in feet below an elevation of 6000 feet. B. Cross-section showing geology interpreted from drill holes (shown) and seismic line. The drill holes are projected up to 180 feet, but mostly less than 100 feet, onto the seismic section. The purple is the carbonaceous mudstone and limestone unit. “C.A. Beds” indicate upper limit of calcarenite beds. The purple units with the blue squiggles represent carbonaceous mudstone and limestone with soft sediment deformation at the base of the sedimentary breccia unit The unit with the purple circles is the sedimentary breccia with larger, unoriented fragments. The unit
with the black ovals represents the fine-grained shear-textured breccia at the top of the sedimentary breccia unit. The brown unit is dominantly tuffaceous mudstone. The light blue unit is non-carbonaceous limestone (Powder Hill limestone). The lower green unit is the northern pillow basalt. The upper green unit is dominantly basalt. The thin intervening green units are basalt flows and diabase dikes. The pink is dominantly chert. The thin orange units with the cross pattern are dacite porphyry dikes. The blue lines represent the Getchell fault zone. The black lines are form lines of bedding interpreted from the seismic line. The yellow represents decalcification and argillization, whereas the orange represents silicification and realgar. Note the breccia is thickest in synforms, suggesting the synforms are steepened channels as discussed in the text. See text for further discussion.
66
Figure 20. Map showing block model of gold grades that was constructed by Placer Dome in 2003, made by vertically summing the blocks. Red represents higher gold grades; the blue represents lower grades. The colors are the limits of the model. The dark blue lines represent the west-northwest-trending boundaries that mark the southern limits of the sedimentary breccia and the northern pillow basalt. The light blue lines are gold trends discussed in the text. HGB and 148 refer to ore zones discussed in the text. The black lines are the cross-sections shown in Figure 3. The red outlines are the mined out Getchell open pits. The underlay is an unpublished geologic map compiled by Placer Dome in 2000 based mainly on mapping completed by Placer Dome geologists.
67
68
Figure 21. Extent of GOCAD gold voxet model, which was created with the assistance of Peter Jones. Black lines outline the quadrilateral that is the limits of the model. A. Oblique from above the surface showing topography with geology draped on. B. Oblique view from below the surface showing topography with geology draped on, drill holes (red), the modeled surface (light blue) of the Getchell fault with structural contours, and the location of cross-section 2360300.
Figure 22. Plan views in GOCAD of 0.01 opt gold shells and 0.05 opt gold shells.
Figure 23. East-west slices, looking north, of the GOCAD voxet gold model at different northings. Also shown are the Getchell fault (blue surface), cross-section 2360300N (raster), and alteration zones from cross-section 2360200N (red lines).
71
Figure 24. Plan slices of the GOCAD voxet gold model at different elevations. Also shown are the Getchell fault (blue surface) and cross-sections 2360300N and 2360200N (faint white lines).
Figure 25. Slices of three-dimensional views in GOCAD showing relationship between gold mineralization and the basin margin. Blue surface is the Getchell fault; yellow surface is the top of the carbonaceous mudstone/limestone unit; and gray is the top of the sedimentary breccia unit. A. Looking along strike of the breccia margin, sliced at 869250E, showing 0.01 opt gold shells. B. Same as A but showing 0.05 opt gold shells. C. A. Looking down dip into the breccia, sliced at 2359600N, showing 0.01 opt gold shells. B. Same as A but showing 0.05 opt gold shells.
Figure 26. Plan views of the sedimentary breccia unit in GOCAD showing relationship to 0.01 opt gold shells. A. Looking straight down at top of carbonaceous mudstone/limestone unit (light blue surface). B. Looking upside down at the bottom of the carbonaceous mudstone/limestone unit. C. Looking straight down at the top of the sedimentary breccia unit (gray surface). See text for discussion.
Figure 27. East-west cross-section 2360300 from underground Turquoise Ridge deposit showing interpreted zones of moderate to strong decalcification/argillization and abundant realgar. Backdrop is interpreted geology from Figure 6B. See Figure 6A for detailed downhole geology and alteration. The top of the section is approximately 1,500 feet below the surface; the bottom 3,000 feet. See Figure 3 for location of section.
74
Figure 28. Cross-section 2360300 (same as in Figure 27) showing hand contoured gold grades on top of alteration.
Figure 29. East-west cross-section 2360200 from underground Turquoise Ridge deposit showing interpreted zones of weak decalcification/argillization moderate to strong decalcification/argillization and abundant realgar. Backdrop is interpreted geology. Deep surface holes on the west side of the cross-section are projected up to ~150 feet. The top of the section is approximately 1,500 feet below the surface; the bottom 3,000 feet. See Figure 3 for location of section.
77
Figure 30. Cross-section 2360200 (same as in Figure 29) showing hand contoured gold grades on top of alteration.
Figure 31. Combined 2360300N-2360200N cross-section with 2360300 plotted in the foreground. Blue arrows represent interpreted flow paths discussed in text.
78
Figure 32. Example of typical realgar-rich gold mineralization from hole TU00929, located on the west side of section 2360300 (Figs. 27, 28). Interval assayed 0.166 opt gold, which would be considered waste in the underground Turquoise Ridge mine.
Figure 33. Map showing the distribution of realgar at Turquoise Ridge. Contours are the sums of the thicknesses of drill intervals containing realgar in all the holes with total lengths of 500 feet or more. 804 surface holes were utilized. Backdrop is the same block model for gold shown in Figure 20. Map showing block model of gold grades See discussion in text.
80
Figure 34. GOCAD views of gold grades (colored grid) and fluid flow along the Getchell fault zone (blue surface with structural contours). A. Plan view showing proposed flow up Getchell fault and upwelling plumes discussed in test. The red lines are the locations of 2360300N and 2360200N. B. Slightly oblique view of the bottom of the Getchell fault, showing where the Getchell fault has been intercepted with drill holes (red lines).
81
Figure 35. GOCAD views illustrating Getchell fault, 0.01 opt gold shells and flow paths discussed in the text. Red lines are the moderate to strong alteration zones in 2360200N. A. Oblique view showing northeast and north-northwest-trending plumes and relationship to gold along the Getchell fault. B. View looking north-nortwest along strike of the Getchell fault showing the north-northwest plume rising off the Getchell fault.
82
Figure 36. Cox Diagram
83
Figure 37. Examples of carbonate staining from the combined 2360300N-2360200N cross-section. A. Powder Hill limestone consisting of ferroan calcite (purple stain. Note upper left corner displaying staining characteristics of the three separate stock solutions: 1) purple, 50-50 solution of alizarin red S and potassium ferricyanide, 2) blue, potassium ferricyanide solution, 3) red, alizarin red S solution. Hole 00NZ158 2237.5 ft. B. Lower carbonaceous mudstone/limestone unit showing pink stain, indicating calcite, both in the veins and the calcarenite wallrock.
84
Figure 38. Map view showing staining characteristics of carbonate wallrocks in samples chosen to represent background relative to the Carlin-type gold ore.
85
Figure 39. Combined cross-section 2360300N-2360200N (see Fig. 31) showing staining characteristics of carbonate wallrocks.
Figure 40. Combined cross-section 2360300N-2360200N (see Fig. 31) showing staining characteristics of carbonate veins.
87
-10.0
-8.0
-6.0
-4.0
-2.0
0.0
2.0
10.0 12.0 14.0 16.0 18.0 20.0 22.0
d18O
d13C
background samplesvisually unalteredvery weak to weak alterationweak to moderate alterationmoderate to strong alteration
Figure 41. Plot of δ13C versus δ18O for sampled carbonates. Data points are colored-coded by degree of alteration associated with Carlin-type gold mineralization. See Table 1 for explanation of alteration. See text for discussion.
88
Figure 42. Cumulative distribution curve for the δ18O data from sampled carbonates. Data points are colored-coded by degree of alteration associated with Carlin-type gold mineralization. See Table 1 for explanation of alteration. See text for discussion.
89
Figure 43. District map showing distribution of δ18O values of calcite from the background carbonate samples, as well as the samples along the combined 2360300-2360200N combined cross-section. The underlay is an unpublished geologic map compiled by Placer Dome in 2000 based mainly on mapping completed by Placer Dome geologists. The green dashed line is contact aureole of the Osgood stock, based on the presence of calc-silicates on the surface or in drill holes.
Figure 44. District map showing distribution of δ13C values of calcite from the background carbonate samples, as well as the samples along the combined 2360300-2360200N combined cross-section. The underlay is an unpublished geologic map compiled by Placer Dome in 2000 based mainly on mapping completed by Placer Dome geologists. The green dashed line is contact aureole of the Osgood stock, based on the presence of calc-silicates on the surface or in drill holes.
Figure 45. Combined cross-section 2360300N-2360200N (see Fig. 31) showing δ18O values of calcite from carbonate rocks. Black rings indicate visually unaltered samples.
93
Figure 46. Combined cross-section 2360300N-2360200N (see Fig. 31) showing δ13C values of calcite from carbonate rocks. Black rings indicate visually unaltered samples.
Figure 47. Plot of δ13C versus δ18O for calcite from marble, calc-silicate hornfels, and skarn. Samples are from tungsten skarn deposits adjacent to the Osgood stock. Taken directly from Taylor and O’Neil (1977). See text for discussion.
94
Figure 48. Photo of how individual limestone beds were sampled for isotopic analysis progressively away from a bleached fracture surface. Samples 00NZ158_2032.5 MT1-5. Coin: 19 mm. See Text for discussion.
96
1
10
100
1000
10000
10.0 12.0 14.0 16.0 18.0 20.0 22.0 24.0
d18O (per mil)
Au
(ppb
)
background samplesvisually unalteredvery weak to weak alterationweak to moderate alterationmoderate to strong alteration
Figure 49. Plot of gold (ppb) versus δ18O. Data points are colored-coded by degree of alteration associated with Carlin-type gold mineralization. See Table 1 for explanation of alteration. See text.
1
10
100
1000
10000
10.0 12.0 14.0 16.0 18.0 20.0 22.0 24.0
d18O (per mil)
Hg
(ppb
)
background samplesvisually unalteredvery weak to weak alterationweak to moderate alterationmoderate to strong alteration
Figure 50. Plot of mercury (ppb) versus δ18O. Data points are colored-coded by degree of alteration associated with Carlin-type gold mineralization. See Table 1 for explanation of alteration. See text.
97
1
10
100
1000
10000
10.0 12.0 14.0 16.0 18.0 20.0 22.0 24.0
d18O (per mil)
As
(ppm
)
background samplesvisually unalteredvery weak to weak alterationweak to moderate alterationmoderate to strong alteration
Figure 51. Plot of arsenic (ppm) versus δ18O. Data points are colored- coded by degree of alteration associated with Carlin-type gold mineralization. See Table 1 for explanation of alteration. See text.
98
Figure 52. Combined cross-section 2360300N-2360200N (see Fig. 31) showing gold assays of representative pieces of core from which calcite was separated for isotopic analysis. Black rings indicate visually unaltered samples. See text.
100
Figure 53. Combined cross-section 2360300N-2360200N (see Fig. 31) showing mercury concentrations of representative pieof core from which calcite was separated for isotopic analysis. Black rings indicate visually unaltered samples. See
ces text.
Figure 54. Combined cross-section 2360300N-2360200N (see Fig. 31) showing arsenic concentrations of representative pieces of core from which calcite was separated for isotopic analysis. Black rings indicate visually unaltered samples. See text.
101
Figure 55. Interpretive cross section of alteration (decalcification and argillization), gold mineralization, and realgar oriented E-W and looking north through the Turquoise Ridge deposit at 60200 to 60300N. Locations discussed in the text include the pyrite sample sites, deposit zones (148, HGB, BBT), and the proposed fluid flow paths along the Getchell Fault and Dacite Dike.
102
Figure 56. Plan view of the underground workings at Turquoise Ridge showing the locations of the pyrite samples in this study, futusample locations, proposed fluid flow paths indicating early to evolved fluids and multi- and single-stage rims.
re
103
Figure 57. Photomicrographs at 40X with reflected plane-polarized light of ore-stage pyrites.
Figure 58. Photomicrograph in reflected plane-polarized light of a glomero-acicular pyrite from the BBT footwall.
Figure 59. EPMA backscatter image of a multizoned core-rim pyrite from the HGB high grade, sample TU00936 881’ 5.68 opt Au. The grain displays three distinct rims: inner bright rim (ri), middle dull rim (rm), and outer bright fuzzy rim. Results of similar grains are presented in the line and scatter diagrams. Below the large multizoned grain is a large fuzzy pyrite. Note the inhomogeneity of the core with variable bright and dull zones throughout the fuzzy pyrite grain. This inhomogeneity may explain the variability in the core-rim results of fuzzy pyrite presented in the scatter plots (Fig. 73).
105
Figure 60. Line graph plots in log scale of pyrites anomalous in trace elements from the zones in TU00699, TU00791 and 00NZ188 compared to TU00929 BBT dike. Analyses in TU00791 represents fuzzy pyrites and pyrite veinlets, in 00NZ188 pyrite veinlets, and in TU00699 a variety of pyrite types characteristic of sample TU00699. The graph is divided into four zones (A-D) that represent the following samples: (A) 00NZ188 dacite dike HGB, (B) TU00699 quartz veins in silicified basalt at the highest level in the deposit analyzed in this study (3500’ level), (C) TU00791 2.9 opt Au from silicified limestone and mudstone in a deep extension north of the 148 zone, and (D) TU00929 dacite dike BBT. Zones A, C, and D are have similar geochemical signatures related to the Carlin-style system at Getchell with anomalous As, Hg, Tl, Sb, and minor Au. Sample TU00699 shows distinct geochemistry elevated in Zn, Cu, W, Co and Ni, and depleted in As, Hg, Tl, and Sb, unlike the Carlin deposits. PHL-Powder Hill Limestone, BCL-Carbonaceous black limestone, BMst-Black mudstone.
106
Figure 61. EPMA backscatter image of core-rim pyrite CRpy1 in sample TU00664 from the 148 zone showing the locations of the spot analyses in Figure 62. The CR pyrite has a dark grayish inner rim and a bright lacey and spoked outer rim. The margins of the early core display resorbtion textures and the inner gray rim fills embayments. Margins of the inner gray rim also appears resorbed with embayments of the bright outer rim. Fuzzy spoked pyrites are scattered in the matrix around the CR pyrite. The larger fuzzy pyrites have framboidal grayish cores with lacey and spoked bright rims. Some appear agglutinated onto the outer growth rim of the CR pyrite (yellow circle below the spoked pyrite).
107
Figure 62. Line graph plot of Au, As, Hg, Sb, Cu, Te, Tl, Zn in log scale of a core-rim (CR) traverse in CR pyrite CRpy1TU00664, 148 zone (Fig. 61).
Figure 63. Line graph plot of Au, As, Hg, Sb, Cu, Te, Tl, Zn in log scale (including Fe, S and Si) of a core-rim (CR) traverse in CR pyrite CRpy2 TU00664 148 zone (Fig. 64).
108
Figure 64. EPMA backscatter image of core-rim pyrite CRpy2 in sample TU00664 from the 148 zone showing the locations of the spot analyses in Figure 63. The CR pyrite has a similar morphology to CRpy1 in Figure 61.
109
sphalerit
Figure 65. Backscatter image of anhedral resorbed? pyrites with inclusions of sphalerite (bright spots in core) in sample TU00699.
110
Figure 66. Backscatter image of grains that are aggregates of bladed pyrite in sample TU00699. This style of pyrite is barren of Au and As and was not observed in the other samples presented in this report.
111
Figure 67. Backscatter image of spongy to cellular pyrite in sample TU00699. These types of pyrite lack the bright fuzzy rims and therefore lack gold and arsenic.
112
Figure 68. Line graph plot of Au, As, Hg, Tl, Te, Cu, Zn, Sb, Sn, Fe, S, Si, Ni, Co, and totals in log scale of a core-rim (CR) traverse in CR pyrite CRpy2 TU00936, HGB zone (Fig. 69).
113
Figure 69. EPMA backscatter image of core-rim pyrite CRpy2 in sample TU00936 from the HGB zone showing the locations of the spot analyses in Figure 68. The CR pyrite has a similar morphology to CRpy1 in Figure 59.
114
Figure 70. Line graph plot of Au, As, Hg, Tl, Te, Cu, Zn, Sb, Sn, Fe, S, Si, and totals in log scale of a core-rim traverse in fuzzy pyrite Fpy1 TU00936, HGB zone (Fig. 71b).
b.
Figure 71. EPMA backscatter images of framboidal fuzzy pyrites in sample TU00936 from the HGB zone: (a) typical fuzzy pyrites from 1-4 µm and larger CR pyrites (up to 0.2 mm) in a jasperoidal quartz ground mass, (b) large fuzzy pyrite >10 µm (see Fig. 59).
a.
115
Figure 72. Scatter plots that compare the chemistry of fuzzy pyrites in jasperoidal quartz (Fpy) and realgar (Rpy) to core-rim pyrites in jasperoidal quartz (CR) from the High Grade Bullion zone TU00936 881’ 5.68 opt Au in contrast to low grade gold at BBT (CRvn, outer rim in TU00929). Trace elements As, Sb, Hg, and Tl are plotted versus Au. Sample populations are separated into 5 domains outlined with interpreted shapes. Domains include Fpy, Rpy, CRro (outer rim), CRrm (middle rim), and CRri (inner rim). Fpy fuzzy pyrite in silica, Rpy fuzzy pyrite in realgar, CR core rim pyrite c=core ri=inner rim rm=middle rim ro=outer rim.
116
Figure 73. Line graph plot of Au, As, Hg, Tl, Sb, Cu, Te, Zn, and Sn in log scale of a core-rim traverse in a glomero-acicular pyrite Apy8 in TU00929, BBT zone (Fig. 58).
117
Figure 74. EPMA backscatter image of the zoned a pyrite veinlet (CRvn1 TU929) showing the location of the Au-bearing bright outer rim in Fig. 75; the core (C), spongy rim (SP), and outer core (OC). The veinlet in the circle was truncated and later coated with the narrow bright ore-stage pyrite rim. The sample is from the Dacite Dike in the BBT zone, and the ground mass around the vein is argillized dike rock.
118
Figure 75. Line graph plot of Au, As, Hg, Tl, Sb, Cu, Te, Zn, Sn, Fe, S, and Si in log scale of a core-rim traverse through a pyrite veinlet from the dacite dike in sample TU00929 (see Figs 74 and 76). Data display a dramatic increase in Tl, Hg, Sb, Au, Te, Cu toward the rim. Cu, As and Sb concentrations are elevated relative to gold in the spongy (sp) rim to inner rim (ri). Concentrations of Au increase in the outer rim (ro) relative to Cu and Te.
119
Figure 76. EPMA backscatter image showing the location of analyses (red, Fig. 75) and area under the circle in Figure 74. The Au-bearing bright fuzzy outer rim is also labeled in the photo. The vein symmetry, as defined by the cellular texture of the spongy zone separated by massive zones, is truncated and later coated by the bright, fuzzy ore-stage rim.
120
Figure 77. EPMA backscatter image of a large CR pyrite showing the location of analyses in figure 78. The sample is from the hanging wall to the dacite dike in the BBT zone. The trace element rich outer rim has a lacey and spoked texture and is up to 10 µm wide. Scattered around the CR pyrite are framboidal spoked pyrites 5-10 µm across. The ground mass is vein calcite.
121
Figure 78. Line graph plot of Au, As, Hg, Tl, Sb, Cu, Te, and Zn in log scale of a core-rim traverse through the CR pyrite in the calcite vein, the BBT Dike hanging wall from sample TU00929 2120.5’ (see Fig. 77). Data display an increase in As, Hg, Au, Te, and Cu toward the rim. Sb concentrations are elevated throughout across the grain.
122
Figure 79. Variation diagrams that compare all pyrite EPMA analyses in this study for Au versus As-Hg-Tl-Sb. In general, the CR pyrites from HGB, 148 and the BBT dike have the highest concentrations of As with highest Au. The BBT dike and HGB fuzzy pyrites show the highest concentrations of Hg and Tl with the highest Au, and also the highest Sb with elevated Au.
123
Figure 80. Variation diagrams that compare all the pyrite EPMA analyses in this study for Au versus Cu and Te. Highest concentrations of Cu with highest Au are characteristic for all pyrites but most pronounced in the BBT dike. The BBT dike and HGB fuzzy pyrites show the highest concentrations of Te with highest Au, and the HGB CR pyrites show highest Te with lower Au. The dashed green outline with low Cu and high Au represents analyses from the BBT dike prior to the instrument calibrations discussed above in methodology (ie. adjustments for peak positions). The accepted analyses for the BBT dike have high Cu with highest Au outlined in the solid green line.
124
Figure 81. Variation diagram that compares Hg versus Au in multistage rims from the HGB and 148 zones and single-stage rims on pyrite veinlets from the Dacite Dike in the BBT zone. The diagram shows similarities in Hg-Au chemistry in the outer rim (OR) at 148 with the inner rim (IR) and middle rim (MR) of the HGB, and the outer rims at HGB and BBT.
125
Figure 82. Variation diagram that compares As versus Au in fuzzy pyrites from the HG(green shaded areas) and multistage rims from CR pyrites in HGB and 148 (red outlines).The diagram shows similarities in As-Au chemistry between fuzzy pyrites and CR pyrites. The fuzzy pyrites are most similar to the outer rims of the multistage CR pyrites.
B
outer rims
&148
126
Figure 83. EPMA backscatter image of a core-rim pyrite from the 148 zone (TU00664 211.5’). The pyrite core is brighter than a grayish inner rim and trace element concentrations are low (<100 ppm) in both areas with the exception of elevated As (>100 ppm) in the grayish inner rim. Core-rim analyses show slightly elevated Au in the core of these pyrites relative to the inner rim (Figs. 62 and 63). The inner rim may represent a thermal-diffusivity reaction rim with the original pyrite grain and may mimic the shape of the original pyrite grain. Compositions in the pyrite core may approximate the original pyrite structure and chemistry. Trace elements may have diffused in and out of the inner rim. The outer lace and spoke textured bright rim appears to be a growth rim from late chemical precipitation from the ore fluids.
127
Figure 84. Preliminary Turquoise Ridge fluid flow model based on the patterns observed in the pyrite chemistry from this study.


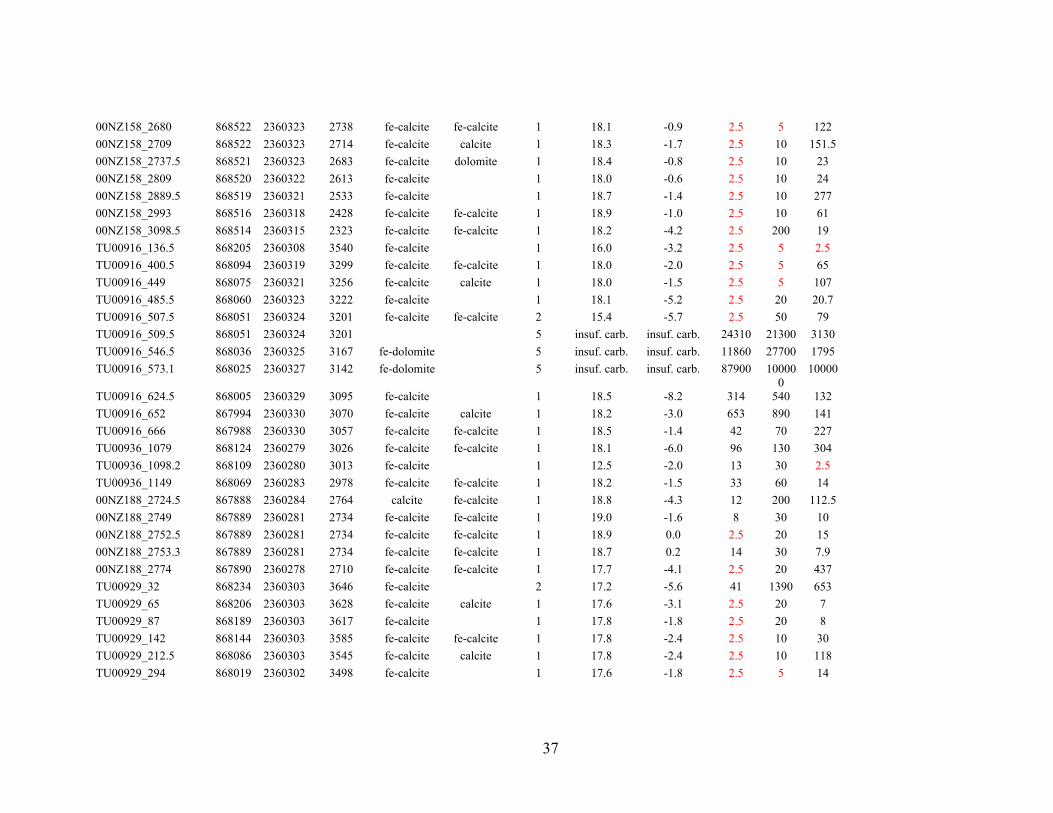

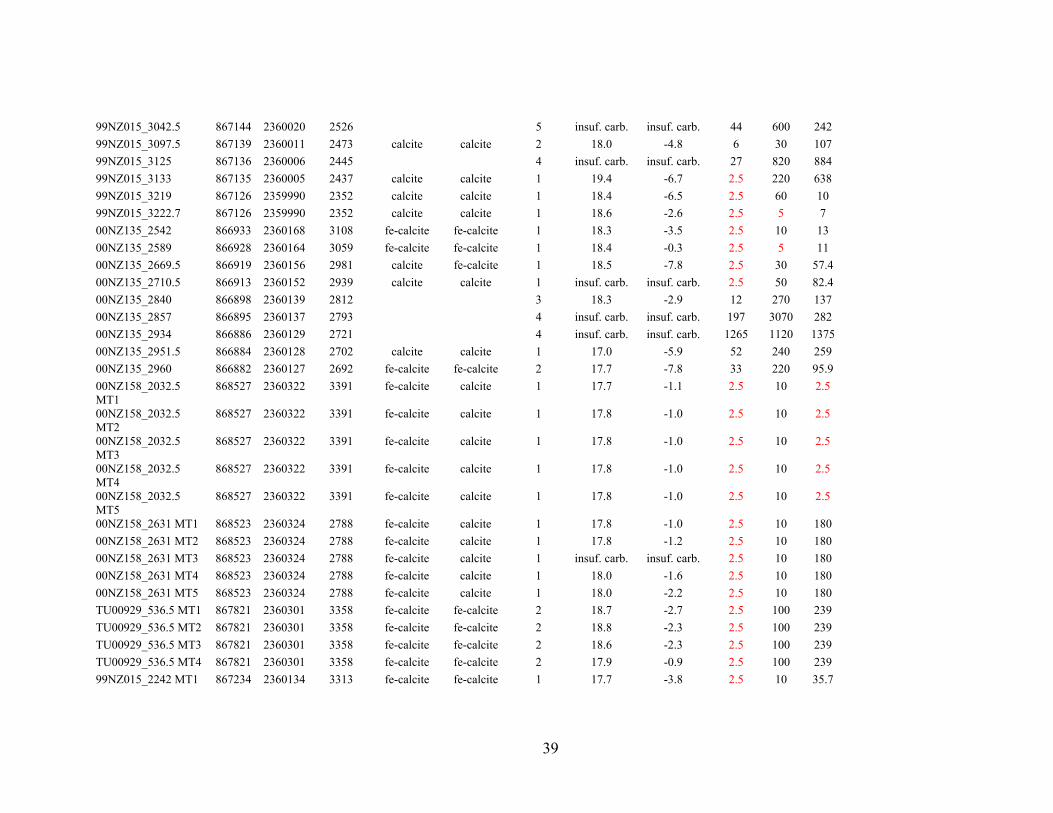


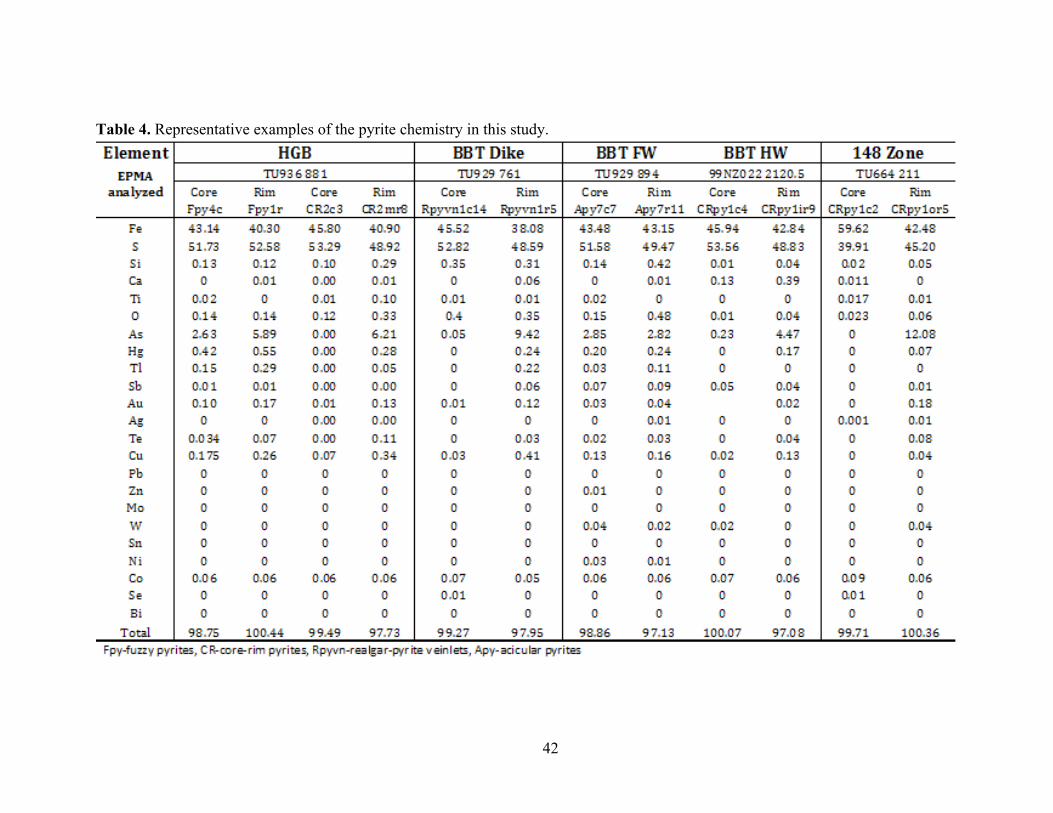

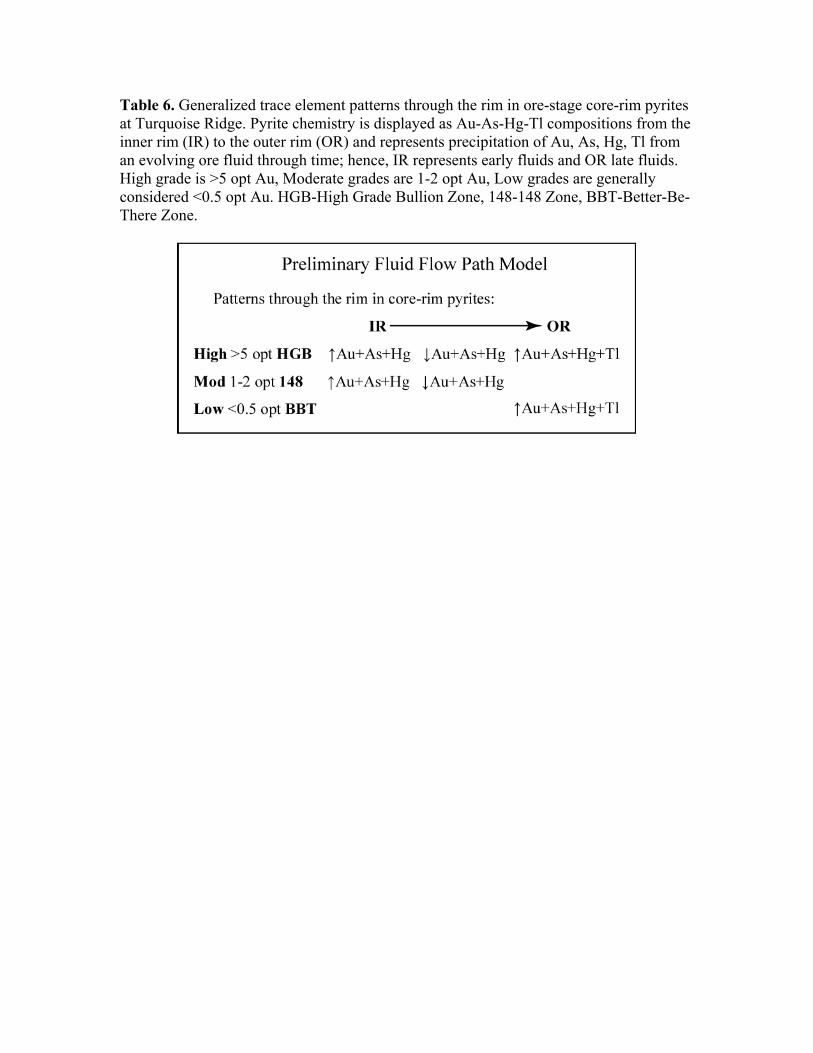


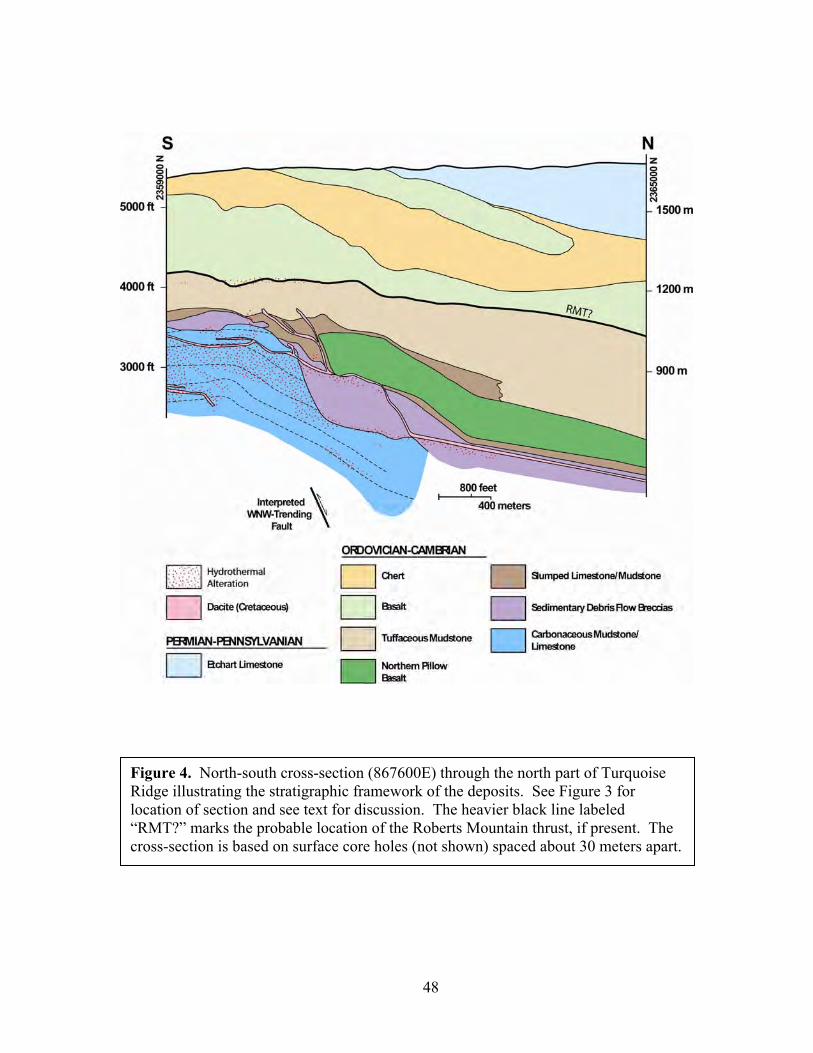
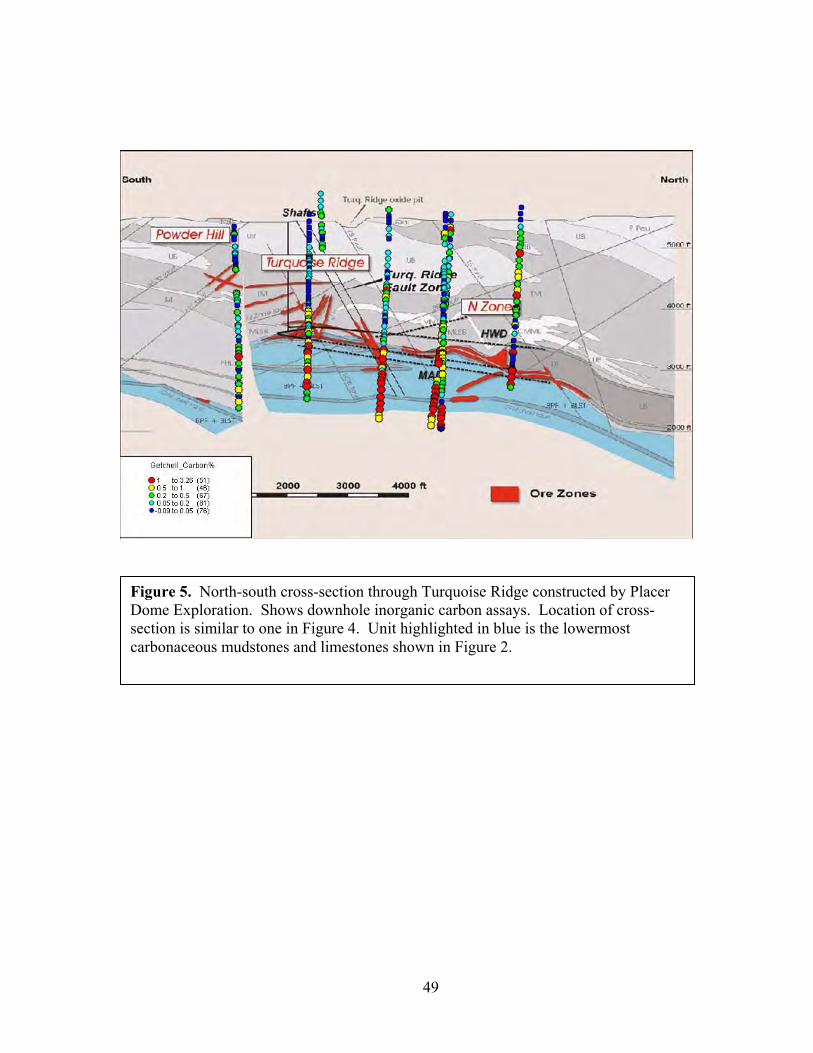
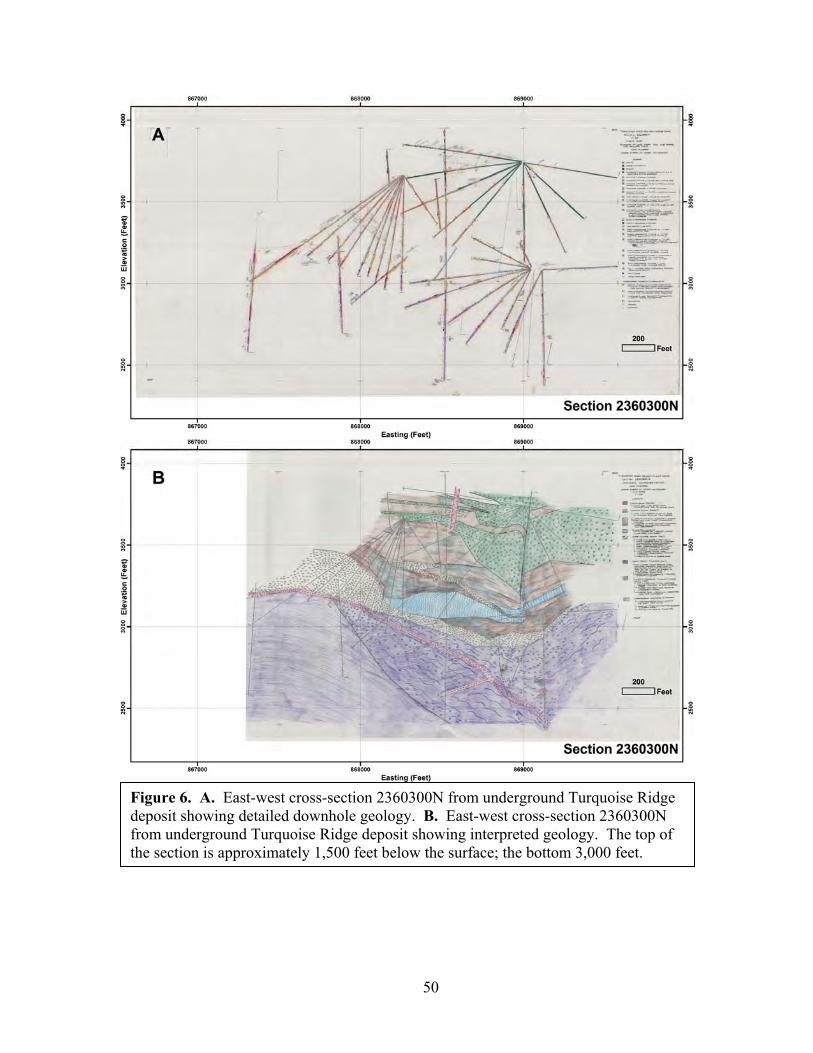


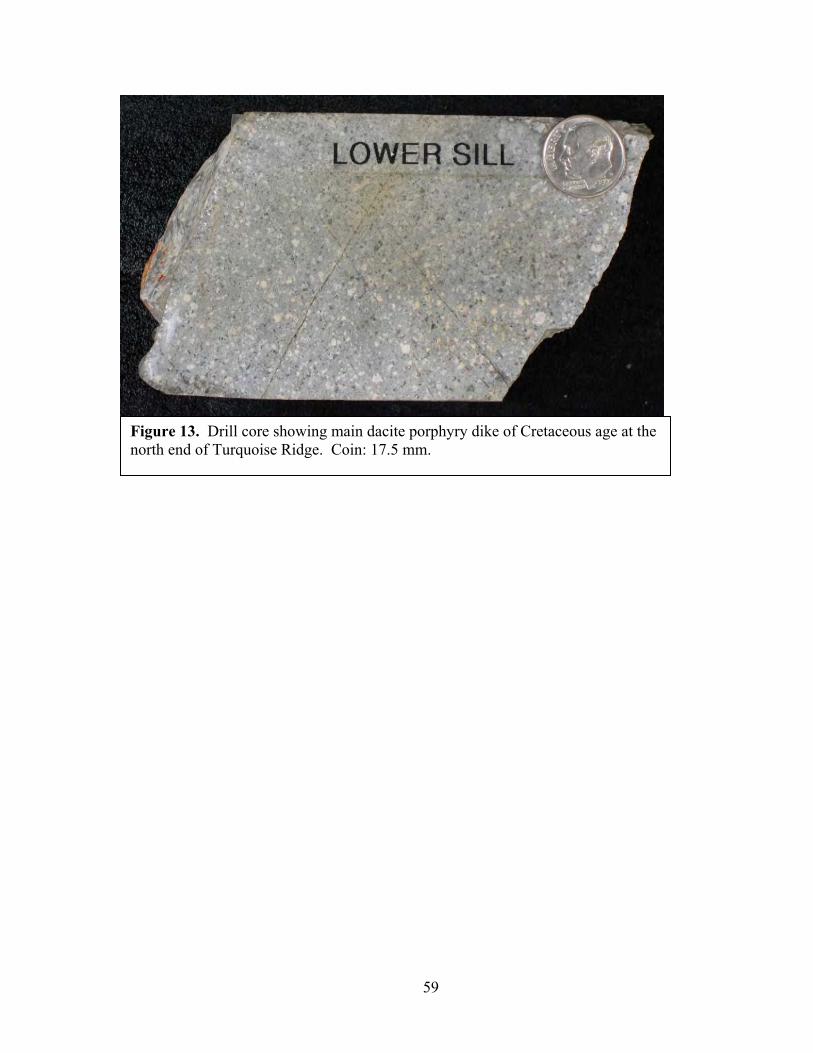
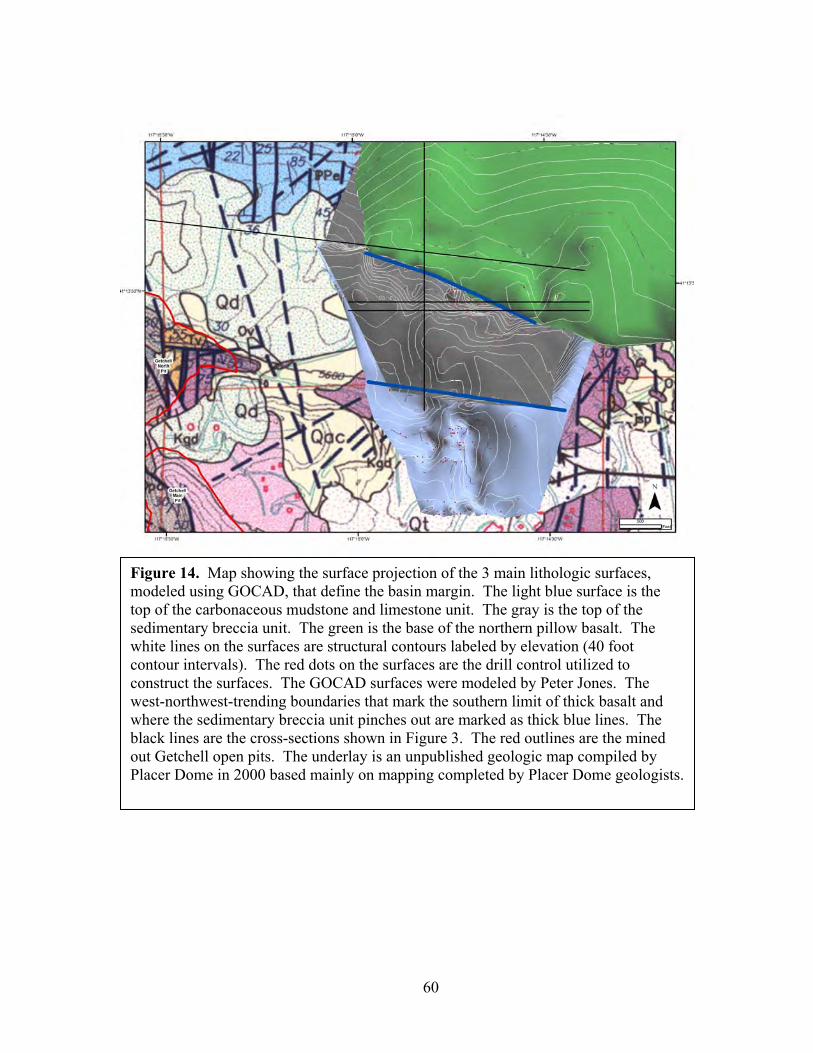
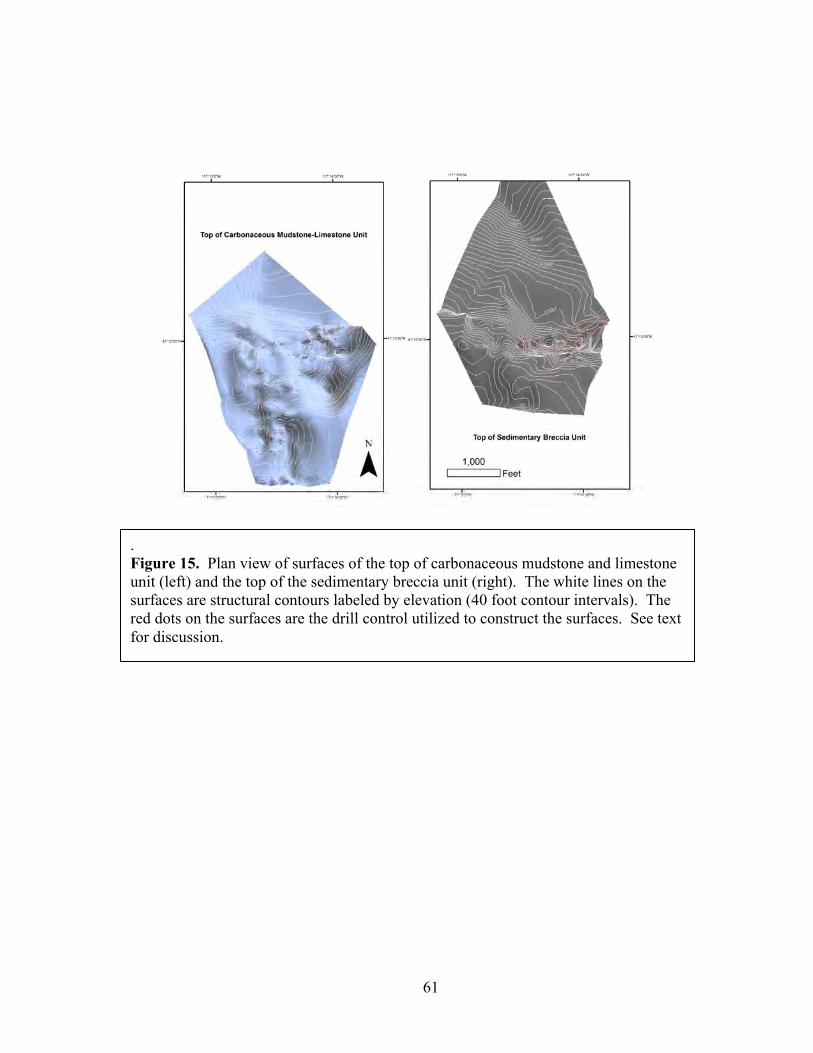


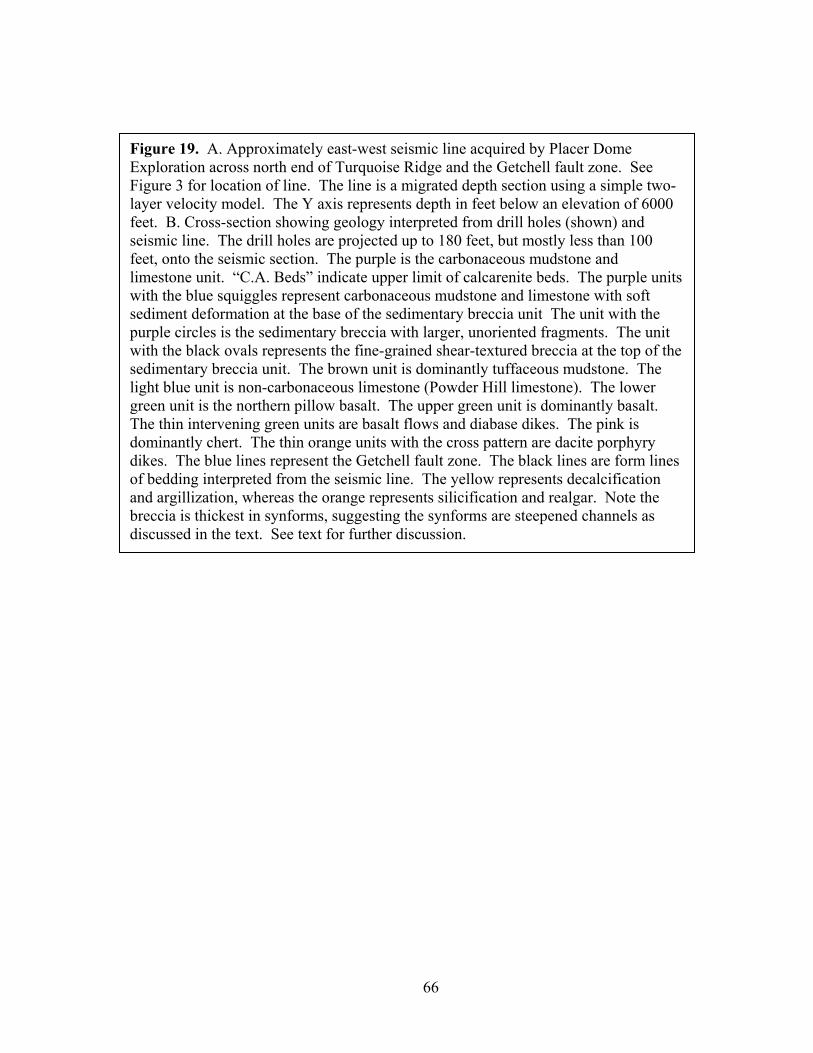
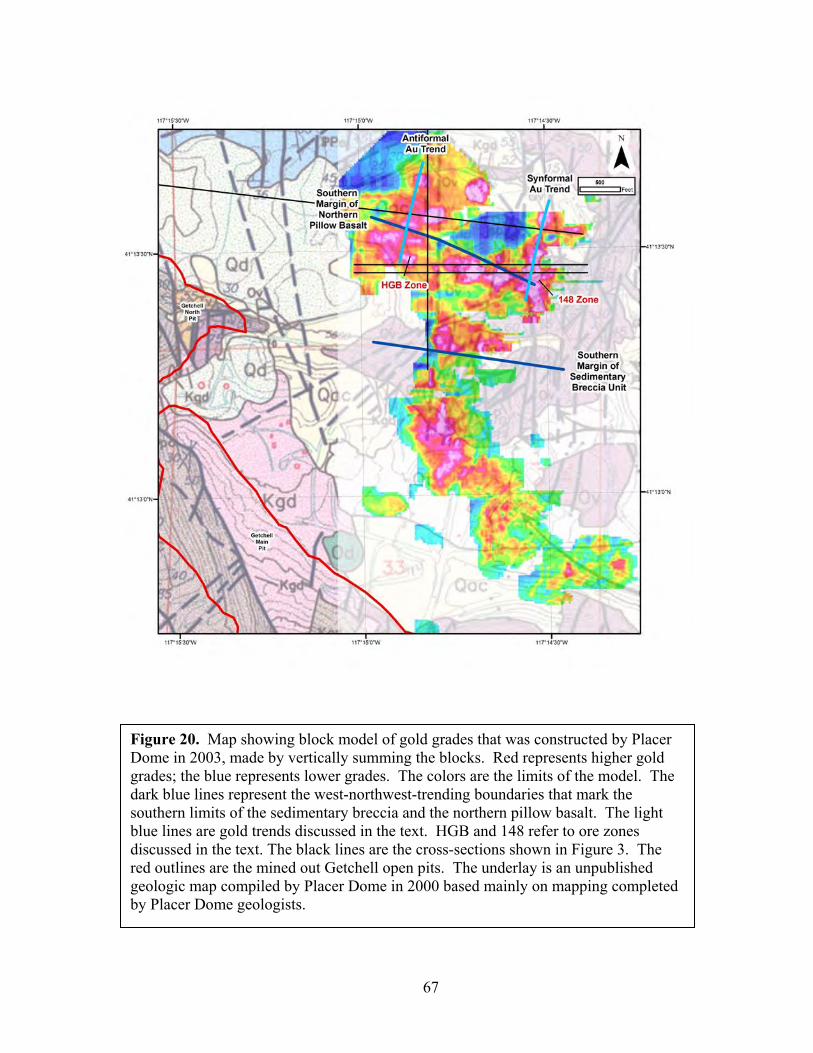


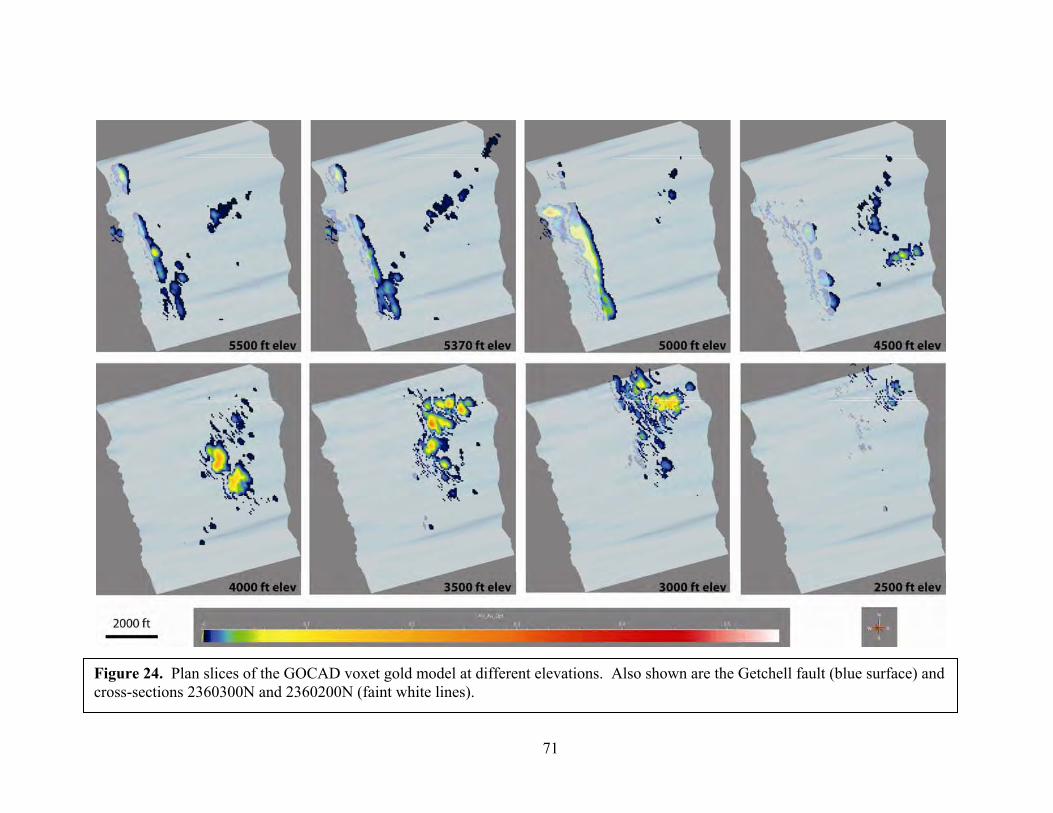


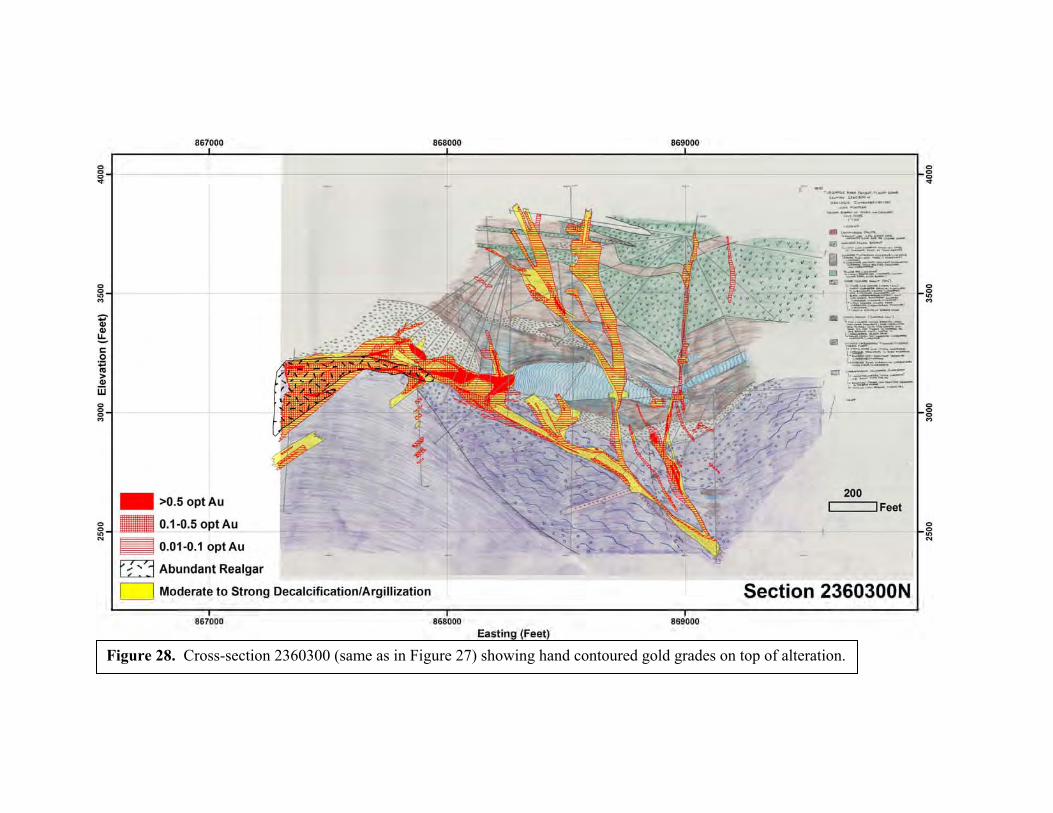
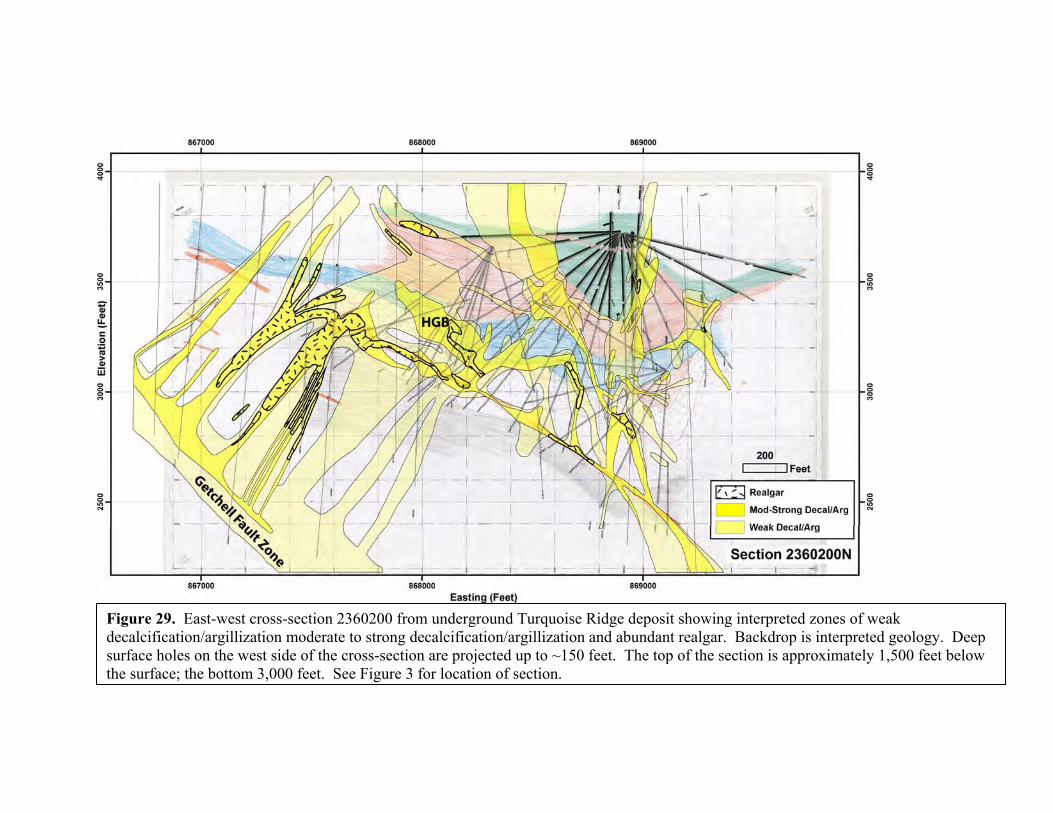
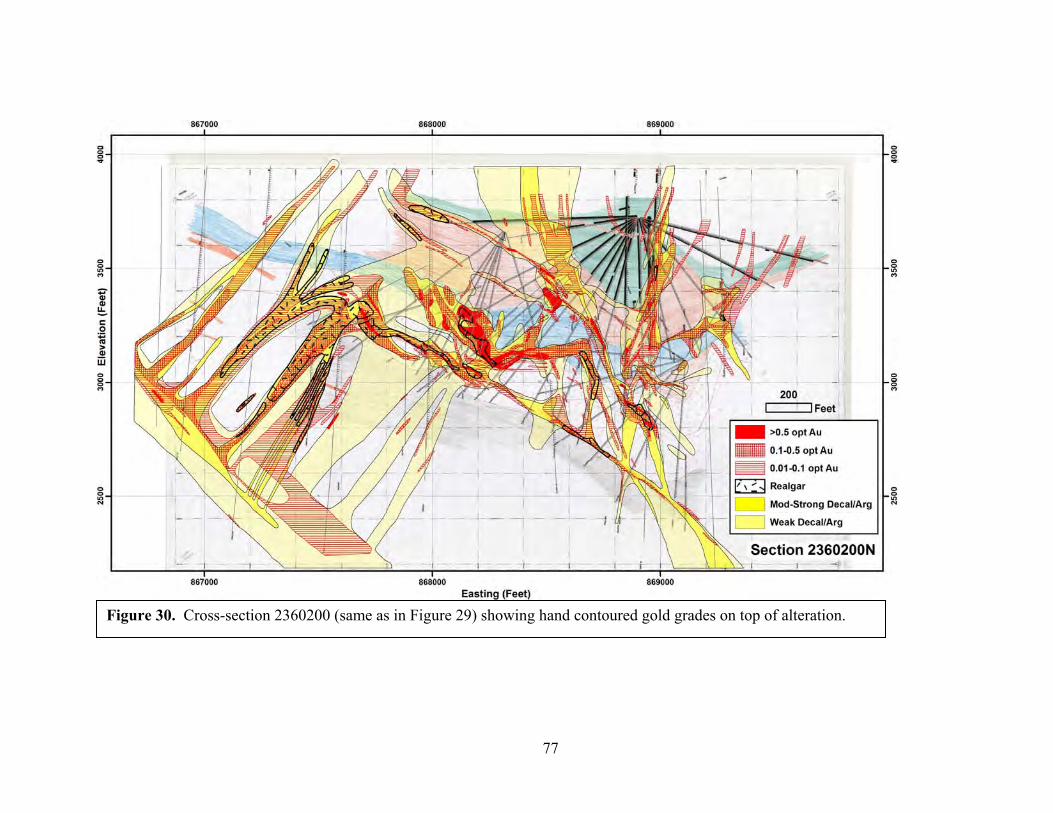
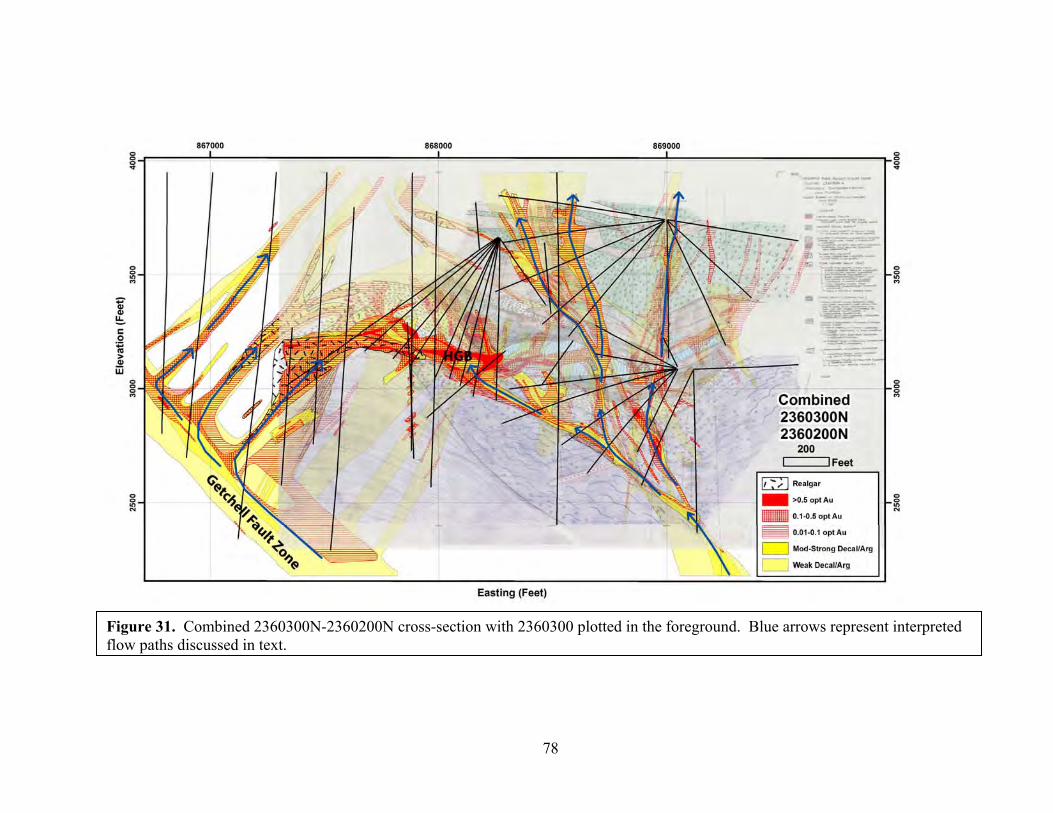

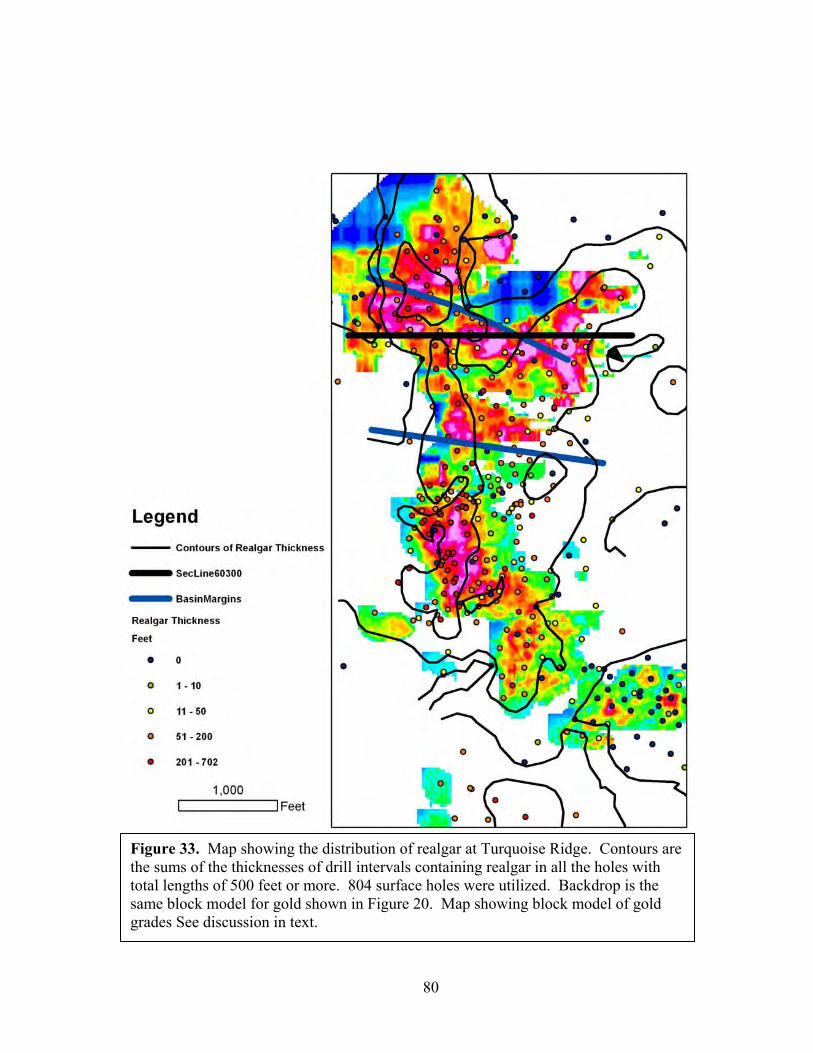


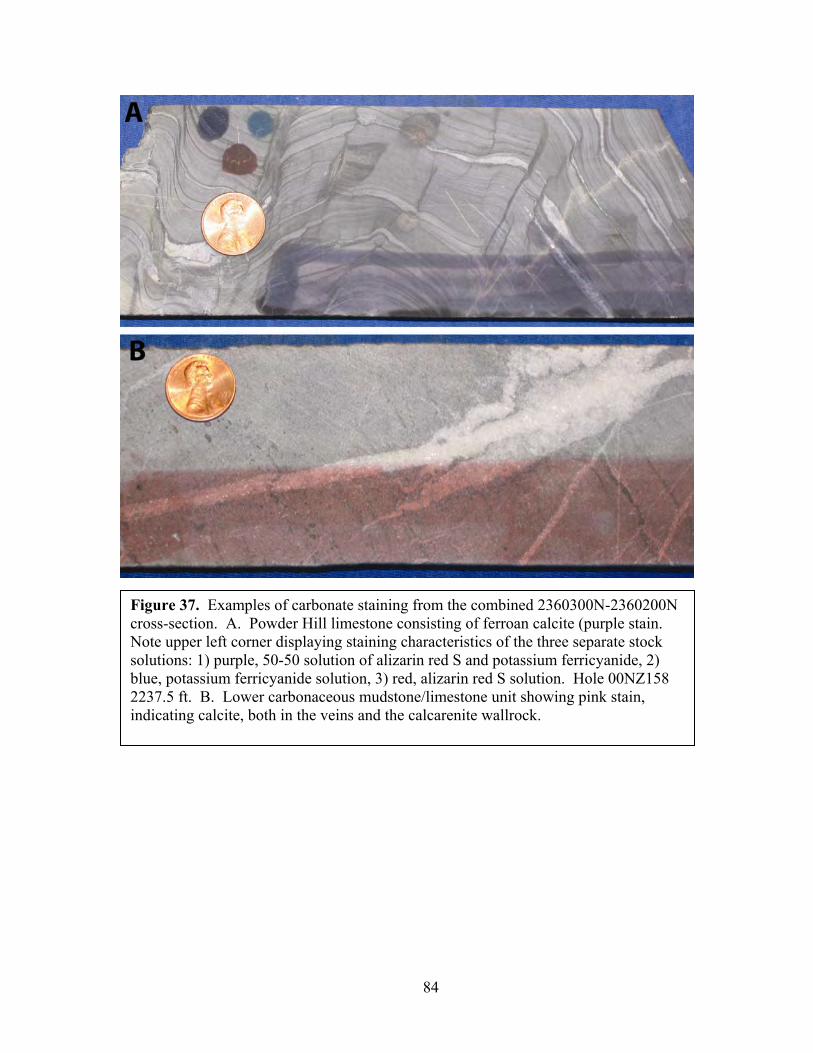


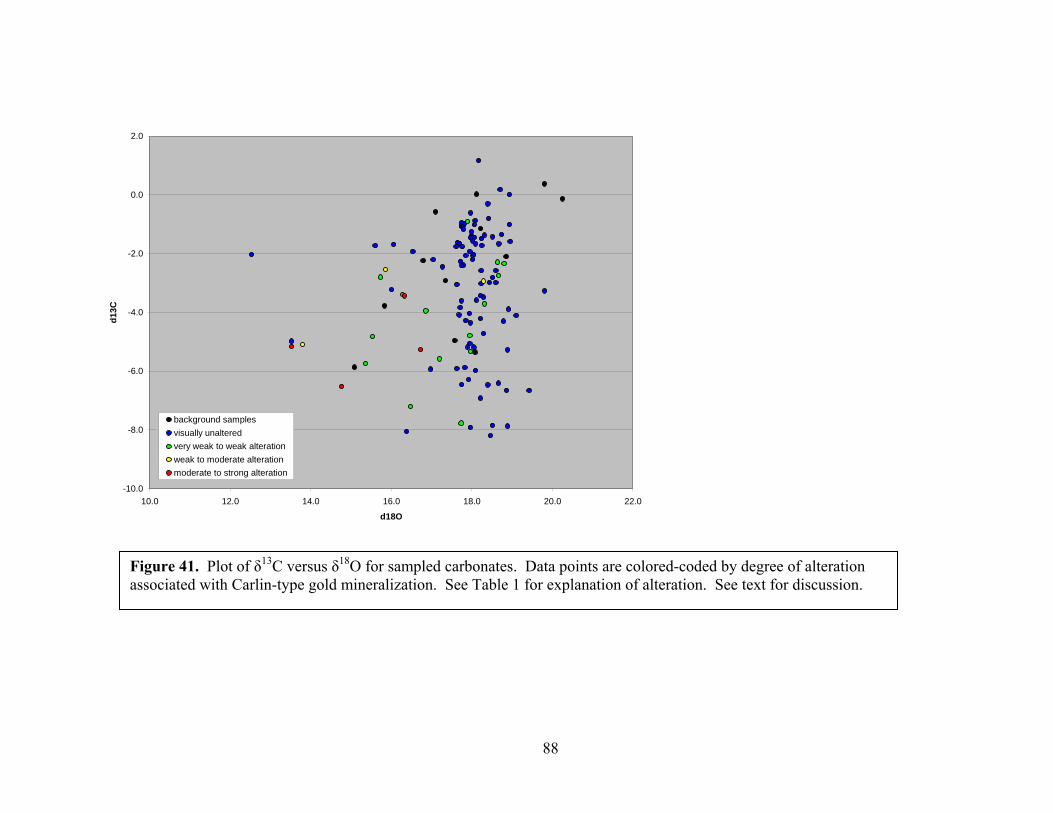


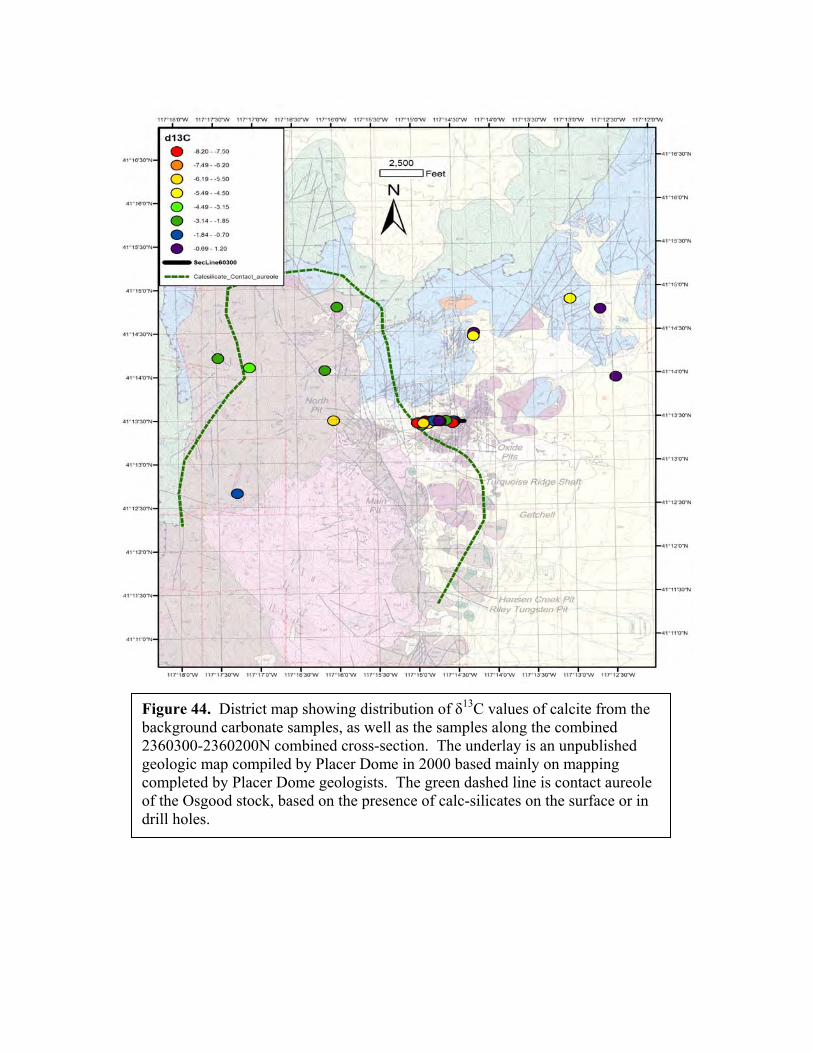


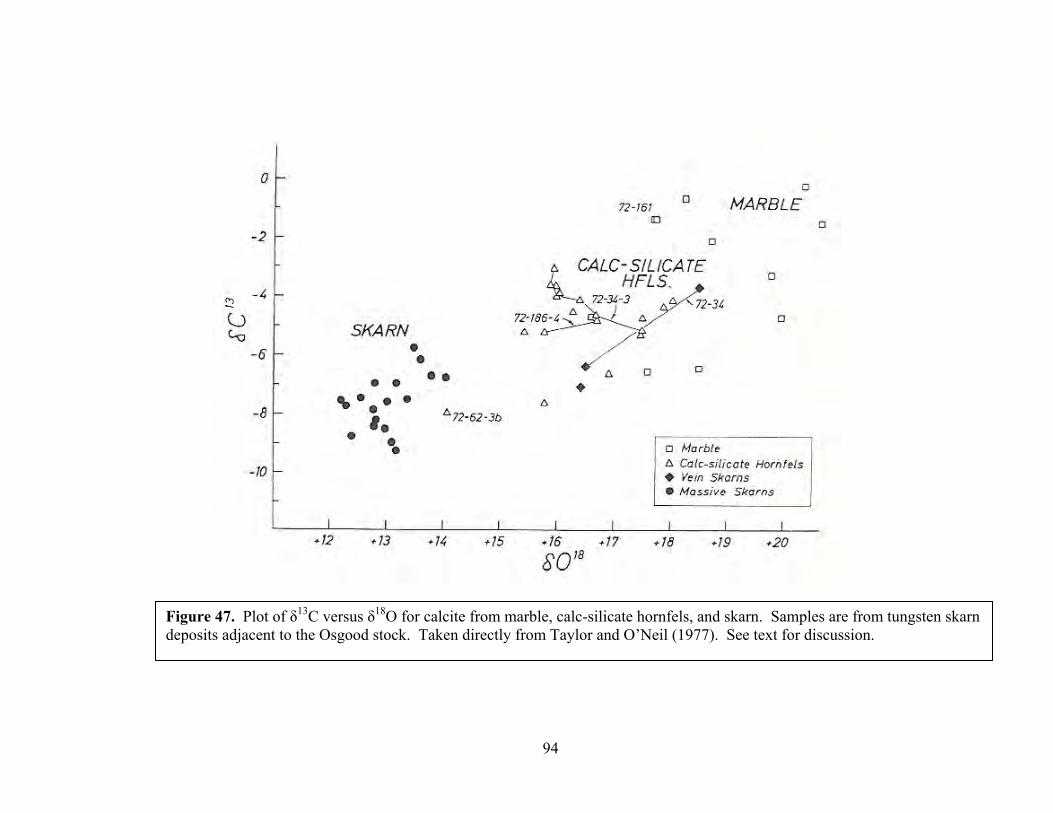

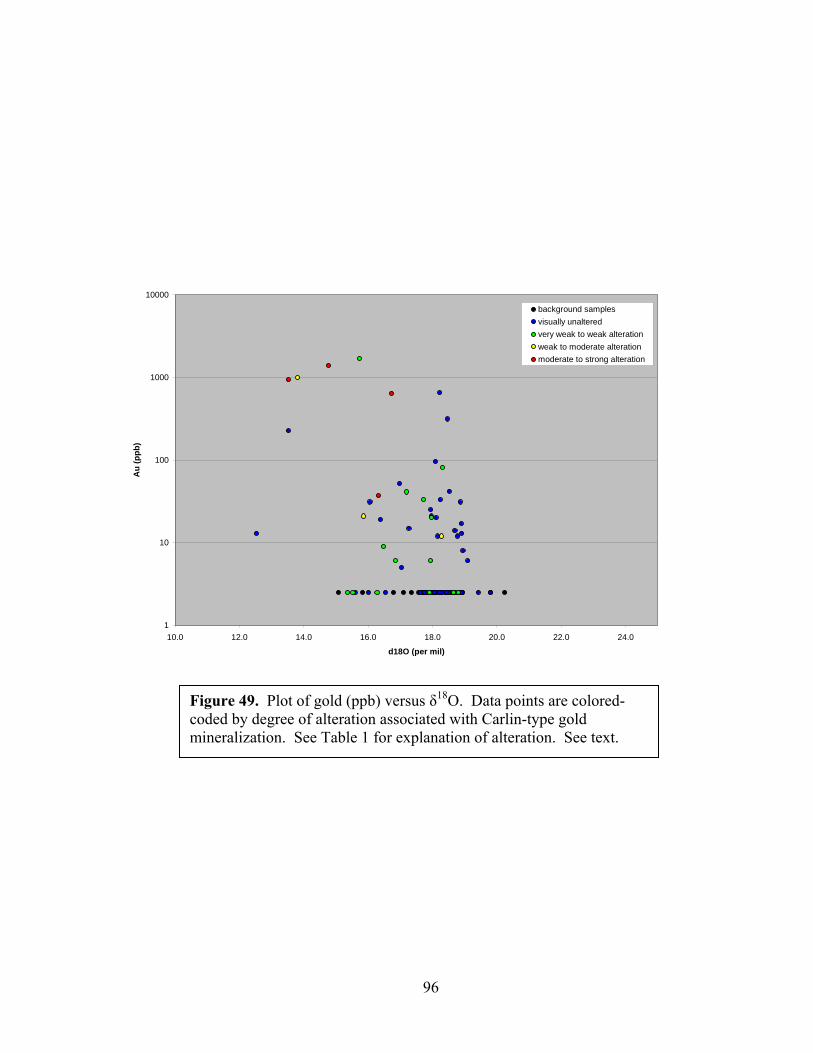


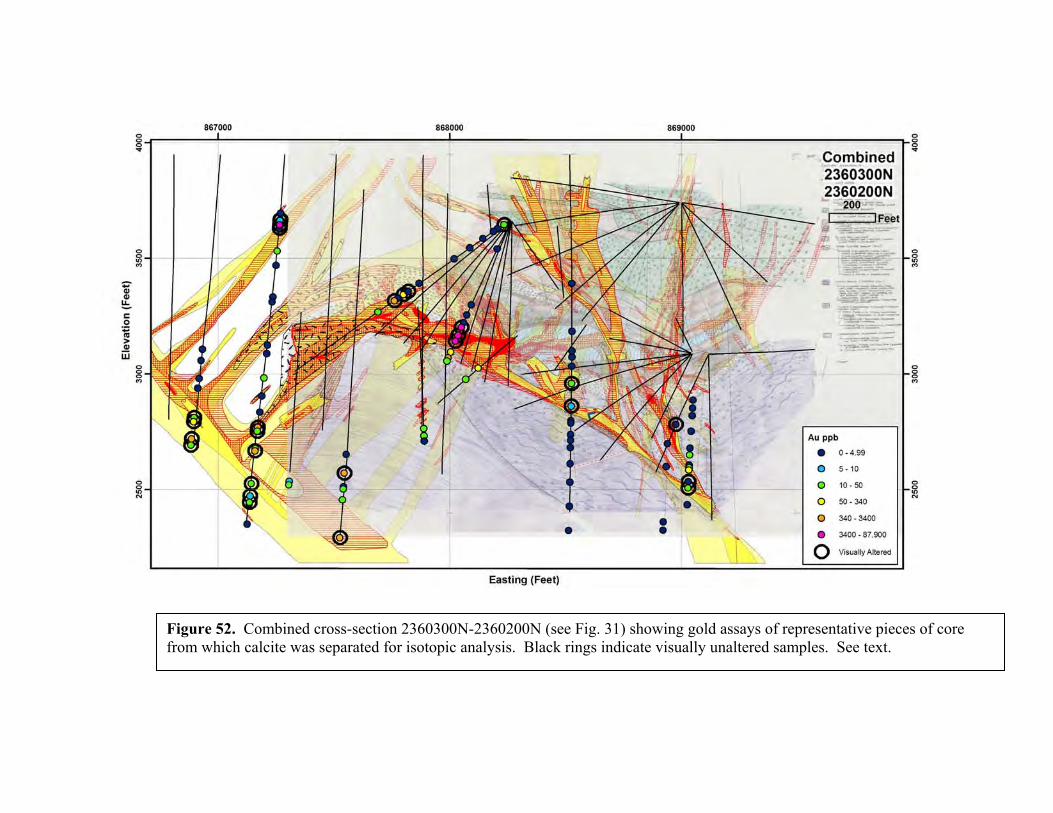

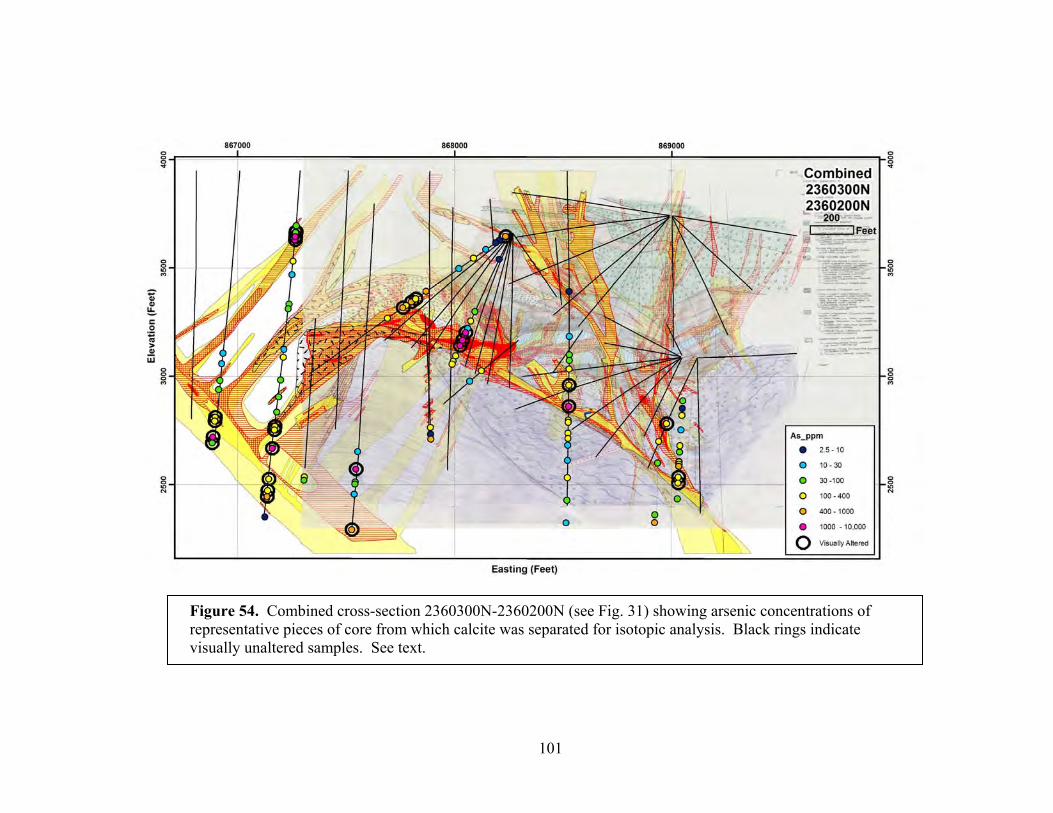

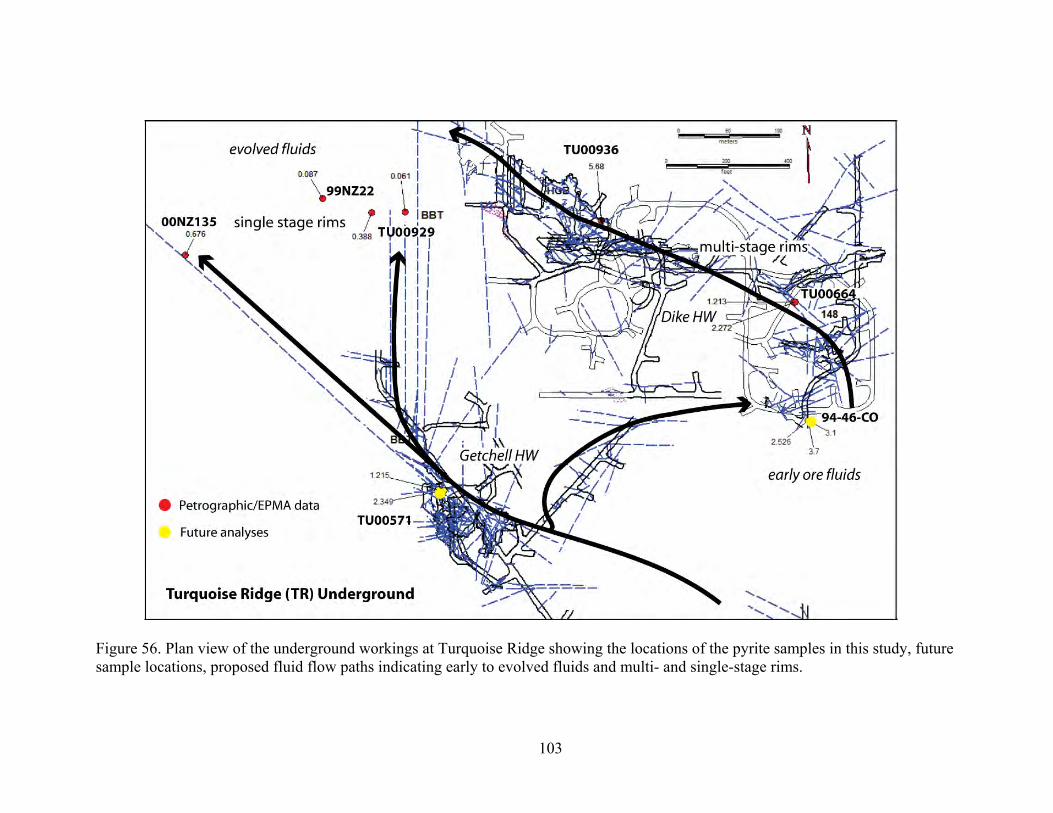


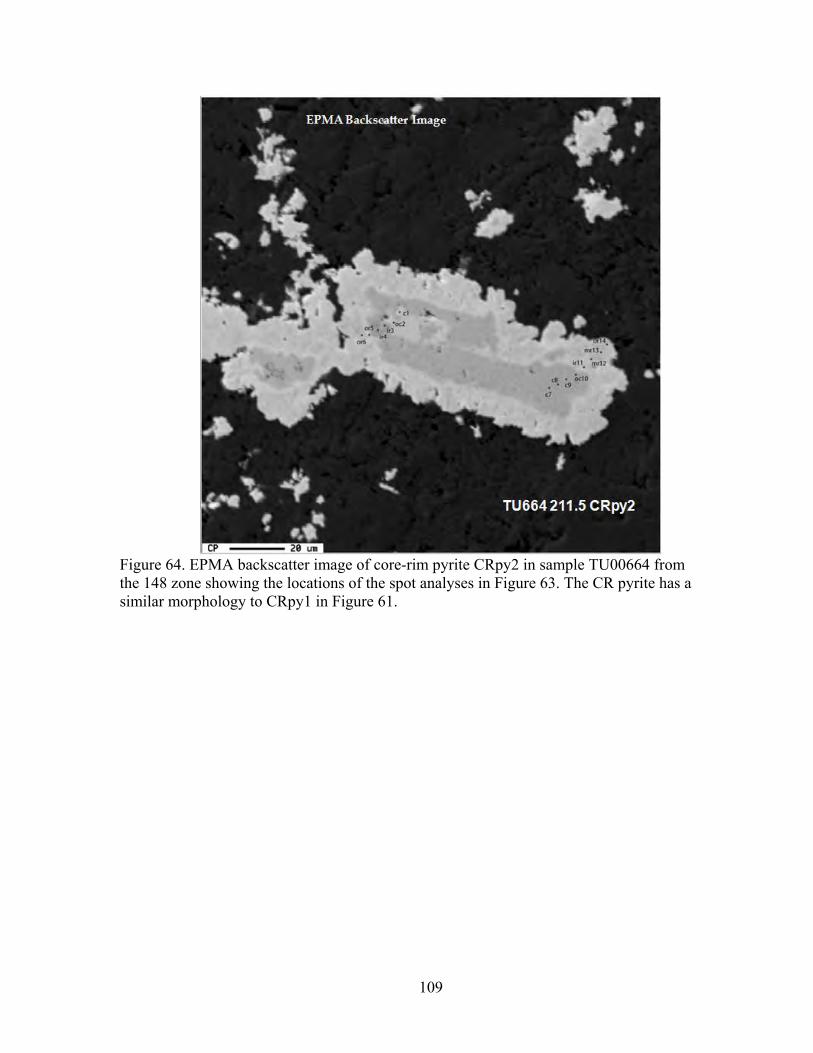

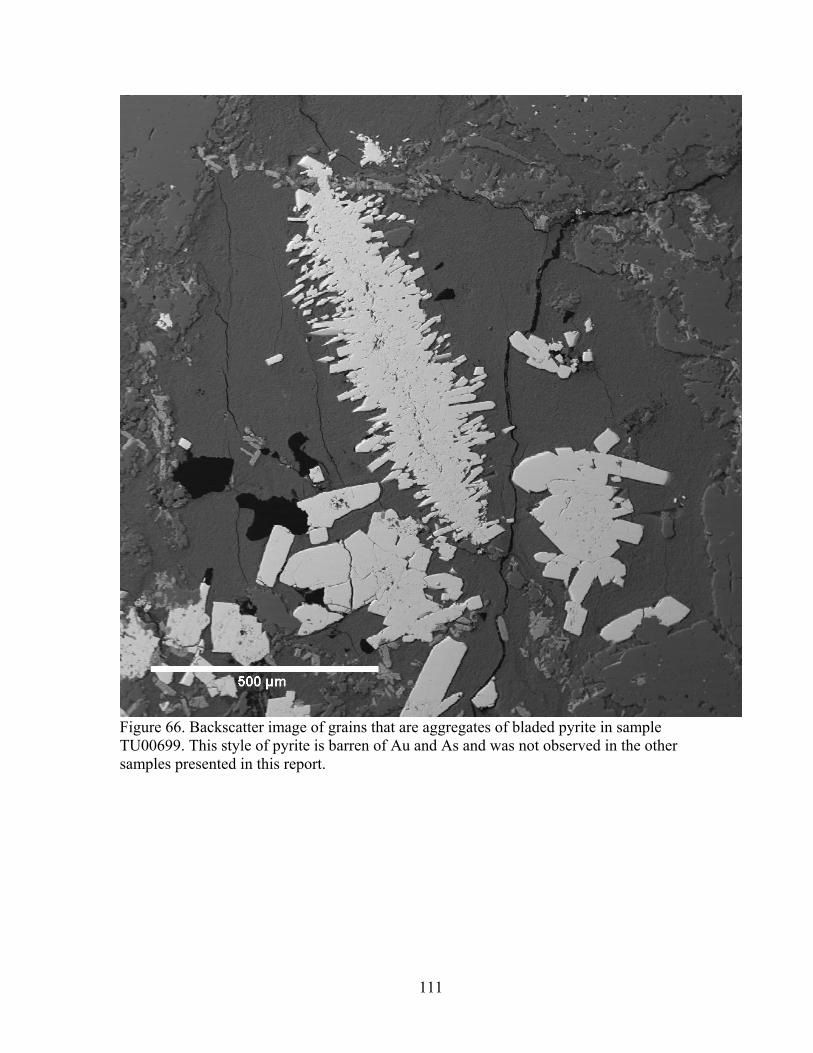


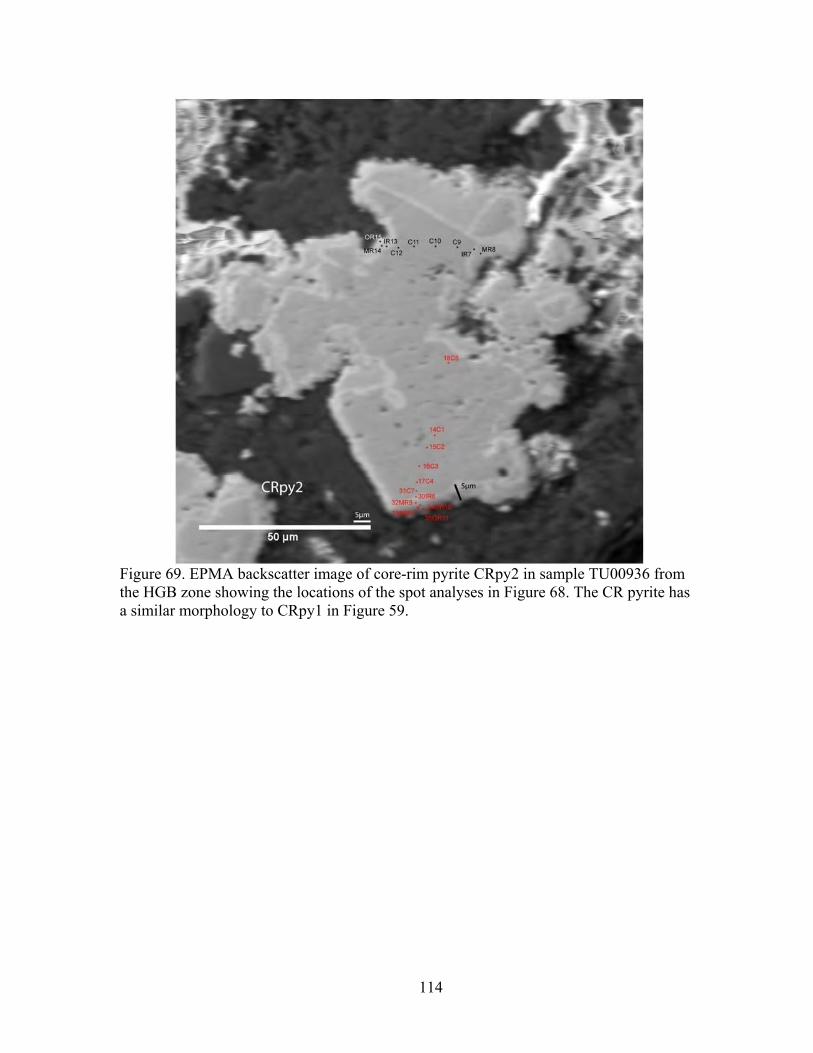
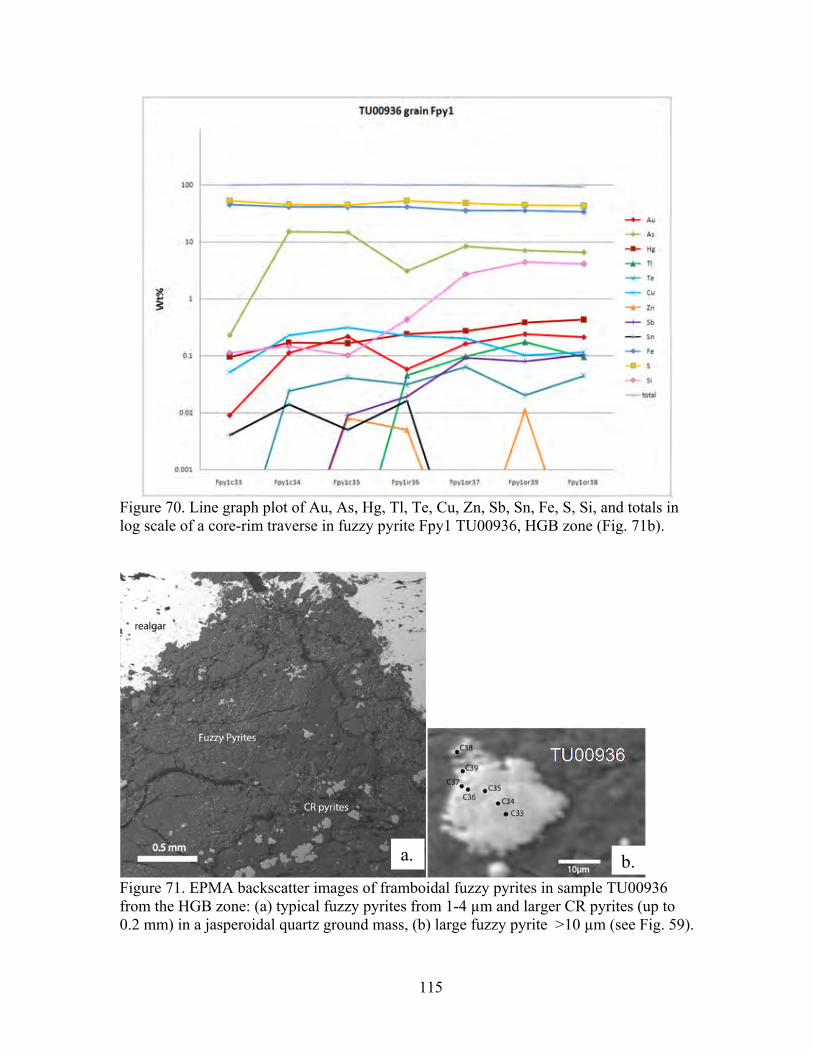
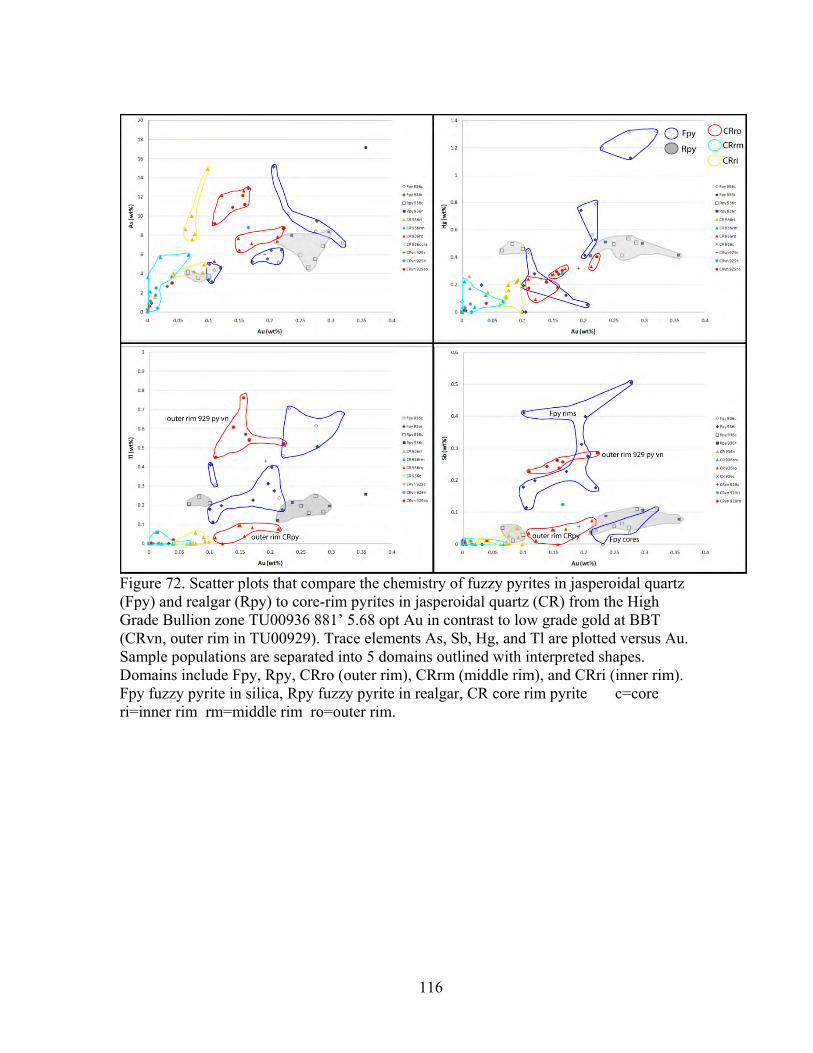
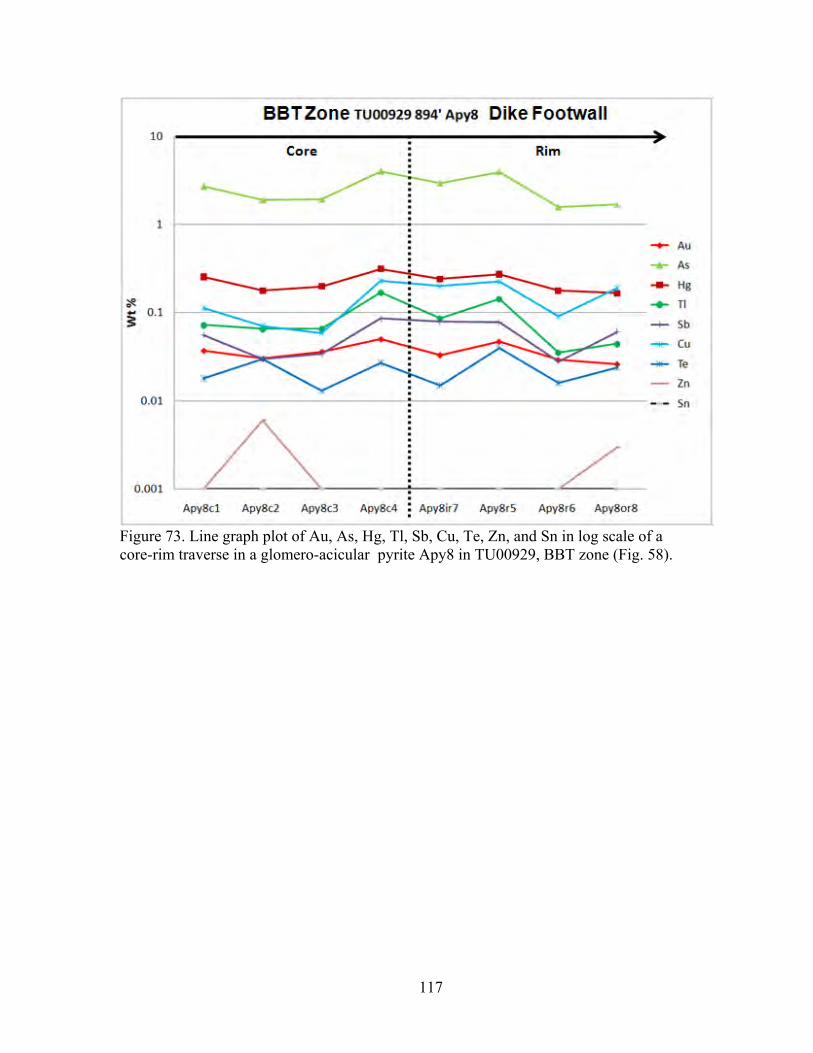


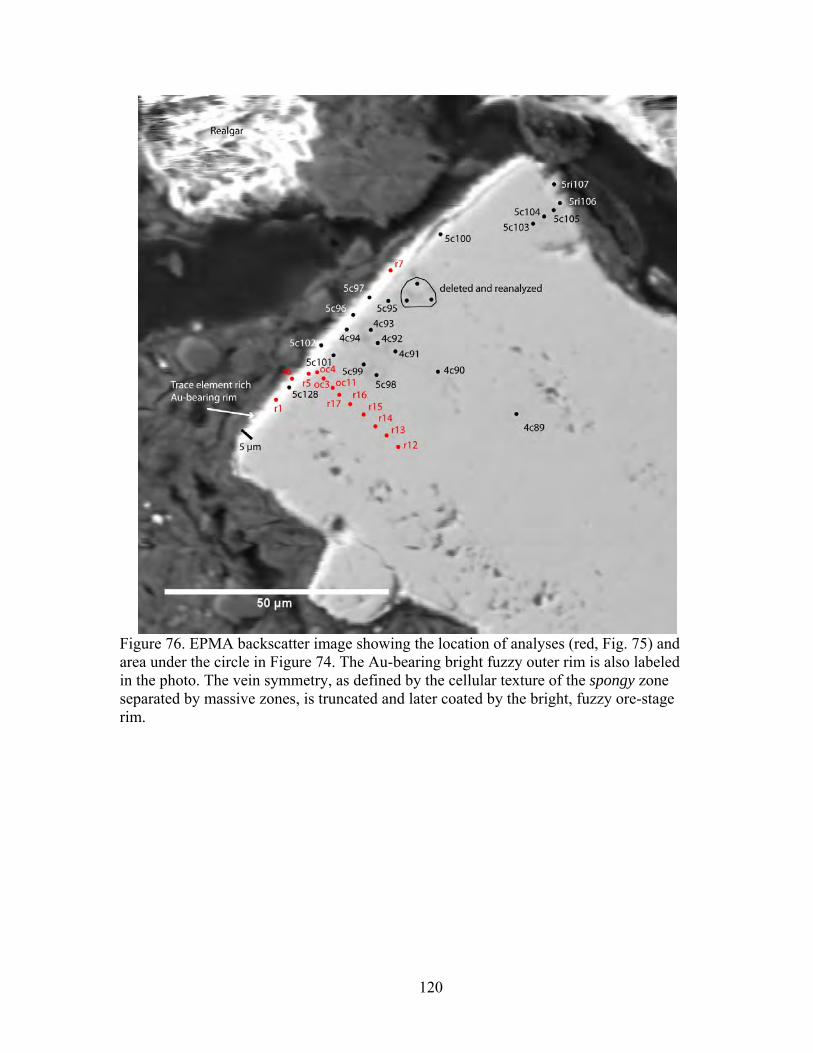
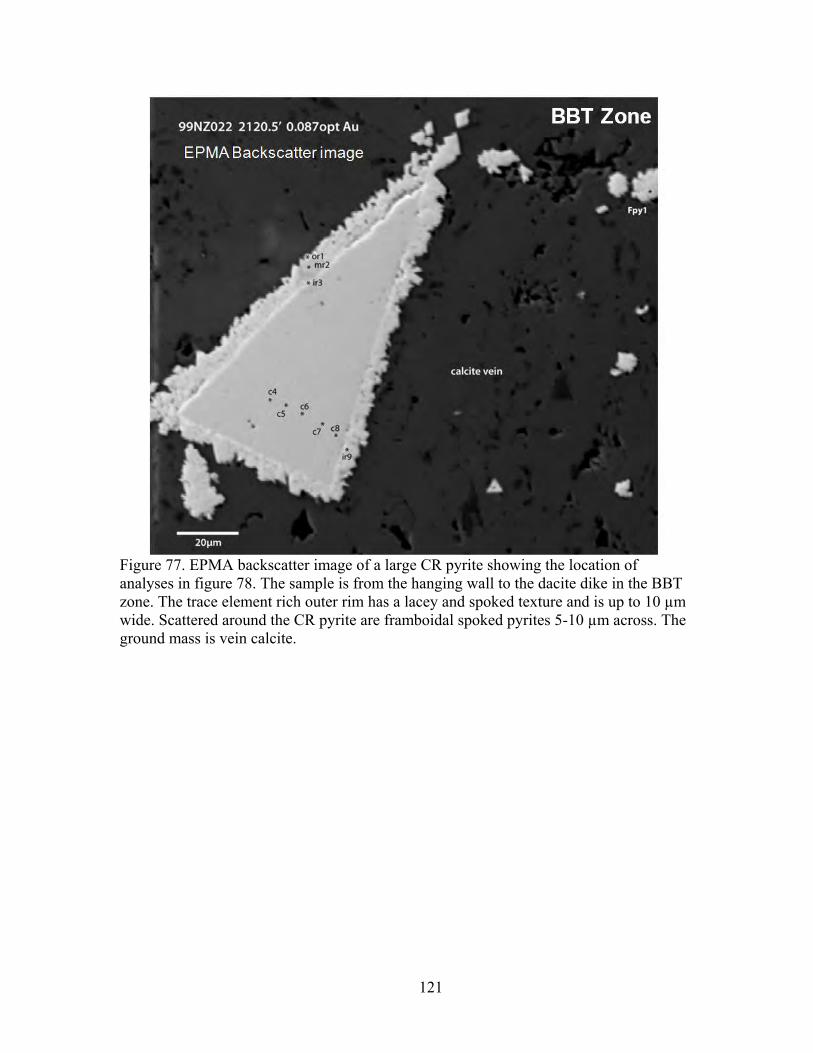


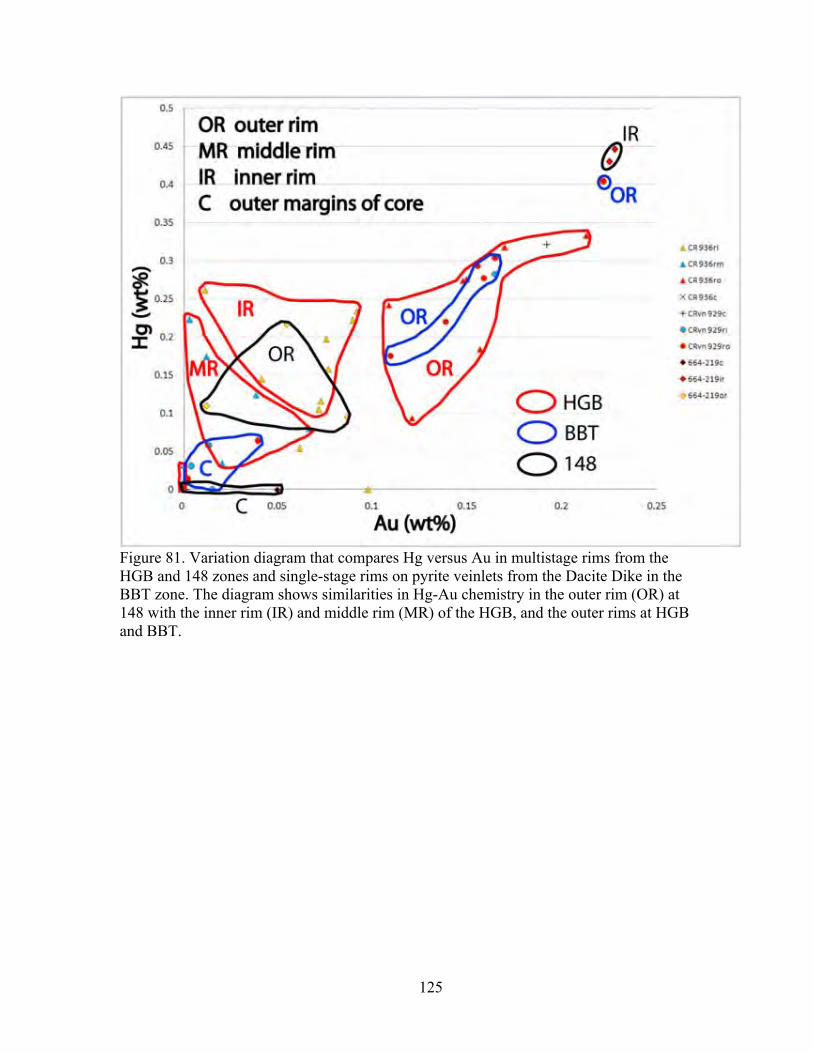

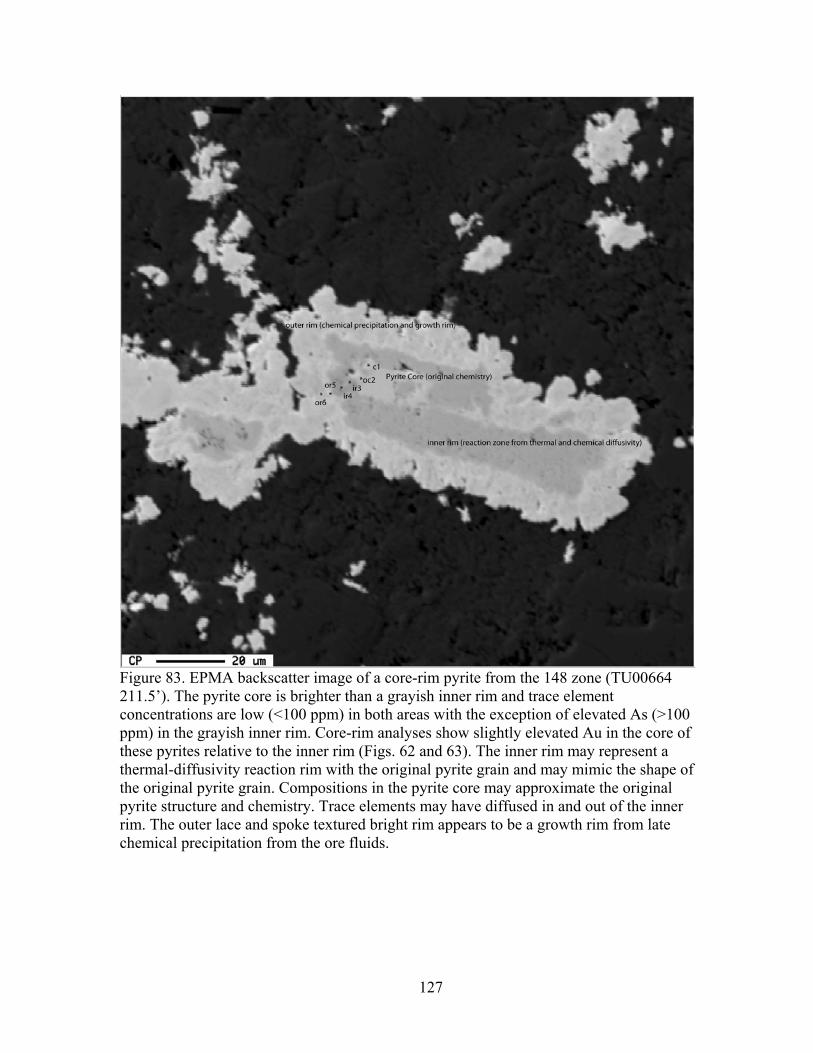


![1810 Federal Census · NORTON, Ifse 2 BOWLES, Evan 6 CARLIN, Alexis French/Kouri-Vini 5 CARLIN, Honoré 12 CARLIN, Célestin 6 CARLIN, Denis 7 CARLIN, Widow [of] 2 CARLIN, Eugêne](https://static.documents.pub/doc/80x56/5e6b107934ce1567772964a1/1810-federal-census-norton-ifse-2-bowles-evan-6-carlin-alexis-frenchkouri-vini.jpg)


