Collective Action and Community Development: Evidence from Women’s Self-Help Groups in Rural India a Raj M. Desai b Shareen Joshi c This Draft: April 2012 Abstract In response to the problems of high coordination costs among the poor, efforts are underway in many countries to organize the poor through “self-help groups” (SHGs)–membership-based organizations that aim to promote social cohesion through a mixture of education, access to finance, and linkages to wider development programs. We randomly selected 32 of 80 villages in one of the poorest districts in rural India in which to establish SHGs for women. After two years of exposure to the intervention, women in treatment villages were more likely to participate in group savings programs, exerted greater control over household decisions, and displayed greater civic engagement than women in control villages. To investigate the sources of cooperation further, we conducted a simple multi-round public-goods game in 14 villages. We find that players who have been exposed to SHGs converge towards a cooperative equilibrium faster than those who have not. We also find that SHG women discount the risk of non-cooperation by others more than women in control villages. We conclude that SHGs and other membership-based organizations for the poor, where they promote collective action do so not by enforcing a commonality of tastes, but by reducing uncertainty surrounding cooperation. a The authors gratefully acknowledge the cooperation of the Self-Employed Women’s Association (SEWA) and financial support of the Wolfensohn Center for Development at the Brookings Institution and Georgetown University’s Engaging India initiative. Surveys were conducted by Social and Rural Research Institute of IMRB, New Delhi. A previous version of this paper was delivered at the annual meeting of the American Political Science Association. Errors and omissions are the authors’ own. b Edmund A. Walsh School of Foreign Service and Department of Government, Georgetown University, Washington, D.C. and the Brookings Institution, Washington, D.C. Email: [email protected]. c Edmund A. Walsh School of Foreign Service, Georgetown University, Washington, D.C. Email: [email protected].
Transcript
Collective Action and Community Development:
Evidence from Women’s Self-Help Groups in Rural Indiaa
Raj M. Desaib Shareen Joshic
This Draft: April 2012
Abstract
In response to the problems of high coordination costs among the poor, efforts are underway in many countries to organize the poor through “self-help groups” (SHGs)–membership-based organizations that aim to promote social cohesion through a mixture of education, access to finance, and linkages to wider development programs. We randomly selected 32 of 80 villages in one of the poorest districts in rural India in which to establish SHGs for women. After two years of exposure to the intervention, women in treatment villages were more likely to participate in group savings programs, exerted greater control over household decisions, and displayed greater civic engagement than women in control villages. To investigate the sources of cooperation further, we conducted a simple multi-round public-goods game in 14 villages. We find that players who have been exposed to SHGs converge towards a cooperative equilibrium faster than those who have not. We also find that SHG women discount the risk of non-cooperation by others more than women in control villages. We conclude that SHGs and other membership-based organizations for the poor, where they promote collective action do so not by enforcing a commonality of tastes, but by reducing uncertainty surrounding cooperation.
a The authors gratefully acknowledge the cooperation of the Self-Employed Women’s Association (SEWA) and financial support of the Wolfensohn Center for Development at the Brookings Institution and Georgetown University’s Engaging India initiative. Surveys were conducted by Social and Rural Research Institute of IMRB, New Delhi. A previous version of this paper was delivered at the annual meeting of the American Political Science Association. Errors and omissions are the authors’ own. b Edmund A. Walsh School of Foreign Service and Department of Government, Georgetown University, Washington, D.C. and the Brookings Institution, Washington, D.C. Email: [email protected]. c Edmund A. Walsh School of Foreign Service, Georgetown University, Washington, D.C. Email: [email protected].
1
1. Introduction
Collective action – coordinated actions by groups of individuals who seek to achieve
common goal --- plays a critical role in the development of societies. Recent research suggests
that it also contributes to poverty alleviation: Collective action by the poor can strengthen
property rights (Baland and Platteau 2003; von Braun and Meinzen-Dick 2009), increase their
bargaining power in labor markets (Bardhan 2005), improve access to financial markets (Karlan
2007) and increase investments in public goods (Alesina, Baqir et al. 1999; Banerjee and
Somanathan 2007).
An important question from the standpoint of policy is where collective action comes
from, and why it emerges in some communities and not others. Rational choice models suggest
that collective-action is almost always difficult to achieve: contributions to the collective or
public goods are costly, but benefits shared by all, so individuals almost always face an incentive
to free-ride on the efforts and contributions of others (Olson 1965). Other research however,
illustrates that people are innately social and construct formal and informal social institutions to
reward collective action and punish free-riding (Bowles 1998; Ostrom 1998; Henrich et al. 2001;
Fehr and Gächter 2000; Ostrom 2000; Ostrom and Ahn 2009). Overall, this literature suggests
that collective action is likely to emerge under some key conditions: individuals must have low
costs of information, the opportunity to coordinate their actions, the opportunity to engage in
repeated interaction, and the power to reward contributors and punish free-riders. Given that
these constraints are often binding for the poor, it follows that almost everywhere, the poor
demonstrate lower levels of organization and collective action (Narayan, Patel et al. 2000;
Gugerty and Kremer 2008).
2
This paper examines whether external actors (such as NGOs) can lower the barriers for
collective action in poor communities. We focus on a group for whom the constraints for
collective action are likely to be particularly binding: rural women in one of the poorest districts
in North India. This group is characterized by some of the lowest levels of literacy, labor-force
participation and autonomy in the world (King and Mason 2001; Sen 2001; Sen and Dreze
2002).4 The practice of patrilineal inheritance, early marriage and large physical distances
between natal homes and marital homes limit women’s agency, bargaining power and capacity to
organize (Dyson and Moore 1983; Rosenzweig and Stark 1989). Moreover, rural communities in
North India remain highly divided along the lines of religion, caste and tribe, with low levels of
participation in civil society organizations (Chhibber 2001). These factors combine to make it
difficult for women to organize themselves spontaneously.
We examine the impact of organizing rural women into “Self-Help Groups” (SHGs),
which are “membership-based organizations” that are typically composed of 10-20 women who
meet routinely to save and coordinate their actions to meet common economic, political and
social objectives (Chen, Jhabvala et al. 2007). The intervention we study is facilitated by the
Self-Employed Women’s Association (SEWA) in the district of Dungarpur, Rajasthan within the
framework of a randomized control trial (RCT): 32 villages are provided services by the NGO
and 38 additional villages were selected as controls. The NGO lowered the barriers to collective
action in this community in several ways. Most importantly, door-to-door visits and group
meetings held by literate and educated SEWA field-workers provided local women with
information about opportunities for saving, credit, employment and access to government
schemes. They also assisted with the gathering of documents, filling up of forms, filing of
4 Adult female literacy currently stands at 51 percent for women and 76 percent for men (World Development Indicators, 2012). These numbers are generally lower, and the gender-gap larger, in rural areas.
3
applications, interactions with local government officials, etc. Field workers also supported the
groups by reminding women to attend meetings, motivating them to work together, arbitrating
disputes, and providing routine counseling. While groups were trained to elect their own leaders
and govern themselves, field workers provided constant oversight of the process to ensure that
rules were adhered to. This ensured that heterogeneous women were able to work together
towards a common goal and avert the problem of free-riding. In some instances, the NGO was
also able to provide women with additional supports such as child-care services, employment
training programs, leadership training programs, etc.
The paper makes three contributions. First, it demonstrates that through such programs,
external actors can indeed lower the barriers for collective action among individuals who are
economically, politically and socially marginalized. Second, it demonstrates that the programs
themselves can contribute to broad improvements in well-being. Data from baseline and end-line
surveys are used to illustrate that the intervention had a wide range of impacts not only for the
women who participated, but for all women in a village where programs were present. Following
two years of exposure to SHGs, women in treatment villages were more likely to participate in
group programs, had acquired greater “personal autonomy” (including greater control over
household decision-making), had taken collective action on issues such as the drinking water
supply, and were more likely to be knowledgeable of and involved in community affairs, than
their counterparts in control villages.
A third contribution of this paper is to investigate the channel through which the
intervention may encourage collective action. We hypothesize that repeated social interaction
within SHGs increases intra-group trust and thus makes cooperation a self-reinforcing
equilibrium. We test this hypothesis by conducting a basic, repeated public-goods game played
4
with groups of 8 – 14 women in several treatment and control villages. Although group members
in both treatment and control villages converge towards a cooperative equilibrium, we find that
women in SHG treatment villages do so at a faster rate than women in control villages. There is
also less inequality in final payouts across players in SHG villages. We infer that SHGs improve
well-being not by promoting the convergence of individual preferences, but by reducing
The remainder of this paper is organized as follows. Section 2 presents a review of
related literature on self-help groups in India. Section 3 describes the research setting and
provides an overview of the intervention. Section 4 presents the empirical results of the impact
evaluation of the SHG program by comparing outcomes in treatment and control villages
between 2007 and 2009. Section 5 explores the behavioral aspects of collective action by
presenting the results of experimental games played in treatment and comparison areas. Section 5
concludes.
2. Background: Self-Help Groups in Rural India
SHGs are “membership-based organizations”, i.e. organizations whose members provide
each other with mutual support while attempting to achieve collective objectives through
community action (Chen, Jhabvala et al. 2007). A typical Indian SHG consists of 10-20 poor
women from similar socio-economic background who meet once a month to pool savings and
discuss issues of mutual importance. They are facilitated by NGOs, the government, and in some
cases, even the private sector. Facilitators typically oversee the operations of the group and
“link” women to formal institutions such as banks or government programs. They often add on
other services such as childcare services, extra-curricular programs for school children, and job-
5
training programs. SHGs also have important social functions: they may serve as a platform to
address community issues such as the abuse of women, alcohol, the dowry system, educational
quality, inadequate infrastructure, etc.
The focus on women is critical to the SHG movement. More than 80 percent of all Indian
SHGs are women-only (NABARD, 2011). This is for several reasons. First, a vast literature that
now demonstrates that public investments in women empower them to make choices that benefit
not only them as individuals, but also their families and communities (Schultz 1995; Nussbaum
2000). Second, there is also evidence that women are less risky borrowers, and more responsive
to the threat of social sanctions that form the basis of recent group lending schemes (Armendáriz
and Morduch 2005). Third, this policy reinforces other policies that aim to improve women’s
participation in local politics in India. A third of all seats in democratically elected village-
institutions are now reserved for women. In some cases, this leads to policy decisions that better
reflect women’s preferences (for example, the prioritization of drinking water), but there are
plenty of cases where women serve as “token” appointments and their authority is limited by
dominant elites (Chattopadhyay and Duflo 2004; Ban and Rao 2008). Investments in SHGs are
often cited as an investment in grass-roots democracy.
Women’s SHGs have been heavily promoted by the Indian government, particularly in
the southern states since at least since the 1980s (Galab and Rao 2003; Deshmukh-Ranadive
2004; Reddy and Manak 2005; Basu 2006; Chakrabarti and Ravi 2011). One of the largest
microcredit operations in the world – the SHG linkage program – links these groups to formal
credit providers (NABARD, 2011). Several large development programs, such as the Integrated
Rural Development Program (IRDP), the Swarnjayanti Gram Swarojgar Yojana (SGSY) and
most recently, the National Rural Livelihood Mission (NRLM) have provided a wide range of
6
benefits to these groups. The NRLM in fact envisions eventually mobilizing all rural, poor
households into SHGs and producer groups in the states of Bihar, Chhattisgarh, Jharkhand,
Madhya Pradesh, Orissa, Rajasthan, and Uttar Pradesh—some 150 million citizens—by the year
2015 (Planning Commission 2011).
Despite the large scale-up in the number of SHGs in India in recent years, the impact of
these groups on the lives of women remains poorly understood. Efforts to measure impact are
typically constrained by the non-random placement of programs, the non-random assignment of
individuals to groups and wide variations in the methods employed by these organizations. A
recent report studied 214 SHGs in 108 villages across two northern and two southern states
(Sinha 2006). The study found that SHGs indeed promoted collective action and succeeded in
organizing women. In 25 percent of SHGs, a woman ran for local political office. 30 percent of
SHGs were involved in community actions such as improving community services (43 percent of
the total actions, including water supply, education, health care, veterinary care, village road),
trying to stop alcohol sale and consumption (31 percent), contributing finance and labor for new
infrastructure, (12 percent), protecting natural resources and acts of charity (to non-members).5
25 percent of groups also undertook a joint enterprise, joint production or joint marketing
exercise. The study however, has some important limitations because it only focuses on a select
sample of groups that were formed in the 1990s and persisted for several years. Groups were
chosen by the facilitating NGOs and may not be representative of SHGs in general and
communities in which they were established may also not be representative of rural-India in
general.
5 The authors do not include activities such as cleaning the village before village functions – which community leaders increasingly find SHGs useful for. Nor do they include general participation in campaigns or rallies - pulse polio, literacy, anti-dowry, for example – for which SHGs are becoming a means of mobilizing women.
7
A set of recent studies has also focused on SHGs in the state of Andhra Pradesh, which
accounts for 40 percent of all SHGs in India (Galab and Rao 2003; Aiyar, Narayan et al. 2007).
Several studies have evaluated the Velugu program, which was an SHG program implemented by
the State via an independent organization that was headed by the state’s Chief Minister. While
the program’s core involved microfinance and SHG-Bank linkages, it also included additional
features such as the establishment of grassroots institutions, the provision of community
investment funds, and the training of SHGs to address social problems such as child labor,
gender inequalities and caste inequalities. The program was widely touted as increasing incomes,
reducing poverty, improving women’s participation in household decisions and civic
engagement (Aiyar, Narayan et al. 2007) but we are not aware of a rigorous quantitative
evaluation.
The most rigorous attempt to evaluate SHGs comes from Deininger and Liu (2009) and
also focuses on Andhra Pradesh. The State government together with the World Bank began
promoting SHG formation through the bank-linkage model in the 6 poorest districts of Andhra
Pradesh in 2000 and subsequently to the remaining districts 3 years later. In addition to providing
only credit and savings as previous SHGs had done, these SHGs also provided in-kind food and
access to insurance. The authors use data from household surveys conducted in 2004 and 2006 to
conduct propensity score matching and construct difference-in-difference estimates. Estimates
from propensity-score-matching methods suggest that program had three main impacts: increases
in social capital and economic empowerment, nutritional improvement (despite persistent
drought at the time), and an increase in consumption for participants of new groups. The findings
did not, however, find increases in income or assets, but interestingly, the effects were not
limited to group members, indicating spill-over effects for communities in which SHGs were
8
formed. Estimates from difference-in-differences, constructed by exploiting the timing of the
program roll-out suggested that exposure to the program over 2.5 years resulted in higher
consumption, nutrition levels, and asset accumulation for poor participants. Spillover effects
were not observed when these methods were used. The main limitation of this analysis however,
is the central assumption that women that received the program early on (poorer clients) were
fundamentally similar to those that received the program in the second roll-out. Propensity-score
matching methods can only “match” on a few observables, while selection may be driven by a
wide range of unobserved attributes such as social status, prior exposure to outside institutions
and the level of cooperation and support received by a woman from her husband and in-laws.
Some recent literature also examines the organizational structure of the groups
themselves. Some research shows that the inequality and heterogeneity of participants can affect
the stability of groups, and/or the incidence of “elite capture” (Lanjouw and Ravallion 1999;
Gaiha 2000; Mansuri and Rao 2004; Galasso and Ravallion 2005; Jha, Bhattacharyya et al.
2009). Most studies find that the problem is highly context-specific and varies widely across
programs, levels of government, countries, and regions. The risk of elite capture is particular
strong in India however, considering that rural India remains highly stratified and divided along
the lines of caste, class and gender. A recent paper by Jha, Bhattacharyya et al. (2009) for
example, find that the size of landholdings in a targeted population is a negative predictor of
participation in the National Rural Employment Guarantee Program (NREGP) in the Indian state
of Rajasthan, but the opposite pattern is observed in the state of Andhra Pradesh. Comparisons
of land inequality, ratio of NREG and slack season agricultural-wage rates, political interference,
and geographical remoteness across the two states suggest that the extent of program capture,
and the identity of those who are able to capture, may vary between the two states.
9
Some fundamental questions about SHGs, however—such as whether they succeed in
mobilizing women and in alleviating poverty—remain unanswered, including their impact on
access to public goods and their effects on cooperative behavior among women. The extent of
elite capture for programs aimed at women in particular also remains poorly understood. In the
next section, we describe our intervention to study these issues.
3. Context and Experimental Design
3.1. Setting
Research was conducted in Dungarpur district of Rajasthan, India, a largely rural district
of 1.1 million located on the southern “tribal” belt between Rajasthan and Gujarat. The
population is largely composed of members of “scheduled tribes”—one of the politically least-
mobilized groups in India.6 Levels of socio-economic development in Dungarpur are quite low
relative to the rest of Rajasthan, which is already one of the lowest in India. In 2005 the per
capita income of Dungarpur stood at Rs. 12,474 (approximately $312) compared to the state
average of Rs. 16,800 (approximately $420). 21 percent of the population lives below the rural
poverty line (Government of India 2009). Literacy levels are only 66 percent among men and 31
percent among women. 76 percent of the population is engaged in agriculture (Census of India,
2001). In 2004, the Indian Planning Commission included Dungarpur in its Backward Districts
Initiative which aimed to address the problems of low agricultural productivity, unemployment,
6 65 percent of Dungarpur’s population belongs to scheduled tribes, with the highest concentration in the South of the district. The dominant tribe here is that of the Bhils. This tribe’s occupancy in the Aravalli range (one of the oldest mountain ranges in the world) is said to date back to 4000 BC (Government of India 2009).
10
and to fill critical gaps in physical and social infrastructure through the efforts of both the central
and state-level government interventions in the 100 least-developed districts.7,8
In 2007, district authorities invited a well-known NGO with a long history of establishing
SHGs in Gujarat, the Self-Employed Women’s Association (SEWA). SEWA, founded as an
offshoot of the Textile Labor Association by the activist Ela Bhatt in 1972, is a trade union for
informal-sector women. SEWA claims a membership of over 1 million women in 7 states of
India. Its main mission is to organize women to help them achieve economic independence
through “self-reliance”(Chen 1991; Datta 2000; Bhatt 2006).9
3.2. Program
SEWA began a rollout of a rural SHG development pilot—known as the “Sustainable
Livelihoods” project—in Dungarpur district in late 2007. All villages on the census listing for
Dungarpur were stratified according to average female literacy rate, total village population, and
average household size. From these strata, 32 villages were randomly selected for the SEWA
program, 48 villages selected as control villages (80 villages in total). The rollout of the program
proceeded in several steps. First, all women in a village were invited to become members of
7 The identification of backward districts within a State has been made on the basis of an index of backwardness comprising three parameters with equal weights to each: (i) value of output per agricultural worker; (ii) agriculture wage rate; and (iii) percentage of SC/ST population of the districts. 8 A sum of Rs. 15.00 crore per year (approximately $3 million) will be provided to each of the districts for a period of three years i.e. a total of Rs. 45.00 crore (approximately $9 million) per district. 9 SEWA’s definition of self-reliance encompasses more than employment and economic independence, and includes women’s ability to make independent decisions and have a voice at home and in their communities. Collective action is central to this mission. A recent annual report summarizes this as follows: “Self-employed women must organize themselves into sustainable organizations so that they can collectively promote their own development. They can be organizations at the village level, at the district level, at the state level, at the national or international level. They can be registered as co-operatives, societies, producers associations or even remain unregistered. Their members may be self- employed women directly, or primary organizations of self -employed women (SEWA 2008: 12)”.
11
SEWA by paying a nominal fee of Rs. 5 (approximately $0.10).10 Members participated in a full
day of basic training programs that were intended to create a sense of unity and direction, and an
understanding of SEWA’s objectives. SEWA members were then organized into SHGs. These
groups typically consist of groups of 10 – 20 women with an elected leader. All these activities
were led by SEWA field workers: two local married and educated women with 12 years of
education who are highly regarded by the local community. These field workers report to a
SEWA coordinator, who works from the SEWA office in Dungarpur town. The team of SEWA
workers made considerable attempts to ensure that the intervention was participatory and socially
inclusive. They held open meetings, disseminated information along local networks (for
example, through school teachers, health care workers, government employees, home visits
based on official lists of individuals who fall below India’s nationally poverty line) and held
meetings with community leaders to spread information and ensure that the poorest women were
able to participate.
Once SHGs were formed and leaders were elected, participants would meet once a month
and set savings targets of Rs. 25 – 100 each. These were deposited into a savings account at an
SHG-linked bank. SHG meetings were also used to discuss other issues—details of job training
programs, motivational messages, the importance of participating in local government, etc. SHG
leaders were trained to manage the group, maintain minutes of meetings, manage group
accounts, and monitor the group’s activities. All meetings were attended by SEWA field
workers, who provided women with information about government schemes/programs and their
eligibility for those programs. Since most women were illiterate, they also helped with other
10 Recruitment of members is carried out by making announcements about SEWA at village Panchayat meetings, and/or private meetings with educated and influential members of the village who then spread awareness about SEWA’s programs. SEWA volunteers and employees also meet with randomly selected women in the privacy of their homes, encourage them to join SEWA and spread awareness about SEWA programs among friends and family.
12
activities such as recording minutes of the meetings, assisting in necessary activities such as
filling out all necessary paperwork at the local bank and/or arbitrating in the event of any dispute
between the women. In addition to these activities, SEWA also conducted educational programs,
job-training programs and employment/income-generation workshops. These programs were
always open to all women in a village, not just SEWA members. They were almost always very
well-attended. All meetings emphasized the importance of collective action and encourage
women to engage in community issues.
4. Program Impact: Results using Survey Methods
We measure the impact of SEWA programs on all women in our sample who reside in
villages where SEWA programs were implemented. We use this measure of “treatment” rather
than a direct measure of actual participation in SEWA programs, mainly because the intervention
was randomized at the level of the village (rather than at the individual level), and we wish to
avoid the problem of estimating the program’s impact on the self-selected group of participants.
This strategy is also motivated by two additional reasons. First, low female mobility causes
women’s networks in rural North India to be highly localized and concentrated in their villages
of residence (Dyson and Moore 1983; Jeffrey and Jeffrey 1996). New information introduced
into a single village can diffuse along such social networks quite quickly, leading to the rapid
spread of information and social learning (Munshi 2007).11 Second, SEWA’s integrated
11 Diffusion is likely to be particularly strong in Dungarpur, where we observed that villages were typically quite small (<1000 people), villages were often physically separated by hills and inter-village transport was often restricted to narrow dirt-tracks.
13
approach is designed to promote spillovers in rural communities and change prevailing attitudes
of both men and women of communities.12
Baseline and follow-up surveys of the study area were conducted in 2007 and 2009.
These form a pooled cross-section with treatment and control samples. The sample of treated
women includes a total of 1,410 women who resided in the villages where SEWA programs were
in place. 748 of these women were interviewed in the 2007 baseline and 662 interviewed in the
2009 follow-up. The sample of control women includes 1,795 women who did not reside in
SEWA villages over the two year period, with 855 interviewed in 2007, 940 in 2009.13
4.1. Outcomes of Interest
Based on past studies of SHGs, other participatory programs, and other poverty-
alleviation programs in India that are focused on marginalized women, we expect the SHG
program to have wide-ranging effects on economic, political and social indicators.
Savings and Labor Force Participation
In the long-run, participation in SHGs could be expected to increase income, assets and
labor force participation rates. In the short-run however, which is the focus of this paper, we
expect the presence of SEWA programs to increase women’s participation in group programs
that are aimed at increasing saving, access to credit and employment. We measure participation
as a simply dummy variable that takes value 1 if a woman reports any participation in such
12 Non-members are always invited to participate in SEWA activities and members are encouraged to draw non-members into collective activities whenever possible. Moreover, women are encouraged to participate in local politics and community events, where information about SEWA programs is often highlighted. 13 These villages may have other SHGs besides SEWA’s operating but none received SEWA’s Sustainable Livelihoods intervention. 5 villages that were originally designated as treatment villages were reclassified as control villages because SEWA programs were not implemented till after the completion of the follow-up survey in December 2009. The delay in establishing programs in these villages is attributed to the presence of another NGO that was operating in these villages. All results in this paper are robust to the exclusion of these villages from the sample completely.
14
programs and 0 otherwise. Women in treated villages are also expected to save more (within or
outside a saving group). For this, we define binary variables coded 1 if the woman reports that
she saves money each month and 0 otherwise. Since SHGs seek to increase female participation
in the labor force, we also define two binary labor-participation indicators—relating to the
general workforce, and the agricultural sector—coded 1 if a woman is employed, and coded 1 if
she is employed in agriculture, and 0 otherwise.14
Household Decision-Making
If SHG membership raises a household’s current and future income by increasing labor
participation and returns on savings, we expect the presence of SEWA programs to increase
women’s decision-making autonomy within their households. Higher wages also increase the
opportunity costs of woman’s time, lowering the demand for children and the likelihood of
contraceptive use. We thus examine respondent’s involvement in three types of decisions:
children’s schooling, medical decisions, and family-planning. We define dummy variables that
take value 1 if a woman reports that she is able to make independent decisions in these matters
and 0 otherwise.
Further, we hypothesize that access to a female “safety-net” in the village should increase
women’s participation in these types of decisions, even if she is not directly a member of the
group. We measure this using dummies that take value 1 if a woman reports that she has a “final
say” in matters of children’s schooling, family medical decisions, and the practice of family-
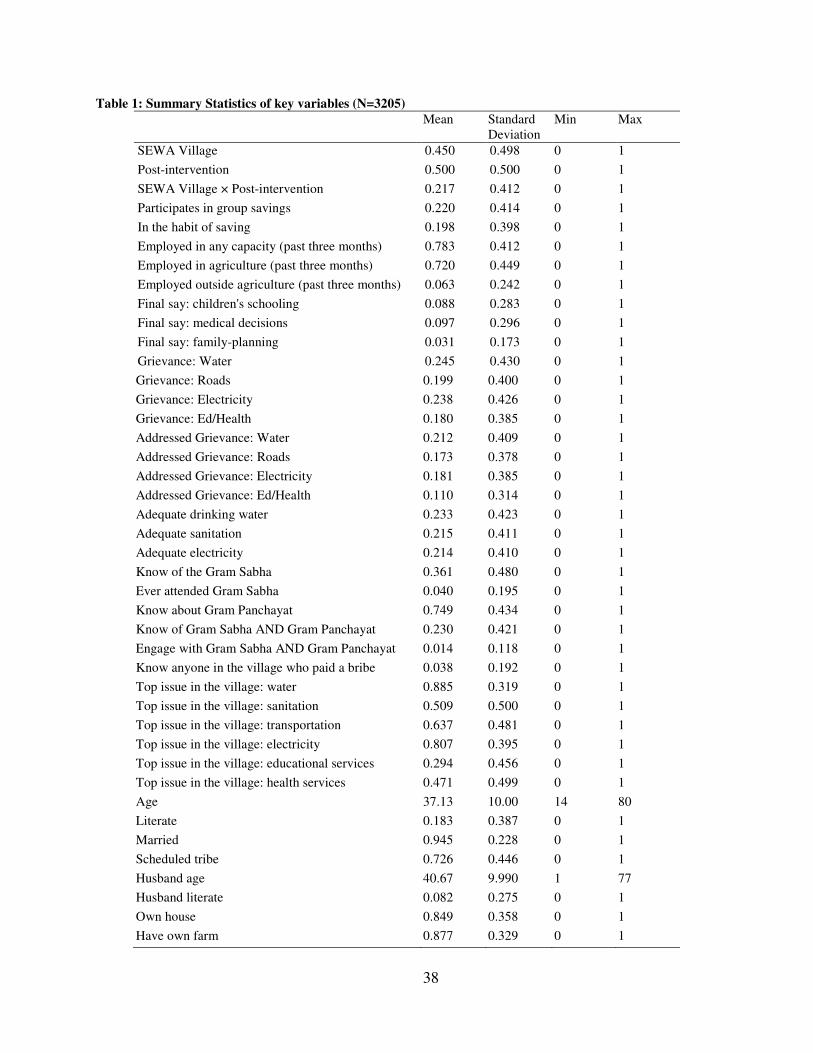
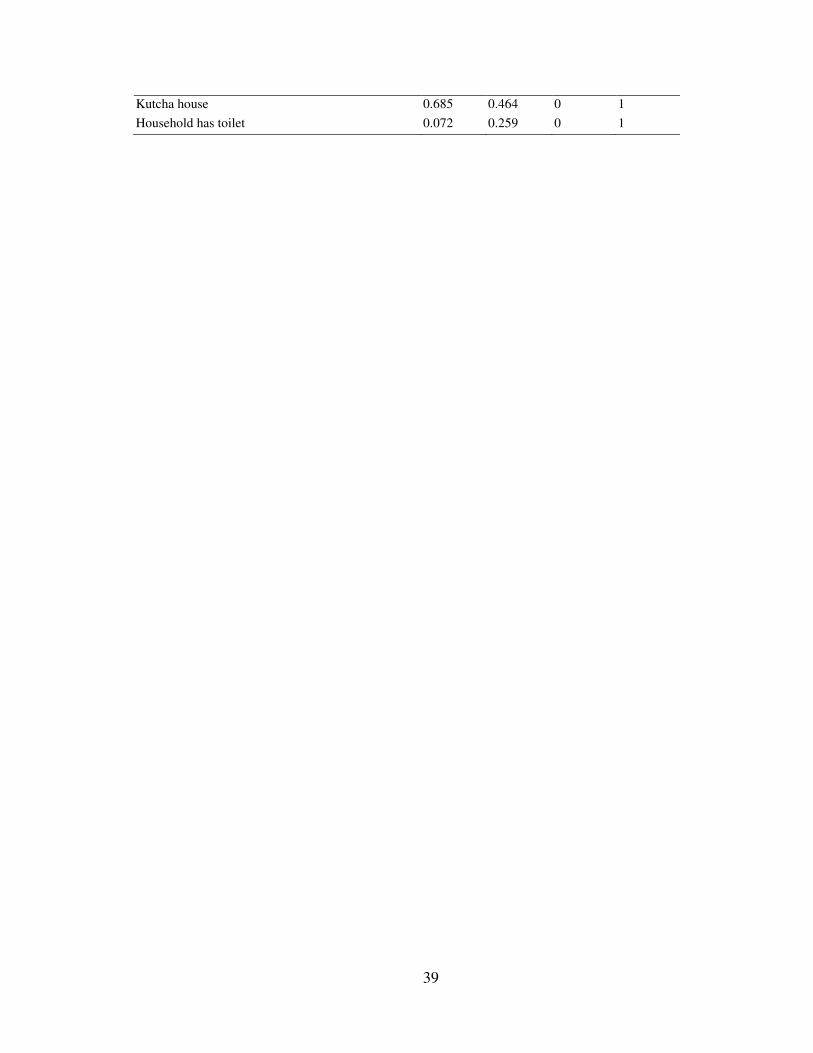
planning, and 0 otherwise. Summary statistics of all variables are presented in Table 1.
14 We do not consider measures of income or asset holdings mainly because the gap between our baseline and endline surveys is only two years. Many groups took several months to establish and begin their operations and thus became eligible to receive credit and other benefits from poverty-alleviation programs at different times. We plan to explore this further in the next round of our survey, expected next year.
15
Civic Inclusion and Engagement
SEWA programs disseminate information about local institutions, governmental
programs, policies and procedures. In other words, they lower the cost of accessing information
regarding community issues. We measure respondents’ knowledge of where to report four types
of grievances: problems with water/sanitation, poor road conditions, faulty electricity supply, and
inadequate education and health services (all variables take value 1 if the woman knows where to
report a grievance in the village and 0 otherwise). We also measure whether she has actually
approached authorities to report a complaint and demand improvements in delivery, again using
a variable coded 1 if the woman reports that she has reported a grievance at least once in the
preceding two years, 0 otherwise.
We also test the hypothesis that participation in SHGs expands women’s knowledge of
authority structures in the village and motivates them to redress grievances about public issues.
We measure this in three ways. First, we examine women’s knowledge of where to report five
types of grievances: water/sanitation, road conditions, electricity supply, education services, and
health services. These variables take value 1 if the woman knows where to report a grievance in
the village and 0 otherwise. Second, we examine whether women are aware of bribes being
collected from villagers by public officials, coded 1 if they personally know someone who has
been asked to pay bribes, 0 otherwise. Finally, we also measure women’s participation in the
main local governmental institutions, the Gram Sabha and Gram Panchayat.15 These are
15 The Gram Panchayat is the local governing body of a village or small town in India. It is the foundation of India’s system of grass-roots governance. It is generally composed of 7 to 31 members and performs functions such as the resolution of local disputes, the implementation of development schemes for the village, the establishment of primary health centers and primary schools, arrangements for clean drinking water, drainage, and the construction and repair of roads. The Gram Sabha is composed of all men and women in the village who are above 18 years of
16
measured by two dummies. The first takes value 1 if the respondent knows of the Gram Sabha
and the Gram Panchayat and 0 otherwise. The second takes value 1 if the woman has ever
engaged with both institutions (by attending meetings and/or interacting panchayat members
outside of meetings) and 0 otherwise.
Public Goods Satisfaction
We examine reported changes in levels of satisfaction with public services. We focus on
the same set of public goods that we examined when considering their knowledge of grievances
and actions taken to address grievances: access to drinking water, electricity, roads and quality of
institutions for health and education. Our survey asked women whether the state of each of these
services was “very bad,” “bad,” “somewhat good,” or “very good.” To measure satisfaction, we
define a binary variable that takes value 1 if a woman reports that a particular service is
“somewhat good” or “very good” and 0 otherwise. We expect public services to improve in
villages with strong SHG participation, on the assumption of enhanced bargaining strength vis-à-
vis service providers. However, we are unable to identify whether improvements occurred
because women succeed in taking public action (as measured above) or because local
governments make a greater effort to improve service-delivery.
Summary statistics of all variables used in the analysis, across both treatment and control
areas, and both before and after the intervention, are presented in Table 1.
age. Meetings of the Gram Sabha are usually convened several times a year. In Rajasthan they are typically held twice a year. The agenda typically includes the annual budget, the development schemes for the village, and where necessary, individual difficulties or grievances of the people of a village. The Gram Sabha plays a critical role in holding government institutions, particularly local panchayat members, accountable.
17
4.2. Pre-Program Differences
Establishment of a causal relationship between the SEWA program implemented in late
2007 and the observed outcomes in 2009 requires an analysis of pre-program differences
between treatment and control villages. If for example, the two areas differ in characteristics that
are associated with improvements in socio-economic well-being before or after the program was
established in 2007, estimates of the SEWA program could be biased.
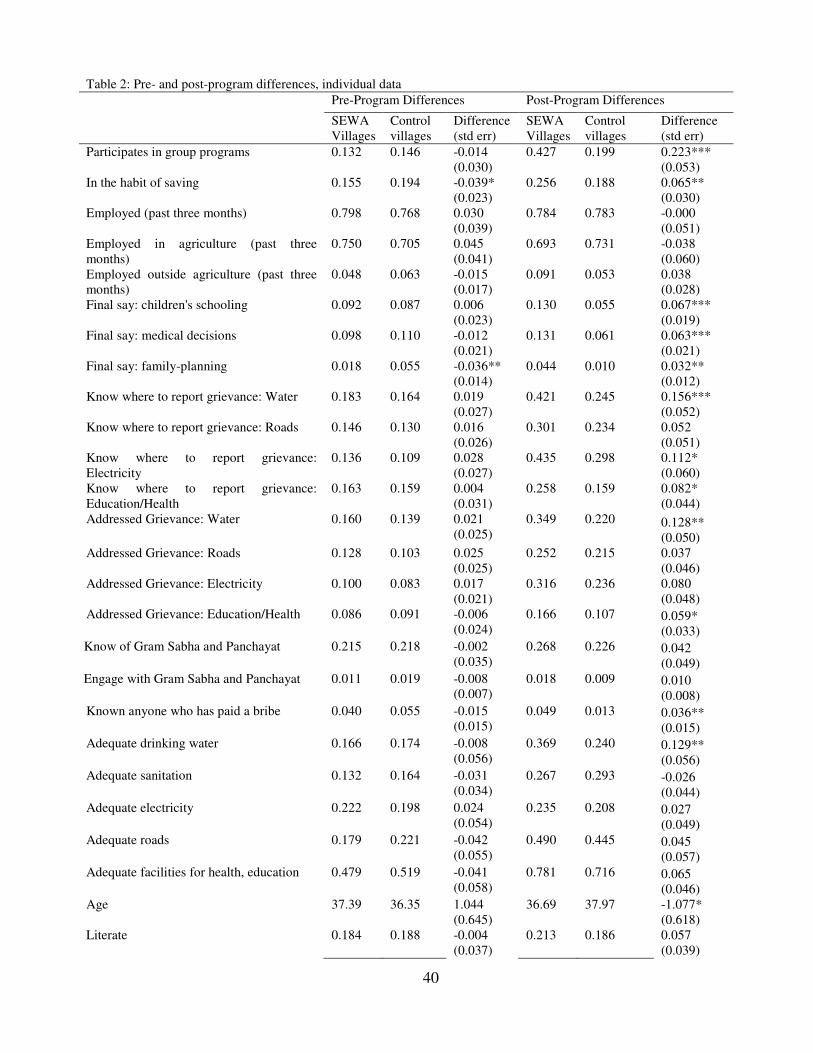
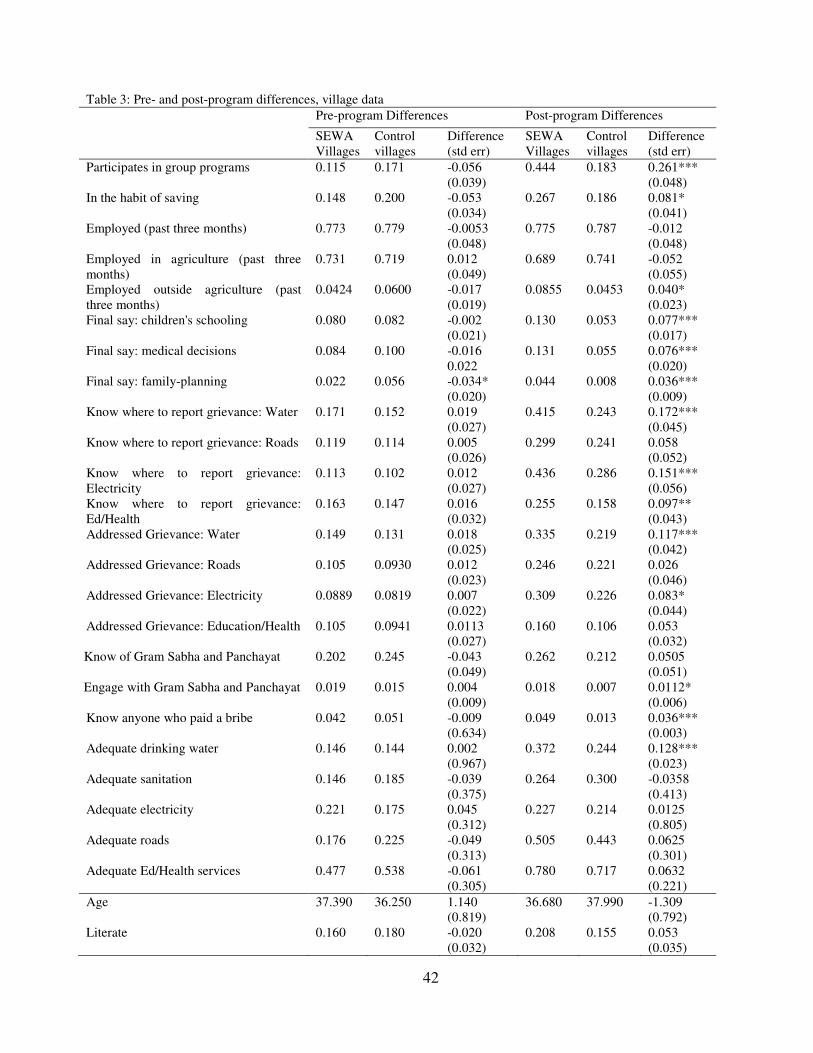
Comparisons of pre-program characteristics are presented in the first three columns of
Table 2 (individual-level estimates) and Table 3 (village-level estimates). Estimates in column 3
in each table contain the difference in mean outcomes between treatment and control populations
prior to the treatment. Estimates are obtained from weighted regressions with robust standard
errors clustered at the village-level. Note there is no evidence that the treatment villages had
more SHGs prior to the arrival of SEWA. There is also no systematic difference in women’s
schooling, labor-force participation or involvement in SHGs prior to the program. We do
however, note some other pre-intervention differences. Estimates in Table 2 illustrate that
women in SEWA villages were less likely to be in the habit of saving prior to the program, were
more likely to participate in the agricultural workforce, had lower levels of participation in
family-planning decisions, higher levels of satisfaction with electricity services and lower levels
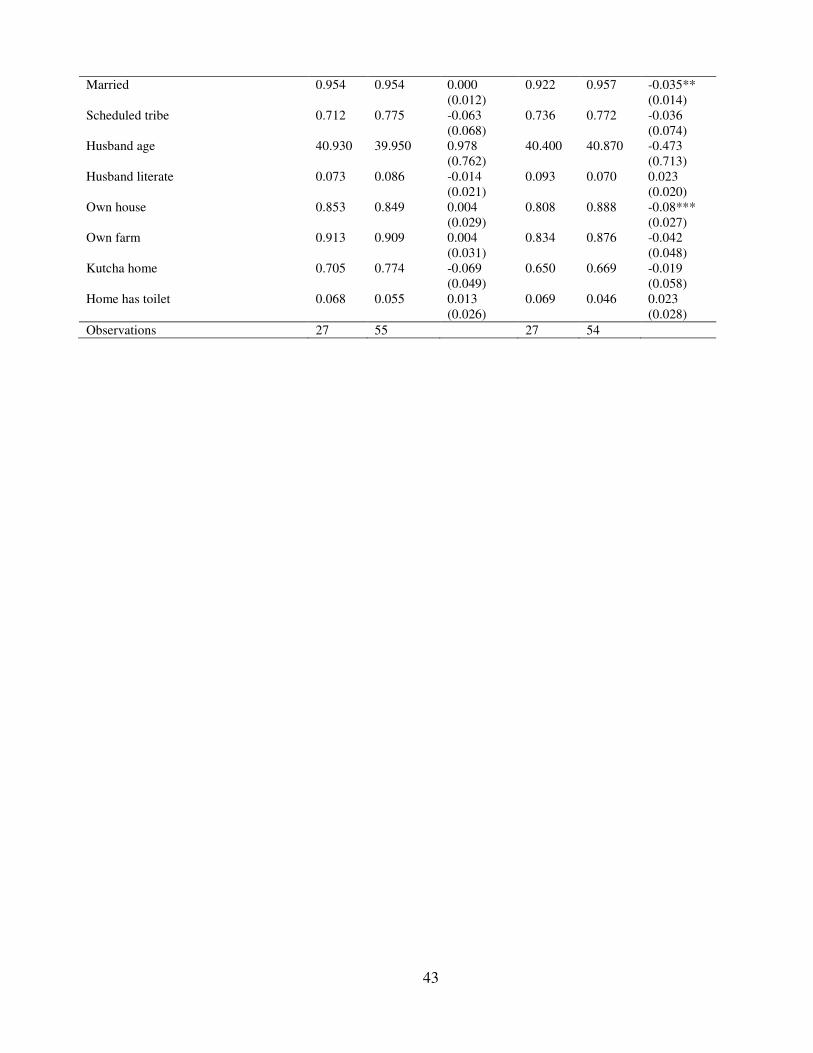
of satisfaction with sanitation services. Our selected sample in SEWA villages was slightly older,
belong to ST groups and reside in kutcha houses. These estimates, however, disappear when
looking at village-level averages (Table 3), indicating that these initial differences may be driven
by a small number of distinctive villages. We also present results that control for these, and
other, possible factors.
18
4.3. Estimates of Unconditional Impact
We begin by comparing women who reside in the treatment villages with those
who reside in the control villages before and after the intervention. Unconditional estimates of
the program’s impact are presented in Columns 5 – 7 of Table 2 (individual-level estimates) and
Table 3 (village-level estimates). Estimates in column 6 in each table contain the difference in
mean outcomes between treatment and control populations after the treatment. Estimates are
obtained from weighted regressions with robust standard errors clustered at the village-level.
Note from Table 2 that treated individuals did not significantly differ from their untreated
counterparts prior to the SEWA programs, but after the program SEWA members are
significantly different in several ways. They are 22 percent more likely to participate in group
programs and 7 percent more likely to save regularly (Table 2). These estimates are significant at
the 1 percent and 5 percent level respectively.
Differences in employment however, are negligible. There is no overall effect on
employment, and though about 4 percent of women report shifting away from agricultural to
non-agricultural employment, the effect is not statistically significant. In the case of village-
level averages (Table 3), the positive effect of the treatment on non-agricultural employment is
of equal magnitude (i.e. 4 percent) but is statistically significant. The unconditional effects of the
program on employment are however, likely to be influenced by the presence of a large public
works program that was the outcome of the Mahatma Gandhi Rural National Rural Employment
Guarantee Act (NREGA) passed in parliament in 2005. The program is a job guarantee scheme
that provides a legal guarantee for one hundred days of employment in every financial year to
adult members of any rural household willing to do public work-related unskilled manual work
at the statutory minimum wage of Rs. 120 (US$2.39) per day in 2009 prices. The program was
19
rolled out in this area shortly after we began our intervention, and was popular in both treatment
and control areas. While the program appears to have benefitted both areas, we believe it is
important to condition on the presence of this program. This will be done later in this section.
Unconditional estimates of impact also indicate that SEWA programs strengthened
women’s participation in household decision-making. Treated women are 3--6 percent more
likely to have a say in decisions about children’s schooling and medical decisions as well as
decisions about family-planning (Table 2) and the effects are significant at the 1 percent level in
all but the case of the family-planning decision, which is significant at the 5 percent level. The
magnitude and significance of the coefficients are similar when constructed at the village level
(Table 3).
The results also indicate that women in treatment villages were more likely to know
about where to report grievances related to the failures of public services: these estimates range
from 16 percent for water, 6 percent for roads, 11 percent for electricity, and 8 percent for
education and health institutions. For the case of water, estimates are significant at the 1 percent
level. Treated women were not only more knowledgeable about where to report their grievances,
but also more likely to take action and actually report a grievance to the concerned authorities.
These estimates are 12 percent for the case of drinking water, 8 percent for electricity, 6 percent
for education and health services and 4 percent for roads. The estimate for water is significant at
the 1 percent level, and the effect for education and health services is significant at the 6 percent
level. Given the low levels awareness and action at baseline (Table 1), these are significant
improvements. The case of drinking water is particularly striking. On average, across our entire
sample in both periods, only 24 percent of women were aware of where to report grievances
about drinking water and only 21 percent of women had ever made the effort to report a
20
grievance to the authorities. Treated women in 2008 were thus 40 percent more likely to be
aware of where to report drinking water problems, and 60 percent more likely to take action in
the case of poor service delivery. This is a significant and important difference, particularly in
light of the fact that women in rural Rajasthan are responsible for fetching drinking water and
spend considerable amounts of time on this activity. Estimates regarding the levels of satisfaction
with public services further reinforce these results. Note that women in treatment villages were
13 percent more likely to report that the supply of drinking water was “Adequate”. The effect
was significant at the 5 percent level. Differential levels of satisfaction were smaller and not
statistically significant for other types of public services.
Estimates in Tables 2 and 3 also suggest that treated women were also more likely to
engage with local political institutions: they were 4 percent more likely to be aware of bribe-
payments within the village and this effect is significant at the 10 percent level. They were also 4
percent more likely to be aware of the Gram Sabha and Gram Panchayat and 1 percent more
willing to interact with these institutions. These effects are small and also statistically
insignificant, but we return to examining them in estimates of conditional impact in the section
ahead.
4.4. Estimates of Conditional Impact
Simple aggregate estimates of the program’s effect on households can be derived from a
where Yhvt is the outcome of interest for household h in village v in survey year t. SEWA
Village takes value 1 if the village is a village in which SEWA operates programs, Post-
intervention is a dummy variable that takes value 1 if the household was interviewed after the
treatment program, X is a vector of household and village-level control variables, µ is a block
fixed-effect16 and ejt is a standard disturbance. The variable that is of chief interest is the
interaction SEWA Villagev × Post-interventiont which captures the impact of residing in a
SEWA village after the intervention. Control variables include the respondent’s age, literacy,
marital status, household size, husband’s age and literacy, scheduled-tribe status, and dummies
for home/land ownership, kutcha (non-permanent) dwellings, and the presence of a toilet (as
proxies for income and assets that are likely to be unaffected by a two-year intervention). We
also include an indicator coded 1 if public-works programs from the National Rural Employment
Guarantee (NREG) program were operating within the village during the survey year, on the
assumption that presence of public works programs may affect village-level outcomes and may
measure the effectiveness of village-level institutions. Finally, given the subjective nature of
many of our dependent variables we include responses by women to questions about the quality
of roads to their village on the assumption that this should be invariant across village households.
The distribution of responses to this questions in equations including village-fixed effects, should
therefore closely proxy individual bias. We use a dummy variable that takes value 1 if she
reports that the village roads are either “bad” or “very bad” and 0 otherwise.
We omit the listing of control variables and present only the coefficients from treatment
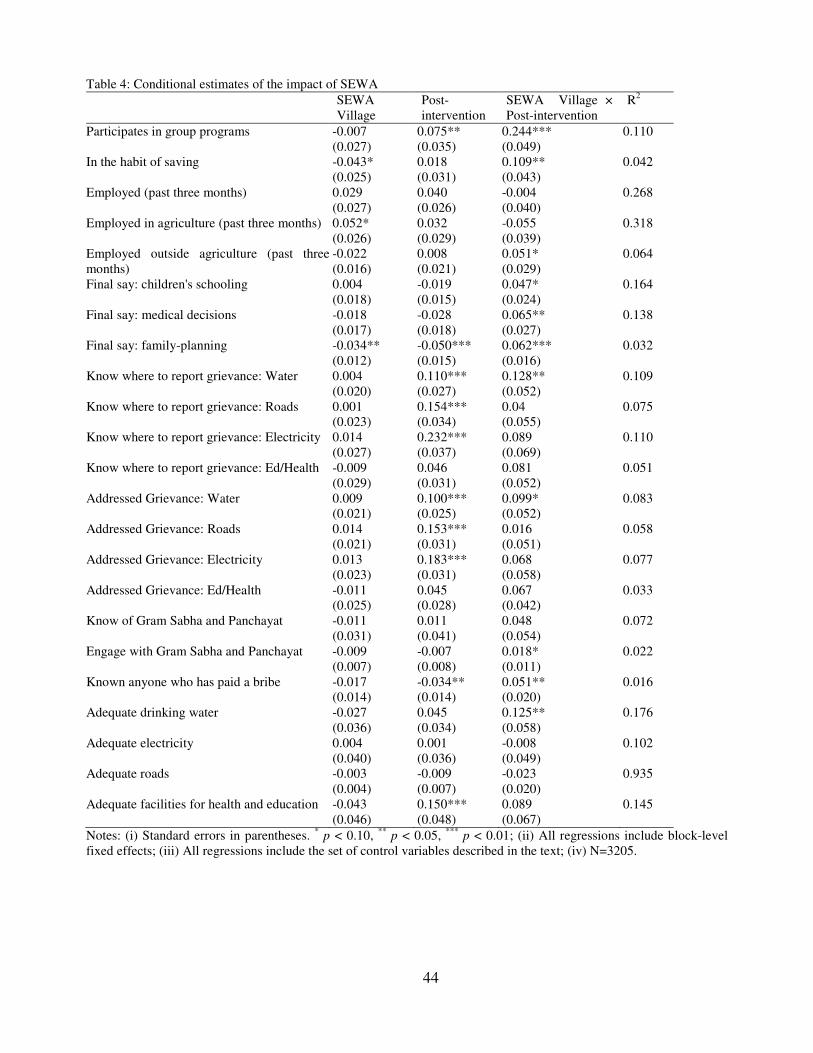
and post-intervention dummies, and their interactions in Table 4.17 Results confirm that two
16 Blocks, or tehsils are district subdivisions comprising multiple villages. In our sample, villages belong to one of three blocks. 17 These estimates are available from the authors on request.
22
years of exposure to SHGs resulted in improvements in several different aspects of well-being.
First, women who reside in SEWA villages were 24 percent more likely to participate in group-
savings programs and 11 percent more likely to be in the habit of saving money. The results are
significant at the 1 and 5 percent level respectively.
Unlike the case of the unconditional estimates, we now find that women were also more 5
percent likely to be involved in non-agricultural employment, and the effect is significant at the
10 percent level. Controlling for the presence of the NREG scheme strengthened this coefficient.
This possibly indicates that labor markets during the period of study were being considerably
transformed by the NREG program. We cannot rule out the possibly that the transformation
occurred at a different pace in treatment and control villages. 18 Anecdotal evidence from field-
workers as well as local government representatives suggests that the program was hugely
popular among women from both treatment and control villages and they chose to participate in
this program in large numbers. Both self-employment and entrepreneurship, already at very low
levels in Dungarpur, fell even further as a result. Other research also confirms that the program
was well-targeted in the state and did not suffer from the problems of elite-capture that have been
seen in other states (Jha, Bhattacharyya et al. 2009).
Results in Table 4 also confirm that women in treatment villages experienced benefits of
greater bargaining power within their households. Residence in a SEWA village is associated
with 4--7 percent greater likelihood of participation in household decision-making. The effect is
particularly noteworthy for family-planning decisions. Recall that prior to the program, women
18 In both 2007 and 2009, we observe no difference in either the intensity of the NREG program, or the timing of its rollout, between treatment and control villages, but it is possible that the program was rolled out quicker in group of villages.
23
in SEWA villages reported lower autonomy in such decisions relative to their counterparts in
control villages.
Next, we explore the conditional estimates of impact on knowledge of where to report
grievances, and a woman’s actions in actually reporting grievances. Results indicate that women
in treatment villages are 13 percent more likely to know where to report grievances regarding
water, and are also 10 percent more likely to have actually reported problems of water access to
village councils or district offices.19 It is also interesting to note that the conditional estimates of
program impact for other types of public goods are not significant. We interpret this as evidence
that women organize around issues that are of greatest relevance to them. Many other studies
from rural India have documented the salience of this issue: women fetch water in rural India are
consistently weight issues related to drinking water higher than issues with other types of public
services, particularly roads, since these primarily used by men in rural India (Chattopadhyay and
Duflo 2004; Joshi 2011). Interestingly, these patterns were not observed for any other type of
public services – sanitation, electricity, roads or facilities for health or education. In all those
cases, knowledge of where to report grievances, actual action on grievances and levels of
satisfaction with the services themselves measured no statistically significant impacts.
The results also indicate that women who resided in SEWA villages were 5 percent more
likely to know if anyone in the village had paid a bribe to either gain access to water for farming
or to public officials. Two years of exposure to the program also resulted in a slightly higher (2
percent) village-wide likelihood of interaction with the Gram Sabha and Gram Panchayat. The
magnitude of the impact is small, but it is possible that these are likely to intensify over time,
particularly as women from the SHGs themselves take advantage of their political opportunities.
19 The effect of SEWA programs is as strong as the effect of literacy on these outcomes.
24
In summary, the estimates of program impact suggest that two years of exposure to
SEWA programs resulted in a wide variety of “indirect” impacts for not only women who
participated in the groups themselves, but all residents of a village. Women in SEWA villages
are more likely to participate in group-savings programs, save money, obtain credit, have a final
say in decision-making within their households, know where to report grievances about drinking
water, seek to address grievances about drinking water, and know about local corruption. These
indirect benefits are larger and more significant than the program’s effects on employment or
income. This leads to an important question: how and why does participation in SHGs produce
these effects? We demonstrate in the next sections that SEWA is likely removing steep barriers
to intra-village coordination and facilitating cooperation. But first we demonstrate that exposure
to SEWA is not resulting in a convergence of preferences.
4.5. Heterogeneity of Preferences
A wide body of evidence indicates that social and political fractionalization is prevalent
in poor communities, and not merely in communities characterized by high levels of ethno-
linguistic diversity. In India gender disparities, religious, caste, and tribal divisions, and other
communal inequities are endemic even in relatively (ethnically) homogenous communities, and
these inequities are often reflected in public goods choices (Pande 2003; Chattopadhyay and
Duflo 2004; Hoff and Pandey 2006) We would expect, therefore, that any successful effort to
promote cooperation by SHGs would ultimately hinge on whether the heterogeneity of
preferences across individuals in poor areas can be managed.
In Dungarpur—as in other districts in the northwest tribal belt—a principal division is
between those who are members of tribes and those who are not. The reservation of seats in
25
panchayats for historically disadvantaged groups—Scheduled Castes (SC), Scheduled Tribes
(ST), Other Backward Castes (OBC), and women—has been a feature of political life since
1991, when the 73rd Amendment to the Indian constitution gave village governments the
authority and the resources to appropriate funds for local public goods. However, there are
notable differences between ST and non-ST groups. ST members, who are outside traditional
caste structures, are more economically marginalized than SC/OBC groups that are considered at
the bottom of the Hindu caste hierarchy (Banerjee and Somanathan 2007). More importantly,
tribal communities are among the politically weakest groups in India, and in contrast to SC/OBC
groups, have been slow to organize politically (Chandra 2005).20
Over two-thirds of both the district population and our sample are comprised of
Scheduled Tribes. We use ST information of survey respondents to determine whether the SHG
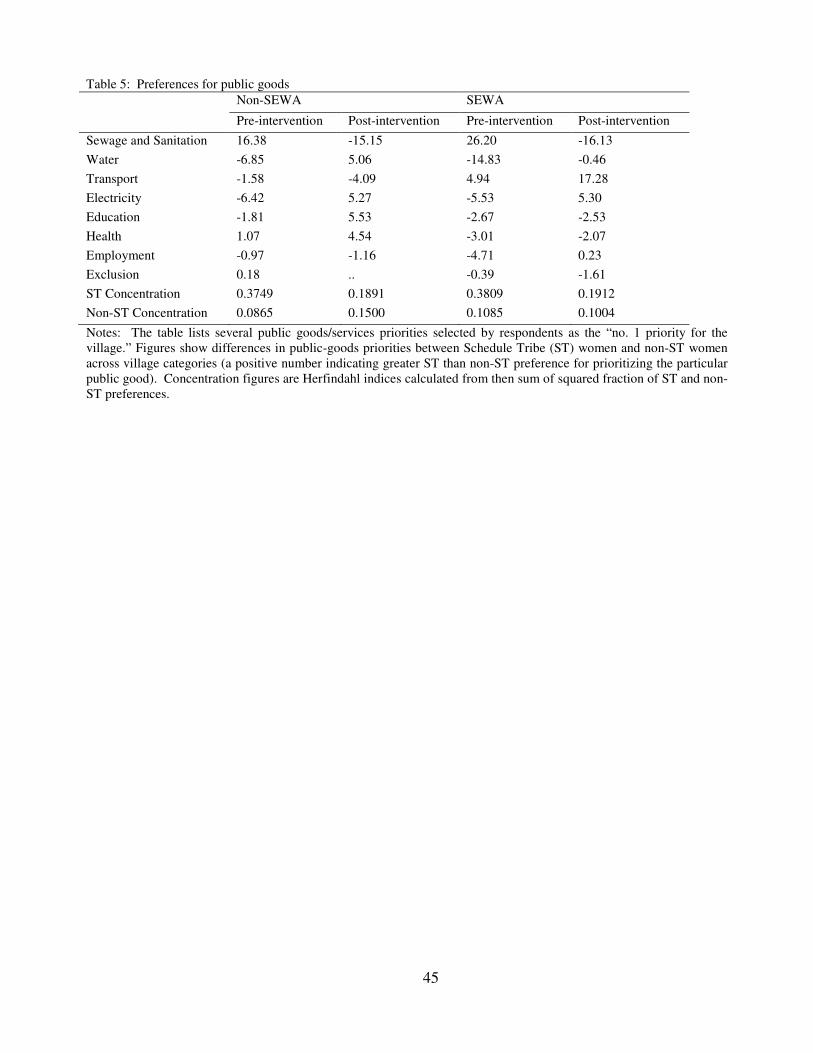
intervention has affected the diversity of public-goods preferences. Returning to the question of
principal concerns over public goods quality, table 4 examines the difference between ST and
non-ST choices for the “number one” concern, pooled across villages, before and after the
intervention. The figures in table 5 are the percentage of ST women listing any particular public
good choice as their first priority, less the percentage of non-ST women doing the same; a
positive number thus implies that a greater percentage of ST women selected the public good as
the village’s first priority than non-ST women.
These results show no discernible reduction of preference heterogeneity between these
groups. We see no greater narrowing of the spread between ST and non-ST preference regarding
public goods from pre-intervention to post-intervention periods when comparing treatment and
control villages. We also calculate a Herfindahl concentration index from the sum of the squared
20 In the 1990s the Bahujan Samaj Party (BSP) came to rule India’s most populous state (Uttar Pradesh) principally as an SC-based political party.
26
percentages of respondents that expressed preferences for any particular public good (a lower
number indicating a greater heterogeneity of preferences). ST respondents between the pre- and
post-intervention periods became more dispersed in terms of their public goods preferences, but
we see no difference between control and treatment villages, either within or across ST/non-ST
groups, between the two survey periods.
Although we see survey evidence that that SEWA programs were able to achieve to
encourage greater cooperation in terms of group activities, this does not appear to have been
accomplished through change in the diversity of preferences across members. In the next section,
then we follow up in a small number of surveyed control and treatment villages by conducting a
basic public-goods game in order to examine the underlying processes of cooperation that may
have emerged in such groups.
5. The Capacity for Collective Action: Results from Experimental Games
To assess the mechanisms that lead to cooperation among members of SHGs, we played
a variant of the threshold public-goods game (Davis and Holt 1993; Ledyard 1995; Eckel and
Grossman 2008). The combination of quantitative and qualitative research methods provides
insights into the impact of SHG participation on the mindsets and behaviors of participants in the
treatment villages.
5.1. The Threshold Public Goods Game
27
The game was implemented in each of seven treatment and control villages in 2011.
Female participants were randomly selected in each village.21 Group sizes ranged from 8 to 14
but were made comparable across treatment and control villages as much as possible. Game
players were briefly surveyed in order to obtain basic information regarding their age, socio-
economic status, education, and occupation. Differences between the characteristics of treatment
and control populations are presented in Table 5, showing no significant difference between the
players in treatment and control villages.
Each subject was assigned a number, to be used throughout the game to ensure
anonymity in the distribution of payouts. At the beginning of each round of the game, subjects
were given coupons worth Rs. 20 and were told that these would be redeemable for cash at the
end of the game. The players were then asked to place secretly any portion of the Rs. 20 worth of
coupons into an envelope on which their identifying number was written, which they would then
place into a box—explained to them as analogous to a village fund (Lok Phada). If the total
amount contributed to the fund exceeded a certain threshold, that amount would be doubled and
distributed back to the participants in equal amounts. If the threshold was achieved in the current
round, it would be raised by 20percent in the subsequent round, and increased steadily to a
maximum of N×20 – 20 where N is the number of players. If the combined contributions did not
exceed the threshold, all contributions were lost for that round. All contributions and
contributory decisions were made in secret as players were instructed not to discuss their actions
with others, and thus no formal monitoring or sanctioning of individual behavior by the group
21 In treatment villages, our research team established contact with local SEWA leaders (Agewans) through both phone-calls and site visits. These leaders were told about the research project and were asked to randomly select women for participation in the games. In control villages, our research team established contact with local government leaders such as panchayat members, female health workers and other local government representatives (ASHA workers, anganwadi workers, etc.). These leaders were also told about the research project and were asked to randomly select women who were not affiliated to any types of SHGs at all.
28
was allowed. Players were not told when the game would end. Each game was played without
revealing the number of rounds till the end of the game.
The stage game has two types of pure strategy Nash equilibria. In the first of these, each
player contributes zero. There are no incentives for any player to deviate unilaterally from this
strategy profile, even if by doing so the threshold would be met, since the amounts are
distributed back to all participants in equal shares irrespective of whether they contributed or
not.22 The second type of pure strategy equilibrium is a strategy profile such that the threshold is
just satisfied, and all players contributing a strictly positive amount get back at least as much as
they contributed. If the latter condition is not satisfied, then a contributing player would be better
off contributing nothing. On the other hand, there are no incentives for any player to contribute
any amount above the threshold since that amount would be shared equally with all other
players. We refer to this second type of equilibrium as a cooperating equilibrium, and there
generally exists many such equilibria with different combinations of contributions just satisfying
the threshold. However, only one co-operative equilibrium is symmetric in the sense that each
player contributes an identical amount.
In the repeated game, it is possible to use trigger strategies to sustain an infinite number
of equilibria, some of which involve even higher contributions. In the games we organized, the
participants did not know how many rounds would be played. This is typically treated formally
as a game with an infinite horizon (reference??). In such a game, a strategy profile in which all
players contribute their full amount as long as no other player deviates, and every player turns to
contributing zero after a deviation, is the welfare maximizing Nash Equilibrium as long as all
22 Strictly speaking, this statement requires that the number of participants exceed two, since the contributions are doubled.
29
players are sufficiently patient. The repeated nature of the game should thus in principle make it
possible to sustain a higher level of co-operation between the players.
This game and several variants of this game have been widely played in both classrooms and
field settings.23 Most of the research finds tremendous variations in the willingness of
participants to contribute to the public good. Early research focused on the one-shot version of
the game played among university students and found that contributions were 40--60 percent of
the Pareto optimal level (Marwell and Ames 1979; Marwell and Ames 1980; Marwell and Ames
1981). Contributions tended to be lower if the initial endowments were unequal than the case
where all participants had an equal endowment. In repeated games, it has been observed that
cooperation diminishes over time and contributions converge close to the Nash equilibrium level
or simply to zero (Isaac, Walker et al. 1984; Isaac, McCue et al. 1985). Contributions to the
public good are also known to be higher in the presence of thresholds or provision points
(Marwell and Ames 1980; Isaac, Schmidtz et al. 1989; Cadsby and Maynes 1998), with
homogeneous groups of female players (Cadsby and Maynes 1998), and an allowance for
communication between players (Isaac, McCue et al. 1985). Other factors, such as group size,
decision-costs, concepts of fairness, framing, etc. are all shown to matter as well, but there is
little agreement in the literature on the precise direction of the effects. Some recent work also
combines laboratory experiments on public goods with field experiments. (Laury and Taylor
2008) for example, found that individuals’ contributions to a public good in the laboratory were
not always able to predict their willingness to contribute to a public good in the naturally
23 A thorough review of this literature is beyond the scope of this paper, but some notable papers include (Nunn and Watkins 1978; Marwell and Ames 1979, 1980, 1981; M. Isaac, J. Walker, and Thomas 1984; J. Andreoni 1995; M. Isaac and J. Walker 1988; Davis and Holt 1993; Cadsby and Maynes 1998; Abbink, Sadrieh, and Zamir 2002; Hauert n.d.; James Andreoni and Petrie 2004; Semmann, Krambeck, and Milinski 2003). Reviews of the literature are found in (Davis and Holt 1993; Janssen and Ahn 2003).
30
occurring world. On the other hand, (Carpenter and Seki 2006) find that social preferences
exhibited in a public good game predict the productivity of fishermen in Japan. They find that
fishermen who behave more pro-socially in experiments are more productive.
Our analysis differs from any of the above-mentioned papers in a critical way: we are
focused on the differences between treatment and comparison areas. Since identical games were
run in both sets of villages, we are able to attribute the differences in outcomes between the two
sets of games to the treatment program and not to the structure of the game, innate behavioral
biases (such altruism or confusion about the rules of the game) or the framing of the game’s
rules.
We hypothesize that SEWA members and non-members will behave differently in these
group games. Since SEWA members have the greatest exposure to group participation,
understand the benefits of collective action and are accustomed to making decisions in groups of
women, we expect them to display higher levels of trust and contribute greater amounts to the
public-goods than their counterparts who are not members of SEWA. We also expect games with
SEWA members to display lower levels of inequality than games with non-members, since free-
riding is likely to be less common. Given our survey evidence on the externalities of SEWA
programs, we also expect that non-members in SEWA villages will behave similarly to SEWA
members. We expect even this group to show higher levels of cooperation than their counterparts
in control areas.
5.2. Results
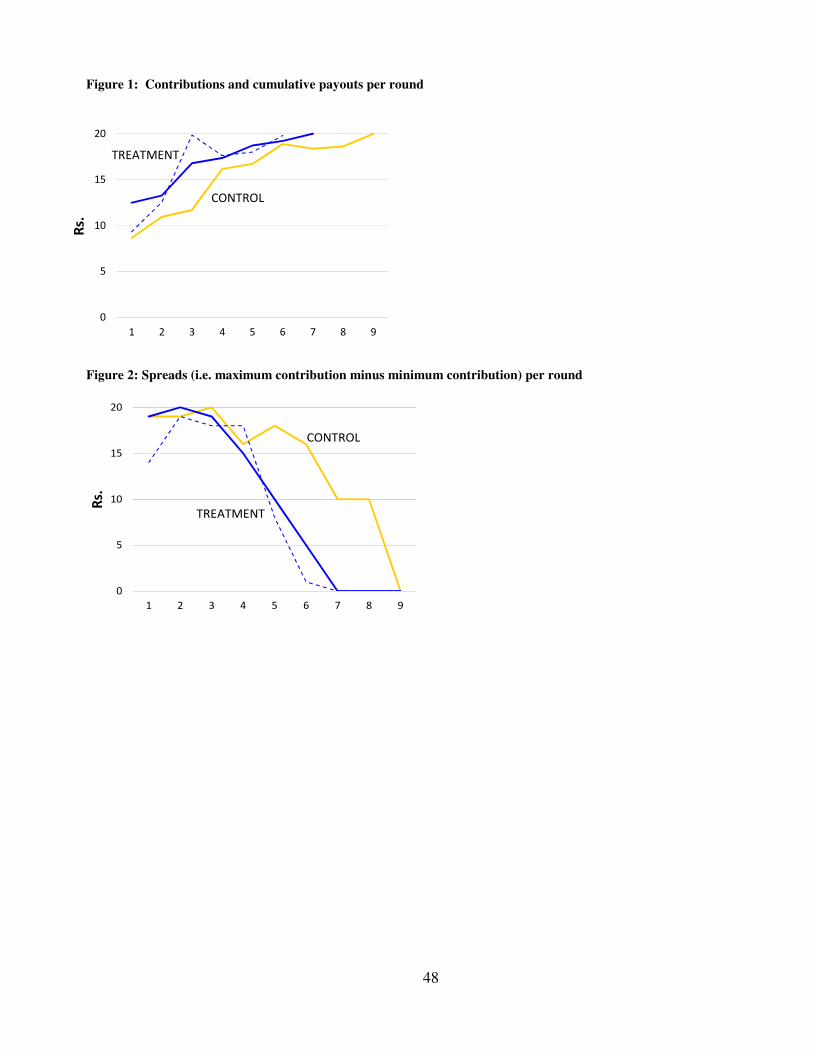
Average contributions per round are presented in Figure 1. Note that contributions in
treatment villages exceed the contributions in control villages. Contributions to the public good
31
in the first round in treatment areas were higher than comparison areas by Rs. 3.8 or
approximately 20 percent of the initial endowment. We also break down contributions in
treatment areas into SEWA members (solid line) and non-members (dashed line) respectively.
Note that in treatment villages, SEWA members on average contributed more to the public good
both at the beginning of the game, but non-members rapidly increased their contributions
rapidly. Overall, there was little discernible difference between the two groups: average
contributions, across all rounds were only about Rs. 0.68 higher among SEWA members, and the
difference is statistically insignificant.
Contributions in treatment villages also displayed lower dispersion than contributions in
control villages (Figure 2). In both village types, however, dispersion declined over time, but
more quickly in treatment villages. The low level of inequality in contributions (Figure 2) is
driven by the near-complete absence of free-riders in these villages, even though some women
had experienced benefits from free-riding in earlier rounds.
Achievement of Thresholds
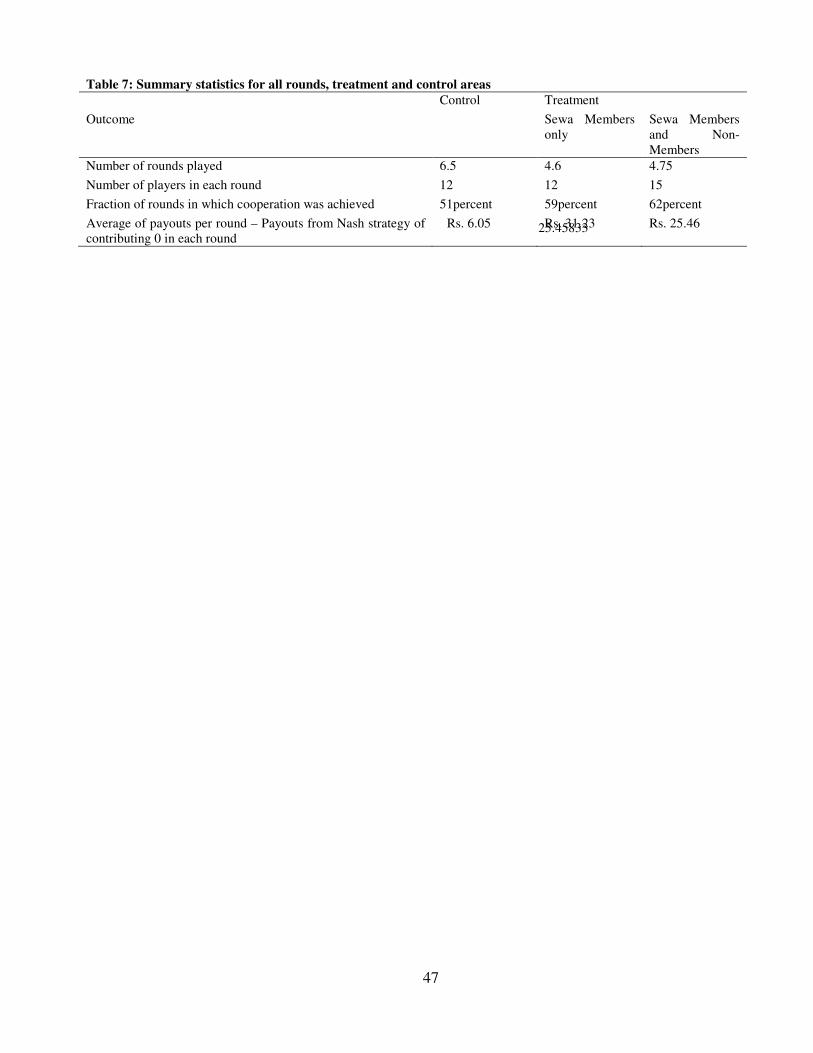
The higher levels of cooperation in treatment villages are also seen in the patterns of
threshold attainment. The threshold was attained about 62 percent of the time in treatment
villages and only 50 percent of the time in control villages (See Table 7).24 The extent of
cooperation is also apparent from looking at the number of rounds played. Since the game ceased
once the maximum common-fund threshold was reached, we see that the greater cooperation in
treatment villages was associated with shorter overall games with an average game length of less
than 5 rounds. The maximum threshold was reached in control villages after 6 rounds, on
average, and in one village was not reached.
24 Excluding one treatment village where the game was disrupted by male on-lookers, this increases to 75 percent.
32
Regression Results
Since the games varied in their length, and the choice of thresholds, comparison of
earnings and other outcomes requires controlling for these differences. We estimated measures
of game performance based on demographic characteristics and group fixed-effects, in addition
to the treatment effect. Regressions take the following form:
Zi,r,v = β0 + β1 SEWA Member + β2 SEWA Village, Non-Member + β3X + µv + ei,r
where Zi,r,v is the outcome of interest for individual i in round r of the game in village v.
SEWA Village is the treatment-village indicator, X is a vector of control variables, µv is a village-
specific fixed-effect (to control for group-specific attributes such as how long the women have
known each other and other village characteristics), and ejt is a random disturbance. Additional
control variables include age and literacy (measured on the basis of whether game players could
sign their name). Additionally, we include round-specific controls, including round number and
the threshold. We also include dummies for the individual days over which the games were
played.
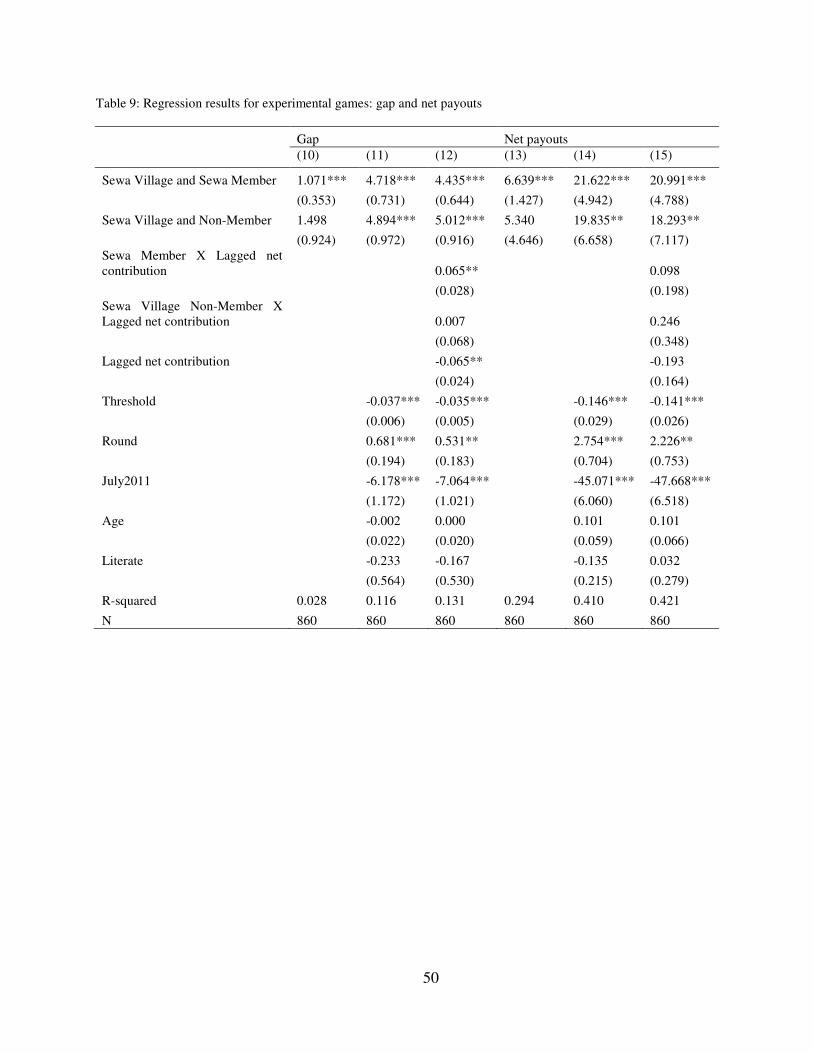
Table 8 and Table 9 present regression results for five outcomes: (1) contributions to the
public good per round; (2) cumulative balance per round (i.e. endowment less contribution to the
public good + earnings from the public good); (3) gross payouts per round (total earnings from
the common fund distributed equally); (4) the net payout (gross payout less the contributed
amount), and (5) the difference between a woman’s payout and the amount she would have
earned from contributing nothing to the public good, i.e. playing the Nash strategy of
contributing nothing to the public good.
33
Estimates in Table 8 suggest that all individuals – both SEWA members and non-
members – contribute approximately Rs. 4.00 (20 percent of the original endowment) more to
the public good than women in control villages (Table 8, columns 1—3). Estimates also indicate
that SEWA village participants also maintain higher balances: throughout the game, SEWA
members hold an extra Rs. 17, while non-members hold an extra Rs. 14 compared to players in
control villages (Table 8, columns 4—6). Higher contributions to the public good and higher
balances throughout the game are associated with higher gross payouts: SEWA members receive
an extra Rs. 25 and non-members in SEWA villages receive an extra Rs. 23 from playing the
game than their counterparts in control villages. Higher levels of cooperation, and higher
contributions to the public good in these villages led to higher payouts and thus greater
improvements in balances and gross payouts.
Estimates in Table 9 further illustrate how well women in treatment villages fared in the
game. Relative to control villages, net payouts, defined as gross payout less contributed amount,
are Rs 18-20 higher for both SEWA members and non-members in treatment villages in each
round (Table 9, columns 1—3). The gap between what women actually earned and the amount
they would have earned had they played the Nash equilibrium of contributing nothing to the
public good shows a similar pattern: relative to women in control villages, SEWA members and
non-members both earned approximately Rs. 5.00 extra according to this metric (Table 9,
columns 4—6).
These data can also be used to examine differences in strategies as well as outcomes for
women as a function of their own gains/losses throughout the game. We examine the
independent variable “net earnings” (payout less contributions) in the previous round of the
game, to determine whether the propensity to contribute is affected by previous round net
34
gain/loss (Net payoutr-1) and interact this variable with residence in a treatment village (SEWA
Village × Net payoutr-1). This measures whether women who gained from free-riding were more
or less likely to remain free-riders in subsequent rounds, or whether they were prompted to move
to a more cooperative strategy, even at the cost of lower balances in their own account. Note that
the coefficient for Net payoutr-1 is negative (though not statistically significant) in the case of
contributions to the public good (Table 8, Column 3), suggesting that women who received
higher payouts in the previous round (for example, by free-riding), on average lowered their
contributions in the following round. However, the coefficient for the interaction SEWA Village
× Net payoutr-1 is positive and statistically significant, indicating that women in treatment
villages behaved in the opposite way: a player who profited in the previous round actually
increased her contributions in the current rounds. Synchronization of strategies ensured that these
women collectively achieved higher payouts than the zero-contribution strategy (Table 9, column
3). Note that lagged earnings and their interaction with the treatment indicator only affect
current-round contributions and the difference between actual payout and the case where players
simply kept the Rs. 20. Neither variable affects balances or gross or net payouts.
Overall, we note three results of interest. First, although women in both treatment and
control villages engage in cooperative behavior, women who participated in the SHG treatment
achieve a cooperative outcome more quickly than their counterparts in the control villages.
Moreover, the gap between the most and least generous individuals narrowed more quickly in
treatment than in control villages. Second, cooperative behavior is encouraged with the presence
of a leader; but the cooperative effect of the leader is non-existent in treatment villages. Third,
free ridership in control villages delays the emergence of cooperative behavior, whereas in
treatment villages initial free riding hastens a cooperative result. Thus it is likely that the SHG
35
promotes cooperative behavior not through the management of group members’ policy
preferences but by reducing players’ uncertainty surrounding cooperation. Under normal
conditions, game players who free ride continue to do so in sequential rounds of game play. But
among SHG members, free riding quickly disappears as those who achieve high earnings
increase contributions to the common fund in subsequent rounds.
6. Conclusions
This paper has explored whether collective action can be promoted in communities by
external actors. It examined an intervention by the Self-Employed Women’s Association
(SEWA) of India in the Dungarpur district of Rajasthan in India. Women in 32 randomly
selected treatment villages were organized into SHGs. An additional set of 48 villages served as
a control group. A dedicated group of SEWA field workers conducted an information campaign,
organized the women and provided them with information, education and training to make
decisions as a group. The field workers also provided regular oversight, support, and arbitration
in the case of disputes or “free-riding” (real or perceived) and facilitated the group’s interaction
with formal institutions such as banks or government agencies.
A comparison of a baseline survey in 2007 and an endline survey in 2009 provide
estimates of program impact, which we measure at the village level. We find that over the two
years of its operation, “indirect” impacts of these programs – on women’s autonomy and
empowerment – largely outweigh the direct benefits on income and employment. Compared to
the control group, women who live in villages with SEWA programs report greater participation
in group programs (particularly for saving), increased say in domestic decision-making, greater
awareness of where to express grievances about public-services (particularly drinking water), a
36
willingness to take action on grievances in the case of drinking water, and finally, an increase in
satisfaction with the state of these services. We observe no significant impact of the program
however on measures of income, consumption or employment.
We also explore the possible mechanisms through which these impacts are realized. We
rule out the possibility that cooperation is achieved through top-down mechanisms that force
preferences to converge. Survey evidence shows that SHGs have no effect on narrowing
differences between women—and in particular, between tribal and non-tribal women—regarding
preferences for public goods in treatment villages relative to controls. Rather our behavioral
evidence suggests that SHGs change incentives structures for members by minimizing the
individual risks of engaging in cooperation. In public goods games, we found that free riding
tends to persist in control villages, but free riders tend to correct their behavior in subsequent
rounds of play in SHG villages, even when group monitoring of individual behavior was not
allowed. Although we cannot determine the precise means by which SHGs do this—whether it is
due simply to the routinization of cooperative behavior that SHG activities promote—without
further exploration, we can conclude that SHGs do reduce the uncertainty surrounding
cooperation.
Taken together, these results suggest that external actors (such as NGOs, other civil
society organizations or even the government) can in fact mobilize the poor and lower the costs
of collective action in rural communities. SHGs or other types of membership-based
organizations targeted to the poor can not only increase the propensity for collective action in
local communities, but also empower women more broadly. But in order for these groups to be
able to take further steps in improving livelihoods, increasing income and eventually the
bargaining power of marginalized communities, these groups will have to move beyond their
37
current status as simple linkages between the public sector and (mostly) the rural poor. Given
time and appropriately-designed incentives, these groups have the capacity to influence the
processes of both economic and political development in significant ways.
38
Table 1: Summary Statistics of key variables (N=3205)
Mean Standard Deviation
Min Max
SEWA Village 0.450 0.498 0 1
Post-intervention 0.500 0.500 0 1
SEWA Village × Post-intervention 0.217 0.412 0 1
Participates in group savings 0.220 0.414 0 1
In the habit of saving 0.198 0.398 0 1
Employed in any capacity (past three months) 0.783 0.412 0 1
Employed in agriculture (past three months) 0.720 0.449 0 1
Employed outside agriculture (past three months) 0.063 0.242 0 1
Final say: children's schooling 0.088 0.283 0 1
Final say: medical decisions 0.097 0.296 0 1
Final say: family-planning 0.031 0.173 0 1
Grievance: Water 0.245 0.430 0 1
Grievance: Roads 0.199 0.400 0 1
Grievance: Electricity 0.238 0.426 0 1
Grievance: Ed/Health 0.180 0.385 0 1
Addressed Grievance: Water 0.212 0.409 0 1
Addressed Grievance: Roads 0.173 0.378 0 1
Addressed Grievance: Electricity 0.181 0.385 0 1
Addressed Grievance: Ed/Health 0.110 0.314 0 1
Adequate drinking water 0.233 0.423 0 1
Adequate sanitation 0.215 0.411 0 1
Adequate electricity 0.214 0.410 0 1
Know of the Gram Sabha 0.361 0.480 0 1
Ever attended Gram Sabha 0.040 0.195 0 1
Know about Gram Panchayat 0.749 0.434 0 1
Know of Gram Sabha AND Gram Panchayat 0.230 0.421 0 1
Engage with Gram Sabha AND Gram Panchayat 0.014 0.118 0 1
Know anyone in the village who paid a bribe 0.038 0.192 0 1
Top issue in the village: water 0.885 0.319 0 1
Top issue in the village: sanitation 0.509 0.500 0 1
Top issue in the village: transportation 0.637 0.481 0 1
Top issue in the village: electricity 0.807 0.395 0 1
Top issue in the village: educational services 0.294 0.456 0 1
Top issue in the village: health services 0.471 0.499 0 1
Age 37.13 10.00 14 80
Literate 0.183 0.387 0 1
Married 0.945 0.228 0 1
Scheduled tribe 0.726 0.446 0 1
Husband age 40.67 9.990 1 77
Husband literate 0.082 0.275 0 1
Own house 0.849 0.358 0 1
Have own farm 0.877 0.329 0 1
39
Kutcha house 0.685 0.464 0 1
Household has toilet 0.072 0.259 0 1
40
Table 2: Pre- and post-program differences, individual data
Pre-Program Differences Post-Program Differences
SEWA Villages
Control villages
Difference (std err)
SEWA Villages
Control villages
Difference (std err)
Participates in group programs 0.132 0.146 -0.014 (0.030)
0.427 0.199 0.223*** (0.053)
In the habit of saving 0.155 0.194 -0.039* (0.023)
0.256 0.188 0.065** (0.030)
Employed (past three months) 0.798 0.768 0.030 (0.039)
0.784 0.783 -0.000 (0.051)
Employed in agriculture (past three months)
0.750 0.705 0.045 (0.041)
0.693 0.731 -0.038 (0.060)
Employed outside agriculture (past three months)
0.048 0.063 -0.015 (0.017)
0.091 0.053 0.038 (0.028)
Final say: children's schooling 0.092 0.087 0.006 (0.023)
0.130 0.055 0.067*** (0.019)
Final say: medical decisions 0.098 0.110 -0.012 (0.021)
0.131 0.061 0.063*** (0.021)
Final say: family-planning 0.018 0.055 -0.036** (0.014)
0.044 0.010 0.032** (0.012)
Know where to report grievance: Water 0.183 0.164 0.019 (0.027)
0.421 0.245 0.156*** (0.052)
Know where to report grievance: Roads 0.146 0.130 0.016 (0.026)
0.301 0.234 0.052 (0.051)
Know where to report grievance: Electricity
0.136 0.109 0.028 (0.027)
0.435 0.298 0.112* (0.060)
Know where to report grievance: Education/Health
0.163 0.159 0.004 (0.031)
0.258 0.159 0.082* (0.044)
Addressed Grievance: Water 0.160 0.139 0.021 (0.025)
Engage with Gram Sabha and Panchayat -0.009 (0.007)
-0.007 (0.008)
0.018* (0.011)
0.022
Known anyone who has paid a bribe -0.017 (0.014)
-0.034** (0.014)
0.051** (0.020)
0.016
Adequate drinking water -0.027 (0.036)
0.045 (0.034)
0.125** (0.058)
0.176
Adequate electricity 0.004 (0.040)
0.001 (0.036)
-0.008 (0.049)
0.102
Adequate roads -0.003 (0.004)
-0.009 (0.007)
-0.023 (0.020)
0.935
Adequate facilities for health and education -0.043 (0.046)
0.150*** (0.048)
0.089 (0.067)
0.145
Notes: (i) Standard errors in parentheses. * p < 0.10, ** p < 0.05, *** p < 0.01; (ii) All regressions include block-level fixed effects; (iii) All regressions include the set of control variables described in the text; (iv) N=3205.
Notes: The table lists several public goods/services priorities selected by respondents as the “no. 1 priority for the village.” Figures show differences in public-goods priorities between Schedule Tribe (ST) women and non-ST women across village categories (a positive number indicating greater ST than non-ST preference for prioritizing the particular public good). Concentration figures are Herfindahl indices calculated from then sum of squared fraction of ST and non-ST preferences.
46
Table 6: Differences in demographic characteristics, game players
Control Treatment Difference
Average Age 32.950 32.604 -0.349 (0.549)
Average Education 1.440 1.416 -0.0252 (0.213)
Average Literacy 0.233 0.313 0.080 (0.035)
Live with husband 0.883 0.937 0.054*** (0.019)
* p < 0.10, ** p < 0.05, *** p < 0.01.
47
Table 7: Summary statistics for all rounds, treatment and control areas
Control Treatment
Outcome Sewa Members only
Sewa Members and Non-Members
Number of rounds played 6.5 4.6 4.75
Number of players in each round 12 12 15
Fraction of rounds in which cooperation was achieved 51percent 59percent 62percent
Average of payouts per round – Payouts from Nash strategy of contributing 0 in each round
Rs. 6.05 25.45833
Rs. 31.23 Rs. 25.46
48
0
5
10
15
20
1 2 3 4 5 6 7 8 9
Rs.
TREATMENT
CONTROL
Figure 1: Contributions and cumulative payouts per round
Figure 2: Spreads (i.e. maximum contribution minus minimum contribution) per round
0
5
10
15
20
1 2 3 4 5 6 7 8 9
Rs.
TREATMENT
CONTROL
49
Table 8: Regression results for experimental games: contributions, balances and payouts
Contribution Balance Payouts
(1) (2) (3) (4) (5) (6) (7) (8) (9)
Sewa Village and Sewa Member 2.552*** 4.175*** 3.980*** 3.986*** 17.524*** 17.066*** 9.623*** 25.988*** 25.172*** (0.791) (0.917) (0.934) (0.712) (4.333) (4.139) (2.106) (5.604) (5.485)
Sewa Village and Non-Member 2.706*** 4.264*** 4.382*** 2.533 15.645** 13.939* 8.478 24.299*** 22.940** (0.891) (1.268) (1.233) (4.183) (5.948) (6.718) (5.185) (7.479) (7.650) Sewa Member X Lagged net contribution
Standard errors in parentheses. All regressions include village-level fixed-effects. Intercepts and day dummies are included but not reported.* p < 0.10, ** p < 0.05, *** p < 0.01.
50
Table 9: Regression results for experimental games: gap and net payouts
Gap Net payouts
(10) (11) (12) (13) (14) (15)
Sewa Village and Sewa Member 1.071*** 4.718*** 4.435*** 6.639*** 21.622*** 20.991***
(0.353) (0.731) (0.644) (1.427) (4.942) (4.788)
Sewa Village and Non-Member 1.498 4.894*** 5.012*** 5.340 19.835** 18.293**
(0.924) (0.972) (0.916) (4.646) (6.658) (7.117) Sewa Member X Lagged net contribution 0.065** 0.098
(0.028) (0.198) Sewa Village Non-Member X Lagged net contribution 0.007 0.246
7. References Aiyar, S. S. A., D. Narayan, et al. (2007). "Empowerment through self-help groups." Ending
poverty in South Asia: ideas that work: 104-135. Alesina, A., R. Baqir, et al. (1999). "Public goods and ethnic divisions." Quarterly Journal of
Economics 114(4): 1243-84. Armendáriz, B. and J. Morduch (2005). The economics of microfinance. Cambridge, Mass., MIT
Press. Baland, J. M. and J. P. Platteau (2003). "Economics of common property management regimes."
Handbook of environmental economics 1: 127-190. Ban, R. and V. Rao (2008). "Tokenism or Agency? The Impact of Women's Reservations on
Village Democracies in South India." Economic Development and Cultural Change 56(3): 501-530.
Banerjee, A. and R. Somanathan (2007). "The political economy of public goods: Some evidence
from India." Journal of Development Economics 82(2): 287-314. Bardhan, P. K. (2005). Scarcity, conflicts, and cooperation: essays in the political and
institutional economics of development. Cambridge, MA, MIT Press. Basu, P. (2006). Improving access to finance for India's rural poor, World Bank Publications. Bhatt, E. R. (2006). We are poor but so many: The story of self-employed women in India,
Oxford University Press. Cadsby, C. B. and E. Maynes (1998). "Gender and free riding in a threshold public goods game:
experimental evidence." Journal of economic behavior & organization 34(4): 603-620. Carpenter, J. P. and E. Seki (2006). "Competitive work environments and social preferences:
Field experimental evidence from a Japanese fishing community." The BE Journal of Economic Analysis & Policy 5(2): 2-2.
Chakrabarti, R. and S. Ravi (2011). "At the Crossroads: Microfinance in India." Money &
Finance, Forthcoming. Chandra, K. (2005). "Ethnic Parties and Democratic Stability." Perspectives on Politics 3(02):
235-252. Chattopadhyay, R. and E. Duflo (2004). "Women as policy makers: Evidence from a randomized
policy experiment in India." Econometrica 72(5): 1409-1443. Chen, M. (1991). Coping with Seasonality and Drought, Sage Publications.
52
Chen, M., R. Jhabvala, et al. (2007). Membership-based organizations of the poor, Psychology Press.
Chhibber, P. K. (2001). Democracy without associations: transformation of the party system and
social cleavages in India, Univ of Michigan Pr. Datta, R. (2000). "On Their Own: Development strategies of the Self-Employed Womens
Association (SEWA) in India." Development 43(4): 51-55. Davis, D. D. and C. A. Holt (1993). Experimental economics, Princeton Univ Pr. Deshmukh-Ranadive, J. (2004). Women's Self-Help Groups in Andhra Pradesh:Participatory
Poverty Alleviation in Action. Dyson, T. and M. Moore (1983). "On Kinship Structure, Female Autonomy, and Demographic
Behavior in India." Population and Development Review 9(1): 35-60. Dyson, T. and M. Moore (1983). "On Kinship Structure, Female Autonomy, and Demographic
Behavior in India." Population and Development Review 9(1): 35--60. Eckel, C. C. and P. J. Grossman (2008). "Differences in the economic decisions of men and
women: Experimental evidence." Handbook of experimental economics results 1: 509-519.
Gaiha, R. (2000). "On the targeting of the employment guarantee scheme in the Indian state of
Maharashtra." Economics of Planning 33(3): 203-219. Galab, S. and N. C. Rao (2003). "Women's Self-Help Groups, Poverty Alleviation and
Empowerment." Economic and Political Weekly 38(12/13): 1274-1283. Galasso, E. and M. Ravallion (2005). "Decentralized targeting of an antipoverty program."
Journal of Public Economics 89(4): 705-727. Gugerty, M. K. and M. Kremer (2008). "Outside Funding and the Dynamics of Participation in
Community Associations." American Journal of Political Science 52(3): 585-602. Hoff, K. and P. Pandey (2006). "Discrimination, social identity, and durable inequalities." The
American Economic Review 96(2): 206-211. Isaac, M., K. McCue, et al. (1985). "Public Goods Provision in an Experimental Environment."
Journal of Public Economics 26(1). Isaac, M., D. Schmidtz, et al. (1989). "The assurance problem in a laboratory market." Public
Choice 62(3): 217-236.
53
Isaac, M., J. Walker, et al. (1984). "Divergent Evidence on Free Riding: An Experimental Examination of Possible Explanations." Public Choice 43(2): 113-149.
Jeffrey, P. and R. Jeffrey (1996). Don't marry me to a plowman!: women's everyday lives in rural
North India. Boulder, Colorado, Westview Press Jha, R., S. Bhattacharyya, et al. (2009). "Capture of anti-poverty programs: An analysis of the
National Rural Employment Guarantee Program in India." Journal of Asian Economics 20(4): 456-464.
Joshi, D. (2011). "Caste, Gender and the Rhetoric of Reform in India's Drinking Water Sector."
Economic & Political Weekly 46(18): 57-57. Karlan, D. S. (2007). "Social connections and group banking." Economic Journal 117(517): F52-
F84. King, E. M. and A. D. Mason (2001). Engendering development: Through gender equality in
rights, resources, and voice, Washington, DC [etc.]: World Bank [etc.]. Lanjouw, P. and M. Ravallion (1999). "Benefit incidence, public spending reforms, and the
timing of program capture." The World Bank Economic Review 13(2): 257-273. Laury, S. K. and L. O. Taylor (2008). "Altruism spillovers: Are behaviors in context-free
experiments predictive of altruism toward a naturally occurring public good?" Journal of Economic Behavior & Organization 65(1): 9-29.
Ledyard, J. (1995). Public Goods: a survey of experimental research. In: Kagel, J. and A. Roth
(editors), Handbook of Experimental Economics. Princeton, New Jersey, Princeton University Press.
Mansuri, G. and V. Rao (2004). "Community-based and-driven development: A critical review."
The World Bank Research Observer 19(1): 1-1. Marwell, G. and R. Ames (1979). "Experiments on the Provision of Public Goods I: Resources,
Interest, Group Size, and the Free-Rider Problem." American Journal of Sociology 84(6): 1335-1360.
Marwell, G. and R. Ames (1980). "Experiments on the Provision of Public Goods II: Provision
Points, Stakes, Experience, and the Free-Rider Problem." American Journal of Sociology 85(4): 926-937.
Marwell, G. and R. Ames (1981). "Economists Free Ride, Does Anyone Else? Experiments on
the Provision of Public Goods, IV." Journal of Public Economics 15(3): 215-235.
54
Munshi, K. (2007). Information Networks in Dynamic Agrarian Economies (Chapter 48). Handbook of Development Economics. T. P. Schultz and A. S. John, Elsevier. Volume
4: 3085-3113. Narayan, D., R. Patel, et al. (2000). Voices of the poor. Can anyone hear us?, Oxford University
Press for the World Bank. Nussbaum, M. (2000). Women and Human Development: The Capabilities Approach.
Cambridge, Cambridge University Press. Pande, R. (2003). "Can Mandated Political Representation Increase Policy Influence for
Disadvantaged Minorities? Theory and Evidence from India." The American Economic Review 93(4): 1132-1151.
Planning Commission, G. o. I. (2011). Report of working group on National rural livelihoods
mission (NRLM). New Delhi, Government of India. Reddy, C. S. and S. Manak (2005). "Self-help groups: A keystone of microfinance in India-
women empowerment and social security." Andhra Pradesh Mahila Abhivruddhi Society (APMAS). India: Hyderabad.
Rosenzweig, M. R. and O. Stark (1989). "Consumption smoothing, migration, and marriage:
evidence from rural India." The Journal of Political Economy: 905-926. Schultz, T. P. (1995). Investment in women's human capital, University of Chicago Press. Sen, A. (2001). "The many faces of gender inequality." New Republic: 35-39. Sen, A. and J. Dreze (2002). "India: Development and Participation." Nova Delhi: Oxford
University Press. Sinha, F. (2006). Self Help Groups in India: A study of the lights and shades. Report, EDA Rural
Systems Pvt Ltd in Collaboration with Andhra Pradesh Mahila Abhivruddhi Society, CRS, CARE, USAID, and GTZ/NABARD.
von Braun, J. and R. Meinzen-Dick (2009). Land-Grabbing by Foreign Investors in Developing
Countries. Policy Brief 13. Washington, DC, International Food Policy Research Institute.