107 Memoirs of the School of Engineering, Nagoya University Vol.51, No.2 (1999) COLLECTIVE TRANSLATIONAL-ROTATIONAL COUPLING MOTION OF MOLECULES IN LIQUIDS AND SOLUTIONS Hiroyasu NOMURA, Shinobu KODA and Tatsuro MATSUOKA Department of Molecular Design and Engineering, Graduate School of Engineering, Nagoya University (Received November 11, 1999) Contents I. Introduction ......................................................................................................................................... 108 II. Experimental ....................................................................................................................................... 111 1. Light Beating Scattering Measurements ..................................................................................... 111 2. Ultrasonically Induced Birefringence Measurement ................................................................... 113 III. Transnational and Rotational Coupling Parameter R .......................................................................... 116 1. Introduction ................................................................................................................................. 116 2. Theoretical Background .............................................................................................................. 118 3. Coupling between the Transnational and Rotational Motion of Molecules in Neat Liquid Crystals in Isotropic Phase ...................................................................................... 119 1) Reorientational Relaxation Times τ ...................................................................................... 119 2) Coupling Parameter R of 5CB and MBBA .......................................................................... 120 3) Effects of Reorientational Relaxation Times and Coupling Parameter on Long Range Order of Isotropic Liquids ............................................................................... 120 4. Effects of Diluent on the Coupling Parameter R ......................................................................... 122 1) Introduction .......................................................................................................................... 122 2) Diluent Effect on Phase Transition Temperature .................................................................. 123 3) Concentration Dependence of Reorientational Relaxation Time ......................................... 124 4) Concentration Dependence of Coupling Parameter R .......................................................... 125 5) MNR and Raman Scattering Measurements of 5CB-CCl 4 and TPP Systems ...................... 127 6) Local Structure and Coupling Parameter ............................................................................. 129 IV. Ultrasonically Induced Birefringence and Coupling Parameter R –Theoretical Considerations– ............................................................................................................. 129 1. Introduction ................................................................................................................................. 129 2. Theory ......................................................................................................................................... 130 1) Transport Equations .............................................................................................................. 130 2) Ultrasonically Induced Birefringence ................................................................................... 132 3) Flow Birefringence ............................................................................................................... 135 APPENDIX: Comparison between irreversible statistical treatment and de Genne’s phenomenological one ................................................................................................ 135
Transcript
107
Memoirs of the School of Engineering, Nagoya UniversityVol.51, No.2 (1999)
COLLECTIVE TRANSLATIONAL-ROTATIONALCOUPLING MOTION OF MOLECULES IN
LIQUIDS AND SOLUTIONS
Hiroyasu NOMURA, Shinobu KODA and Tatsuro MATSUOKA
Department of Molecular Design and Engineering, Graduate School of Engineering,Nagoya University
(Received November 11, 1999)
Contents
I. Introduction ......................................................................................................................................... 108
III. Transnational and Rotational Coupling Parameter R.......................................................................... 1161. Introduction ................................................................................................................................. 1162. Theoretical Background .............................................................................................................. 1183. Coupling between the Transnational and Rotational Motion of Molecules in
Neat Liquid Crystals in Isotropic Phase ...................................................................................... 1191) Reorientational Relaxation Times τ ...................................................................................... 1192) Coupling Parameter R of 5CB and MBBA .......................................................................... 1203) Effects of Reorientational Relaxation Times and Coupling Parameter on
Long Range Order of Isotropic Liquids ............................................................................... 1204. Effects of Diluent on the Coupling Parameter R ......................................................................... 122
1) Introduction .......................................................................................................................... 1222) Diluent Effect on Phase Transition Temperature .................................................................. 1233) Concentration Dependence of Reorientational Relaxation Time ......................................... 1244) Concentration Dependence of Coupling Parameter R .......................................................... 1255) MNR and Raman Scattering Measurements of 5CB-CCl4 and TPP Systems ...................... 1276) Local Structure and Coupling Parameter ............................................................................. 129
IV. Ultrasonically Induced Birefringence and Coupling Parameter R–Theoretical Considerations– ............................................................................................................. 1291. Introduction ................................................................................................................................. 1292. Theory ......................................................................................................................................... 130
APPENDIX: Comparison between irreversible statistical treatment and de Genne’sphenomenological one ................................................................................................ 135
108 H. Nomura et al.
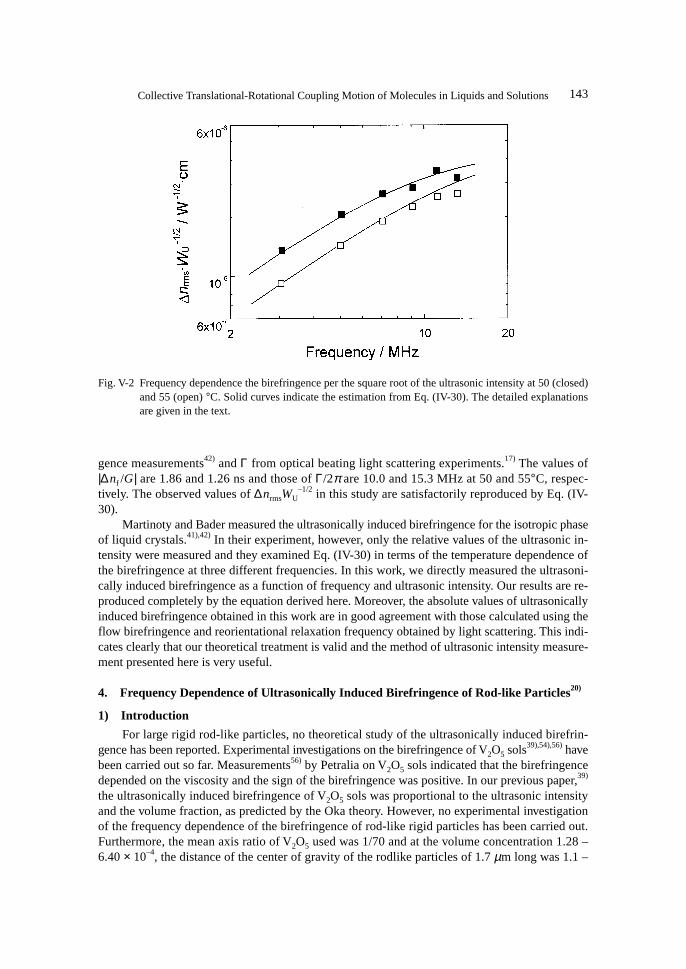
V. Ultrasonically Induced Birefringence in Liquids and Solutions ......................................................... 1391. Introduction ................................................................................................................................. 1392. Modified Oka Theory of Rodlike Particles ................................................................................. 1403. Ultrasonically Induced Birefringence in Isotropic Phase in Neat Liquid Crystal ....................... 1424. Frequency Dependence of Ultrasonically Induced Birefringence in Rod-like Particles ............. 143
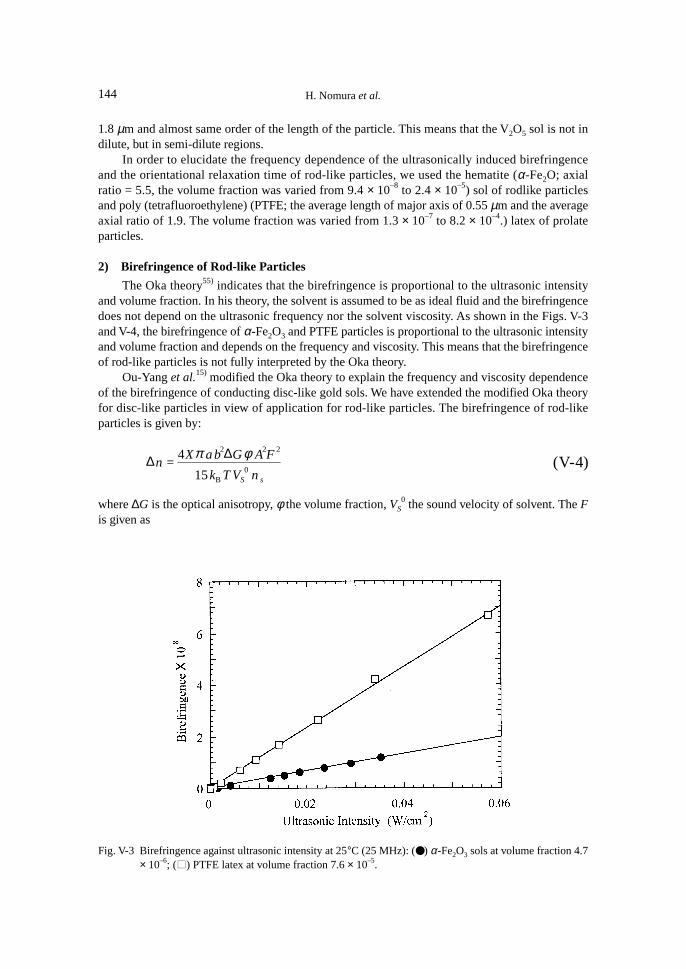
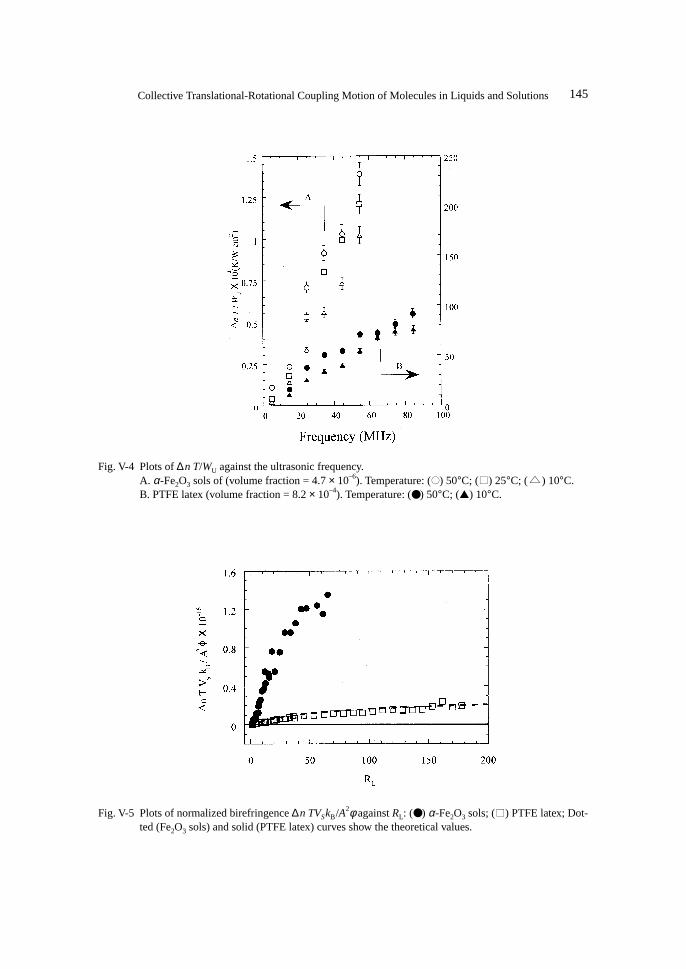
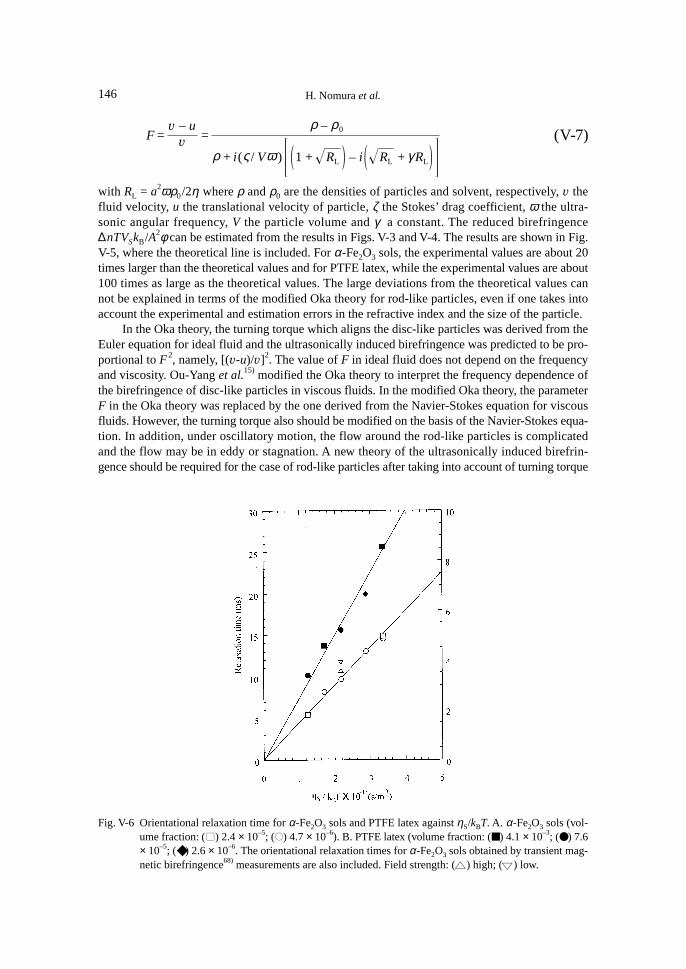
1) Introduction .......................................................................................................................... 1432) Birefringence of Rod-like Particles ...................................................................................... 1443) Orientational Relaxation Times of Rod-like Particles .......................................................... 147
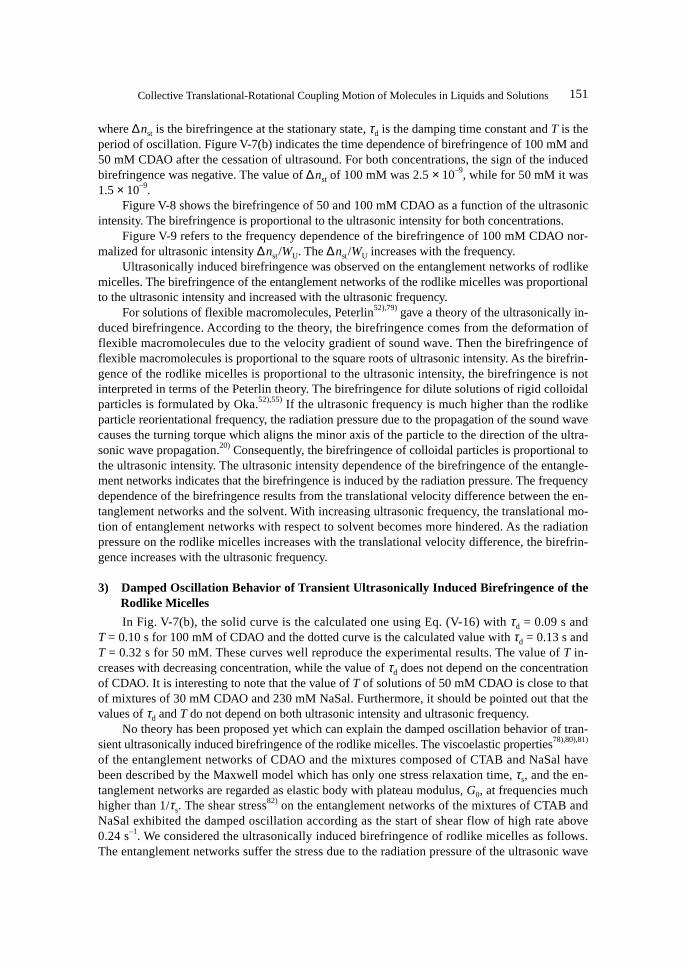
5. Ultrasonically Induced Birefringence in Rodlike Micelles in Entanglement Networks ............. 1481) Introduction .......................................................................................................................... 1482) Birefingence of Rodlike Micelles ......................................................................................... 1503) Damped Oscillation Behaviour of Transient Ultrasonically Induced
Birefringence of the Rodlike Micelles ................................................................................. 1516. Ultrasonically Induced Birefringence in Polymer Solutions....................................................... 153
VI. General Conclusion and Scope ........................................................................................................... 156
I. Introduction
In this review, we focus attention upon our recent experimental results of the collective trans-lational and rotational coupling modes of molecular motions in the liquids and solutions. It is veryimportant to elucidate how the molecular site-site interaction does effect on the molecular motionsin liquids and solutions, especially to understand the molecular motion of anisotropic molecules atmolecular levels. For this purpose, the light scattering and ultrasonically induced spectroscopy tech-niques are very appropriate and powerful.
The depolarized Rayleigh spectra monitor the fluctuation in the polarizability density thatarises from the modulation of the intrinsic and the interaction-induced polarizabilities of the mol-ecules by the molecular motion. In the case of the no-interaction-induced polarizability, the shapeof the depolarized Rayleigh spectrum will be determined by the time dependence of theautocorrelation function of a second rank collective orientation density.1),2) For symmetric top mol-ecules, the intensity would depend upon the anisotropy in the gas phase polarizability of a mol-ecule and a static orientational correlation parameter given by
g 2 = 1 + NX
P2 (i) P2 ( j)
P2 (i) P2 (i)(I-1)
where NX is the number of scattering molecules and P2(i ) is a second rank Legendre function ofthe orientation of molecule i.
In the case of no strong interaction between the normal coordinates on different molecules,the isotropic Raman spectrum reflects vibrational state of a single molecule and gives theautocorrelation function of the phase of the normal coordinate of a single molecule. The anisotro-pic spectrum gives a correlation function with a second rank spherical harmonic of the molecularorientation. Furthermore, in the absence of intermolecular vibrational-vibrational interactions, it isquite probable that the vibrational and orientational degree of freedom relax independently so thata single-molecule orientational correlation function can be obtained from the Raman spectrum.
In the rotational diffusion limit, the half width of the depolarized light scattering spectra, Γ,give the single-particle orientational correlation function for symmetric tops which is predomi-nantly exponential and characterized by the decay time.2)
109Collective Translational-Rotational Coupling Motion of Molecules in Liquids and Solutions
Γ–1 =
g 2
j 2
τ 2 (I-2)
where j2 is a dynamic orientation correlation parameter. At diffusion limit, j2 and τ2 are frequencydependent.3) The orientational correlation time τ2 can be obtained by Raman band shape analysisand NMR measurement. If g2 in Eq. (I-2) is almost equal to 1, that is, molecule rotates freely inliquids and solutions, then, Γ–1 ∼ τ2.
It has been known that in liquids the collective translational and rotational (orientational)modes are strongly coupled. This coupling has been typically observed in a dimensionless trans-port parameter R which is directly related to the depth of the “Rytov dip” in the VH depolarizedRayleigh scattering, the central dip arising from the coupling of rotation to shear modes.
De Gennes3) has predicted that the Rayleigh dip could exist in a depolarized light scatteringspectrum of liquid crystals in isotropic phase. His theory is based on the phenomenological gener-alized irreversible thermodynamics and the coupling between orientational and shear modes ofmolecular motions is expressed by the transport equation using three viscosity parameters, the shearviscosity ηS, the viscosity for relaxation for orientational order ν and the coupling viscosity µ. Forthis case, the coupling parameter R is expressed by (R = 2µ2/(ηSν)) and is directly related to thedepth of the “Rytov dip” in the VH depolarized Rayleigh scattering. His phenomenological treat-ment was confirmed by depolarized light scattering,4) electric birefringence,5) flow birefringence6)
and complex shear modulus measurements.7)
According to de Gennes’ phenomenological theory of strong coupling system, the rate ofchange of the tensor orientational order parameter Qαβ is defined as
Rαβ =
δ Q αβ
δt. (I-3)
The conjugated force φαβ can be derived from the free energy F.
φαβ = – ∂F∂Q αβ
= – AQ αβ (I-4)
where A is the quadratic expansion coefficient of free energy in Qαβ. In the linear region and if thedifference between δQαβ /δ t and partial derivative ∂Qαβ /∂ t = Q̇αβ is negligible, the linear Onsagersymmetry equation can be written as
σ αβa = 2η S Aαβ
a + 2µRαβ
φαβ = 2µ Aαβa + νRαβ ( I-5)
In this case, σ aαβ is anisotropic part of the viscous stress tensor and Aαβ
a is the anisotropic part ofstrain rate tensor. The above coupling effect yields complex shear viscosity as7)
η′S(ω) = η S 1 – R
(ω / Γ )2
1 + (ω / Γ )2
η″S(ω) = η SR(ω / Γ )
1 + (ω / Γ )2(I-6)
110 H. Nomura et al.
where Γ is the relaxation frequency of tensor order parameter.3),7)
Flow birefringence experiment should also yield R. In flow birefringence, one measures R/Γ,which is virtually independent of boundary conditions, wheresas in light scattering one measuresR and Γ independently.
The simple theories that lend themselves to experimental verification with a minimum num-ber of adjustable parameter assume that the viscosity ηS, the reorientational correlation frequencyΓ, and the coupling parameter R are evaluated in the k, ω → 0 limit.9)-11) Only adjustable parameterin fitting of the “Rytov dip” is the coupling parameter R.
In this limit, the Γ and R that enter VH scattering and flow birefringence experiments can beused to analyze phenomena for HH light scattering and ultrasonically induced birefringence ex-periments.12),13) In few cases, the translational-rotational coupling parameter affects on the HH lightscattering spectrum, but, for situations where the Rytov dip is small, the weak Brillouin side-peaksobserved in the HH spectrum provide a better method of measuring R than does the dip in the VHspectrum.
However, the developments of laser light systems and ultrasonic techniques has open a way tomeasure the ultrasonically induced birefringence directly as a function of ultrasonic frequency andtheir intensity.14)-16) Therefore, it is a very useful techniques to investigate the collective transla-tional and rotational coupling modes of molecular motions in liquids and solutions.
We have constructed and improved the following two experimental systems.(1) The depolarized light scattering measurement system with a light beating scattering
method based on an optical heterodyne technique newly constructed.17),18) The laser light are splitinto two beams which are imposed at the specimen; one beam is an incident light and the other as areference for heterodyne detection. A half wave plate put in the path of the reference beam rotatesits polarization plane by 90° so that the depolarized VH scattering can be detected. The polarizedVV scattering and the depolarized VH scattering can be observed alternately with very high accu-racy.
(2) The difference of refractive index, ∆n = n|| – n⊥, was measured in an ultrasonically in-duced birefringence experiment, where n|| and n⊥ are refractive indexes parallel and perpendicularto the direction of sound propagation, respectively. The light from a He-Ne laser passes throughthe polarizer with an angle of polarization at 45°, sample cell, λ /4 plate, and analyzer with a smalloffset angle β from extinction position. If the acoustic field is applied to solutions, the optical phaseretardation δ is produced and the intensity of light passed through the analyzer increases. The opti-cal retardation δ is obtained from the light intensities, I0 and Ib in the absence of the sound wavewith the polarizer and with the analyzer being parallel and perpendicular, respectively. The differ-ence of refractive index can be estimated from the equation ∆n = λ δ /2πd, where β is the offsetangle, d the optical path length and λ the wave length of the light. In order to obtain the orienta-tional relaxation time, the pulsed ultrasonic waves are used and their frequency range is from 5 to225 MHz.
We would like to summarize in the review our experimental and theoretical results of the trans-lational and rotational coupling parameter R obtained from depolarized light scattering and ultra-sonically induced birefringence measurements in liquid crystal and colloidal systems. First, wewill summarize our recent work for the translational and rotational coupling parameter R obtainedfrom depolarized light scattering in neat and diluted liquid crystal systems. Second, we will showto some extent the theoretical treatment for ultrasonically and flow birefringence. Finally, we willdiscuss the our recent results for ultrasonically induced birefringence for liquid crystal, polymersolutions, typical colloidal systems and the concentrated surfactant systems.
111Collective Translational-Rotational Coupling Motion of Molecules in Liquids and Solutions
II. Experimentals
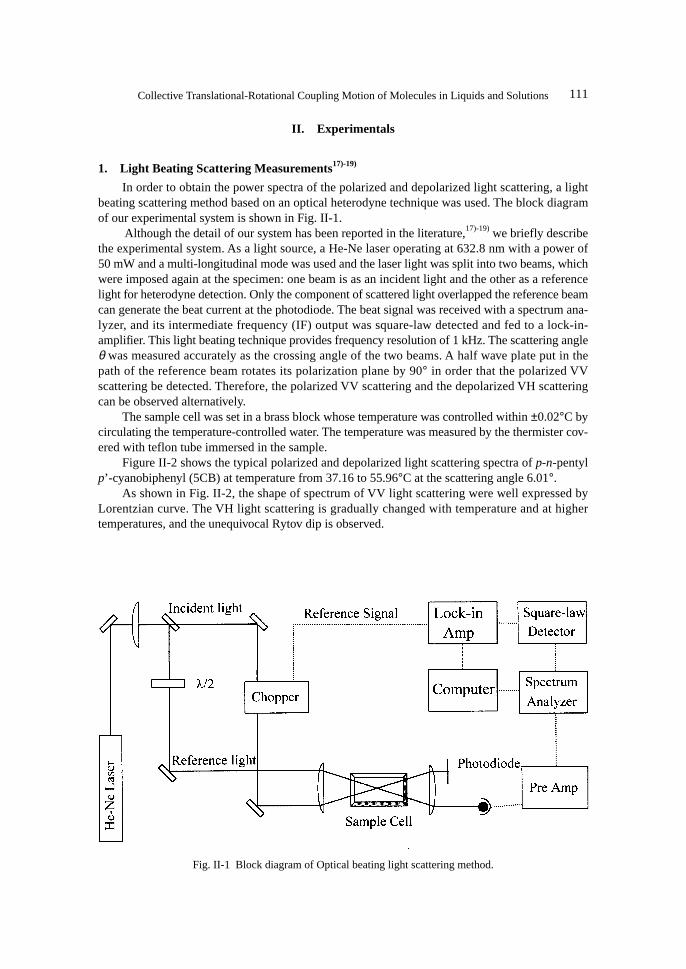
1. Light Beating Scattering Measurements17)-19)
In order to obtain the power spectra of the polarized and depolarized light scattering, a lightbeating scattering method based on an optical heterodyne technique was used. The block diagramof our experimental system is shown in Fig. II-1.
Although the detail of our system has been reported in the literature,17)-19) we briefly describethe experimental system. As a light source, a He-Ne laser operating at 632.8 nm with a power of50 mW and a multi-longitudinal mode was used and the laser light was split into two beams, whichwere imposed again at the specimen: one beam is as an incident light and the other as a referencelight for heterodyne detection. Only the component of scattered light overlapped the reference beamcan generate the beat current at the photodiode. The beat signal was received with a spectrum ana-lyzer, and its intermediate frequency (IF) output was square-law detected and fed to a lock-in-amplifier. This light beating technique provides frequency resolution of 1 kHz. The scattering angleθ was measured accurately as the crossing angle of the two beams. A half wave plate put in thepath of the reference beam rotates its polarization plane by 90° in order that the polarized VVscattering be detected. Therefore, the polarized VV scattering and the depolarized VH scatteringcan be observed alternatively.
The sample cell was set in a brass block whose temperature was controlled within ±0.02°C bycirculating the temperature-controlled water. The temperature was measured by the thermister cov-ered with teflon tube immersed in the sample.
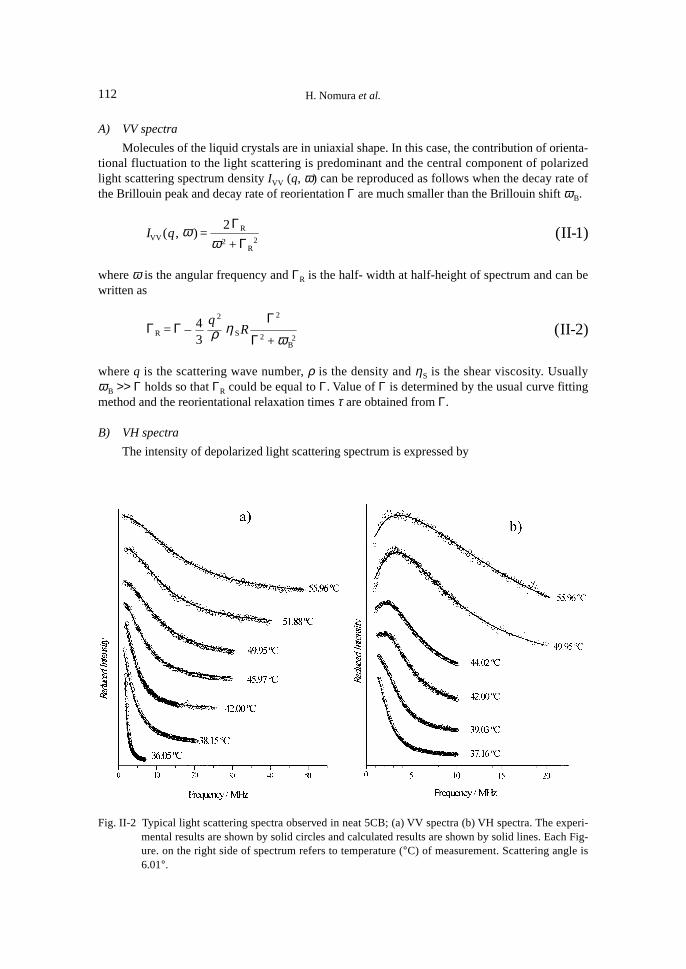
Figure II-2 shows the typical polarized and depolarized light scattering spectra of p-n-pentylp’-cyanobiphenyl (5CB) at temperature from 37.16 to 55.96°C at the scattering angle 6.01°.
As shown in Fig. II-2, the shape of spectrum of VV light scattering were well expressed byLorentzian curve. The VH light scattering is gradually changed with temperature and at highertemperatures, and the unequivocal Rytov dip is observed.
Fig. II-1 Block diagram of Optical beating light scattering method.
112 H. Nomura et al.
A) VV spectra
Molecules of the liquid crystals are in uniaxial shape. In this case, the contribution of orienta-tional fluctuation to the light scattering is predominant and the central component of polarizedlight scattering spectrum density IVV (q, ω) can be reproduced as follows when the decay rate ofthe Brillouin peak and decay rate of reorientation Γ are much smaller than the Brillouin shift ωB.
IVV(q, ω ) =2ΓR
ω 2 + ΓR2
(II-1)
where ω is the angular frequency and ΓR is the half- width at half-height of spectrum and can bewritten as
ΓR = Γ – 4
3
q 2
ρ η SRΓ2
Γ2 + ω B2
(II-2)
where q is the scattering wave number, ρ is the density and ηS is the shear viscosity. UsuallyωB >> Γ holds so that ΓR could be equal to Γ. Value of Γ is determined by the usual curve fittingmethod and the reorientational relaxation times τ are obtained from Γ.
B) VH spectra
The intensity of depolarized light scattering spectrum is expressed by
Fig. II-2 Typical light scattering spectra observed in neat 5CB; (a) VV spectra (b) VH spectra. The experi-mental results are shown by solid circles and calculated results are shown by solid lines. Each Fig-ure. on the right side of spectrum refers to temperature (°C) of measurement. Scattering angle is6.01°.
113Collective Translational-Rotational Coupling Motion of Molecules in Liquids and Solutions
IVH(q, ω ) = 2Γω 2 + Γ2
sin2 θ2
+
2Γ ω 2 +η S
ρ q 22
(1 – R)
ω 2 – Γ η S
ρ q 2
2
+ ω 2 Γ +η S
ρ q 2 (1 – R)2
cos2 θ2
(II-3)
The scattering wave number q is expressed by the following equation;
q = 2πλ sin θ (II-4)
where λ is the wave length of incident light and θ is the scattering angle.The coupling parameter R can be obtained by usual curve fitting method. Data analysis of the
depolarized spectra was carried out for all Γ values. Errors in numerical values of Γ were less than3%. The solid lines in Fig. II-2 are the ones reproduced using the values of viscosity ηS and theobtained coupling parameters R. The agreement between the observed and reproduced results isexcellent.
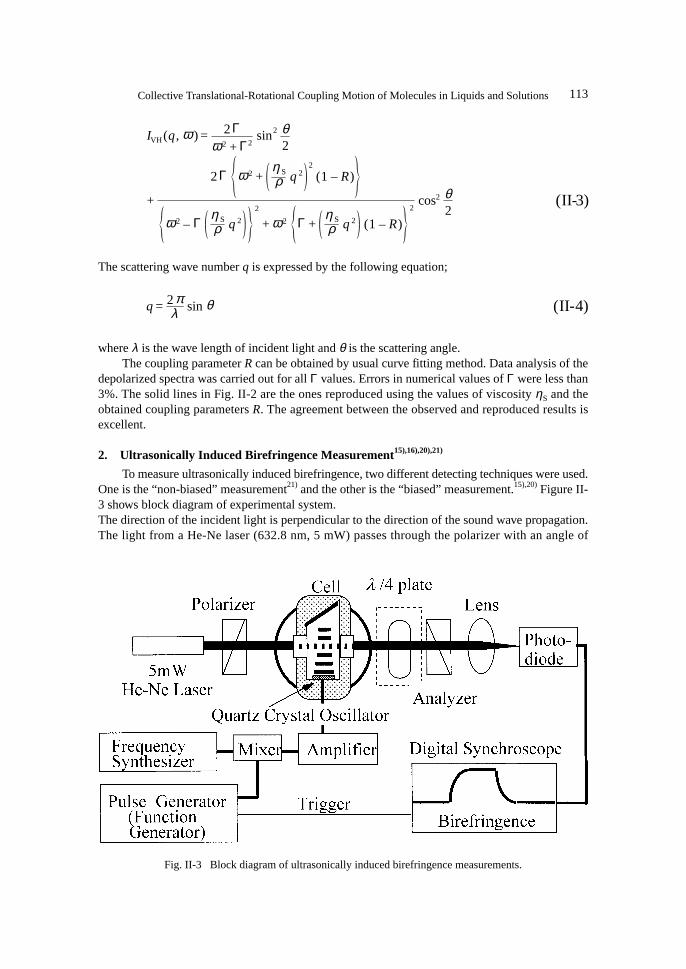
To measure ultrasonically induced birefringence, two different detecting techniques were used.One is the “non-biased” measurement21) and the other is the “biased” measurement.15),20) Figure II-3 shows block diagram of experimental system.The direction of the incident light is perpendicular to the direction of the sound wave propagation.The light from a He-Ne laser (632.8 nm, 5 mW) passes through the polarizer with an angle of
Fig. II-3 Block diagram of ultrasonically induced birefringence measurements.
114 H. Nomura et al.
polarization at 45°, sample cell, and analyzer. For non-biased detection, an analyzer is set at ex-tinction angle. For biased detection, a quarter wave plate is inserted and the analyzer is set with asmall offset angle β from its extinction position. If the acoustic field is applied to solutions, theoptical phase retardation ( is produced and the intensity of light passed through the analyzer in-creases. For |β| << 1 and |δ | << 1, the intensities of light passed through the analyzer are given by
I = I0 (δ / 2)2 + βδ + β 2 + Ib (II-5)
where I0 and Ib are the light intensities in the absence of the sound wave with the polarizer and theanalyzer being parallel and perpendicular, respectively. For the non-biased detection, β = 0, thephase retardation is given as,
δ = 2
I – Ib
I0
(II-6)
while for the biased detection, the phase retardation is given as,
δ =
I+ – I–
2 I0 β (II-7)
where the light intensities with offset angles ±β are described by I+ and I–, respectively. The bire-fringence ∆n is related to the phase retardation δ as follows.
∆ n = λδ2πd
(II-8)
where d is the optical path length.The ultrasonically induced birefringence from two different origins exists. One is the sinusoi-
dal birefringence which is proportional to the ultrasonic amplitude that is, the square root of theultrasonic intensity. The other is the stationary birefringence that is proportional to the ultrasonicintensity. As indicated in Eqs. (II-6) and (II-7), the phase retardation obtained by the non-biasedmeasurements is the root mean square one and thus the sign of birefringence cannot be obtained.The merit of this method is that both the sinusoidal and stationary term can be detected. The ∆n inthe order of 10–8 can be detected. In the biased measurement, the sinusoidal birefringence is aver-aged and only the stationary component is observed. In this case, the sign of the birefringence canbe obtained and high signal to noise (S/N) ratio can be realized if values of β are properly set as|δ | << |β| << 1. The ∆n in the order of 10–11 can be measured and we can distinguish the weakstationary birefringence against the sinusoidal one.
If the birefringence is stationary, the reorientational relaxation time τ is obtained by analyzingthe extinction curve. If the reorientational motion is expressed in terms of a single relaxation pro-cess, the extinction curve of the birefringence is given as
∆ n(t) = ∆ nmax exp (– t / τ ) (II-9)
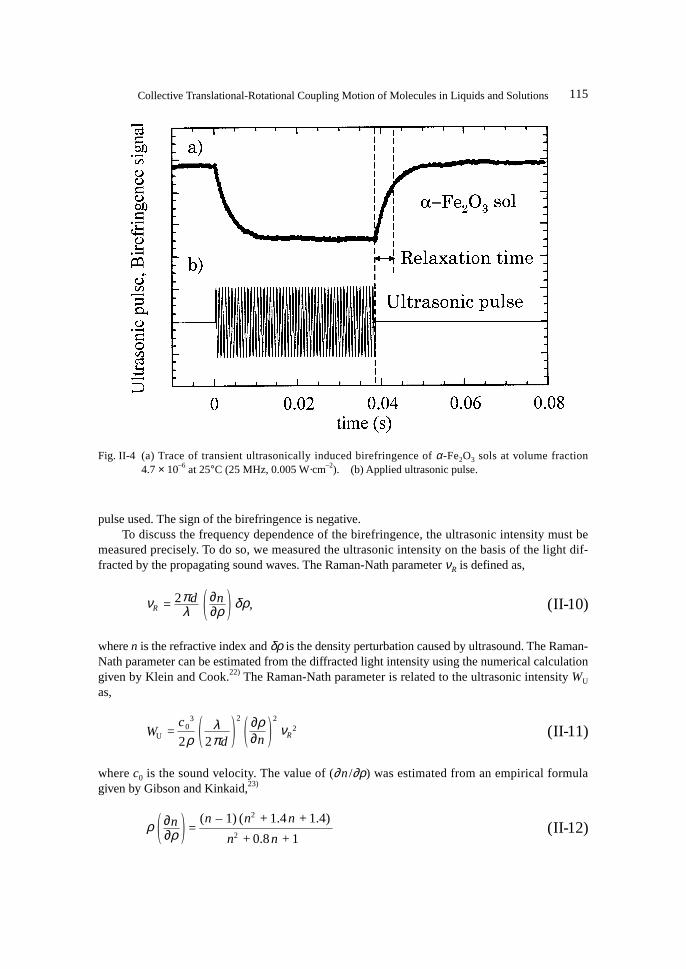
where ∆nmax the maximum value of ∆n(t).Figure II-4 shows the typical trace of ultrasonically induced birefringence signal for the α-hematite (Fe2O3) sol using the biased measurement technique and the waveform of the ultrasonic
115Collective Translational-Rotational Coupling Motion of Molecules in Liquids and Solutions
pulse used. The sign of the birefringence is negative.To discuss the frequency dependence of the birefringence, the ultrasonic intensity must be
measured precisely. To do so, we measured the ultrasonic intensity on the basis of the light dif-fracted by the propagating sound waves. The Raman-Nath parameter νR is defined as,
νR = 2πdλ
∂n∂ρ δρ, (II-10)
where n is the refractive index and δρ is the density perturbation caused by ultrasound. The Raman-Nath parameter can be estimated from the diffracted light intensity using the numerical calculationgiven by Klein and Cook.22) The Raman-Nath parameter is related to the ultrasonic intensity WU
as,
WU =
c03
2ρλ
2πd
2 ∂ρ∂n
2
νR2 (II-11)
where c0 is the sound velocity. The value of (∂n/∂ρ) was estimated from an empirical formulagiven by Gibson and Kinkaid,23)
ρ ∂n∂ρ =
(n – 1) (n2 + 1.4n + 1.4)
n2 + 0.8n + 1(II-12)
Fig. II-4 (a) Trace of transient ultrasonically induced birefringence of α-Fe2O3 sols at volume fraction4.7 × 10–6 at 25°C (25 MHz, 0.005 W·cm–2). (b) Applied ultrasonic pulse.
116 H. Nomura et al.
or by Lorentz-Lorenz equation,
ρ ∂n∂ρ =
(n2 – 1) (n2 + 2)
6n(II-13)
III. Translational and Rotational Coupling Parameter R17)
1. Introduction
A number of studies for molecular motions in liquid state have been carried out by light scat-tering measurements. For many liquids which consist of optically anisotropic molecules, a dip nearthe central frequency in the depolarized spectrum called the Rytov Dip, is observed. The spectrumhas been well understood with the microscopic “two variable” theories which were proposed byseveral authors.1),9),10),24)-27) In the theories, the Rytov dip originates from the coupling between ori-entational and shear modes of molecular motions in liquid state. To express the Rytov dip quanti-tatively a coupling parameter R has been introduced as a measure of the coupling. The value of thecoupling parameter is determined by the analysis of the depolarized light scattering spectrum withthe Rytov dip.
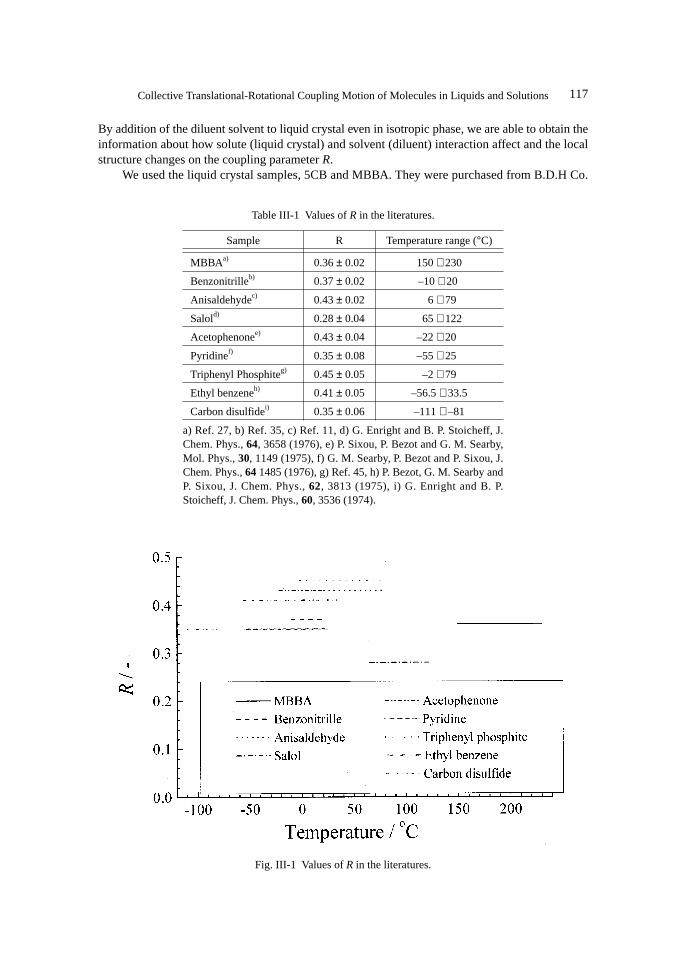
After the theoretical works,1),9),25),26) the Rytov Dip in the depolarized spectrum IVH(ω) havebeen observed in certain neat liquids such as aniline, nitrobenzene, quinoline, hexadfluorobenzeneand p-methoxybenzylidene-n-butylaniline (MBBA) in isotropic phase etc. Furthermore, the tem-perature and pressure dependence of the coupling parameter R also has been observed. Values of Rin the literatures are summerized in Table III-1 and Fig. III-1. The general features of the couplingparameter R of liquids state are the followings;(1) The values of the coupling parameter R in liquids state are almost around 0.4, independent of
the molecular structure.(2) The R did not depend on the temperature around in range and the pressure.(3) Solvent effect, that is viscosity and concentration of diluent, still are obscure because of the
limits of experimental accuracy.Alms et al.27) measured the depolarized light scattering spectra of p-methoxybenzylidene-n-
butylaniline (MBBA) over the temperature range of 150–230°C and estimated the coupling pa-rameter R. They have reported that the coupling parameters obtained were independent of tem-perature in the temperature ranges investigated. On the contrary, Kawamura et al.7) measured thecomplex shear modulus as a function of temperature and discussed the temperature dependence ofthe three viscosity parameters of p-n-pentyl p’-cyanobiphenyl (5CB) and MBBA.
Recently, Matsuoka et al.18) have observed the spectra of depolarized light scattering for p-n-hexyl p’-cyanobiphenyl (6CB). They adopted a new optical beating light scattering technique toobserve the Rytov dip near the phase transition point. In comparison with the conventional lightscattering technique with the Fabry-Perot interferometer, the new beating technique gives us moreaccurate depolarized light scattering spectra of liquids.
Comparing with the ordinary liquids such as aniline, nitrobenzene, quinoline andtripenylphosphite, the liquid crystal samples have some advantages; (1) a liquid crystal molecule isuniaxial rigid and anisotropic. (2) In the low temperature, liquids crystal takes a nematic orderedstructure, but above the phase transition temperature, they are in isotropic liquids state. By chang-ing the temperature near the phase transition point, we can change the liquid structure locally inbulk liquids. (3) In the isotropic phase far from the transition temperature, liquid crystals can beconsidered as purely isotropic ordinary liquids, because of their viscosity likely to usual ones. (4)
117Collective Translational-Rotational Coupling Motion of Molecules in Liquids and Solutions
By addition of the diluent solvent to liquid crystal even in isotropic phase, we are able to obtain theinformation about how solute (liquid crystal) and solvent (diluent) interaction affect and the localstructure changes on the coupling parameter R.
We used the liquid crystal samples, 5CB and MBBA. They were purchased from B.D.H Co.
Fig. III-1 Values of R in the literatures.
Table III-1 Values of R in the literatures.
Sample R Temperature range (°C)
MBBAa) 0.36 ± 0.02 150 ∼ 230
Benzonitrilleb) 0.37 ± 0.02 –10 ∼ 20
Anisaldehydec) 0.43 ± 0.02 6 ∼ 79
Salold) 0.28 ± 0.04 65 ∼ 122
Acetophenonee) 0.43 ± 0.04 –22 ∼ 20
Pyridinef) 0.35 ± 0.08 –55 ∼ 25
Triphenyl Phosphiteg) 0.45 ± 0.05 –2 ∼ 79
Ethyl benzeneh) 0.41 ± 0.05 –56.5 ∼ 33.5
Carbon disulfidei) 0.35 ± 0.06 –111 ∼ –81
a) Ref. 27, b) Ref. 35, c) Ref. 11, d) G. Enright and B. P. Stoicheff, J.Chem. Phys., 64, 3658 (1976), e) P. Sixou, P. Bezot and G. M. Searby,Mol. Phys., 30, 1149 (1975), f) G. M. Searby, P. Bezot and P. Sixou, J.Chem. Phys., 64 1485 (1976), g) Ref. 45, h) P. Bezot, G. M. Searby andP. Sixou, J. Chem. Phys., 62, 3813 (1975), i) G. Enright and B. P.Stoicheff, J. Chem. Phys., 60, 3536 (1974).
118 H. Nomura et al.
Ltd. and Tokyo Kasei Co. Ltd. respectively and used without further purification. The phase transi-tion temperatures are 35.3 and 46.7°C for 5CB and MBBA, respectively. We used freshly providedsamples because the phase transition temperature of these liquid crystals slightly changed gradu-ally with aging. The measuring temperature ranges were from 35.8 to 62.0°C and from 47.7 to65.6°C each for 5CB and MBBA. As dilulent, carbon tetrachloride and triphenylphosphite werechosen by reasons of their non-polar, spherical and non-spherical properties. Especially,triphenylphosphite (TPP) showed the Rytov Dip in depolarized light scattering measurement.
2. Theoretical Background
Appearance of the Rytov dip can be explained by the two variable theory. Alms et al.27) com-pared the microscopic two variable theory. with the de Genne’s phenomenological theory, and foundthe relation between the coupling parameter R and the de Gennes’ three viscosity parameters,3) R =2µ2/(ηSν). According to the two variable theory, the coupling parameter R between translationaland orientational modes of molecular motions in liquid state has been expressed as follows:
R = m
ρη SΓNkB T ζxz2 0
∞σ
xz+(t) ζ
xz* (0) dt
2
(III-1)
where ρ is the density, ηS is the shear viscosity, Γ is decay rate of reorientation, N is the number ofmolecules, T is the temperature, kB is the Boltzmann constant, m is the molecular mass and
σ xz = –ρq Σ
ivx (i) exp (– iqz i) (III-2)
ζxz
= Σi
ζxz (i) exp (– iqz i) (III-3)
where
ζxz (i) = µxi µzi (III-4)
expresses the orientation of the i th molecule in the laboratory xz frame, µxi is the x component of aunit vector along a certain axis of the i th molecule, µzi is the z component, q is the wavenumberand vx.(i) is the velocity i th molecule in the laboratory xz frame.
On the other hand, Alms et al.27) have derived the following expressions for the uniaxial mol-ecule such as liquid crystal:
Γ–1 = g 2
V* η S
kB T= τ (III-5)
ζxz2
= N15
g 2 (III-6)
V* is the effective molecular volume of the rotating molecule, τ is the reorientational relaxationtime and g2 is the static pair correlation function expressed as
119Collective Translational-Rotational Coupling Motion of Molecules in Liquids and Solutions
g 2 = 1 + Σ
i ≠ j
N ζxz (i) ζxz* ( j)
ζxz (i) ζxz* (i)
(III-7)
Using these notations, the coupling parameter R is reduced to the following expression:
R = 15mV*
ρ (NkB T )2 0
∞
σ xz+(t) ζxz
* (0) dt
2
(III-8)
3. Coupling between the Translational and Reorientational Motion of Molecules in NeatLiquids Crystal in Isotropic Phase
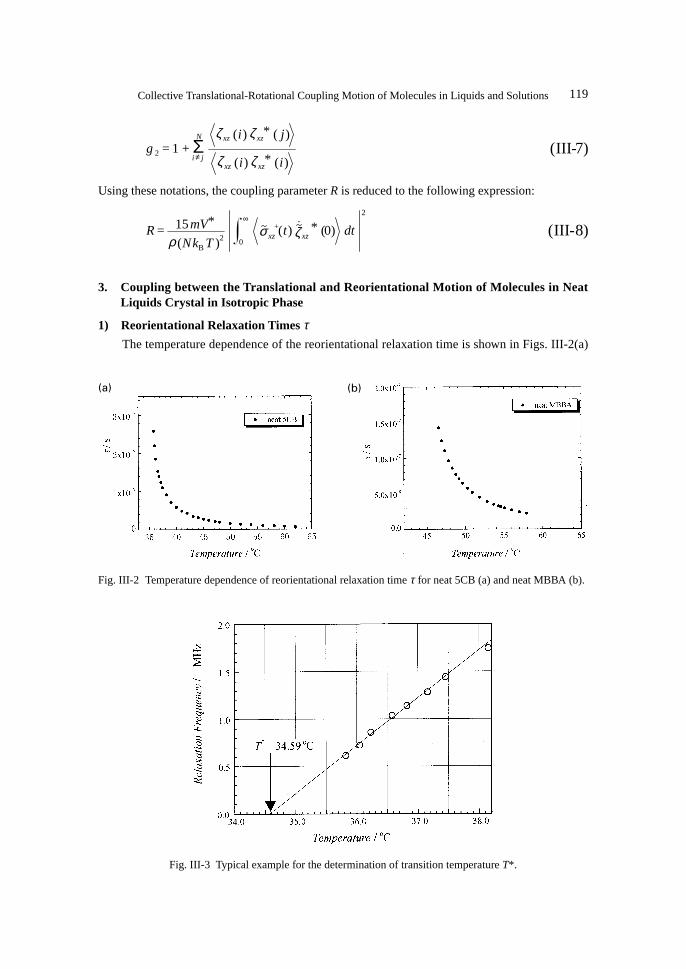
1) Reorientational Relaxation Times τThe temperature dependence of the reorientational relaxation time is shown in Figs. III-2(a)
Fig. III-3 Typical example for the determination of transition temperature T*.
Fig. III-2 Temperature dependence of reorientational relaxation time τ for neat 5CB (a) and neat MBBA (b).
(a) (b)
120 H. Nomura et al.
and III-2(b) for 5CB and MBBA, respectively.Usually the phase transition temperature, TC is determined as the point at which the milky
turbidity of liquid crystal disappears. We extrapolated the plot of between Γ/2π and T and esti-mated “the transition temperature T* as shown in Fig. III-3, because at the temperature the orienta-tional relaxation time will be infinitive, that is τ → ∞.
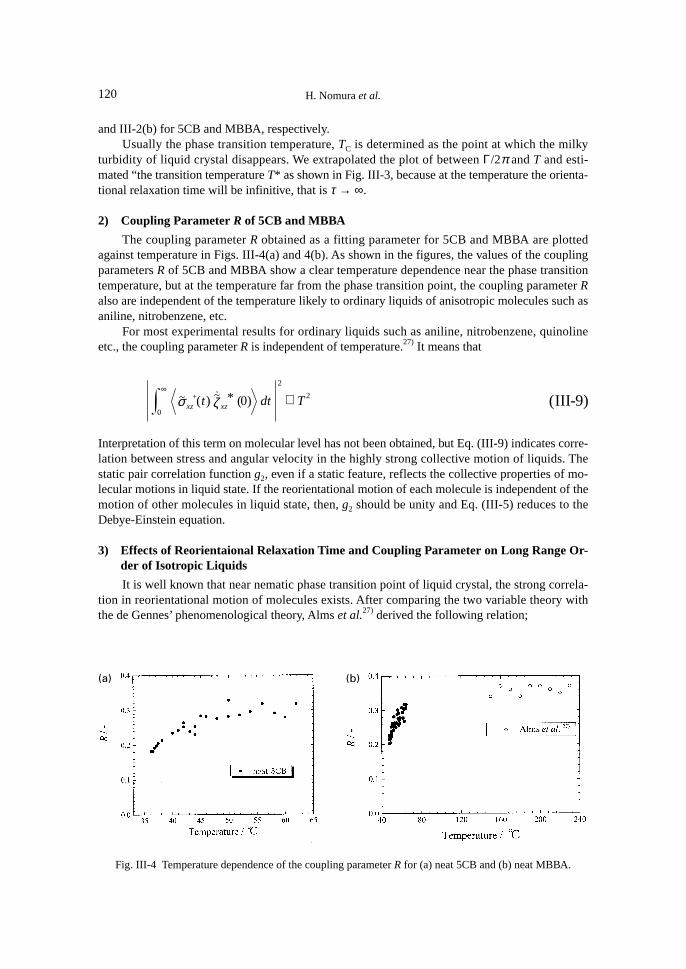
2) Coupling Parameter R of 5CB and MBBA
The coupling parameter R obtained as a fitting parameter for 5CB and MBBA are plottedagainst temperature in Figs. III-4(a) and 4(b). As shown in the figures, the values of the couplingparameters R of 5CB and MBBA show a clear temperature dependence near the phase transitiontemperature, but at the temperature far from the phase transition point, the coupling parameter Ralso are independent of the temperature likely to ordinary liquids of anisotropic molecules such asaniline, nitrobenzene, etc.
For most experimental results for ordinary liquids such as aniline, nitrobenzene, quinolineetc., the coupling parameter R is independent of temperature.27) It means that
0
∞
σ xz+(t) ζ xz
* (0) dt
2
∝ T 2 (III-9)
Interpretation of this term on molecular level has not been obtained, but Eq. (III-9) indicates corre-lation between stress and angular velocity in the highly strong collective motion of liquids. Thestatic pair correlation function g2, even if a static feature, reflects the collective properties of mo-lecular motions in liquid state. If the reorientational motion of each molecule is independent of themotion of other molecules in liquid state, then, g2 should be unity and Eq. (III-5) reduces to theDebye-Einstein equation.
3) Effects of Reorientaional Relaxation Time and Coupling Parameter on Long Range Or-der of Isotropic Liquids
It is well known that near nematic phase transition point of liquid crystal, the strong correla-tion in reorientational motion of molecules exists. After comparing the two variable theory withthe de Gennes’ phenomenological theory, Alms et al.27) derived the following relation;
Fig. III-4 Temperature dependence of the coupling parameter R for (a) neat 5CB and (b) neat MBBA.
(a) (b)
121Collective Translational-Rotational Coupling Motion of Molecules in Liquids and Solutions
g 2 = TT – T* = 1 + T*
T – T* (III-10)
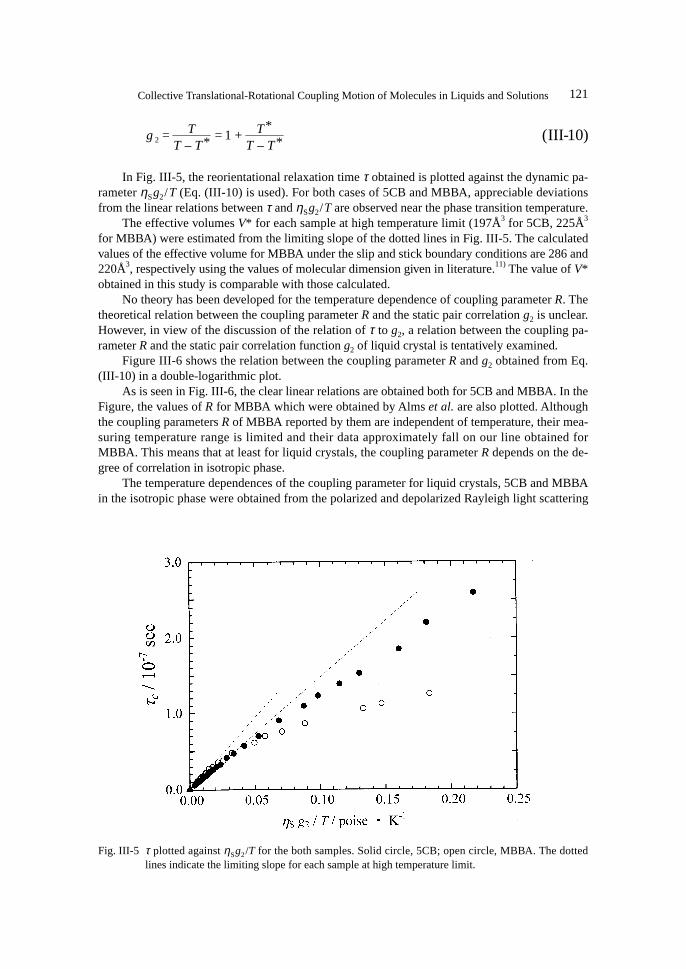
In Fig. III-5, the reorientational relaxation time τ obtained is plotted against the dynamic pa-rameter ηSg2/T (Eq. (III-10) is used). For both cases of 5CB and MBBA, appreciable deviationsfrom the linear relations between τ and ηSg2/T are observed near the phase transition temperature.
The effective volumes V* for each sample at high temperature limit (197Å3 for 5CB, 225Å3
for MBBA) were estimated from the limiting slope of the dotted lines in Fig. III-5. The calculatedvalues of the effective volume for MBBA under the slip and stick boundary conditions are 286 and220Å3, respectively using the values of molecular dimension given in literature.11) The value of V*obtained in this study is comparable with those calculated.
No theory has been developed for the temperature dependence of coupling parameter R. Thetheoretical relation between the coupling parameter R and the static pair correlation g2 is unclear.However, in view of the discussion of the relation of τ to g2, a relation between the coupling pa-rameter R and the static pair correlation function g2 of liquid crystal is tentatively examined.
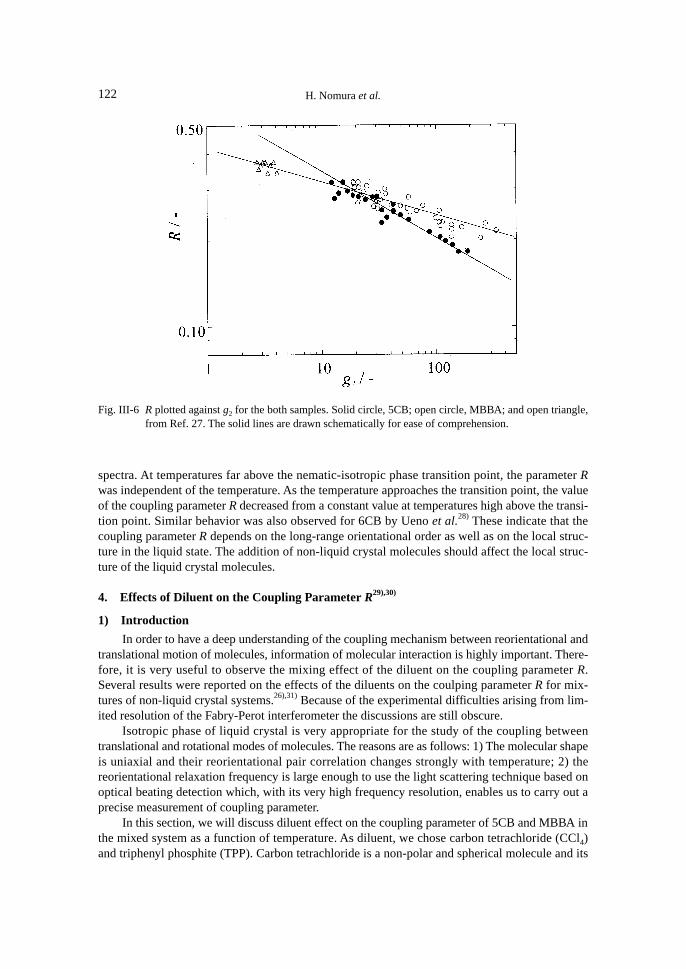
Figure III-6 shows the relation between the coupling parameter R and g2 obtained from Eq.(III-10) in a double-logarithmic plot.
As is seen in Fig. III-6, the clear linear relations are obtained both for 5CB and MBBA. In theFigure, the values of R for MBBA which were obtained by Alms et al. are also plotted. Althoughthe coupling parameters R of MBBA reported by them are independent of temperature, their mea-suring temperature range is limited and their data approximately fall on our line obtained forMBBA. This means that at least for liquid crystals, the coupling parameter R depends on the de-gree of correlation in isotropic phase.
The temperature dependences of the coupling parameter for liquid crystals, 5CB and MBBAin the isotropic phase were obtained from the polarized and depolarized Rayleigh light scattering
Fig. III-5 τ plotted against ηSg2/T for the both samples. Solid circle, 5CB; open circle, MBBA. The dottedlines indicate the limiting slope for each sample at high temperature limit.
122 H. Nomura et al.
spectra. At temperatures far above the nematic-isotropic phase transition point, the parameter Rwas independent of the temperature. As the temperature approaches the transition point, the valueof the coupling parameter R decreased from a constant value at temperatures high above the transi-tion point. Similar behavior was also observed for 6CB by Ueno et al.28) These indicate that thecoupling parameter R depends on the long-range orientational order as well as on the local struc-ture in the liquid state. The addition of non-liquid crystal molecules should affect the local struc-ture of the liquid crystal molecules.
4. Effects of Diluent on the Coupling Parameter R29),30)
1) Introduction
In order to have a deep understanding of the coupling mechanism between reorientational andtranslational motion of molecules, information of molecular interaction is highly important. There-fore, it is very useful to observe the mixing effect of the diluent on the coupling parameter R.Several results were reported on the effects of the diluents on the coulping parameter R for mix-tures of non-liquid crystal systems.26),31) Because of the experimental difficulties arising from lim-ited resolution of the Fabry-Perot interferometer the discussions are still obscure.
Isotropic phase of liquid crystal is very appropriate for the study of the coupling betweentranslational and rotational modes of molecules. The reasons are as follows: 1) The molecular shapeis uniaxial and their reorientational pair correlation changes strongly with temperature; 2) thereorientational relaxation frequency is large enough to use the light scattering technique based onoptical beating detection which, with its very high frequency resolution, enables us to carry out aprecise measurement of coupling parameter.
In this section, we will discuss diluent effect on the coupling parameter of 5CB and MBBA inthe mixed system as a function of temperature. As diluent, we chose carbon tetrachloride (CCl4)and triphenyl phosphite (TPP). Carbon tetrachloride is a non-polar and spherical molecule and its
Fig. III-6 R plotted against g2 for the both samples. Solid circle, 5CB; open circle, MBBA; and open triangle,from Ref. 27. The solid lines are drawn schematically for ease of comprehension.
123Collective Translational-Rotational Coupling Motion of Molecules in Liquids and Solutions
miscibility for 5CB is poor but for MBBA fairy good. On the contrary, TPP is a nearly symmetrictop molecule and quite miscible with 5CB. Besides, the Rytov dip has been observed in neat liquidTPP.8),32)
In addition, we will also discuss the temperature and diluent concentration dependence of thecoupling parameter R by combining with the information of local structure of 5CB and its mixturein isotropic phase obtained by the NMR and Raman scattering measurements.
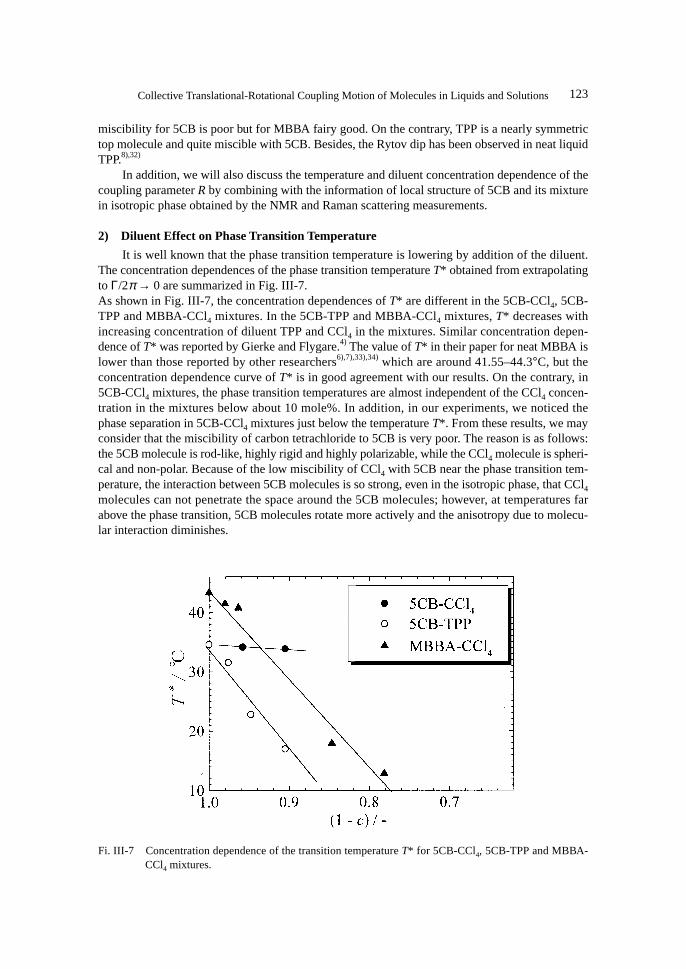
2) Diluent Effect on Phase Transition Temperature
It is well known that the phase transition temperature is lowering by addition of the diluent.The concentration dependences of the phase transition temperature T* obtained from extrapolatingto Γ/2π → 0 are summarized in Fig. III-7.As shown in Fig. III-7, the concentration dependences of T* are different in the 5CB-CCl4, 5CB-TPP and MBBA-CCl4 mixtures. In the 5CB-TPP and MBBA-CCl4 mixtures, T* decreases withincreasing concentration of diluent TPP and CCl4 in the mixtures. Similar concentration depen-dence of T* was reported by Gierke and Flygare.4) The value of T* in their paper for neat MBBA islower than those reported by other researchers6),7),33),34) which are around 41.55–44.3°C, but theconcentration dependence curve of T* is in good agreement with our results. On the contrary, in5CB-CCl4 mixtures, the phase transition temperatures are almost independent of the CCl4 concen-tration in the mixtures below about 10 mole%. In addition, in our experiments, we noticed thephase separation in 5CB-CCl4 mixtures just below the temperature T*. From these results, we mayconsider that the miscibility of carbon tetrachloride to 5CB is very poor. The reason is as follows:the 5CB molecule is rod-like, highly rigid and highly polarizable, while the CCl4 molecule is spheri-cal and non-polar. Because of the low miscibility of CCl4 with 5CB near the phase transition tem-perature, the interaction between 5CB molecules is so strong, even in the isotropic phase, that CCl4
molecules can not penetrate the space around the 5CB molecules; however, at temperatures farabove the phase transition, 5CB molecules rotate more actively and the anisotropy due to molecu-lar interaction diminishes.
Fi. III-7 Concentration dependence of the transition temperature T* for 5CB-CCl4, 5CB-TPP and MBBA-CCl4 mixtures.
124 H. Nomura et al.
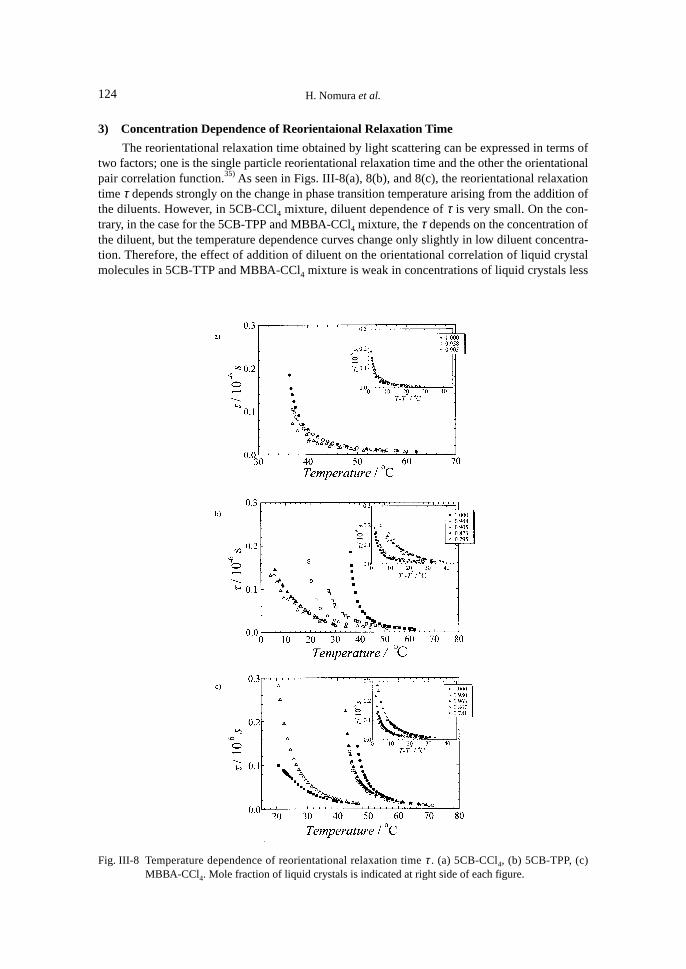
3) Concentration Dependence of Reorientaional Relaxation Time
The reorientational relaxation time obtained by light scattering can be expressed in terms oftwo factors; one is the single particle reorientational relaxation time and the other the orientationalpair correlation function.35) As seen in Figs. III-8(a), 8(b), and 8(c), the reorientational relaxationtime τ depends strongly on the change in phase transition temperature arising from the addition ofthe diluents. However, in 5CB-CCl4 mixture, diluent dependence of τ is very small. On the con-trary, in the case for the 5CB-TPP and MBBA-CCl4 mixture, the τ depends on the concentration ofthe diluent, but the temperature dependence curves change only slightly in low diluent concentra-tion. Therefore, the effect of addition of diluent on the orientational correlation of liquid crystalmolecules in 5CB-TTP and MBBA-CCl4 mixture is weak in concentrations of liquid crystals less
Fig. III-8 Temperature dependence of reorientational relaxation time τ . (a) 5CB-CCl4, (b) 5CB-TPP, (c)MBBA-CCl4. Mole fraction of liquid crystals is indicated at right side of each figure.
125Collective Translational-Rotational Coupling Motion of Molecules in Liquids and Solutions
than 5 mole% in which variation of T* is less than 10°C.As shown previously, in isotropic phase of liquid crystal system, the reorientational relaxation
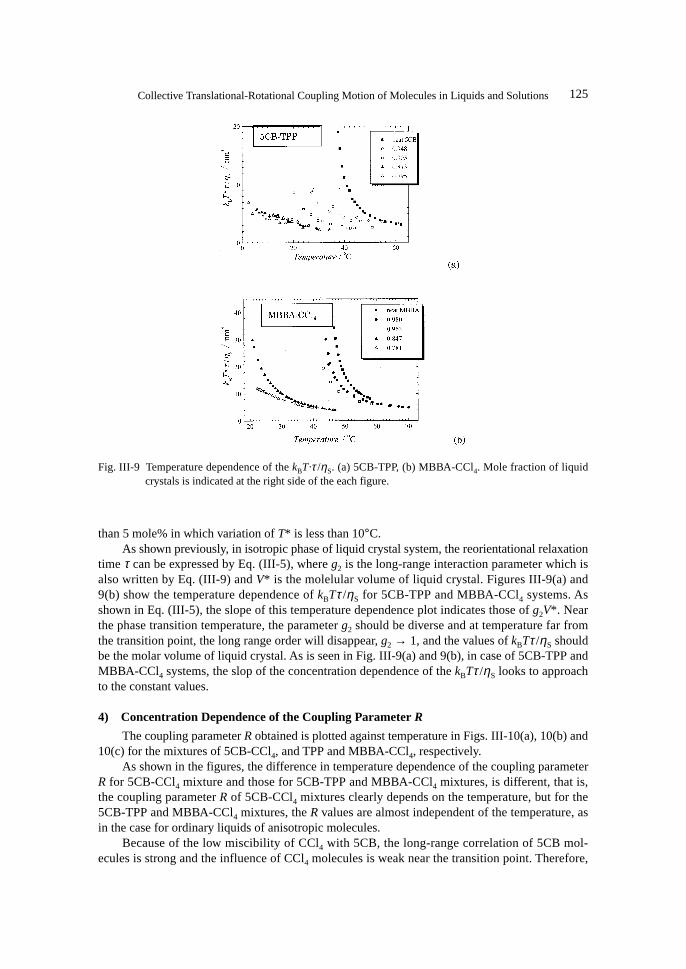
time τ can be expressed by Eq. (III-5), where g2 is the long-range interaction parameter which isalso written by Eq. (III-9) and V* is the molelular volume of liquid crystal. Figures III-9(a) and9(b) show the temperature dependence of kBTτ /ηS for 5CB-TPP and MBBA-CCl4 systems. Asshown in Eq. (III-5), the slope of this temperature dependence plot indicates those of g2V*. Nearthe phase transition temperature, the parameter g2 should be diverse and at temperature far fromthe transition point, the long range order will disappear, g2 → 1, and the values of kBTτ /ηS shouldbe the molar volume of liquid crystal. As is seen in Fig. III-9(a) and 9(b), in case of 5CB-TPP andMBBA-CCl4 systems, the slop of the concentration dependence of the kBTτ /ηS looks to approachto the constant values.
4) Concentration Dependence of the Coupling Parameter R
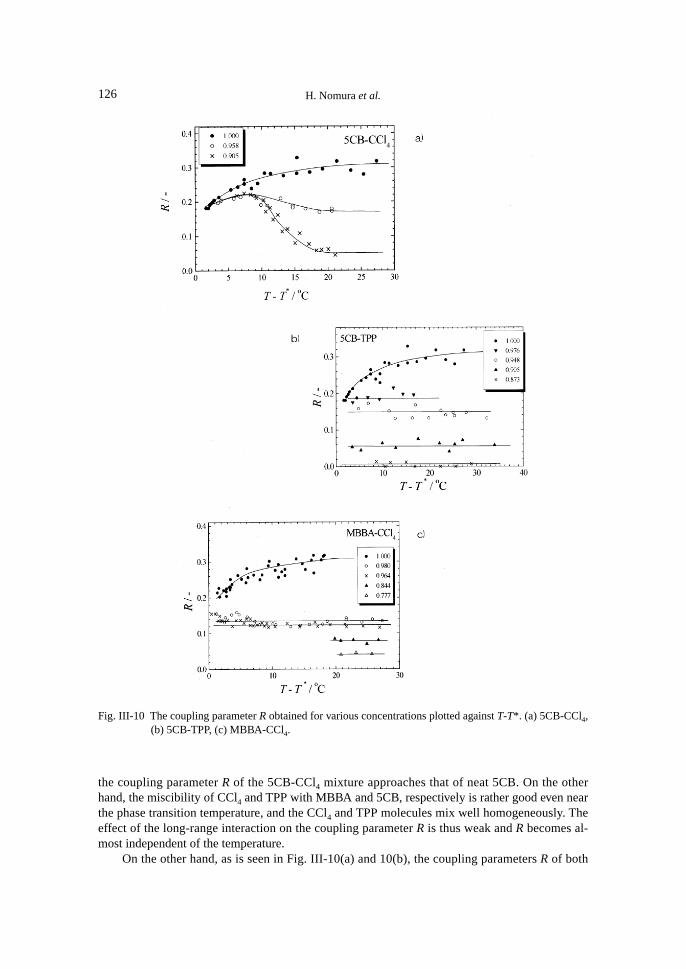
The coupling parameter R obtained is plotted against temperature in Figs. III-10(a), 10(b) and10(c) for the mixtures of 5CB-CCl4, and TPP and MBBA-CCl4, respectively.
As shown in the figures, the difference in temperature dependence of the coupling parameterR for 5CB-CCl4 mixture and those for 5CB-TPP and MBBA-CCl4 mixtures, is different, that is,the coupling parameter R of 5CB-CCl4 mixtures clearly depends on the temperature, but for the5CB-TPP and MBBA-CCl4 mixtures, the R values are almost independent of the temperature, asin the case for ordinary liquids of anisotropic molecules.
Because of the low miscibility of CCl4 with 5CB, the long-range correlation of 5CB mol-ecules is strong and the influence of CCl4 molecules is weak near the transition point. Therefore,
Fig. III-9 Temperature dependence of the kBT·τ /ηS. (a) 5CB-TPP, (b) MBBA-CCl4. Mole fraction of liquidcrystals is indicated at the right side of the each figure.
126 H. Nomura et al.
the coupling parameter R of the 5CB-CCl4 mixture approaches that of neat 5CB. On the otherhand, the miscibility of CCl4 and TPP with MBBA and 5CB, respectively is rather good even nearthe phase transition temperature, and the CCl4 and TPP molecules mix well homogeneously. Theeffect of the long-range interaction on the coupling parameter R is thus weak and R becomes al-most independent of the temperature.
On the other hand, as is seen in Fig. III-10(a) and 10(b), the coupling parameters R of both
Fig. III-10 The coupling parameter R obtained for various concentrations plotted against T-T*. (a) 5CB-CCl4,(b) 5CB-TPP, (c) MBBA-CCl4.
127Collective Translational-Rotational Coupling Motion of Molecules in Liquids and Solutions
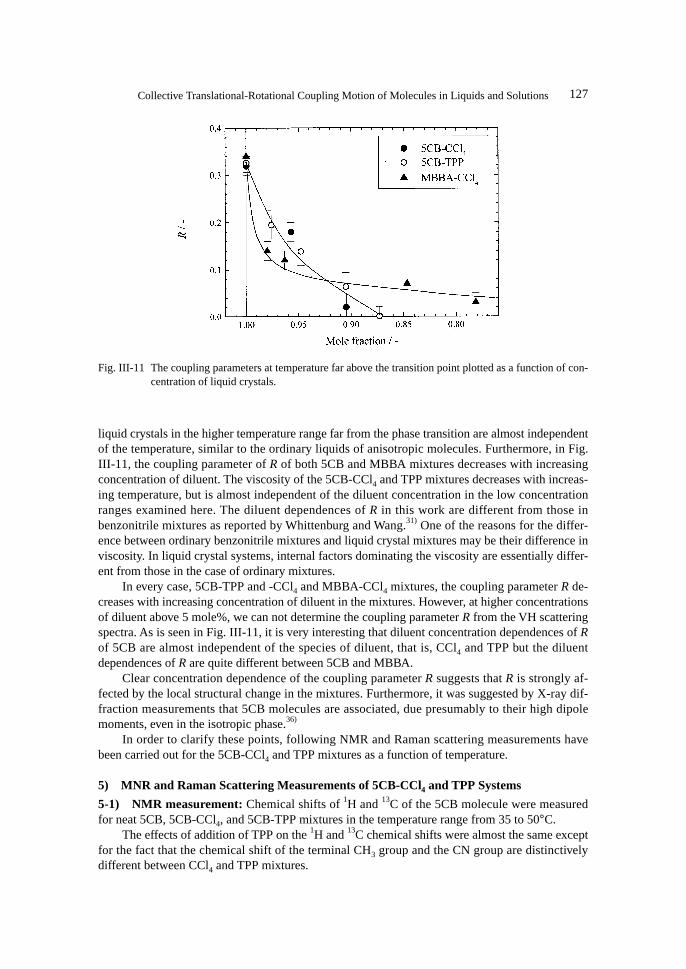
liquid crystals in the higher temperature range far from the phase transition are almost independentof the temperature, similar to the ordinary liquids of anisotropic molecules. Furthermore, in Fig.III-11, the coupling parameter of R of both 5CB and MBBA mixtures decreases with increasingconcentration of diluent. The viscosity of the 5CB-CCl4 and TPP mixtures decreases with increas-ing temperature, but is almost independent of the diluent concentration in the low concentrationranges examined here. The diluent dependences of R in this work are different from those inbenzonitrile mixtures as reported by Whittenburg and Wang.31) One of the reasons for the differ-ence between ordinary benzonitrile mixtures and liquid crystal mixtures may be their difference inviscosity. In liquid crystal systems, internal factors dominating the viscosity are essentially differ-ent from those in the case of ordinary mixtures.
In every case, 5CB-TPP and -CCl4 and MBBA-CCl4 mixtures, the coupling parameter R de-creases with increasing concentration of diluent in the mixtures. However, at higher concentrationsof diluent above 5 mole%, we can not determine the coupling parameter R from the VH scatteringspectra. As is seen in Fig. III-11, it is very interesting that diluent concentration dependences of Rof 5CB are almost independent of the species of diluent, that is, CCl4 and TPP but the diluentdependences of R are quite different between 5CB and MBBA.
Clear concentration dependence of the coupling parameter R suggests that R is strongly af-fected by the local structural change in the mixtures. Furthermore, it was suggested by X-ray dif-fraction measurements that 5CB molecules are associated, due presumably to their high dipolemoments, even in the isotropic phase.36)
In order to clarify these points, following NMR and Raman scattering measurements havebeen carried out for the 5CB-CCl4 and TPP mixtures as a function of temperature.
5) MNR and Raman Scattering Measurements of 5CB-CCl4 and TPP Systems
5-1) NMR measurement: Chemical shifts of 1H and 13C of the 5CB molecule were measuredfor neat 5CB, 5CB-CCl4, and 5CB-TPP mixtures in the temperature range from 35 to 50°C.
The effects of addition of TPP on the 1H and 13C chemical shifts were almost the same exceptfor the fact that the chemical shift of the terminal CH3 group and the CN group are distinctivelydifferent between CCl4 and TPP mixtures.
Fig. III-11 The coupling parameters at temperature far above the transition point plotted as a function of con-centration of liquid crystals.
128 H. Nomura et al.
The chemical shifts σ of neat 5CB, 5CB-CCl4, and 5CB-TPP mixtures shifted linearly to higherand/or lower field (upfield and/or downfield shift) with increasing temperature. What can be de-duced from the NMR measurement are the following:i) No remarkable differences in dσ/dT exist among the chemical shifts of 1H and 13C in 5CB
molecule in neat and mixtures.ii) Increase in temperature gives rise to the downfield shift of the chemical shifts of 1H of the
alkyl group and the changes in the middle part of the alkyl groups are remarkable.iii) 13C chemical shifts of the alkyl group show the upfield shift by the γ -effects with increasing
number of the gauche part in the alkyl chain. The result suggests that the motion of the alkylgroup becomes more active with increasing temperature for every mixture.
iv) On the contrary, 13C chemical shift of the biphenyl group shows downfield shift. This is at-tributable to the stacking effects of biphenyl groups. The tumbling motion around the C-Cbond between the phenyl groups becomes more frequent with temperature and the co-plannerstructure of the biphenyl group will be increased.
v) Upfield shift of 13C chemical shift of the terminal CN group may be caused by the interactionwith the nearest neighbors around the terminal CN group.
5-2) Raman scattering mesurement: Raman spectra for neat 5CB, 5CB-CCl4 (10 mole%) and5CB-TPP (10 mole%) mixtures were obtained as a function of temperature. The observed Ramanshifts of each vibration in neat 5CB are in good agreement with those by Gray and Mosley.37) Nodifference among the Raman bands in neat and mixtures was observed. Temperature dependenceof the three strong Raman shifts, that is, the C-C stretching of aromatic ring, the C-C stretching ofbiphenyl link and the CN stretching vibration were observed in neat 5CB and 5CB-CCl4 mixture.These Raman bands shift to lower frequency side with increasing temperature, but the changes inRaman shifts are less than 1 cm–1. These results show that the molecular structure, especially aro-matic part of 5CB molecule is not influenced by increase in temperature nor addition of diluent.
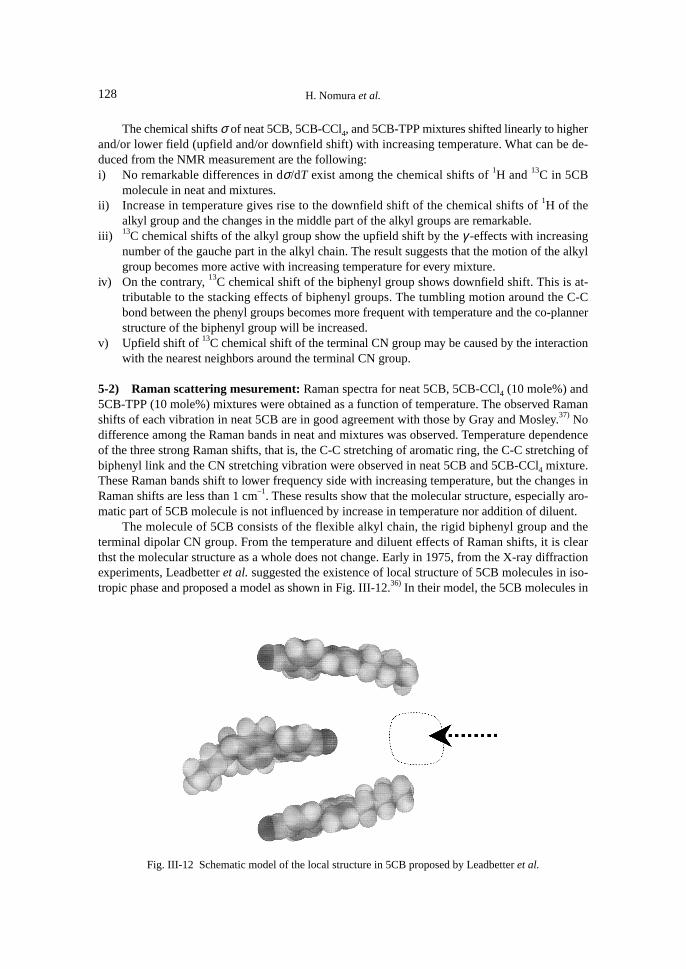
The molecule of 5CB consists of the flexible alkyl chain, the rigid biphenyl group and theterminal dipolar CN group. From the temperature and diluent effects of Raman shifts, it is clearthst the molecular structure as a whole does not change. Early in 1975, from the X-ray diffractionexperiments, Leadbetter et al. suggested the existence of local structure of 5CB molecules in iso-tropic phase and proposed a model as shown in Fig. III-12.36) In their model, the 5CB molecules in
Fig. III-12 Schematic model of the local structure in 5CB proposed by Leadbetter et al.
129Collective Translational-Rotational Coupling Motion of Molecules in Liquids and Solutions
the liquid state are arranged so that their dipoles are anti-parallel and their biphenyl groups arestacked.
Our results of NMR measurements confirmed their model one step further. By addition ofdiluent, the diluent molecule will approach the dotted region from the outer side as shown in Fig.III-12. Therefore, the 1H and 13C chemical shifts of the terminal methyl and CN group are influ-enced to an different extent by TPP and CCl4, respectively.
6) Local Structure and Coupling Parameter
The temperature dependence of coupling parameter R of 5CB-TPP MBBA-CCl4 mixtures and5CB-CCl4 mixture can be interpreted as follows; even in the isotropic phase, the local structure of5CB will exist at any temperature. The temperature dependence of R is ascribed to the local struc-ture changes induced by the temperature changes. The local structure changes are related to themiscibility of the diluents. Therefore, the effects of TPP and CCl4 on the temperature dependenceof the coupling parameter R of 5CB are different.
The concentration dependence of the coupling parameter R in the region far from the transi-tion temperature can be considered as follows; The local structure is influenced by addition ofdiluent. With loosing the local structure, the coupling parameter R will decrease. No differenceremains in the miscibility of TPP and CCl4 with 5CB in the higher temperature region. For thisreason the coupling parameter R will only depend on the amount of diluent and be independent ofthe diluent species.
IV. Ultrasonically Induced Birefringence and Coupling Parameter R21)
–Theoretical Considerations–
1. Introduction
Birefringence has been observed in some liquids and solutions under the irradiation of longi-tudinal ultrasounds.15),20),38)-42) For large particles of anisotropic shape such as rod like and planarcolloidal particles, ultrasonic radiation pressure produces a stationary torque on the particles andinduces reorientational order as a whole, because the orientational relaxation frequency of par-ticles is much smaller than that of ultrasound frequency. In this case, the induced birefringence isproportional to the ultrasonic intensity.15),20),38)-40) The dynamical properties of large particles canbe investigated by following the decay of the birefringence after rapid cessation of ultrasonic irra-diation.15),20),38)-40)
For neat liquids, however, a sinusoidal velocity gradient can directly produce sinusoidal ori-entational order. The reorientational order produced is not uniform but propagates as waves andthe induced birefringence should be proportional to the ultrasonic amplitude, that is, the squareroot of the ultrasonic intensity.12),38),41),42) In the neat liquids, we cannot obtain the transient decaycurve after rapid cessation of ultrasonic irradiation. If the relaxation frequency for reorientationalmotion is close to the applied ultrasound frequency, the birefringence per amplitude of the appliedultrasonic wave should be affected by the reorientational relaxation processes of the molecules.Measurement of birefringence as a function of frequency gives information of the reorientationalmotion in liquids.
Problems with regard to the coupling of the reorientational mode to the translationalmode have been investigated mainly by flow birefringence and VH depolarized light scatter-ing.1),3),11),27),43)-48) Theories for the flow birefringence and the VH depolarized light scattering wereconstructed independently on the basis of the de Gennes’ phenomenological theory3),27),43),44) and
130 H. Nomura et al.
irreversible statistical mechanics.1),2),11),45)-47) In both theories, the coupling of reorientational modeto the shear mode was taken into account. The expressions derived from both theories are consis-tent each other.27) In the case of ultrasonically induced birefringence, where coupling of thereorientational mode to the longitudinal mode should be taken into account, the formula for thebirefringence from the irreversible statistical treatment has already been derived by Lipeles andKivelson.48) The problem of the coupling of reorientational mode to the longitudinal mode shouldbe also taken into account in derivation of the spectra density for the polarized VV and the depo-larized VH light scattering. Kivelson and co-workers have extensively investigated the problemfrom the irreversible statistical mechanics.32) Grubbs and MacPhail investigated the line shape ofstimulated Brillouin gain spectra and discussed the coupling of the reorientational mode to thelongitudinal mode.49) Unlike the earlier theory of Lipeles and Kivelson,48) they used four indepen-dent variables to derive the spectral density for the VV light scattering. On the other hand, Wangderived formulae for the spectrum of density fluctuation of the VV light scattering from the deGennes’ approach.50) In this paper, we will present a theoretical expression of the ultrasonicallyinduced birefringence in terms of the de Gennes’ phenomenological theory and compare it to thatobtained by Lipeles and Kivelson. We also compare our results with the earlier theories.38),51)-53)
The isotropic phase of liquid crystals is most appropriate to examine the expression obtainedhere, because the relaxation frequencies of the orientational motions are the same order magnitudeas the ultrasonic frequencies usually used for ultrasonic relaxation studies.17) Besides, the flowbirefringence for isotropic phase of liquid crystal, 5CB, has been already reported by Martinoty etal.42) The values of the flow birefringence and the relaxation frequencies are required to reproducethe frequency dependence of the ultrasonically induced birefringence.
2. Theory
Stress induced birefringences in liquids of anisotropic molecules, such as those induced ultra-sonically or by flow, can be understood in the theoretical frame work of de Gennes’ phenomeno-logical treatment3),43) of the coupling of the reorientational order parameter to the strain rate tensorfor an anisotropic molecule in liquids and solutions. First, we will present the generalized trans-port equations taking into account coupling of the orientational order to the strain rate tensor. Sec-ondly, we will discuss the expressions for ultrasonically induced birefringence.
1) Transport Equations
To obtain general expressions for the transport equations, we need the equations of mass andmomentum conservation:
δρ + ρ∂k vk = 0 (IV-1)
ρvα = ∂β (σαβ – δpδαβ ) (IV-2)
where ρ is the equilibrium density, δρ and δp are the mass and pressure fluctuations, respectively,σαβ is the stress tensor and vα is the velocity vector and repeated indices are summed. For the sakeof simplicity, we neglect here the effects of temperature fluctuations. The stress tensor and strainrate tensor, σαβ and Aαβ can be written as the sum of isotropic and anisotropic parts:
σαβ = σαβi + σαβ
a (IV-3)
Aαβ = Aαβi + Aαβ
a (IV-4)
131Collective Translational-Rotational Coupling Motion of Molecules in Liquids and Solutions
The isotropic and anisotropic parts of the strain rate tensor are respectively written as follows,
Aαβi = ∂k vk δαβ / 3 (IV-5)
Aαβa = (∂α vβ + ∂β vα )/ 2 – ∂k vk δαβ / 3 (IV-6)
To consider the coupling of translational mode to reorientational mode, we will use the de Gennes’phenomenological treatment and take the tensor order parameter of molecular reorientation Qαβand its conjugated stress φαβ as internal variables.3),43) Since the tensor order parameter is anisotro-pic (i. e. traceless), the anisotropic part of the σαβ and Aαβ can couple to the reorientational mode.The relation between “force” and “flow” can be thus written by the expression of non-equilibriumthermodynamics as follows:
σαβi = 3η VAαβ
i (IV-7)
σαβa = 2η SAαβ
a + 2µQαβ (IV-8)
φαβ = 2µAαβa + νQ αβ (IV-9)
where ηV is the volume viscosity, ηS is the shear viscosity, and µ and ν are viscosity parametersintroduced by de Gennes: µ is a measure of coupling between Qαβ and anisotropic part of the flowfield, while ν is related to the relaxation of Qαβ. The dot above Qαβ denotes taking time derivative.
In the original de Gennes’ theory, the strain rate tensor Aαβ = (∂α vβ + ∂β vα)/23),43) was used inEqs. (IV-8) and (IV-9). He only dealt with incompressible fluids in which case the relation Aαβ =Aαβ
a holds. To extend his treatment to the general case, for example plane sound wave propagation,the anisotropic part of the strain rate tensor should be coupled to the tensor order parameter Qαβ. Ifthe fluctuation of Qαβ is small, the relation of Qαβ and φαβ is written as,3),43)
φαβ = – AQ αβ (IV-10)
where A is the quadratic expansion coefficient of free energy in Qαβ. We also need the followingthermodynamic relation,
δρ = (∂ρ / ∂p)sδp = c0–2 δp (IV-11)
where c0 is the sound velocity in the low frequency limit. From Eqs. (IV-1) to (IV-11), we candeduce the following linearized transport equations,
δρ + ρ∂k vk = 0 (IV-12)
ρvα = ∂β 3η VAαβi + 2η SAαβ
a + 2µQ αβ – δρc02 δαβ (IV-13)
– AQ αβ = 2µAαβa + νQ αβ (IV-14)
132 H. Nomura et al.
For a longitudinal velocity field with ∂xvx ≠ 0, ∂yvy = ∂zvz = 0, Eq. (IV-12) to Eq. (IV-14) can bewritten as:
δρ + ρ∂x vx = 0 (IV-15)
vx = 1
ρ η V + 43
η S ∂x2 vx + 2
µρ ∂x Qxx –
c02
ρ ∂x δρ (IV-16)
Qxx = –ΓQxx – 43
µν ∂x vx (IV-17)
Qyy = –ΓQyy + 23
µν ∂x vx (IV-18)
Qzz = –ΓQzz + 23
µν ∂x vx (IV-19)
where Γ is the relaxation frequency of reorientational order, which is related to ν and A as Γ = A/ν.Taking into account the traceless character of the tensor order parameter and the requirement fromthe longitudinal symmetry, the relations Qxx + Qyy + Qzz = 0 and Qyy = Qzz must hold. Eqs. (IV-17)to (IV-19) satisfy these requirements and the transport equations can be written by only three inde-pendent variable δρ, vx, and Qxx. Eqs. (IV-15) to (IV-17) are the fundamental equations for thesound propagation and the ultrasonically induced birefringence. The dispersion relation for soundpropagation is discussed in the APPENDIX of this section and is compared with Grubbs andMacPhail’s treatment based on the irreversible statistical mechanics.
2) Ultrasonically Induced Birefringence
In this section, we will derive an expression for the ultrasonically induced birefringence usingthe transport equations obtained in the previous section. Birefringence is induced when the localdielectric tensor becomes anisotropic due to the local orientational order of the anisotropic mol-ecules.
The tensor order parameter Qαβ is related to the local dielectric tensor as41)
Q αβ = 3
2
(ε αβ – ε δαβ )∆ε , (IV-20)
where εαβ is the dielectric tensor, ε̄ is the mean dielectric constant in the absence of external per-turbations and ∆ε is the anisotropy in the dielectric constant if all molecules are perfectly alignedin one direction. We choose x to be the direction in which ultrasonic wave is propagating and z tobe the direction of the optical beam whose polarization lies in the yz plane. The direction of thepolarization is at 45° from the y axis.
Ultrasound propagating in the x direction induces a non-zero component of Qαβ and the re-sultant breakdown in the isotropy of the dielectric tensor causes the birefringence. The relation ofQαβ to the birefringence can be obtained as follows,
133Collective Translational-Rotational Coupling Motion of Molecules in Liquids and Solutions
∆n = ε xx – ε yy
= ε + 2∆ε Qxx / 3 – ε + 2∆ε Qyy / 3 . (IV-21)
≅∆ε
3 ε(Qxx – Qyy )
As mentioned in the previous subsection, the relations Qxx + Qyy + Qzz = 0 and Qyy = Qzz hold.Therefore, Eq. (IV-21) can be written as,
∆n =∆ε2n
Qxx , (IV-22)
where n̄ is the mean refractive index which refers to the dielectric constant as n̄ = √−ε̄. We considera plane wave propagating in the x direction: Qxx = Q
~xx exp[i (ω t – qx)], δρ = δρ~ exp[i (ω t – qx)], vx
= v~x exp[i (ω t – kx)].Equations for the density conservation and the relaxation of the order parameter are written as
iωδρ – iqρvx = 0 (IV-23)
iωQxx + ΓQxx – iq4µ3ν
vx = 0 (IV-24)
Eliminating v~x from Eqs. (IV-23) and (IV-24), the relation of δρ~ to Q~
xx is obtained as,
Qxx = 4
3
µν
δρρ
iωiω + Γ (IV-25)
Substituting the thermodynamic relation,
δρ = (∂ρ / ∂p)sδp = c0–2 δp , (IV-26)
where δρ~ is the amplitude of the pressure perturbation, into Eq. (IV-25) and using the definition ofthe ultrasonic intensity, WU = δp~2/2ρc0, the modulus of Q
~xx is obtained as,
Qxx = 4
3
µA
2WU
ρc03
ω1 + (ω / Γ )2
. (IV-27)
The root mean square of the ultrasonically induced birefringence ∆nrms is acquired as,
∆nrms =
∆ε2n
⋅Qxx
2=
2∆ε µ3nA
WU
ρc03
ω1 + (ω / Γ )2
. (IV-28)
The flow birefringence ∆nf under a constant shear strain rate G is obtained as Eq. (IV-39) in fol-lowing flow birefringence section,
∆nf = –2µG∆ε / (3nA). (IV-29)
134 H. Nomura et al.
Thus, the ultrasonically induced birefringence is related to the flow birefringence by,
∆nrms =
∆nf
G
WU
ρc03
ω1 + (ω / Γ )2
. (IV-30)
Frenkel derived an expression for the ultrasonically induced birefringence similar to Eq. (IV-28).51),52) His treatment is very akin to ours in coupling the anisotropy tensor of the molecular ori-entation to the traceless part of the strain rate tensor. Our treatment, however, is based on a stan-dard theory of irreversible thermodynamics and gives a concrete expression for the proportionalityconstant that appeares in his theory.
Peterlin derived the following expression for ultrasonically induced birefringence using therotational diffusion equation for an ellipsoid under a longitudinal ultrasound;52),53)
∆nrms
Peterlin = nn 2 + 2
3n
2
4π5
N0 (α1 – α2 )β
6D
WU
ρc03
ω1 + (ω / 6D)2
, (IV-31)
where N0 is the number density of the ellipsoid, α1 and α2 are the polarizability along and perpen-dicular to the principal axis of the ellipsoid, respectively and D is the rotational diffusion constant.β– is a constant depending on the molecular shape and defined as, β– = (α1
2 – α 22)/(α1
2 + α 22),
where α1 and α 2 are the long and short diameters of the ellipsoid, respectively. Although the col-lective effect was not included in Peterlin’s theory, the intensity and frequency dependence is thesame as that in Eq. (IV-28), if the term 6D is replaced by Γ. The formula for flow birefringence isalso obtained in the same framework as,52),53)
∆nf
G
Peterlin
= nn 2 + 2
3n
2
4π5
N0 (α1 – α2 )β
6D. (IV-32)
Substituting Eq. (IV-32) into (IV-31), the following relation is obtained:
∆nrms
Peterlin =∆nf
G
Peterlin WU
ρc03
ω1 + (ω / 6D)2
. (IV-33)
This equation is the same form as Eq. (IV-30).Martinoty and Bader obtained Eq. (IV-28) for the ultrasonic birefringence of isotropic phase
of liquid crystals substituting Eq. (IV-39) in place of |∆nf /G|Peterlin into (IV-33). Their indirect deri-vation of Eq. (IV-28) is confirmed here.21)
Expressions for flow45) and ultrasonically induced birefringence48) were obtained by Kivelsonand coworkers based on an irreversible statistical treatment as,
∆nf
G
Kivelson
= 1n
νK ⋅ RTotal ∆µ
1 + ∆µ⋅ η S
kB T⋅ R
Γ
1 /2
λ 02
π (IV-34)
∆nrms
Kivelson = 12n
νK ⋅ RTotal ∆µ
1 + ∆µ⋅ η S
kB T⋅ R
Γ
1 /2
λ 02
πWU
ρc03
ω1 + (ω / Γ )2
(IV-35)
135Collective Translational-Rotational Coupling Motion of Molecules in Liquids and Solutions
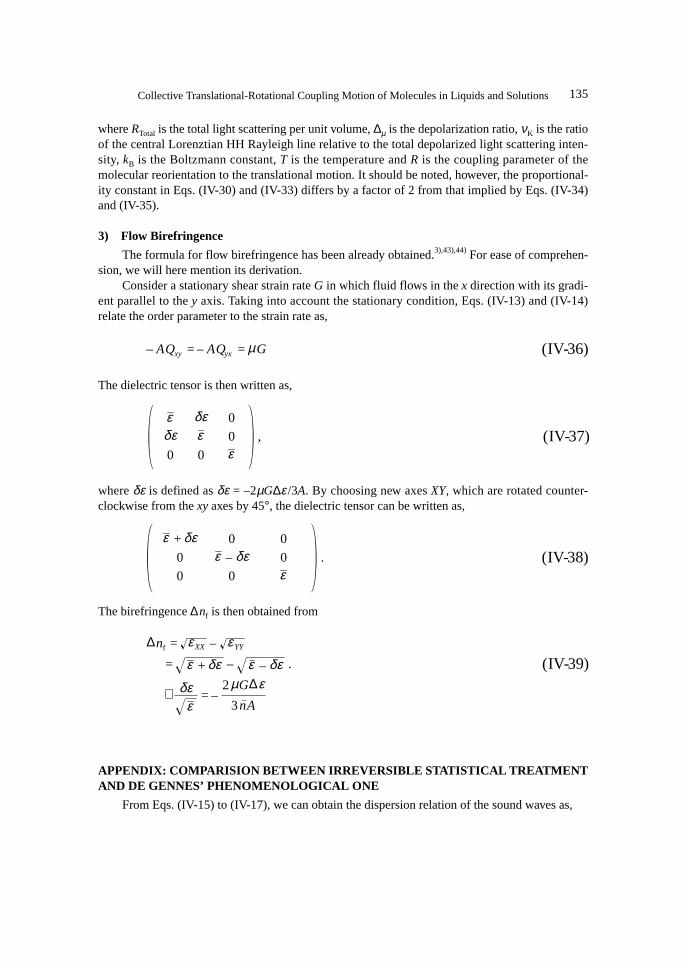
where RTotal is the total light scattering per unit volume, ∆µ is the depolarization ratio, νK is the ratioof the central Lorenztian HH Rayleigh line relative to the total depolarized light scattering inten-sity, kB is the Boltzmann constant, T is the temperature and R is the coupling parameter of themolecular reorientation to the translational motion. It should be noted, however, the proportional-ity constant in Eqs. (IV-30) and (IV-33) differs by a factor of 2 from that implied by Eqs. (IV-34)and (IV-35).
3) Flow Birefringence
The formula for flow birefringence has been already obtained.3),43),44) For ease of comprehen-sion, we will here mention its derivation.
Consider a stationary shear strain rate G in which fluid flows in the x direction with its gradi-ent parallel to the y axis. Taking into account the stationary condition, Eqs. (IV-13) and (IV-14)relate the order parameter to the strain rate as,
– AQxy = – AQyx = µG (IV-36)
The dielectric tensor is then written as,
ε δε 0δε ε 0
0 0 ε, (IV-37)
where δε is defined as δε = –2µG∆ε /3A. By choosing new axes XY, which are rotated counter-clockwise from the xy axes by 45°, the dielectric tensor can be written as,
ε + δε 0 0
0 ε – δε 0
0 0 ε. (IV-38)
The birefringence ∆nf is then obtained from
∆nf = ε XX – ε YY
= ε + δε – ε – δε . (IV-39)
≅ δεε
= –2µG∆ε
3nA
APPENDIX: COMPARISION BETWEEN IRREVERSIBLE STATISTICAL TREATMENTAND DE GENNES’ PHENOMENOLOGICAL ONE
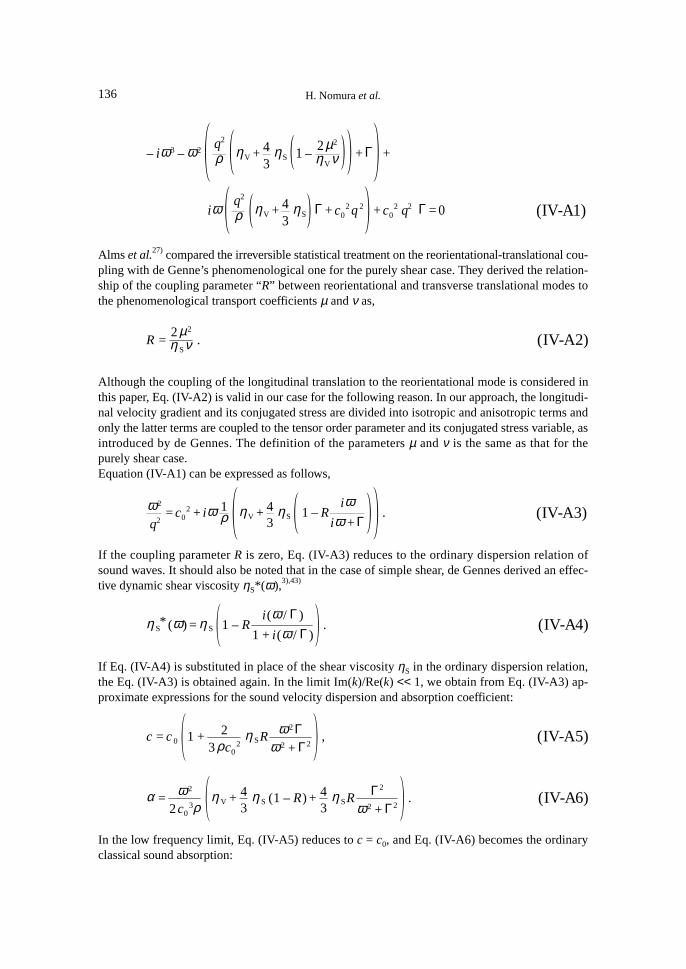
From Eqs. (IV-15) to (IV-17), we can obtain the dispersion relation of the sound waves as,
136 H. Nomura et al.
– iω3 – ω2
q2
ρ ηV + 43
ηS 1 – 2µ2
ηVν + Γ +
iωq2
ρ ηV + 43
ηS Γ + c02 q 2 + c0
2 q2 Γ = 0 (IV-A1)
Alms et al.27) compared the irreversible statistical treatment on the reorientational-translational cou-pling with de Genne’s phenomenological one for the purely shear case. They derived the relation-ship of the coupling parameter “R” between reorientational and transverse translational modes tothe phenomenological transport coefficients µ and ν as,
R =2 µ2
η Sν . (IV-A2)
Although the coupling of the longitudinal translation to the reorientational mode is considered inthis paper, Eq. (IV-A2) is valid in our case for the following reason. In our approach, the longitudi-nal velocity gradient and its conjugated stress are divided into isotropic and anisotropic terms andonly the latter terms are coupled to the tensor order parameter and its conjugated stress variable, asintroduced by de Gennes. The definition of the parameters µ and ν is the same as that for thepurely shear case.Equation (IV-A1) can be expressed as follows,
ω2
q2= c0
2 + iω 1ρ ηV + 4
3ηS 1 – R
iωiω + Γ
. (IV-A3)
If the coupling parameter R is zero, Eq. (IV-A3) reduces to the ordinary dispersion relation ofsound waves. It should also be noted that in the case of simple shear, de Gennes derived an effec-tive dynamic shear viscosity ηS*(ω),3),43)
η S
* (ω) = η S 1 – Ri(ω / Γ )
1 + i(ω / Γ ). (IV-A4)
If Eq. (IV-A4) is substituted in place of the shear viscosity ηS in the ordinary dispersion relation,the Eq. (IV-A3) is obtained again. In the limit Im(k)/Re(k) << 1, we obtain from Eq. (IV-A3) ap-proximate expressions for the sound velocity dispersion and absorption coefficient:
c = c 0 1 + 2
3ρc02
η SR ω 2 Γω 2 + Γ2
, (IV-A5)
α = ω 2
2c03ρ
η V + 43
η S (1 – R) + 43
η SR Γ2
ω 2 + Γ2. (IV-A6)
In the low frequency limit, Eq. (IV-A5) reduces to c = c0, and Eq. (IV-A6) becomes the ordinaryclassical sound absorption:
137Collective Translational-Rotational Coupling Motion of Molecules in Liquids and Solutions
α = ω 2
2c03ρ
η V + 43
η S (IV-A7)
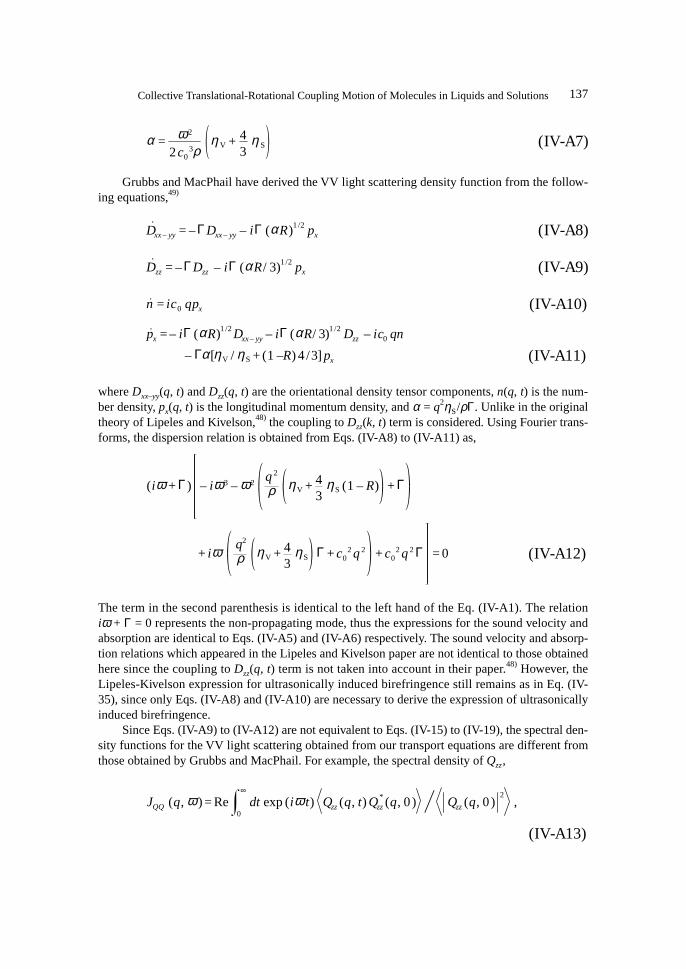
Grubbs and MacPhail have derived the VV light scattering density function from the follow-ing equations,49)
where Dxx–yy(q, t) and Dzz(q, t) are the orientational density tensor components, n(q, t) is the num-ber density, px(q, t) is the longitudinal momentum density, and α = q2ηS/ρΓ. Unlike in the originaltheory of Lipeles and Kivelson,48) the coupling to Dzz(k, t) term is considered. Using Fourier trans-forms, the dispersion relation is obtained from Eqs. (IV-A8) to (IV-A11) as,
(iω + Γ) – iω3 – ω2q 2
ρ ηV + 43
ηS (1 – R) + Γ
+ iωq2
ρ ηV + 43
ηS Γ + c02 q 2 + c0
2 q 2 Γ = 0 (IV-A12)
The term in the second parenthesis is identical to the left hand of the Eq. (IV-A1). The relationiω + Γ = 0 represents the non-propagating mode, thus the expressions for the sound velocity andabsorption are identical to Eqs. (IV-A5) and (IV-A6) respectively. The sound velocity and absorp-tion relations which appeared in the Lipeles and Kivelson paper are not identical to those obtainedhere since the coupling to Dzz(q, t) term is not taken into account in their paper.48) However, theLipeles-Kivelson expression for ultrasonically induced birefringence still remains as in Eq. (IV-35), since only Eqs. (IV-A8) and (IV-A10) are necessary to derive the expression of ultrasonicallyinduced birefringence.
Since Eqs. (IV-A9) to (IV-A12) are not equivalent to Eqs. (IV-15) to (IV-19), the spectral den-sity functions for the VV light scattering obtained from our transport equations are different fromthose obtained by Grubbs and MacPhail. For example, the spectral density of Qzz,
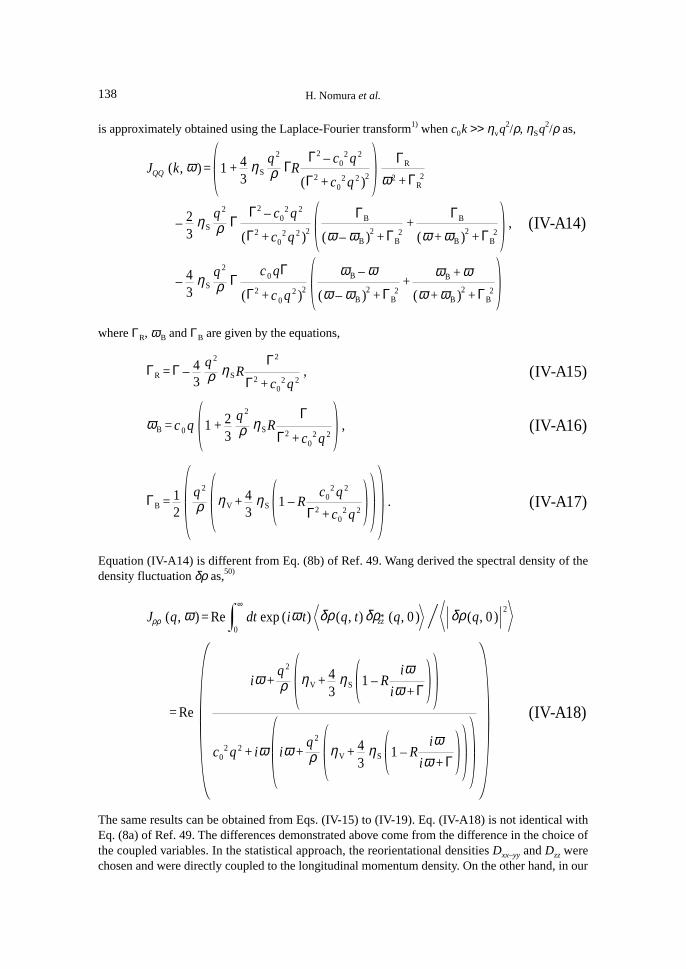
The same results can be obtained from Eqs. (IV-15) to (IV-19). Eq. (IV-A18) is not identical withEq. (8a) of Ref. 49. The differences demonstrated above come from the difference in the choice ofthe coupled variables. In the statistical approach, the reorientational densities Dxx–yy and Dzz werechosen and were directly coupled to the longitudinal momentum density. On the other hand, in our
139Collective Translational-Rotational Coupling Motion of Molecules in Liquids and Solutions
treatment, the translational term was divided into isotropic and anisotropic components and theonly latter couples to the reorientational mode.
V. Ultrasonically Induced Birefringence in Liquids and Solutions
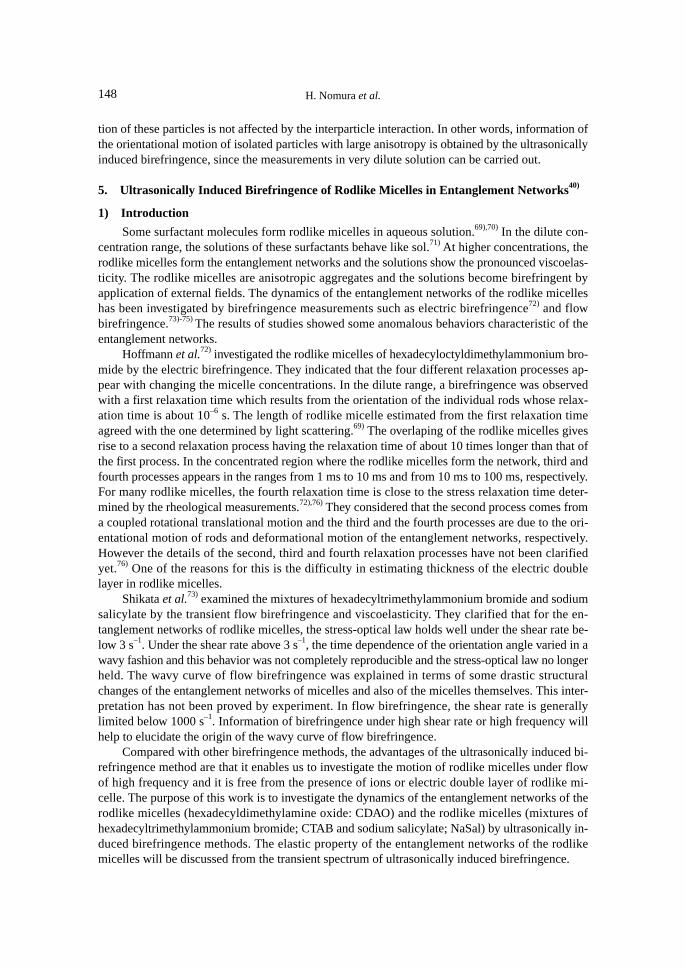
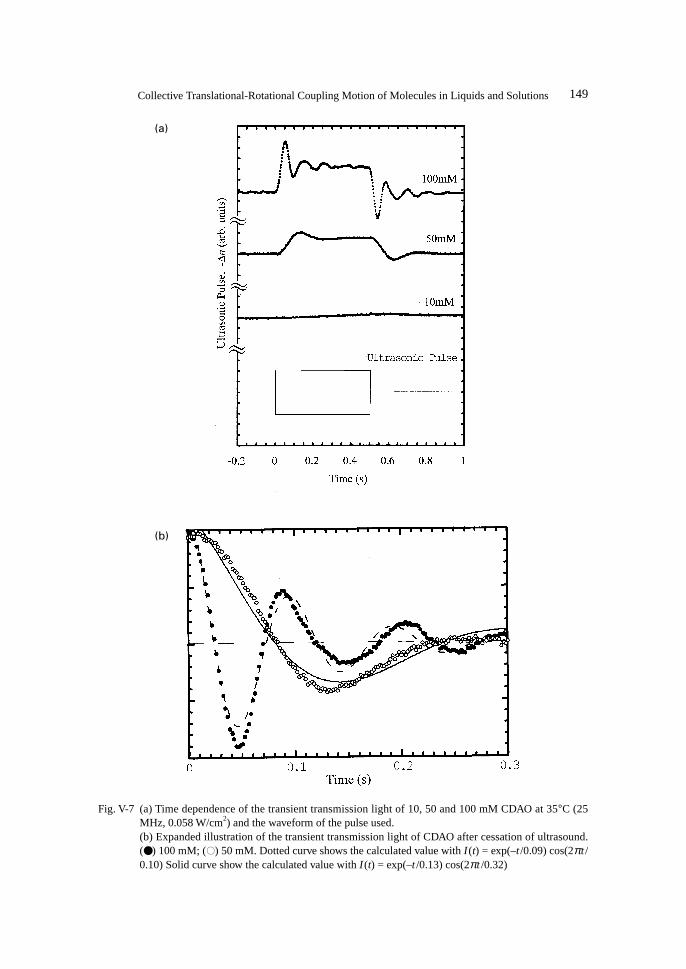
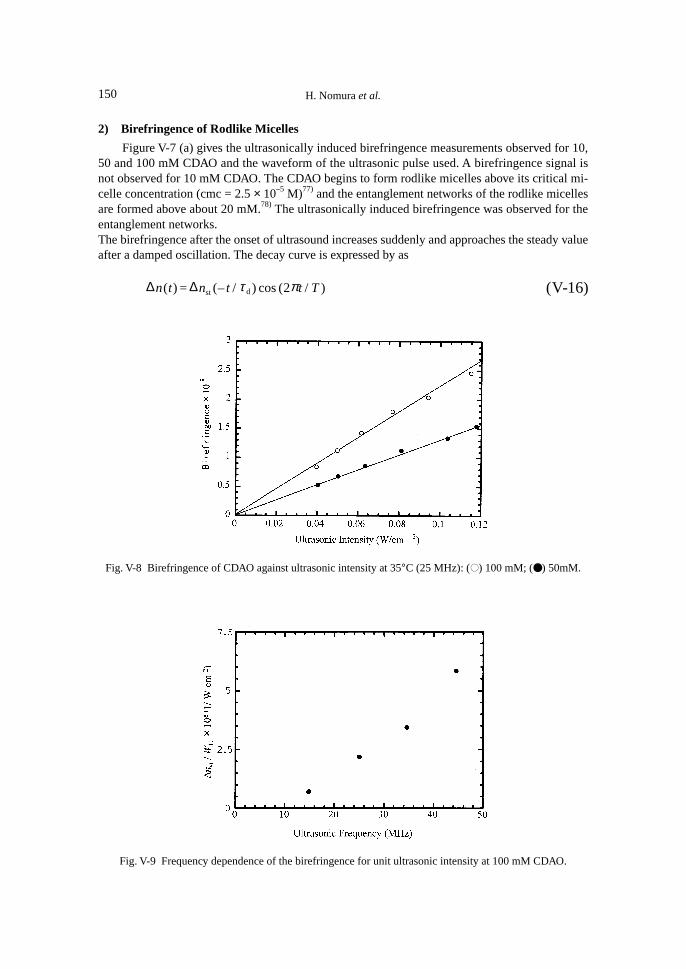
1. Introduction
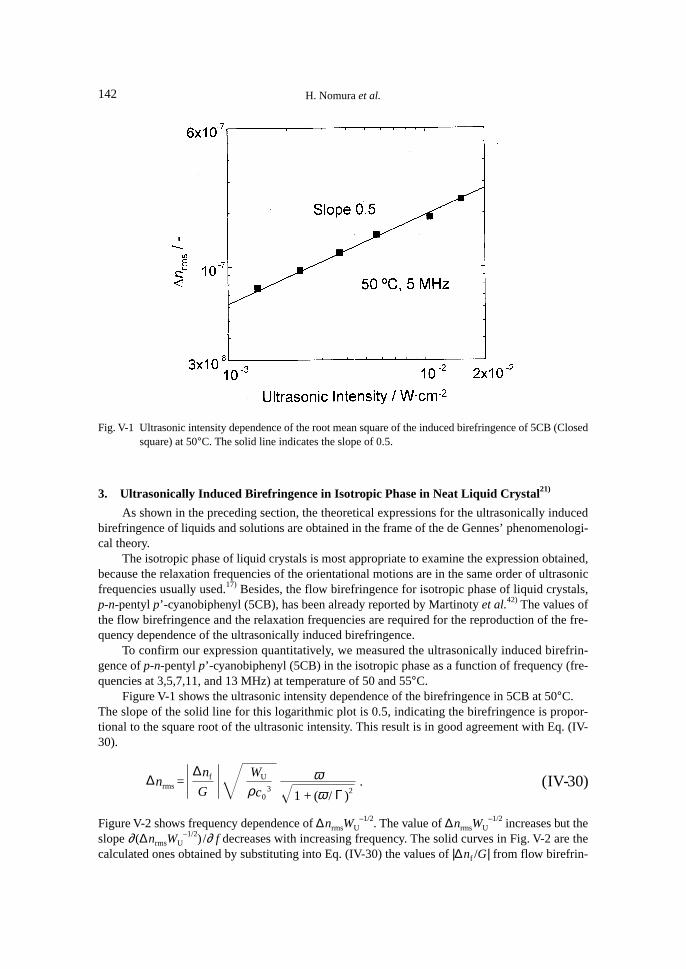
The birefringence is induced in liquids and solutions containing certain amount of nonsphericalparticles as a result of the particle orientation due to ultrasonic waves. This was called the phe-nomenon of the ultrasonically induced birefringence.54) The early theoretical studies of the bire-fringence have been reviewed by Hilyard and Jerrard.52) The theory developed by Oka55) indicatedthat large disc-like rigid particles align by hydrodynamics torque which is produced by the radia-tion pressure due to the passage of the ultrasonic waves. The normal of disclike particles is parallelto the ultrasonic field, and the sign of the birefringence of disk particles is negative. The measure-ments of the birefringence of large rigid disc-like particles were carried out on bentonite56) andgold sols.12),57) These experimental results show that the birefringence is proportional to the ultra-sonic intensity as predicted by the Oka theory. Ou-Yang et al.15) made use of the Raman-Nathdiffraction effect to measure the ultrasonic intensity at the frequency range from 1 to 19 MHz andinvestigated the ultrasonically induced birefringence of gold sols as a function of solvent viscosity,particle size and ultrasonic intensity and frequency. The birefringence increased with increasingultrasonic frequency and decreasing viscosity and the sign of the birefringence was positive. Theymodified the Oka theory to explain the sign of the birefringence and the dependence of the bire-fringence on the frequency and viscosity.
For large rigid rod-like particles, no theoretical study of the ultrasonically induced birefrin-gence has been reported. Experimental investigations on the birefringence of V2O5 sols39),54),56) havebeen carried out so far. The ultrasonically induced birefringence of V2O5 sols was proportional tothe ultrasonic intensity and the volume fraction as predicted by the Oka theory.39) Petralia alsoindicated that the birefringence depends on the viscosity and the sign of the birefringence is posi-tive.56) No experimental investigation of the frequency dependence of the birefringence of rod-likerigid particles has been carried out.
On the contrary, for neat liquids, a sinusoidal velocity gradient can directly produce sinusoi-dal orientational order. The reorientational order produced is not uniform but propagates as wavesand the induced birefringence should be proportional to the ultrasonic amplitude, that is, the squareroot of the ultrasonic intensity.15),42),54),56)
After the brief description of the modified Oka theory of ultrasonically induced birefringencefor rod-like particles, we discuss the ultrasonically induced birefringence of liquid crystal in iso-tropic phase by comparing the experimental results with the expression obtained in the frame ofthe de Gennes’s phenomenological theory.
Next, we would like to discuss the frequency dependence of the ultrasonically induced bire-fringence of rod-like particles. Birefringence for unit ultrasonic intensity has been estimated. Theexperimental results will be discussed on the basis of the modified Oka theory for rod-like par-ticles. In addition, orientational relaxation times of rod-like particles have also been evaluated fromthe trace of the transient birefringence.
Finally, we would like to describe our recent results for ultrasonically induced birefringenceof the rodlike micelles in the aqueous salt solutions and polymer solutions.
140 H. Nomura et al.
2. Modified Oka Theory for Rodlike Particles20)
Application of ultrasonic fields will induce the birefringence ∆n, which is given by
∆n = 2π ∆GΘφ / n0 (V-1)
where Θ is the mean orientation of the particles, ∆G is the optical anisotropy, φ is the volumefraction of particles and n0 is the refractive index of solvent. The mean orientation can be calcu-lated from the distribution function of particles which is obtained by considering the potential en-ergy due to the torque caused by the applied field.58),59) Oka55) assumed that the passage of acousticwaves sets up the radiation pressure so that large rigid disc-like particles are subject to the turningtorque that will align them. The ultrasonic torque is estimated by considering the Rayleigh disc60),61)
problem. At this point we extend the modified Oka theory for disc-like particles in view of appli-cation to prolate particles. We assumed that prolate particles such as α-Fe2O3 sols and PTFE latexare also subject to the torque due to radiation pressure. König62) derived the time averaged torque|M | for prolate particles as
M = Xρ0 a b2 (v – u)2 sin 2θ (V-2)
X =
2 πε 3 2ε 3
3+ 1
2(1 – ε 2 ) ln 1 + ε
1 – ε– ε
12
(1 – ε 2 ) ln 1 + ε1 – ε
– ε 2ε 3 + 12
(1 – ε 2 ) ln 1 + ε1 – ε
– ε
(V-3)
with ε = (a2 – b2)1/2/a, where v the fluid velocity, u is the translational velocity of particle, a and bare the radii of major and minor axes of the particle, respectively, ρ0 is the densities of solvent andθ is an angle between the major axis of prolate spheroids and the direction of ultrasonic propaga-tion. If the ultrasonic energy is small compared with the thermal disturbance, the birefringence isexpressed as
∆n =4Xπ a b2∆Gφ A2F 2
15kB T VS0 n s
(V-4)
where VS0 the sound velocity of solvent, A is the ultrasonic amplitude, kB is the Boltzmann con-
stant, and T is the temperature. For spheroid particles, ∆G is obtained by an extension of the theoryof Peterlin and Stuart63) as
∆G =
n02 n 2 – n0
22
(N2 – N1 )
4π n02 + (n 2 – n0
2 ) N1 4 π n02 + (n 2 – n0
2 ) N2
(V-5)
where n is the refractive index of particles, respectively and for prolate particles N1 and N2 areshape factors along a and b, respectively. The N1 and N2 are obtained by
141Collective Translational-Rotational Coupling Motion of Molecules in Liquids and Solutions
N1 = 2π (µ2 – 1 ) µ ln
µ + 1µ – 1
– 2 , N2 = N3 =4 π – N1
2(V-6)
with µ = a/(a2 – b2)1/2.Ou-Yang et al.15) indicated that the suspended particles which execute translational oscilla-
tions in fluid are subject to the drag force that is shown in terms of the librational Reynolds num-ber RL = a2ωρ0/2ηS, where ω is the ultrasonic angular frequency and ηS is the shear viscosity ofthe solvent.64) They supposed that the translational motion is much faster than the orientationalmotion and the equation of translational motion for particles in dilute region is expressed as
F =
v – uv =
ρ – ρ0
ρ + i(ς / Vω ) 1 + RL – i RL + γ RL
(V-7)
where V is the particle volume, ζ is the Stokes’ drag coefficient and γ is a constant. When theprolate particles are translating in the direction normal to its major axis, the ζ is given65) as
ζ =16 π η S a b2
(χ + a2 α )(V-8)
where
α = a b2
0
∞ dx
a2 + x b2 + x2
(V-9)
and
χ = a b2
0
∞ dx
( b2 + x ) a2 + x(V-10)
If RL = ∞, the parameter F in viscous fluids is reduced to that in ideal fluid. For ideal fluid, F isobtained from the inertia-coefficient of a prolate particle.
F =
ρ – ρ0
ρ + α2 – α
ρ0
. (V-11)
Comparing Eq. (V-7) with Eq. (V-12) lead to γ given as follows.
γ =
α (χ – b2 α )
6 a2 (2 – α )(V-12)
The frequency dependence of the birefringence of prolate, namely, rod-like particles can be ex-pressed in terms of F which is obtained by substituting Eqs. (V-8), (V-10) and (V-12) into Eq. (V-7).
142 H. Nomura et al.
3. Ultrasonically Induced Birefringence in Isotropic Phase in Neat Liquid Crystal21)
As shown in the preceding section, the theoretical expressions for the ultrasonically inducedbirefringence of liquids and solutions are obtained in the frame of the de Gennes’ phenomenologi-cal theory.
The isotropic phase of liquid crystals is most appropriate to examine the expression obtained,because the relaxation frequencies of the orientational motions are in the same order of ultrasonicfrequencies usually used.17) Besides, the flow birefringence for isotropic phase of liquid crystals,p-n-pentyl p’-cyanobiphenyl (5CB), has been already reported by Martinoty et al.42) The values ofthe flow birefringence and the relaxation frequencies are required for the reproduction of the fre-quency dependence of the ultrasonically induced birefringence.
To confirm our expression quantitatively, we measured the ultrasonically induced birefrin-gence of p-n-pentyl p’-cyanobiphenyl (5CB) in the isotropic phase as a function of frequency (fre-quencies at 3,5,7,11, and 13 MHz) at temperature of 50 and 55°C.
Figure V-1 shows the ultrasonic intensity dependence of the birefringence in 5CB at 50°C.The slope of the solid line for this logarithmic plot is 0.5, indicating the birefringence is propor-tional to the square root of the ultrasonic intensity. This result is in good agreement with Eq. (IV-30).
∆nrms =
∆nf
G
WU
ρc03
ω1 + (ω / Γ )2
. (IV-30)
Figure V-2 shows frequency dependence of ∆nrmsWU–1/2. The value of ∆nrmsWU
–1/2 increases but theslope ∂(∆nrmsWU
–1/2) /∂ f decreases with increasing frequency. The solid curves in Fig. V-2 are thecalculated ones obtained by substituting into Eq. (IV-30) the values of |∆nf /G| from flow birefrin-
Fig. V-1 Ultrasonic intensity dependence of the root mean square of the induced birefringence of 5CB (Closedsquare) at 50°C. The solid line indicates the slope of 0.5.
143Collective Translational-Rotational Coupling Motion of Molecules in Liquids and Solutions
gence measurements42) and Γ from optical beating light scattering experiments.17) The values of|∆nf /G| are 1.86 and 1.26 ns and those of Γ/2π are 10.0 and 15.3 MHz at 50 and 55°C, respec-tively. The observed values of ∆nrmsWU
–1/2 in this study are satisfactorily reproduced by Eq. (IV-30).
Martinoty and Bader measured the ultrasonically induced birefringence for the isotropic phaseof liquid crystals.41),42) In their experiment, however, only the relative values of the ultrasonic in-tensity were measured and they examined Eq. (IV-30) in terms of the temperature dependence ofthe birefringence at three different frequencies. In this work, we directly measured the ultrasoni-cally induced birefringence as a function of frequency and ultrasonic intensity. Our results are re-produced completely by the equation derived here. Moreover, the absolute values of ultrasonicallyinduced birefringence obtained in this work are in good agreement with those calculated using theflow birefringence and reorientational relaxation frequency obtained by light scattering. This indi-cates clearly that our theoretical treatment is valid and the method of ultrasonic intensity measure-ment presented here is very useful.
4. Frequency Dependence of Ultrasonically Induced Birefringence of Rod-like Particles20)
1) Introduction
For large rigid rod-like particles, no theoretical study of the ultrasonically induced birefrin-gence has been reported. Experimental investigations on the birefringence of V2O5 sols39),54),56) havebeen carried out so far. Measurements56) by Petralia on V2O5 sols indicated that the birefringencedepended on the viscosity and the sign of the birefringence was positive. In our previous paper,39)
the ultrasonically induced birefringence of V2O5 sols was proportional to the ultrasonic intensityand the volume fraction, as predicted by the Oka theory. However, no experimental investigationof the frequency dependence of the birefringence of rod-like rigid particles has been carried out.Furthermore, the mean axis ratio of V2O5 used was 1/70 and at the volume concentration 1.28 –6.40 × 10⁻⁴, the distance of the center of gravity of the rodlike particles of 1.7 µm long was 1.1 –
Fig. V-2 Frequency dependence the birefringence per the square root of the ultrasonic intensity at 50 (closed)and 55 (open) °C. Solid curves indicate the estimation from Eq. (IV-30). The detailed explanationsare given in the text.
144 H. Nomura et al.
1.8 µm and almost same order of the length of the particle. This means that the V2O5 sol is not indilute, but in semi-dilute regions.
In order to elucidate the frequency dependence of the ultrasonically induced birefringenceand the orientational relaxation time of rod-like particles, we used the hematite (α-Fe2O; axialratio = 5.5, the volume fraction was varied from 9.4 × 10⁻⁸ to 2.4 × 10⁻⁵) sol of rodlike particlesand poly (tetrafluoroethylene) (PTFE; the average length of major axis of 0.55 µm and the averageaxial ratio of 1.9. The volume fraction was varied from 1.3 × 10⁻⁷ to 8.2 × 10⁻⁴.) latex of prolateparticles.
2) Birefringence of Rod-like Particles
The Oka theory55) indicates that the birefringence is proportional to the ultrasonic intensityand volume fraction. In his theory, the solvent is assumed to be as ideal fluid and the birefringencedoes not depend on the ultrasonic frequency nor the solvent viscosity. As shown in the Figs. V-3and V-4, the birefringence of α-Fe2O3 and PTFE particles is proportional to the ultrasonic intensityand volume fraction and depends on the frequency and viscosity. This means that the birefringenceof rod-like particles is not fully interpreted by the Oka theory.
Ou-Yang et al.15) modified the Oka theory to explain the frequency and viscosity dependenceof the birefringence of conducting disc-like gold sols. We have extended the modified Oka theoryfor disc-like particles in view of application for rod-like particles. The birefringence of rod-likeparticles is given by:
∆n =4Xπ a b2∆Gφ A2F 2
15kB T VS0 n s
(V-4)
where ∆G is the optical anisotropy, φ the volume fraction, VS0 the sound velocity of solvent. The F
is given as
Fig. V-3 Birefringence against ultrasonic intensity at 25°C (25 MHz): (●) α-Fe2O3 sols at volume fraction 4.7× 10⁻⁶; (M) PTFE latex at volume fraction 7.6 × 10⁻⁵.
145Collective Translational-Rotational Coupling Motion of Molecules in Liquids and Solutions
Fig. V-4 Plots of ∆n T/WU against the ultrasonic frequency.A. α-Fe2O3 sols of (volume fraction = 4.7 × 10⁻⁶). Temperature: (K) 50°C; (M) 25°C; ( ) 10°C.B. PTFE latex (volume fraction = 8.2 × 10⁻⁴). Temperature: (●) 50°C; (▲) 10°C.
u
Fig. V-5 Plots of normalized birefringence ∆n TVSkB/A2φ against RL: (●) α-Fe2O3 sols; (M) PTFE latex; Dot-ted (Fe2O3 sols) and solid (PTFE latex) curves show the theoretical values.
146 H. Nomura et al.
F =
v – uv =
ρ – ρ0
ρ + i(ς / Vω ) 1 + RL – i RL + γ RL
(V-7)
with RL = a2ωρ0/2η where ρ and ρ0 are the densities of particles and solvent, respectively, v thefluid velocity, u the translational velocity of particle, ζ the Stokes’ drag coefficient, ω the ultra-sonic angular frequency, V the particle volume and γ a constant. The reduced birefringence∆nTVSkB/A2φ can be estimated from the results in Figs. V-3 and V-4. The results are shown in Fig.V-5, where the theoretical line is included. For α-Fe2O3 sols, the experimental values are about 20times larger than the theoretical values and for PTFE latex, while the experimental values are about100 times as large as the theoretical values. The large deviations from the theoretical values cannot be explained in terms of the modified Oka theory for rod-like particles, even if one takes intoaccount the experimental and estimation errors in the refractive index and the size of the particle.
In the Oka theory, the turning torque which aligns the disc-like particles was derived from theEuler equation for ideal fluid and the ultrasonically induced birefringence was predicted to be pro-portional to F2, namely, [(v-u)/v]2. The value of F in ideal fluid does not depend on the frequencyand viscosity. Ou-Yang et al.15) modified the Oka theory to interpret the frequency dependence ofthe birefringence of disc-like particles in viscous fluids. In the modified Oka theory, the parameterF in the Oka theory was replaced by the one derived from the Navier-Stokes equation for viscousfluids. However, the turning torque also should be modified on the basis of the Navier-Stokes equa-tion. In addition, under oscillatory motion, the flow around the rod-like particles is complicatedand the flow may be in eddy or stagnation. A new theory of the ultrasonically induced birefrin-gence should be required for the case of rod-like particles after taking into account of turning torque
Fig. V-6 Orientational relaxation time for α-Fe2O3 sols and PTFE latex against ηS/kBT. A. α-Fe2O3 sols (vol-ume fraction: (M) 2.4 × 10⁻⁵; (K) 4.7 × 10⁻⁶). B. PTFE latex (volume fraction: (■) 4.1 × 10⁻³; (●) 7.6× 10⁻⁵; (◆) 2.6 × 10⁻⁶. The orientational relaxation times for α-Fe2O3 sols obtained by transient mag-netic birefringence68) measurements are also included. Field strength: ( ) high; ( ) low.u
u
147Collective Translational-Rotational Coupling Motion of Molecules in Liquids and Solutions
in viscous fluids and the boundary condition of fluids around the rod-like particles.
3) Orientational Relaxation Times of Rod-like Particles
The birefringence decays after ultrasonic field disappears as shown in Experimental section(see Fig. II-4). This decay reflects the orientational relaxation process of the particles. The orienta-tional relaxation time of the particles is obtained by fitting the extinction process of the birefrin-gence to Eq. (II-9). The orientational relaxation times of α-Fe2O3 sols and PTFE latex are plottedagainst ηS/kBT in Fig. V-6, where ηS is the solvent viscosity, T the temperature and kB the Boltzmannconstant. The figure demonstrates that the orientational relaxation time is proportional to ηS/kBT.The orientational relaxation time τ of α-Fe2O3 and PTFE particles in dilute solution follows theDebye-Einstein equation,
τ =η SV*
kB T(V-13)
where V* is the effective volume of a particle. The effective volume of α-Fe2O3 and PTFE particleestimated from the slopes in Fig. V-6 are 1.5 × 10⁻²⁰ and 7.6 × 10⁻²⁰ m3, respectively. According toPerrin,66) V* of a prolate particle is given as
V* = 8π a3
9
1 – p4
(2 – p2 ) G( p) – 1(V-14)
G( p) = 1
1 – p2 1 /2ln
1 + 1 – p2 1 /2
p (V-15)
where p is the axial ratio b/a and the a and b are the radii of major and minor axes of the particle,respectively. For PTFE latex, 2a calculated from Eqs. 2 and 3 is 0.80 µm with p = 1/1.9. The sizeof PTFE particles obtained from the electron microscopy is within 0.4 to 1.0 µm with an averagevalue of 0.55 µm and it is smaller than the size estimated from the birefringence measurements.For α-Fe2O3 particles, the value of 2a is 0.55 µm with p = 1/5.5 and is consistent with the valuereported by Ozaki.67)
The extinction of the transient ultrasonically induced birefringence reflects the orientationalrelaxation process. Birefringence induced by magnetic and electric fields also involves the sameinformation as the ultrasonically induced birefringence. James68) estimated the orientational relax-ation time of a-Fe2O3 sols from the measurements of the transient magnetic birefringence. He usedthe a-Fe2O3 sols with the average length of major axis 0.54 mm and the axial ratio ca. 5, while arenearly equal to those used in this work. Although, as is shown in Fig. V-6, the relaxation timeobtained from the magnetic birefringence depends on the magnetic intensity, the values are closeto those from the ultrasonically induced birefringence within the experimental error. James ex-plained the intensity dependence of the relaxation time as follows. The larger particles are prefer-entially oriented in the low magnetic fields, while under the high magnetic fields all the particlesare oriented. In the ultrasonically induced birefringence, the relaxation time is independent of theultrasonic intensity investigated here. Irrespective of their size, the particles can be orientated bythe radiation pressure.
As is shown in Fig. V-6, the orientational relaxation times of both α-Fe2O3 and PTFE par-ticles can be expressed by the Debye-Einstein equation. This fact means that the orientational mo-
148 H. Nomura et al.
tion of these particles is not affected by the interparticle interaction. In other words, information ofthe orientational motion of isolated particles with large anisotropy is obtained by the ultrasonicallyinduced birefringence, since the measurements in very dilute solution can be carried out.
5. Ultrasonically Induced Birefringence of Rodlike Micelles in Entanglement Networks40)
1) Introduction
Some surfactant molecules form rodlike micelles in aqueous solution.69),70) In the dilute con-centration range, the solutions of these surfactants behave like sol.71) At higher concentrations, therodlike micelles form the entanglement networks and the solutions show the pronounced viscoelas-ticity. The rodlike micelles are anisotropic aggregates and the solutions become birefringent byapplication of external fields. The dynamics of the entanglement networks of the rodlike micelleshas been investigated by birefringence measurements such as electric birefringence72) and flowbirefringence.73)-75) The results of studies showed some anomalous behaviors characteristic of theentanglement networks.
Hoffmann et al.72) investigated the rodlike micelles of hexadecyloctyldimethylammonium bro-mide by the electric birefringence. They indicated that the four different relaxation processes ap-pear with changing the micelle concentrations. In the dilute range, a birefringence was observedwith a first relaxation time which results from the orientation of the individual rods whose relax-ation time is about 10–6 s. The length of rodlike micelle estimated from the first relaxation timeagreed with the one determined by light scattering.69) The overlaping of the rodlike micelles givesrise to a second relaxation process having the relaxation time of about 10 times longer than that ofthe first process. In the concentrated region where the rodlike micelles form the network, third andfourth processes appears in the ranges from 1 ms to 10 ms and from 10 ms to 100 ms, respectively.For many rodlike micelles, the fourth relaxation time is close to the stress relaxation time deter-mined by the rheological measurements.72),76) They considered that the second process comes froma coupled rotational translational motion and the third and the fourth processes are due to the ori-entational motion of rods and deformational motion of the entanglement networks, respectively.However the details of the second, third and fourth relaxation processes have not been clarifiedyet.76) One of the reasons for this is the difficulty in estimating thickness of the electric doublelayer in rodlike micelles.
Shikata et al.73) examined the mixtures of hexadecyltrimethylammonium bromide and sodiumsalicylate by the transient flow birefringence and viscoelasticity. They clarified that for the en-tanglement networks of rodlike micelles, the stress-optical law holds well under the shear rate be-low 3 s–1. Under the shear rate above 3 s–1, the time dependence of the orientation angle varied in awavy fashion and this behavior was not completely reproducible and the stress-optical law no longerheld. The wavy curve of flow birefringence was explained in terms of some drastic structuralchanges of the entanglement networks of micelles and also of the micelles themselves. This inter-pretation has not been proved by experiment. In flow birefringence, the shear rate is generallylimited below 1000 s–1. Information of birefringence under high shear rate or high frequency willhelp to elucidate the origin of the wavy curve of flow birefringence.
Compared with other birefringence methods, the advantages of the ultrasonically induced bi-refringence method are that it enables us to investigate the motion of rodlike micelles under flowof high frequency and it is free from the presence of ions or electric double layer of rodlike mi-celle. The purpose of this work is to investigate the dynamics of the entanglement networks of therodlike micelles (hexadecyldimethylamine oxide: CDAO) and the rodlike micelles (mixtures ofhexadecyltrimethylammonium bromide; CTAB and sodium salicylate; NaSal) by ultrasonically in-duced birefringence methods. The elastic property of the entanglement networks of the rodlikemicelles will be discussed from the transient spectrum of ultrasonically induced birefringence.
149Collective Translational-Rotational Coupling Motion of Molecules in Liquids and Solutions
Fig. V-7 (a) Time dependence of the transient transmission light of 10, 50 and 100 mM CDAO at 35°C (25MHz, 0.058 W/cm2) and the waveform of the pulse used.(b) Expanded illustration of the transient transmission light of CDAO after cessation of ultrasound.(●) 100 mM; (K) 50 mM. Dotted curve shows the calculated value with I (t) = exp(–t /0.09) cos(2π t /0.10) Solid curve show the calculated value with I (t) = exp(–t /0.13) cos(2π t /0.32)
(a)
(b)
150 H. Nomura et al.
2) Birefringence of Rodlike Micelles
Figure V-7 (a) gives the ultrasonically induced birefringence measurements observed for 10,50 and 100 mM CDAO and the waveform of the ultrasonic pulse used. A birefringence signal isnot observed for 10 mM CDAO. The CDAO begins to form rodlike micelles above its critical mi-celle concentration (cmc = 2.5 × 10⁻⁵ M)77) and the entanglement networks of the rodlike micellesare formed above about 20 mM.78) The ultrasonically induced birefringence was observed for theentanglement networks.The birefringence after the onset of ultrasound increases suddenly and approaches the steady valueafter a damped oscillation. The decay curve is expressed by as
∆n(t) = ∆nst (– t / τ d ) cos (2πt / T ) (V-16)
Fig. V-8 Birefringence of CDAO against ultrasonic intensity at 35°C (25 MHz): (K) 100 mM; (●) 50mM.
Fig. V-9 Frequency dependence of the birefringence for unit ultrasonic intensity at 100 mM CDAO.
151Collective Translational-Rotational Coupling Motion of Molecules in Liquids and Solutions
where ∆nst is the birefringence at the stationary state, τd is the damping time constant and T is theperiod of oscillation. Figure V-7(b) indicates the time dependence of birefringence of 100 mM and50 mM CDAO after the cessation of ultrasound. For both concentrations, the sign of the inducedbirefringence was negative. The value of ∆nst of 100 mM was 2.5 × 10⁻⁹, while for 50 mM it was1.5 × 10–9.
Figure V-8 shows the birefringence of 50 and 100 mM CDAO as a function of the ultrasonicintensity. The birefringence is proportional to the ultrasonic intensity for both concentrations.
Figure V-9 refers to the frequency dependence of the birefringence of 100 mM CDAO nor-malized for ultrasonic intensity ∆nst/WU. The ∆nst/WU increases with the frequency.
Ultrasonically induced birefringence was observed on the entanglement networks of rodlikemicelles. The birefringence of the entanglement networks of the rodlike micelles was proportionalto the ultrasonic intensity and increased with the ultrasonic frequency.
For solutions of flexible macromolecules, Peterlin52),79) gave a theory of the ultrasonically in-duced birefringence. According to the theory, the birefringence comes from the deformation offlexible macromolecules due to the velocity gradient of sound wave. Then the birefringence offlexible macromolecules is proportional to the square roots of ultrasonic intensity. As the birefrin-gence of the rodlike micelles is proportional to the ultrasonic intensity, the birefringence is notinterpreted in terms of the Peterlin theory. The birefringence for dilute solutions of rigid colloidalparticles is formulated by Oka.52),55) If the ultrasonic frequency is much higher than the rodlikeparticle reorientational frequency, the radiation pressure due to the propagation of the sound wavecauses the turning torque which aligns the minor axis of the particle to the direction of the ultra-sonic wave propagation.20) Consequently, the birefringence of colloidal particles is proportional tothe ultrasonic intensity. The ultrasonic intensity dependence of the birefringence of the entangle-ment networks indicates that the birefringence is induced by the radiation pressure. The frequencydependence of the birefringence results from the translational velocity difference between the en-tanglement networks and the solvent. With increasing ultrasonic frequency, the translational mo-tion of entanglement networks with respect to solvent becomes more hindered. As the radiationpressure on the rodlike micelles increases with the translational velocity difference, the birefrin-gence increases with the ultrasonic frequency.
3) Damped Oscillation Behavior of Transient Ultrasonically Induced Birefringence of theRodlike Micelles
In Fig. V-7(b), the solid curve is the calculated one using Eq. (V-16) with τd = 0.09 s andT = 0.10 s for 100 mM of CDAO and the dotted curve is the calculated value with τd = 0.13 s andT = 0.32 s for 50 mM. These curves well reproduce the experimental results. The value of T in-creases with decreasing concentration, while the value of τd does not depend on the concentrationof CDAO. It is interesting to note that the value of T of solutions of 50 mM CDAO is close to thatof mixtures of 30 mM CDAO and 230 mM NaSal. Furthermore, it should be pointed out that thevalues of τd and T do not depend on both ultrasonic intensity and ultrasonic frequency.
No theory has been proposed yet which can explain the damped oscillation behavior of tran-sient ultrasonically induced birefringence of the rodlike micelles. The viscoelastic properties78),80),81)
of the entanglement networks of CDAO and the mixtures composed of CTAB and NaSal havebeen described by the Maxwell model which has only one stress relaxation time, τs, and the en-tanglement networks are regarded as elastic body with plateau modulus, G0, at frequencies muchhigher than 1/τs. The shear stress82) on the entanglement networks of the mixtures of CTAB andNaSal exhibited the damped oscillation according as the start of shear flow of high rate above0.24 s–1. We considered the ultrasonically induced birefringence of rodlike micelles as follows.The entanglement networks suffer the stress due to the radiation pressure of the ultrasonic wave
152 H. Nomura et al.
and shrink in the direction of sound propagation with damping elastic oscillation. In the shrinkedentanglement network, the major axis of the rodlike micelles is elongated and orientated perpen-dicularly to the direction of the ultrasonic wave propagation. After the cessation of ultrasonic fields,the entanglement networks relax from a shrinked state with damping elastic oscillation. Since thefact that G0 of the entanglement networks is approximately proportional to the square of the con-centration of surfactant molecules is essentially equal to that observed in entangling polymer sys-tems, for example, rubber,80),83) the period of damped oscillation of birefringence, T, is inverselyproportional to the square root of G0. The value of τd is the deformational relaxation time of theentanglement networks. Because τs comes from the movement of entanglement networks as awhole, the value of τd increases with τs.Table V-1 indicates τs and G0, as well as τd and T. The valueof T decreases with increasing G0. Since the G0 of 60 mM CDAO is comparable to the one of themixtures of CTAB and NaSal, the value of T of 50 mM CDAO is close to the one of the mixturesof CTAB and NaSal. For CDAO, the both values of τs and τd are independent of concentration. Thevalue of τd increases with the value of τs for CDAO and the mixtures of CTAB and NaSal. Thequantitative relationships between G0 and T and between τd and τs are not clear, since availabledata of τs and G0 are few.
The sign of the birefringence depends on whether the orientational direction of major axis ofthe rodlike micelles is perpendicular or parallel to the propagation of sound wave and whether thebirefringence is caused by the positive form birefringence of the rodlike micelles or the negativeintrinsic birefringence of the surfactant monomers.71) In the ultrasonically induced birefringencemeasurements, the signs of birefringence were negative. The negative birefringence can be ex-plained in two different ways. In one way the orientational direction of major axis of the rodlikemicelles with the positive form birefringence of the rodlike micelles is perpendicular to the propa-gation of sound wave. In the other the orientational direction of major axis of the rodlike micelleswith negative intrinsic birefringence of the surfactant monomers is parallel to the propagation ofsound wave. The results of flow birefringence measurements73) show that the birefringence is causedby the negative intrinsic birefringence of the surfactant monomers. As described in the above sec-tion, the major axis of the rodlike micelles is elongated and orientated perpendicularly to the direc-tion of ultrasonic wave propagation. The ultrasonically induced birefringence might be caused bythe positive form birefringence of the rodlike micelles.
In order to study the rigidity of micelle and the salt dependences of damping oscillation ofultrasonically induced birefringence of rodlike micelles, we now are measuring the birefringenceof rodlike micelles composed of the mixtures of CTAB and NaSal.
Table V-1 Values of period T and Damping constant τd of a damped oscillation, the plateau modulus G0, andthe stress relaxaion time τs.
mixtures of30 mM CTAB and
230 mM NaSal 50 mM CDAO 100 mM CDAO
T/s 0.36 0.32 0.10τd/s 0.28 0.13 0.09
G0/Pa 4.4a 3.2b 10c
τs/s 2.5a 0.3b 0.3c
a Obtained at 25°C.80) b Obtained at 60 mM.82) c Ref. 82.
153Collective Translational-Rotational Coupling Motion of Molecules in Liquids and Solutions
6. Ultrasonically Induced Birefringence in Polymer Solutions84)
Under the irradiation of longitudinal ultrasound, birefringence has been observed in some liq-uids and solutions of anisotropic solute molecules.15),20),38)-43) The mechanisms of the ultrasonicallyinduced birefringence can be classified into two; one is by sinusoidal velocity gradient and theother is by ultrasonic radiation pressure.
In the normal neat liquids and solutions, reorientational relaxation times of molecules are al-most equal in order or faster than ultrasonic frequency. Therefore, a reorientational motion of mol-ecules can follow the sinusoidal velocity gradient produced by irradiation of ultrasonic waves anddirectly produces sinusoidal orientational order. The reorientational order produced is not uniformbut propagates as waves and induces birefringence. In this case, the induced birefringence shouldbe proportional to the ultrasonic amplitude, that is, the square root of the ultrasonic intensity38),41)-
43) as shown in section IV (mechanism I).On the contrary, for large particles of anisotropic shape such as rod like and planar colloidal
particles, ultrasonic radiation pressure produces a stationary torque on the particles and inducesreorientational order as a whole, because the orientational relaxation frequency of particles is muchsmaller than that of ultrasound frequency. In this case, the induced birefringence is proportional tothe ultrasonic intensity.15),20),38)-40) as expressed by Oka55) and Ou-Yang15) theories (mechanism II).Furthermore, the dynamical properties of large particles can be investigated by following the de-cay of the birefringence after rapid cessation of ultrasonic irradiation.15),20),38)-40)
As shown in the experimental session, in order to measure the ultrasonically induced birefrin-gence, used following two methods. One was the method in which the λ /4 plate is set in the opticalpath (biased detection) and the other was the method without λ /4 plate(non-biased detection) (seesection II). In every case, ultrasonically induced birefringence ∆n can be expressed by Eqs. (II-6)and (II-7), respectively.
Ultrasonically induced birefringence caused by mechanism I changes periodically followingthe phase change of the ultrasonic wave in space and time. Taking into consideration of the radiusof the laser bean and cut-off frequency of the optical detector, the birefringence signal should bezero by averaging in the biased detection. Therefore, the biased detection can only detect the bire-fringence caused by mechanism II. By the non-biased detection, the root mean square of the bire-fringence signal can be observed. So, the birefringence caused by both mechanisms will be mea-sured.
It is well known that flow birefringence can be observed in polymer solution under the sta-tionary shear stress.85) As shown in section IV, the ultrasonically induced birefringence should bealso observed in polymer solutions. As expected, ultrasonically induced birefringence has beenobserved in polystyrene toluene and polyisobutylene cyclohexane solutions by Jerrard.14)
For ultrasonically induced birefringence, Peterlin has proposed a theory for flexible macro-molecules.78) He considered that the polymer solution will behave more as a liquid than a colloidalsolutions, because of the flexibility of the molecules in which he considered to be permeable spheresin which the solvent was partially in immobilized. The optical behavior was calculated as for aliquid by finding an expression for the mean polarizabilitites in two direction and using the methodof Langevin to connect the anisotropy of the polarizability to the birefringence.
To relate the difference in the polarizabilities to the geometrical parameters of the molecules,Peterlin used the Kuhn model,86) namely a random coil, composed of the number of Nm segments,having the mean length Am and the end-to-end distance equal to h. The distribution in h is consid-ered to rise from a kinetic equilibrium between a statistical force tending to contract the chain tothe most probable value of h and a force due to the thermal motion which is dependent on therotary and internal diffusion constant Di of molecules. Under the influence of the acoustic field, heconsedered the spherically shaped molecule to be deformed to give a new distribution in h from
154 H. Nomura et al.
which the anisotropy of the polarizability may be calculated.If Vrel is the velocity, the distribution function of F finding the value of h is given by the fol-
lowing diffusion equation:
div [Vrel ⋅ F – Dc (2µhF + grad F )] = –∂F/ ∂t (V-17)
where µ = 3/2NmAm2 and Dc is a diffusion constant which is not only a function of rotary diffusion
constant D and but also is a function of Di.Peterlin used the results of Kuhn and Grun87) in which they regarded each segment (that is,
straight chain element) as being optical anisotropic with polarizabilities α1 and α 2 along and per-pendicular to its axis. Considering the whole molecule they found the mean polarizabilities γ 1 andγ 2 in direction along and perpendicular to the segment h. For the values of h smaller than the totalchain length, they give
γ1 – γ2 = (µ h2 ) (α1 – α2 ) / 15 (V-18)
The contribution to the polarizability of the whole medium by each molecule depends notonly on the magnitude of h but also on its orientation. The total contribution of all the molecules istherefore determined using the distribution function F given by the solution of Eq. (V-17).
According to the consideration mensioned above, Peterlin obtained the following expressionfor ultrasonically induced birefringence of polymer solutions.
∆nrms = 2πnη0 c[M ]sp f
WU
ρv2
1 /2
1
(1 + ω 2 τ 2 )1 /2(V-19)
where, τ = 1/4 µD, n is the refractive index of the solution, η0 is the solvent shear viscosity, c is theconcentration in g/cm3, [M]sp is a specific Maxwell constant, f is the frequency and ω = 2π f. Thisequation resembles the Eq. (IV-31) which Peterlin gives for neat liquids.54)
Jerrard measured the ultrasonically induced birefringence of polystyrene-toluene andpolyisobutylene-cyclohexane solution as a function of ultrasonic intensity and frequency (1–6MHz). His experimental set up corresponds to the non-biased detection in our system. He has re-ported that ultrasonically induced birefringence of polymer solutions is proportional to the squareroot of the irradiated ultrasonic intensity.
In the ultrasonic frequency region from several MHz to GHz, the ultrasonic relaxation pro-cesses which arise from the local segmental motion have been observed. As is seen in Eq. (V-17),in the case of the polymer solutions, the mechanisms of the birefringence will be more compli-cated than in pure liquids and colloidal suspensions. The torque which comes from the ultrasonicirradiation pressure will couple with the local segmental motions of polymer chains in solution.
In order to clarify the birefringence mechanisms, we measured the ultrasonically induced bi-refringence of polystyrene-tolune solutions using both biased and non-biased measurement. Thebirefringence of polymer solutions has been obtained by both biased and non-biased measurement.Typical birefringence signal obtained by the biased measurement is shown Fig. V-10. As shown inFig. V-10, the rise and decay times of the ultrasonically induced birefringence signals are almostsame as that ultrasonic pulse as 5 µs. These results also obtained by the non-biased detection. Thesign of the birefringence signal can be determined by the biased detection. In this work, the signwas positive. Figure V-11 shows the ultrasonic irradiation intensity dependence of birefringence.As is seen in Fig. V-11, birefringeces observed by the non-biased detection are in proportional to
155Collective Translational-Rotational Coupling Motion of Molecules in Liquids and Solutions
Fig. V-10 Birefringence signal of polystyrene-toluene solution using a quarter wave plate. (10 wt%, 25 MHz,25°C).
Fig. V-11 Utrasonic intensity dependence of birefringence in polystyrene-toluene solution (10 wt%, 25 MHz,25°C). (■ : with quarter wave plate, ● : without quarter waveplate)
156 H. Nomura et al.
the square the root of the ultrasonic intensity, but those obtained by the biased detection are inlinearly proportional to the ultrasonic intensity. The values of the birefringence signal measured bythe biased detection are smaller than those obtained by the non-biased detection at all ultrasonicintensities. The experimental results for the parts which were proportional to the square root of theultrasonic intensity are in agreement with those obtained by Jerrard for polystyrene-toluene solu-tions. However, the parts which are linearly proportional to the ultrasonic intensity was not re-ported and the result obtained in our work is the first case.
It is very interesting that in the polymer solutions, at fairly strong region of the ultrasonicpower, two kinds of ultrasonically induced birefringence were clearly observed. The birefringenceobtained by the non-biased detection, that is, part proportional to the square root of the ultrasonicpower will be caused by sinusoidal velocity gradient which was obtained by Jerrard. The parts ofbirefringence obtained by the biased detection were clearly measured even in the low ultrasonicintensity region and linearly proportional to the ultrasonic intensity.
As well known, in polymer solutions, the typical non-linear viscoelastic behavior, that is thestress normal mode effects, has been observed. Badoz88) has modified the Peterlin’s theory for mac-romolecular solution to take into account the elastic effects of polymer chains in solutions. Theexpression of birefringence obtained from this elastic model also indicates that the values of bire-fringence are linearly proportional to the ultrasonic frequency and square root of the ultrasonicintensity.
The frequency dependence of the birefringence of polymer solutions will be very important.Our work on this line is now going on.
For the ultrasonically induced birefringence measurement of polymer solutions, it is very in-teresting and very important that the two different types of birefringence were observed. In orderto elucidate the detailed mechanisms of polymer chain motions in solutions ultrasonically inducedbirefringence measurement has opened a new field of the chain dynamics. In this case, the keyfactor is how the translational and rotational motion of molecules couples with each other.
VI. General Conclusion and Scope
In this review, we discussed the coupling between translational and rotational motion of liquidcrystal molecules in isotropic phase as an example of liquids. The coupling parameter R obtainedfrom the depolarized light scattering measurements is an important parameter to deduce the infor-mation about the relation between the anisotropic molecular interaction and the local structure ofliquids and solutions. Besides, we presented a theory of the ultrasonically induced birefringence inneat liquids and discussed the problem of coupling between the reorientational (rotational) modeand longitudinal mode. Our theory is not agreement with that of the irreversible statistical mechan-ics. The longitudinal mode is described as the sum of the bulk and shear mode. The discrepancybetween our theory and that of the irreversible statistical mechanics comes from the difference inthe choice of the coupled variables. In order to clarify this point, we must consider how the mo-lecular volume and the rotational motion correlate each other in molecular level. For the ultrasoni-cally induced birefringence measurement, two type of birefringence were observed; one is propor-tional to the square root of ultrasonic intensity and the other the ultrasonic intensity itself.
It is well known that in liquids such as benzene and their derivatives, the reorientational relax-ation times τ can be expressed τ = Cη + τ00 as a function of translational viscosity η, where C is aconstant and τ00 is a time constant which is correlated with the classical “free-rotator reorienta-tion” time.1) The value of constant C has been discussed in their relation to the boundary condition,that is “stick” or “slip” boundary one. The similar kinds of discussion also have been made on the
157Collective Translational-Rotational Coupling Motion of Molecules in Liquids and Solutions
translational diffusion constant. However translational and rotational diffusion coefficients shouldbe expressed in terms of molecular interaction potentials. In the molecular level or in a very shortrange region, the translational and rotational motion should be coupled each other. We are obligedto discuss the interaction between the translational and rotational motions as a measure of hydro-dynamic parameter C because of the lack of the information about the interaction between thetranslational and rotational motions in the molecular level.
The problems such as the coupling parameter R and ultrasonically induced birefringence dis-cussed in the review are related directly to how the molecular interaction potential of the atom andatoms reflects on the molecular motion in the molecular level and also what the molecular volumeis. Thus, the molecular interactions in the molecular and very short range levels even in the staticand dynamic meanings are essential. However, a limitted number of experimental techniques areavailable to obtain the information about the coupling of the translational and rotational motions.The techniques available are only depolarized light scattering and flow and ultrasonically inducedbirefringences.
We remember the following Einstein’s messages;“Raffiniert ist der Herrgott aber boshaft ist er nicht.”“Die Natur verbirgt ihr Geheimnis durch die Erhabenheit ihres Wesens, aber nicht durch List.”
References
1) B. Berne and R. Pecora, Dynamic Light Scattering, (New York, Wiley, 1976).2) D. Kivelson and P. A. Madden, Ann. Rev. Phys. Chem. 31, 523 (1980) and references therein.3) P. G. de Gennes, Mol. Cryst. Liq. Cryst., 12, 193 (1971).4) T. D. Gierke and W. H. Flygare, J. Chem., Phys., 61, 2231 (1974).5) C. Filippini and Y. Poggi, Phys. Lett., 65A, 30 (1978) and reference therein.6) P. Martinoty, S. Candau and F. Debeauvais, Phys. Rev. Lett., 27, 1123 (1971).7) Y. Kawamura, PhD thesis, University of Tokyo, 1982; Y. Kawamura and S. Iwayanagi, Mol. Cryst. Liq.
Cryst., 38, 239 (1977).8) S. J. Tsay and D. Kivelson, Mol. Phys., 29, 1 (1975).9) H. C. Anderson and R. Pecora, J. Chem. Phys., 54, 2584 (1971).
10) T. Keys and D. Kivelson, J. Chem. Phys., 54, 1786 (1971), and 56, 1876 (1972).11) G. R. Alms D. R. Bauer, J. I. Brauman and R. Pecora, J. Chem. Phys., 59, 5304 (1973).12) R. Lipeles and D. Kivelson, J. Chem. Phys., 72, 6199 (1980).13) J. L. Viovy G. M. Searby, P. Sixou and J. V. Champion, Mol. Phys., 39, 471 (1980).14) H. G. Jerrard, Ultrasonics, 2, 74 (1964).15) H. D. Ou-Yang,. R. A. MacPhail and D. Kivelson, Phys. Rev., A33, 611 (1986).16) S. Koda, T. Koyama,Y. Enomoto and H. Nomura, Jpn. J. Appl. Phys., 31, Suppl.31-1, 51 (1992).17) T. Shibata, T. Matsuoka, S. Koda and H. Nomura, J. Chem. Phys., 109, 2038 (1998).18) T. Matsuoka, K. Sakai and K. Takagi, Phys. Rev. Lett., 71, 1510 (1993).19) T. Matsuoka, K. Sakai and K. Takagi, Rev. Sci. Instrum., 64, 2136 (1993).20) K. Yasuda, T. Matsuoka, S. Koda and H. Nomura, J. Phys. Chem., 100, 5892 (1996).21) T. Matsuoka, K. Yasuda, S. Koda and H. Nomura, J. Chem. Phys., 11, 1580 (1999).22) W. R. Klein and B. D. Cook, IEEE Trans. Sonics. Ultrason., SU-14, 123 (1967).23) R. B. Gibson and Kinkaid, J. Am. Chem. Soc., 60, 511 (1938).24) S. M. Rytov, Zh. Eksp. Teor. Fiz., 33, 514 (1957).25) G. I. A. Stegeman and B. P. Stoicheff, Phys. Rev. Lett., 21, 202 (1968); Phys. Rev., A7, 1160 (1973).26) W. Lempert and C. H. Wang, J. Chem. Phys., 72, 3490 (1980).27) G. R. Alms, T. D. Gierke and G. D. Patterson, J. Chem. Phys., 67, 5779 (1977).28) T. Ueno, K. Sakai and K. Takagi, Phys. Rev. E, 54, 6457 (1996).
158 H. Nomura et al.
29) T. Shibata, T. Matsuoka, S. Koda and H. Nomura, Jpn. J. Appl., 38, 2059 (1999).30) T. Shibata, T. Matsuoka, S. Koda and H. Nomura, J. Mol. Liq., in press.31) S. L. Whittenburg and C. H. Wang, J. Chem. Phys. 66, 4995 (1977).32) P. J. Chappell and D. Kivelson, J. Chem., Phys., 76, 1742 (1982).33) G. K. L. Wong and Y. R. Shen, Phys. Rev., A, 10, 1277 (1974).34) J. D. Lister and T. W. Stinson III, J. Appl. Phys., 41, 996 (1970).35) G. R. Alms and G. D. Patterson, J. Chem. Phys., 68, 3440 (1978).36) J. Leadetter, R. M. Richardson, and C. N. Colling, J. Phys. (Paris), 36, C1-37 (1975).37) G. W. Gray and A. Mosley, Mol. Cryst. Liq. Cryst., 35, 72 (1976).38) H. G. Jerrard, Ultrasonics, 2, 74 (1964).39) K. Yasuda, T. Matsuoka, S. Koda and H. Nomura, Jpn. J. Appl. Phys., 33, 2901 (1994).40) K. Yasuda, T. Matsuoka, S. Koda and H. Nomura, J. Phys. Chem. B, 101, 1138 (1997).41) P. Martinoty and M. Bader, J. Phys. (Paris), 42, 1097 (1981).42) M. Bader and P. Martinoty, Mol. Cryst. Liq. Cryst., 76, 269 (1981).43) P. G de Gennes and J. Prost, The Physics of Liquid Crystals 2nd ed. (Clarendon, Oxford, 1993), Chap. 2.44) P. Martinoty, F. Kiry, S. Nagai and S. Candau, J. Phys. (Paris), 38, 159 (1977).45) D. Kivelson and T. Keyes, J. Champion, Mol. Phys., 31, 221 (1976).46) P. J. Chappell, M. P. Allen, R. I. Hallem and D. Kivelson, J. Chem. Phys., 74, 5929 (1981).47) M. P. Allen, P. J. Chappell and D. Kivelson, J. Chem. Phys., 74, 5942 (1981).48) R. Lipeles and D. Kivelson, J. Chem. Phys., 67, 4564 (1977).49) W. T. Grubbs and R. A. MacPhail, J. Chem. Phys., 97, 8906 (1992).50) C. H. Wang, Mol. Phys., 58, 497 (1986).51) J. Frenkel, Kinetic Theory of Liquids, (Clarenden, Oxdord, 1946), Chap. 5.52) N. C. Hilyard and H. G. Jerrard, J. Appl. Phys., 33, 3470 (1962).53) Peterlin, J. Phys. Radium, 11, 45 (1950).54) H. Kawamura, Kagaku (Tokyo), 7, 6 (1938); 7, 54 (1938); 7, 139 (1938) [in Japanese].55) S. Oka, Kolloid Z., 87, 37 (1939); Z. Physik., 116, 632 (1940).56) S. Petralia, Nuovo Cimento, 17, 378 (1940).57) T. Yasunaga, N. Tatsumoto and H. Inoue,. J. Colloid & Interface Sci., 29, 178 (1969).58) P. Debye, P. Polar molecules, (Dover, New York, 1929).59) R. Polhman, Z Physik., 107, 497 (1937).60) L. V. King, Proc Roy. Soc. London ser., A153, 1 (1935); A153, 17 (1935).61) J. W. S. Rayleigh, Theory of Sound, 2nd ed., (Dover, New York, 1945).62) W. König, Wied. Ann t., XXXII, 43, (1891).63) A. Peterlin and H. A. Stuart, Z. Physik, 112, 129 (1939).64) L. D. Landau and P. M. Lifshitz, Fluid Mechanics, (Pergamon Press, Oxford, 1959).65) S. H. Lamb, Hydrodynamics 6th ed., (Cambridge at the University Press, 1932).66) F. Perrin, J. Phys. & Rad., 5, 197 (1934); 7, 1 (1936).67) M. Ozaki, S. Kratohvil and E. Matijevic, J. Colloid & Interface Sci., 102, 146 (1984).68) R. O. James, Colloids Surfaces, 27, 133 (1987).69) H. Hoffmann, G. Oetter and B. Schwandner, Prog. Colloid Polym. Sci., 72, 95 (1987); 73, 95 (1987).70) H. Pilsl, H. Hoffmann, S. Hofmann, J.Kalus, A. W. Kencono, P. Lindner and W. Ulbricht, J. Phys. Chem.,
97, 2745 (1993).71) H. Rehage and H. Hoffmann, J. Phys. Chem., 92, 4712 (1988).72) H. Hoffmann, U. Kramer and H.Thurn, J. Phys. Chem., 94, 2027 (1990).73) T. Shikata, S. J. Dahman and D. S. Pearson, Langmuir, 10, 3470 (1994).74) S. Hofmann, A. Rauscher and H. Hoffmann, Ber. Bunsenges. Phys. Chem., 95, 153 (1991).75) Y. Hu, S. Q. Wang and A. M. Jamieson, J. Colloid Interface Sci., 156, 31 (1993).76) H. Hoffmann, A. Rauscher, M. Gradzielski and S. F.Schulz, Langmuir, 8, 2140 (1992).77) G. Platz, C. Thunig and H. Hoffmann, Prog. Colloid Polym. Sci., 83, 167 (1990).78) K. Hashimoto and T. Imae, Langumir, 7, 1734 (1991).79) A. Peterlin, Rec. trav. Chim., 69, 14 (1950).80) T. Shikata and T. Kotaka, J. Non-Crystalline Solids, 131–133, 831 (1991).
159Collective Translational-Rotational Coupling Motion of Molecules in Liquids and Solutions
81) E. K. Wheeler, P. Izu and G. G.Fuller, Rheol. Acta, 35, 139 (1996).82) T. Shikata, H. Hirata, E. Takatori and K. Osaki, Non-Newtonian Fluid Mech., 28, 171 (1988).83) T. Shikata, private communication.84) T. Matsuoka, S. Koda and H. Nomura, Jpn. J. Appl. Phys., 39, (2000) to be published.85) M. Doi and S. F. Edwards, The Theory of polymer Dynamics, Clarendon Press, Oxford, (1986).86) W. Kuhn, Kolloid-Z., 68, 2 (1934); Z-angew Chem., 49, 858 (1936); Experientia 1, 28 (1945).87) W. Kuhn and F. Grun, Kolloid-Z., 101, 248 (1942).88) J. Badoz, J. Phys. Radium, 15, 777 (1954).