37
5 6 9 4 0 7 2 3 1 1 American Council on Education Center for Policy Analysis College Graduation Rates: Behind the Numbers
56 940
7
2
31
1
American Council on Education
Center for Policy Analysis
College Graduation Rates:Behind the Numbers
© September 2010
American Council on Education
ACE and the American Council on Education are registered marks of the American Council on Education and
cannot be used or reproduced without the express written consent of the American Council on Education.
American Council on Education
One Dupont Circle NW
Washington, DC 20036
All rights reserved. No part of this book may be reproduced or transmitted in any form or by any means
electronic or mechanical, including photocopying, recording, or by any information storage and retrieval
system, without permission in writing from the publisher.
Behind the NumbersCollege Graduation Rates:
Bryan Cook Natalie Pullaro
Acknowledgments . . . . . . . . . . . . . . . . . . . . . . . . . . . . . . . . . . . . . . . . . . . . . . . . . . . . . . . . . . . . iii
Executive Summary . . . . . . . . . . . . . . . . . . . . . . . . . . . . . . . . . . . . . . . . . . . . . . . . . . . . . . . . . . . iv
Introduction . . . . . . . . . . . . . . . . . . . . . . . . . . . . . . . . . . . . . . . . . . . . . . . . . . . . . . . . . . . . . . . . . 1
History of National Graduation Rates . . . . . . . . . . . . . . . . . . . . . . . . . . . . . . . . . . . . . . . . . . . . . . . 4
Data Sources . . . . . . . . . . . . . . . . . . . . . . . . . . . . . . . . . . . . . . . . . . . . . . . . . . . . . . . . . . . . . . . . 6
Institutional Databases . . . . . . . . . . . . . . . . . . . . . . . . . . . . . . . . . . . . . . . . . . . . . . . . . . . . . . . . . 7
IPEDS . . . . . . . . . . . . . . . . . . . . . . . . . . . . . . . . . . . . . . . . . . . . . . . . . . . . . . . . . . . . . . . . . . 7
IPEDS’ Graduation Rate Survey (GRS) . . . . . . . . . . . . . . . . . . . . . . . . . . . . . . . . . . . . . . . . . . 7
Advantages . . . . . . . . . . . . . . . . . . . . . . . . . . . . . . . . . . . . . . . . . . . . . . . . . . . . . . . . . . . . 7
Disadvantages . . . . . . . . . . . . . . . . . . . . . . . . . . . . . . . . . . . . . . . . . . . . . . . . . . . . . . . . . . 8
Implications for Policy Makers . . . . . . . . . . . . . . . . . . . . . . . . . . . . . . . . . . . . . . . . . . . . . . . . 9
National Student Clearinghouse . . . . . . . . . . . . . . . . . . . . . . . . . . . . . . . . . . . . . . . . . . . . . . . 10
Calculating a Graduation Rate with Clearinghouse Data . . . . . . . . . . . . . . . . . . . . . . . . . . . . . . 11
Advantages . . . . . . . . . . . . . . . . . . . . . . . . . . . . . . . . . . . . . . . . . . . . . . . . . . . . . . . . . . . 11
Disadvantages . . . . . . . . . . . . . . . . . . . . . . . . . . . . . . . . . . . . . . . . . . . . . . . . . . . . . . . . . 12
Implications for Policy Makers . . . . . . . . . . . . . . . . . . . . . . . . . . . . . . . . . . . . . . . . . . . . . . . 12
State Data Systems . . . . . . . . . . . . . . . . . . . . . . . . . . . . . . . . . . . . . . . . . . . . . . . . . . . . . . . 13
Advantages . . . . . . . . . . . . . . . . . . . . . . . . . . . . . . . . . . . . . . . . . . . . . . . . . . . . . . . . . . . 14
Disadvantages . . . . . . . . . . . . . . . . . . . . . . . . . . . . . . . . . . . . . . . . . . . . . . . . . . . . . . . . . 14
Implications for Policy Makers . . . . . . . . . . . . . . . . . . . . . . . . . . . . . . . . . . . . . . . . . . . . . . . 15
Table of Contents
Non-institutional Databases . . . . . . . . . . . . . . . . . . . . . . . . . . . . . . . . . . . . . . . . . . . . . . . . . . . . 16
Beginning Postsecondary Students (BPS) Study . . . . . . . . . . . . . . . . . . . . . . . . . . . . . . . . . . . 16
Advantages . . . . . . . . . . . . . . . . . . . . . . . . . . . . . . . . . . . . . . . . . . . . . . . . . . . . . . . . . . . 16
Disadvantages . . . . . . . . . . . . . . . . . . . . . . . . . . . . . . . . . . . . . . . . . . . . . . . . . . . . . . . . . 17
Implications for Policy Makers . . . . . . . . . . . . . . . . . . . . . . . . . . . . . . . . . . . . . . . . . . . . . . . 17
National School-to-College Longitudinal Studies . . . . . . . . . . . . . . . . . . . . . . . . . . . . . . . . . . . 18
Advantages . . . . . . . . . . . . . . . . . . . . . . . . . . . . . . . . . . . . . . . . . . . . . . . . . . . . . . . . . . . 19
Disadvantages . . . . . . . . . . . . . . . . . . . . . . . . . . . . . . . . . . . . . . . . . . . . . . . . . . . . . . . . . 19
Implications for Policy Makers . . . . . . . . . . . . . . . . . . . . . . . . . . . . . . . . . . . . . . . . . . . . . . . 20
Discussion . . . . . . . . . . . . . . . . . . . . . . . . . . . . . . . . . . . . . . . . . . . . . . . . . . . . . . . . . . . . . . . . . 21
Institutional Diversity . . . . . . . . . . . . . . . . . . . . . . . . . . . . . . . . . . . . . . . . . . . . . . . . . . . . . 21
Account for Students Still on Track to Graduate . . . . . . . . . . . . . . . . . . . . . . . . . . . . . . . . . . . 22
Alternative Measures to Graduation Rates . . . . . . . . . . . . . . . . . . . . . . . . . . . . . . . . . . . . . . . 22
Expand the Focus Beyond Undergraduate Education . . . . . . . . . . . . . . . . . . . . . . . . . . . . . . . 22
Conclusion . . . . . . . . . . . . . . . . . . . . . . . . . . . . . . . . . . . . . . . . . . . . . . . . . . . . . . . . . . . . . . . . 23
Appendices . . . . . . . . . . . . . . . . . . . . . . . . . . . . . . . . . . . . . . . . . . . . . . . . . . . . . . . . . . . . . . . . 24
Table: Graduation Rate Databases . . . . . . . . . . . . . . . . . . . . . . . . . . . . . . . . . . . . . . . . . . . . 24
Making Graduation Rates Matter . . . . . . . . . . . . . . . . . . . . . . . . . . . . . . . . . . . . . . . . . . . . . 28
College graduatioN rates: BeHiNd tHe NumBers i i i amer ican Counc i l on educat ion
Acknowledgments
The following colleagues participated in the review process for this report: Jacqueline King, Mikyung Ryu,
and Young Kim of the American Council on Education; Cliff Adelman of the Institute for Higher Education
Policy; Jane Wellman of the Delta Cost Project; Jeff Tanner of the National Student Clearinghouse; Victor
Borden of Indiana University–Purdue University Indianapolis; Hans P. L’Orange of the State Higher Education
Executive Officers; and Tom Weko, Andrew Mary, and Roz Korb of the National Center for Education
Statistics.
College graduatioN rates: BeHiNd tHe NumBers i v amer ican Counc i l on educat ion
Executive Summary
During the past decade, state and federal policy
makers have pushed for more accountability
from colleges and universities. As the importance of
a college degree has increased along with the costs
to earn one, policy makers are looking at student
outcomes as a measure of the quality of postsecond-
ary education institutions. One outcome measure
that has received most of the attention is graduation
rates.
Since President Obama stated that “by 2020,
America will once again have the highest proportion
of college graduates in the world,” postsecondary
graduation rates have taken on increased importance
and scrutiny. Because the issue of graduation rates
has long been a favorite topic of higher education
policy researchers, there is no shortage of reports
that detail the disparity in graduation rates by race,
income, and institutional type, as well as the limita-
tions of the data most often used to calculate gradu-
ation rates.
Unlike other reports on graduation rates, the
focus of this report is not on disparities in gradua-
tion rates, how to improve graduation rates, or how
to fix the way in which graduation rates are cal-
culated. The purpose of this report is to provide a
layperson’s guide to the most commonly reported
graduation rates and the databases used to calculate
these rates. More specifically, this report provides
policy makers and policy researchers with a history
of the databases that are most often used to calcu-
late graduation rates as well as the advantages and
disadvantages of each database (this information also
can be found in a summary table in the appendices).
Additionally this report suggests several factors for
policy makers to consider before using graduation
rate data from existing databases as a way to assess
institutional success. Some of the major observations
of this report include the following:
• Graduation rate data are a relatively new phe-
nomenon; the first year these data were col-
lected by the Department of Education was
1996.
• Although none of the existing national databases
can provide a graduation rate that accounts for
all students, all the databases do provide valu-
able information that contributes to our under-
standing of student success.
• Much of the policy conversation on graduation
rates has focused on undergraduate education.
Very little is known about graduation rates of
graduate students.
• Alternative measures, such as a ratio of degrees
awarded to total enrollment, are frequently used
to evaluate institutional success.
• Most conversations on the six-year graduation
rates do not include discussion of the percentage
of students still enrolled. It is important to con-
sider the share of students still on track to grad-
uate after the six-year point.
Overall, this report highlights the complexities of
measuring what many policy makers view as a
simple compliance metric with the existing national
databases. Just because the existing databases used
to calculate graduation rates were not designed with
the current policy demands in mind does not render
them useless. The databases referenced in this report
provide valuable information on graduation rates;
however, as the disadvantages of these databases
reveal, users of these data should take care in using
them to measure the overall effectiveness of
postsecondary education institutions.
College graduatioN rates: BeHiNd tHe NumBers 1 amer ican Counc i l on educat ion
Introduction
Graduation rates have increasingly become
a key component of the higher education
accountability conversation. A 2006 report from the
U.S. Secretary of Education’s Commission on the
Future of Higher Education stated that among the
“dramatic” changes that higher education needed
was improvement of the “persistent gap between
the college attendance and graduation rates of low-
income Americans and their more affluent peers.”
While then-U.S. Secretary of Education Margaret
Spelling’s commission was not the first voice of
concern about the graduation rates of students at
colleges and universities—in particular, disparities
in completion by race and income—it helped move
the conversation on postsecondary accountability
from input measures (e.g., access and enrollment)
to output measures (e.g., persistence and graduation
rates). Since the commission report was released,
articles, reports, blogs, and even some state and
federal legislation have called for more institutional
accountability and better consumer information
on graduation rates. Some examples include the
following:
• The American Graduation Initiative, proposed
by the Obama administration (but not passed),
called for states and colleges to “establish
quantifiable targets for improving graduation
rates” in order to access available federal funds.
• The 2008 Higher Education Opportunity Act
called for wider disclosure of institutional
graduation rates for consumer information.
• A 2009 report from the American Enterprise
Institute1 states that graduation rates “convey
important information…” and should be “the
beginning of a deeper inquiry into college
success.”
• In 2009, a blogger for the D.C. College
Admissions Examiner web site wrote, “One of
Key Terms
According to data from the Baccalaureate and Beyond Longitudinal Study, the average time to degree for a bachelor’s degree is six years. Although comparable data are not available for associate degrees, it is widely accepted that the average time to an associate degree is longer than two years. As such, this report does not use the more common nomenclature of two- and four-year institutions to describe colleges and universities. In this report, a baccalaureate institution refers to an institution that awards bachelor’s degrees or higher, and associate institutions are those that award associate degrees. Although these labels are similar to those in the Carnegie Classification, they do not have the same meaning.
Graduation rates versus attainment ratesIn February 2009, President Obama stated that by 2020, the United States would have the highest educational attainment rate in the world. Since that statement, many reports, presentations, and keynotes have referenced this goal and discussed numerous ways to achieve it. However, some mistakenly use attainment rates and graduation rates as synonymous terms. Graduation rates are a measure of the share of students who enter college and graduate within a certain number of years. Educational attainment rates are a measure of the share of the U.S. population that has earned a postsecondary degree. Although graduation rates affect U.S. educational attainment rates, they are two separate measures, calculated in two different ways. This report focuses on postsecondary graduation rates.
1 Hess, F ., Schneider, M ., Kelly, A ., & Carey, K . (2009) . Diplomas and dropouts: Which colleges actually graduate their students (and which ones don’t) . Washington, DC: American Enterprise Institute .
College graduatioN rates: BeHiNd tHe NumBers 2 amer ican Counc i l on educat ion
the scariest numbers in postsecondary education
is the national six-year college graduation rate”
and that “graduation rates should be key factors
in college selection.”2
• A 2010 report by Fastweb and Maguire
Associates3 found that among 23 criteria of
institutional quality, high school seniors chose
graduation rates as the fifth most important
indicator of institutional quality, ahead of
factors such as graduate school placement, a
rigorous core curriculum, existence of an honors
program, and college rankings in U.S. News &
World Report and other college guides.
• Twenty-two states have promised to develop
specific plans to improve their college
completion rates by participating in the
Complete College America Alliance of States.
• The National Governors Association recently
announced its Compete to Complete initiative,
which focuses on increasing the number of
students in the United States who complete
college degrees and certificates.
• During the 2010 National Collegiate Athletic
Association (NCAA) basketball tournament, U.S.
Secretary of Education Arne Duncan not only
criticized the graduation rates of student athletes
but also suggested that NCAA teams that fail to
graduate 40 percent of their players should be
ineligible for post-season competition.
It is clear in nearly every conversation about higher
education accountability that graduation rates are
increasingly viewed as a critical, if not the critical,
measure of both student and institutional success.
However, before policy makers formally make grad-
uation rates a high-stakes measure of institutional
accountability, they need to better understand exist-
ing graduation rate measures and the databases that
provide this increasingly important information.
The purpose of this report, therefore, is threefold.
First, it will provide a detailed overview of the
various sources of graduation rate data. Second,
and more importantly, it will explain the positive
and negative aspects of each of these databases (a
summary of the overview of databases, showing the
positives and negatives of each, can be found in a
table in the appendices). Third, it will offer several
factors to consider before using graduation rates to
determine an institution’s
level of success. The
goal of this report is
to help policy makers
better understand the
challenges inherent in
using current graduation
rate data to determine or
inform federal or state
policy decisions regarding postsecondary education
institutions.
Two reports from the National Center for
Education Statistics (NCES; the Department of
Education division that is responsible for collecting
information from colleges and universities)4 based
on separate NCES databases relay the complexities
of graduation-rate data that confront policy makers.
One report, based on the Integrated Postsecondary
Education Data System (IPEDS), shows that the six-
year graduation rate at baccalaureate institutions
for students entering in 1995 to pursue a bachelor’s
degree was 56.4 percent.5 A second report, which
used the Beginning Postsecondary Student (BPS)
study, states that the six-year graduation rate of
bachelor’s degree–seeking students who enrolled in
a baccalaureate institution in 1995 was 65.6 percent.6
2 Griesemer, N . (2009) . Graduation rates should be key factors in college selection . Examiner .com . Retrieved from www .examiner .com/college-admissions-in-washington-dc/graduation-rates-should-be-key-factors-college-selection .
3 Maguire Associates (2010) . Students’ application choices & college preferences in the 2010 admissions cycle: Results from the 2010 college decision impact survey .
4 The National Center for Education Statistics (NCES) is the primary federal entity for collecting and analyzing data related to education in the United States and other nations . NCES is located within the U .S . Department of Education and the Institute of Education Sciences .
5 Knapp, L . G ., Kelly-Reid, J . E ., and Whitmore, R . W . (2006) . Enrollment in postsecondary institutions, fall 2004; graduation rates, 1998 & 2001 cohorts; and financial statistics, fiscal year 2004 (NCES 2006-155) . Washington, DC: U .S . Department of Education, Institute of Education Sciences, National Center for Education Statistics .
6 Berkner, L ., He, S ., & Forrest Cataldi, E . (2002) . Descriptive summary of 1995–96 beginning postsecondary students: Six years later (NCES 2003–151) . Washington, DC: U .S . Department of Education, National Center for Education Statistics . .
Before policy makers formally make graduation rates a high-stakes measure of institutional accountability, they need to better understand existing graduation rate measures.

College graduatioN rates: BeHiNd tHe NumBers 3 amer ican Counc i l on educat ion
How can two reports from the same federal agency
provide two different graduation rates for the
same cohort? This report will answer that question
by providing a detailed overview of the national
databases used to calculate these graduation rates.
The first section of this report provides a brief
overview of the history of graduation rates in the
United States. The second section gives a detailed
overview of the current sources for graduation rate
data along with the positive and negative aspects
of each. This section also discusses the implications
of the pros and cons of each database on policy
decisions regarding graduation rates. The final
section provides several factors that policy makers
should keep in mind when considering the use
of graduation rates as a measure for institutional
effectiveness.
College graduatioN rates: BeHiNd tHe NumBers 4 amer ican Counc i l on educat ion
History of National Graduation Rates
Reporting graduation rates to the federal govern-
ment is a relatively new requirement. Before 1985,
no national-level institutional data on college and uni-
versity graduation rates existed. In 1985, the NCAA
began requiring its member schools to report gradu-
ation rate data so that the association could compare
the academic records and performances of student
athletes with the overall student body.7 These data
were not publically available and were released only
to NCAA member institutions that reported their data.
In 1988, U.S. Senators Bill Bradley and Edward
Kennedy proposed bill S.2498, later referred to as
the Student Athlete Right-to-Know Act.8 (The same
bill was introduced in the House
by Representative Tom McMillen.)
This bill was the first to require
higher education institutions that
receive Title IV funds to submit an
annual report to the Secretary of
Education containing information
on graduation rates. Specifically, the bill required
schools to report the following:
• The number of students at the institution,
broken down by race/ethnicity and sex.
• The number of students who received athletics-
related student aid, broken down by race/
ethnicity and sex in the following sports:
basketball, football, baseball, cross-country/
track, and all other sports combined.
• The completion or graduation rates for students
at the institution who received athletics-related
student aid, broken down by race/ethnicity and
sex in the following sports: basketball, football,
baseball, cross-country/track and all other sports
combined.
• The completion or graduation rate for students
at the institution, broken down by race/ethnicity
and sex.
• The average completion or graduation rate for
the four most recent completing or graduating
classes of students at the institution who
received athletics-related student aid, broken
down by race/ethnicity and sex in the following
categories: basketball, football, baseball, cross-
country/track, and all other sports combined.
• The average completion or graduation rate for
the four most recent completing or graduating
classes of students at the institution, broken
down by race/ethnicity and sex.
The impetus for this legislation was
a concern among Congress that the
increasing revenue from college athlet-
ics was “so great that the educational
mission of the university is too easily
forgotten.”9 A 1989 report prepared by the General
Accounting Office (GAO)10 to help inform congressio-
nal deliberations about this bill found that the gradu-
ation rate for men’s basketball and football players
at the NCAA’s largest member schools (formerly
Division I) were lower than the graduation rates for
all students.11 The view of the committee was that
“student athletes about to enter college are consum-
ers” and “as such are entitled to relevant and basic
information in order to make an informed choice
about which college to attend.”12
On November 9, 1990, Congress passed the
Student Right-to-Know and Campus Security Act.
Although the original intent of this legislation was
to protect the educational interests of student ath-
7 U .S . General Accounting Office . (1989) . Student athletes: Most schools meet proposed academic performance reporting requirements. Washington, DC: Author .
8 Student Athlete Right-to-Know Act . Report together with Minority Views . One Hundred First Congress . First Session . (1989) .9 Student Athlete Right-to-Know Act .10 General Accounting Office . Student athletes.11 This report uses data collected by both the NCAA and National Association of Intercollegiate Athletics (NAIA) for their respective member schools . 12 Student Athlete Right-to-Know Act .
Before 1985, no national-level institutional data on college and university graduation rates existed.
College graduatioN rates: BeHiNd tHe NumBers 5 amer ican Counc i l on educat ion
letes, it was believed that this information would be
more broadly useful to students making decisions
regarding postsecondary education institutions (thus,
the removal of “athlete” from the title of the bill).
According to NCES, the federal collection of gradu-
ation rate data is done specifically to help institu-
tions respond to the requirements of this bill.13 It
should be noted that beginning in 2007, the IPEDS
Graduation Rate Survey (GRS) no longer required
institutions to report graduation rates for scholar-
ship athletes.14 Now, this information is collected and
reported by the NCAA.
13 http://nces .ed .gov/ipeds/about/ . 14 http://nces .ed .gov/ipeds/glossary/?charindex=G .
College graduatioN rates: BeHiNd tHe NumBers 6 amer ican Counc i l on educat ion
Data Sources
A lthough graduation rates have become a major
topic during the past decade, only a handful
of data sources can be used to calculate graduation
rates at a national level. These data sources include:
• Required annual federal surveys of institutions.
• Three types of federal surveys given to a sample
population of students:
• A cross-sectional survey (looks at a one-year
snapshot).
• A grade cohort longitudinal survey (follows a
specific grade of students over time, e.g., 12th
graders).
• An event cohort longitudinal survey (tracks an
event over time, e.g., beginning college for the
first time).
• Data submitted voluntarily by a large number of
institutions to a private nonprofit organization.
• Data collected by individual states.
Each of these databases is slightly different in terms
of who is included in the cohort to calculate a grad-
uation rate, meaning that depending on which
database is used, it is likely to produce a different
graduation rate. As the earlier example suggests, the
differences can be relatively large. Because of their
different methodologies, each database has advan-
tages and disadvantages in calculating national grad-
uation rates.
Because much of the national policy discussion is
focused on institutional accountability, it is important
to acknowledge that not all the databases discussed
in this report are able to generate institution-level
graduation rates. However, as this report highlights,
the databases that do not provide institution-level
data still provide valuable data that can inform
policy conversations regarding graduation rates. For
organizational clarity, this section is split into two
discussions: databases that can provide institution-
level data and those that cannot.
College graduatioN rates: BeHiNd tHe NumBers 7 amer ican Counc i l on educat ion
Institutional Databases
IPEDSThe Integrated Postsecondary Education Data System
(IPEDS) is a set of interrelated surveys conducted
annually by the U.S. Department of Education’s
NCES. Federal law requires that institutions partici-
pating in federal student aid programs report data
on enrollments, degree completions, graduation
rates, faculty and staff, finances, institutional prices,
and student financial aid. All information collected
through IPEDS is publically available.
The IPEDS system dates back to 1986. Prior
to that time, NCES administered two distinct
institutional surveys to
postsecondary institutions
that were not compatible,
one of which was the
Higher Education General
Information Survey (HEGIS),
which began in 1966.
HEGIS had many of the
same survey components as IPEDS. Although most
accredited colleges and universities submitted data
to HEGIS, participation was not statutorily required.
The second survey, the Vocational Education Data
System (VEDS), was administered to non-collegiate
postsecondary education institutions and collected
data primarily from private, for-profit institutions.
A redesign of these two surveys resulted in a
single survey system—IPEDS—that was designed
to obtain comparable data from all sectors of
postsecondary education. Due in part to the growth
of Title IV financial aid programs in the late 1980s
and early ’90s, the 1992 reauthorization of the
Higher Education Act required all colleges and
universities that receive Title IV funds to submit their
data to IPEDS.
IPEDS’ Graduation Rate Survey (GRS)The enactment of the Student Right-to-Know Act
(SRK) in 1990 signified the beginning of the federal
government’s involvement in collecting graduation
rates from institutions (Gold & Albert, 2006).15 The
federal regulations guiding SRK require institutions
to track a cohort of first-time, full-time, degree- or
certificate-seeking students who enter in the fall of a
given academic year. Additionally, “an institution that
determines its mission includes providing substan-
tial preparation for students to enroll in another eli-
gible institution must prepare the transfer-out rate of
its certificate- or degree-seeking, first-time, full-time
undergraduate students.” Because SRK focuses on
the degree completion of student athletes in relation
to the non-athlete student population, the legislative
language requires this data be collected for both ath-
letes and non-athletes.
The IPEDS GRS survey is the most widely used
and cited data source for graduation rates. Because
these data are frequently used to inform federal
policy decisions, it is critical that policy makers and
education researchers are aware of their benefits and
limitations. The following is an outline of the pros
and cons of using IPEDS GRS.
Advantages
Annual institution-level data collection. IPEDS rep-
resents the only federal collection of data on col-
leges and universities that occurs every year. Annual
collection of graduation rates ensures that data are
available for year-to-year comparisons of trends that
can help inform the policy decisions of higher educa-
tion leaders and state and federal policy makers.
15 Gold, L . & Albert, L . (2006, March) . Graduation rates as a measure of college accountability . American Academic 2(1), 89–106 .
iPeds was designed to obtain comparable data from all sectors of postsecondary education.
College graduatioN rates: BeHiNd tHe NumBers 8 amer ican Counc i l on educat ion
Mandated participation. IPEDS GRS is the only
reporting of graduation rates that is federally
required by law. Because all institutions that receive
Title IV funds participate, the survey captures all
institutional sectors of higher education from elite
private baccalaureate universities to vocational
schools. This broad representation allows research-
ers and policy makers to compare graduation rates
among similar institution types and examine specific
variables that contribute to a graduation rate.
Institutional comparisons. IPEDS is the only compre-
hensive federal database on colleges and universities
that allows for institution-level comparisons of gradua-
tion rates. Policy makers and researchers can combine
these data with other IPEDS data resources, such as
enrollment trends, staffing, instructional expenditures,
and other institutional characteristics to develop an
analysis of institutional differences in graduation rates.
Ability to disaggregate by race and gender. IPEDS
data allow for the disaggregating of graduation rate
data by race and ethnicity as well as gender. This is
critical to tracking the disparities that exist in degree
completion between minorities and whites as well as
between men and women.
DisadvantagesAlthough IPEDS provides a wealth of valuable infor-
mation on colleges and universities, there are several
significant drawbacks to using IPEDS GRS to calcu-
late graduation rates.
GRS cohort. The most discussed issue with the
IPEDS GRS data is who is included in the cohort.
The cohort for calculating graduation rates includes
only first-time, full-time, degree-seeking students.
First-time students are those who have never previ-
ously enrolled at a postsecondary education institu-
tion. The term full-time refers to students who were
taking full course loads in the first semester of their
first year.16 This excludes any student who started
his or her first semester part time or who trans-
ferred from another postsecondary education institu-
tion. Additionally, because most of the GRS cohorts
are based on fall enrollment, students who enroll
mid-semester or in the winter/spring semester are
excluded. These students represent 25 percent and
30 percent of community college and for-profit sector
first-year enrollments, respectively.17
Transfer students are regarded differently in IPEDS
depending on the type of institution from which
they transfer. Associate degree–granting institutions
with the mission to prepare students to transfer to a
baccalaureate institution are allowed to count transfers
who completed the equivalent of a transfer preparatory
program18 as completers. However, students who
Recent Extension in Percent of Normal Time
In the 2008 Higher Education Opportunity Act, a significant change to the IPEDS GRS survey occurred when the benchmarks for determining graduation rates were extended. This means that institutions capture graduation rates not only at the mark of 150 percent of normal time, but also at the 200-percent mark. For example, bache-lor’s-degree completion will be measured after both six and eight years. This will allow the GRS survey to capture more of the students who drop from full time to part time or stop out and take longer than six years to graduate.
The same extension applies to two-year pro-grams at associate degree–granting institutions. Associate-degree completion will be measured after both three and four years. This extension has a significant impact on community colleges because their students are more likely to enroll part time and take longer to finish.
16 If a student begins as a full-time student but drops to part time, that student would still be considered part of the GRS cohort .17 U .S . Department of Education, National Center for Education Statistics, Beginning Postsecondary Students Study, 2003 (analysis by author) .18 A transfer preparatory program is defined in 34 Code of Federal Regulations (CFR) Student Assistance General Provisions, Section 668 .8(b)(1)(ii) as “the
successful completion of at least a two-year program that is acceptable for full credit toward a bachelor’s degree and qualifies a student for admission into the third year of a bachelor’s degree program .” The Secretary considers this the equivalent of an associate degree .
College graduatioN rates: BeHiNd tHe NumBers 9 amer ican Counc i l on educat ion
attend baccalaureate institutions and transfer to another
postsecondary education institution, regardless of
whether it is an associate or baccalaureate institution,
are not tracked and thus are counted as non-completers
for the institution of origin. Consequently, if a student
transfers from a baccalaureate institution to any other
institution and ultimately graduates, that student cannot
be included in the graduation rate of the school from
which he or she graduated because the student was
not part of that institution’s original first-time, full-time
GRS cohort.
Following the institution, not the stu-
dent. Because the purpose of IPEDS
is to provide institutional data to the
federal government, the IPEDS GRS
measures institutional graduation
rates, not student graduation rates,
which is partly why transfer data are
not tracked or reported by baccalau-
reate colleges and universities. What
this means is that IPEDS data provide the gradua-
tion rate of students who start and finish at the same
institution, not a comprehensive graduation rate of
the cohort of students who started at the postsecond-
ary education institution in a given year.
Purpose of GRS. Since its inception, the purpose of
the IPEDS GRS has been to fulfill the requirements
of the SRK legislation. Its statutory language provides
the basis for the GRS methodology. Because scholar-
ship athletes are exclusively full time and are most
often first-time students who rarely transfer, it is logi-
cal to have a comparison group of non-athletes who
represent the same type of student. Today, however,
the GRS survey no longer collects data on scholar-
ship athletes and it is increasingly being used as a
measure of institutional quality. In order for gradua-
tion rates to be an effective measure of institutional
quality, they should account for all students who
enroll in a college or university and are seeking a
degree or certificate.
Despite its statutory origin, it is important to note
that the GRS (as well as all IPEDS surveys) are not
static. NCES uses Technical Review Panels (TRPs)19
to learn how to make IPEDS data more useful for
institutions and policy makers within the limitations
of the legislative language governing the data
collection. NCES convened a TRP in 2007 to explore
ways to revise the GRS, but no action was taken, as
the implementation of mandated changes to IPEDS
as a result of the Higher Education Opportunity
Act of 2008 took precedence over discretionary
changes to the GRS. Policy researchers have
posited numerous ideas for addressing some of the
disadvantages of IPEDS, and among
the most discussed is one advanced
by Clifford Adelman, a former
researcher for the U.S. Department
of Education (see page 28). His idea
calls for modest adjustments to the
current IPEDS model rather than
a complete overhaul of the GRS
survey.
Inability to disaggregate by income. A major issue in
higher education is the disparities in enrollment, per-
sistence, and attainment among low-income students.
IPEDS does not collect income data on students and
therefore does not have the ability to provide gradu-
ation rates by student income.
Implications for Policy MakersAs stated previously, IPEDS is the most frequently
used data for national graduation rates. As the only
database that captures information annually from
every federally funded college and university in the
United States, many policy makers and educational
researchers view it as the best source of data on
postsecondary education institutions. However, as
this overview reveals, several aspects of IPEDS GRS
data make it imperfect for informing policy decisions
related to national graduation rates and institutional
effectiveness.
IPEDS GRS was created to provide data on
graduation rates for student athletes compared with
a similar group of non-scholarship students; in other
19 Technical Review Panels (TRPs) are conducted to solicit peer review and feedback on NCES projects . TRPs are made up of about 40 nationally recognized higher education experts, NCES staff, and staff from other federal agencies .
several aspects of iPeds grs data make it imperfect for informing policy decisions related to national graduation rates and institutional effectiveness.
College graduatioN rates: BeHiNd tHe NumBers 1 0 amer ican Counc i l on educat ion
words, the first-time, full-time population. However,
according to 2008 IPEDS data, the GRS cohort
at baccalaureate institutions accounted for
61 percent of the fall entering class.20 This means
that nearly 40 percent of students entering in the
fall at baccalaureate institutions are not included in
IPEDS GRS. Because this number does not account
for students who enrolled in a semester other than
the fall, students in the GRS cohort actually account
for significantly less than 61 percent of the total
entering class of 2008. Similarly, at associate-degree
schools, the 2008 GRS cohort accounted for only
33 percent of their fall enrollment, but this excludes
students who did not enter in the fall semester,
which is a significant number at community colleges.
Overall, of the 22.5 million students who enrolled in
postsecondary education in 2008, at least 48 percent
were not accounted for in IPEDS GRS.
The share of students who fall outside the
current GRS cohort is likely to increase. According
to BPS data, in fall 1989, 23.9 percent of students
entering postsecondary education began as part-time
students (41.9 percent at community colleges). In
2003, the share of first-year students who were part
time was 27.3 percent (49.3 percent at community
colleges). Similarly, the number of student transfers
that are not tracked in IPEDS has increased (i.e.,
baccalaureate to baccalaureate, associate to associate,
and baccalaureate to associate). BPS data reveal that
among students who entered college in fall 1995,
10.5 percent had engaged in at least one of these
types of transfers within their first three years of
school.21 In fall 2003, 12.1 percent had engaged in
such a transfer by their third year of school.22
If IPEDS GRS was used to establish a national
graduation rate benchmark, at least 48 percent of the
students who entered postsecondary education in
2008 would not be included in the cohort. With such
a large share of students unaccounted for, IPEDS has
limited utility for measuring institutional effectiveness
of graduating students.
National Student ClearinghouseThe National Student Clearinghouse, commonly
referred to as the Clearinghouse, is a non-federal,
independent, nonprofit organization serving the
higher education community by housing a central
repository of student data on enrollment and degree
attainment. Since its inception, the Clearinghouse
has served as the reporting agent between partici-
pating institutions and student loan industry partici-
pants, such as lenders, guaranty agencies, and the
Department of Education. The Clearinghouse pro-
vides data on student enrollment on behalf of the
member institution to the student aid agencies in
order to help determine the student’s deferment or
repayment status.
The Clearinghouse’s role as the reporting agent
is helpful to colleges and universities that would
otherwise have to communicate on a case-by-case
basis with the hundreds
of lenders and banks
that students have used
to receive their student
loans. In recent years,
the Clearinghouse has
expanded its higher
education services.
Along the same lines,
the Clearinghouse provides degree verification
to employers and background-search firms, and
enrollment verification to health insurers and others
that provide services based on enrollment status.
The Clearinghouse also serves as a liaison among
secondary schools and districts and postsecondary
education institutions so that school districts can see
where their graduates are attending college and keep
track of the students’ attendance patterns. Member
institutions can see if college students who have
dropped out have enrolled elsewhere in the country.
20 U .S Department of Education, National Center for Education Statistics . 2008 Integrated Postsecondary Education Data System .21 U .S . Department of Education, National Center for Education Statistics, Beginning Postsecondary Students Study, 1996 (analysis by author) .22 U .S . Department of Education, National Center for Education Statistics, Beginning Postsecondary Students Study, 2003 (analysis by author) .
since its inception, the Clearinghouse has served as the reporting agent between participating institutions and student loan industry participants.
College graduatioN rates: BeHiNd tHe NumBers 1 1 amer ican Counc i l on educat ion
The higher education community values the
Clearinghouse’s services and the administrative
burden that they remove from the institutions’
shoulders. This is evidenced by the current
membership numbering over 3,300 colleges. The
member institutions represent 93 percent of all
students enrolled in postsecondary education.
The Clearinghouse was founded in 1993 as
the National Student Loan Clearinghouse. It was
established in conjunction with several educational
and student financial organizations. It started as a
pilot study using 34 schools, five guarantors, and
14 lenders. Within two years of its creation, the
Clearinghouse captured 25
percent of all postsecondary
enrollment and 60 percent
of student borrowers.
In 1999, the National
Student Clearinghouse
dropped “Loan” from its name to reflect its new
array of services. Around this time, the Department
of Education’s Direct Loan Program became a
Clearinghouse member, expanding the percentage of
student borrowers covered by its services. As of 2009,
the schools that participated in the Clearinghouse
accounted for 93 percent of students enrolled in
postsecondary students and the Clearinghouse had
more than 100 million records in its database.
Calculating a Graduation Rate with Clearinghouse DataBecause Clearinghouse participation transcends
normal geographic boundaries and institutional spon-
sorship designations, Clearinghouse data can be
used to calculate a graduation rate in several ways.
The data can follow all nationwide enrollments in a
particular starting year and see how many students
graduated. With StudentTracker, students can easily
be tracked as they move among higher education
institutions. Using enrollment and degree data, the
Clearinghouse also can work backward to cluster stu-
dents who attended the same institution, and calcu-
late an institutional graduation rate much like IPEDS.
Unlike IPEDS, the Clearinghouse can calculate a
graduation rate for part-time and transfer students,
not just first-time, full-time students.
Advantages
Accurate “real-time” data. The Clearinghouse pres-
ents some unique advantages in calculating gradua-
tion rate, the biggest of which is the updated nature
of the data. Participating institutions send electronic
files with enrollment data to the Clearinghouse every
30 to 40 days. The data are in nearly real time and,
even accounting for time to analyze the data and
complete a formal report, the information will be
more current than NCES’s IPEDS GRS. Because data
submitted to the Clearinghouse also serve a compli-
ance reporting purpose for institutions, the available
data are highly accurate.
Accounts for a majority of students. Schools partici-
pating in the Clearinghouse account for 93 percent
of students enrolled in postsecondary education.
Although it is unclear exactly how many of these stu-
dents are included in the Clearinghouse data, it is
widely believed the graduation rates calculated from
this population include a majority of enrolled stu-
dents: part time, full time, transfers, and stop outs.
For institutions sharing detailed degree information,
the Clearinghouse could provide graduation rates for
students seeking graduate degrees who are generally
not part of the graduation rate conversation. These
rates could be disaggregated by degree type or field
of study in order to understand how long it takes
graduate students in a particular program to finish
their degree.
Flexibility in calculating the graduation rate. Because
the Clearinghouse is not limited to the Student Right-
to-Know graduation rate methodology, there can be
flexibility in how it calculates graduation rates. For
example, the Clearinghouse has the tools to calcu-
late individual graduation rates for different cohorts
of students. These results could be aggregated to
establish a graduation rate for different sectors of
higher education such as community colleges or bac-
calaureate institutions that would include transfers.
By not limiting the population of students to those
who study full time, it would be possible to estab-
lish graduation rates for those who enroll part time.
Additionally, the Clearinghouse can accommodate
the Clearinghouse presents some unique advantages in calculating graduation rate.
College graduatioN rates: BeHiNd tHe NumBers 1 2 amer ican Counc i l on educat ion
institutions establishing their own evaluation periods
for graduation rates. Institutions can calculate grad-
uation rates at the standard 150 percent of time, or
200 percent of time, but have the freedom to go out
as far as necessary to create an encompassing picture
of graduates. With the large amount of data that the
Clearinghouse stores and can access, it has a unique
opportunity to expand the methods for calculating a
graduation rate that potentially can be the most accu-
rate and most useful indicator of how specific groups
of postsecondary students and institutions are faring.
Disadvantages
Data are not publically reported. One significant
drawback to the Clearinghouse data
is that they are not available to the
public. The private organization is
not required to make its database
available to the public, including to
higher education stakeholders and
policy makers. The Clearinghouse
maintains a policy that it can release
information to the public in an
aggregate format as long as the information does not
identify a specific student, institution, or institutional
system.
Participation is voluntary. Because participation in
the Clearinghouse is not federally mandated, insti-
tutions can choose whether to participate. If a
Clearinghouse-calculated graduation rate were to
be used for policy-making purposes, not all schools
would be represented. Additionally, schools must
subscribe to more than one service in order to cal-
culate a graduation rate. Being a participant of the
Clearinghouse’s enrollment verification service but
not its degree completion verification service does
not provide enough data to calculate a graduation
rate. Currently, most participating institutions sub-
scribe to both services so that a graduation rate can
be calculated, but there is no guarantee that a sub-
scription to both services will remain intact over
time, which could impact year-to-year graduation
rates.
Limited demographic data. Although the colleges and
universities that participate in the Clearinghouse do
report demographic data on students (e.g., race/eth-
nicity, gender, class standing, current major, and so
forth), the amount of information is limited. (Similar
to IPEDS, no income data is collected.) Additionally,
much of the reporting of the demographic data to
the Clearinghouse started only within the past three
years, and not all institutions report this data.
Incomplete certificate information. Although the
Clearinghouse can report data on certificate comple-
tion from its participating institutions, not all schools
report this information. Therefore, a comprehensive
picture of certificate completers is not possible. The
Clearinghouse is exploring the possibility of increas-
ing the number of institutions that
report data on certificate earners.
Implications for Policy MakersAmong the databases that can gen-
erate national postsecondary gradu-
ation rates, the Clearinghouse is the
most flexible. The Clearinghouse
is able to calculate a graduation rate for an enter-
ing cohort of students (similar to BPS) as well as an
institutional graduation rate (like IPEDS). In other
words, the Clearinghouse data can inform policy
makers of how the higher education system is doing
in graduating students in general, as well how indi-
vidual institutions fare in graduating students.
Additionally, because the Clearinghouse tracks stu-
dents until they complete their degree program, it is
able to provide data on how many students are still
enrolled beyond six or eight years. This is impor-
tant information because it distinguishes students
who have dropped out or stopped out from those
who have not completed but are still pursuing their
degree, information that is not available in IPEDS.
One additional advantage for policy makers is
the timeliness of the data. Although IPEDS data
tend to lag behind the current year (for example, in
summer 2010, the earliest six-year graduation rate
data available in IPEDS were for students graduating
in 2008), Clearinghouse data are “real time.” That
if a Clearinghouse-calculated graduation rate were to be used for policy-making purposes, not all schools would be represented.
College graduatioN rates: BeHiNd tHe NumBers 1 3 amer ican Counc i l on educat ion
is, data on students graduating in 2010 would be
available in 2010.
Although the flexibility and timeliness of the
Clearinghouse data make them a valuable tool for
policy makers, two major issues supersede that
policy value. First, and most importantly, colleges
and universities are not required to participate.
According to IPEDS in 2008. there were 6,898
postsecondary education institutions that received
federal aid. Although the institutions that participate
in the Clearinghouse account for 93 percent of
all enrolled students, graduation rates can be
calculated only for the approximately 2,642 (or
38 percent of colleges and universities) that submit
degree completion information. This means that
62 percent of postsecondary education institutions
that receive federal funding are not accounted for
in Clearinghouse data. The majority of these are
less-than-two-year, non–degree-granting institutions
with small enrollments. For federal policy makers
interested in institution-level graduation rates,
however, the lack of participation by so many
federally funded institutions would be cause for
concern. This is particularly true for non-degree,
certificate-granting institutions, which currently are
a major focus of Congress and the Department of
Education.
Second, although the Clearinghouse does receive
data on certificates awarded, it does not receive
this information from all institutions. Due in part to
President Obama’s desire to increase U.S. educational
attainment and have every American complete
at least one year of college, sub-baccalaureate
programs, specifically certificate programs, have
become a point of focus for both state and federal
policy makers. Although the Clearinghouse is
exploring the possibility of capturing certificate
completion data from all schools, it currently cannot
provide a comprehensive calculation of certificate
completion.
State Data SystemsAlthough the focus of this report is on databases
that provide national-level graduation rate data, it
is important to acknowledge the potential role that
state databases may play in the national gradua-
tion rate conversation. The increased call for more
accountability of postsecondary education institutions
has spawned talk of a federal student record system
that would track individual students’ educational
performance throughout their academic careers.
This idea gained prominence in 2006 when it was
endorsed by the Secretary of Education’s Commission
on the Future of Higher Education. Supporters of
a so-called national unit record system believe it is
the only way to obtain accurate graduation rate data
because it would track students regardless of when
they start their postsecondary education or where
they finish. Critics argue that the reporting require-
ments would violate student privacy, and that states
already collect sufficient information from colleges
and universities to cal-
culate graduation rates
and other educational
outcomes.
In the 2008 Higher
Education Opportunity
Act (HEOA), Congress
included a provision that
prohibited the development of a federal student
unit record system, thus eliminating the possibility
of such a database without a change in the law.
However, the HEOA specifically states that there was
no federal prohibition on “a state or consortium of
states from developing, implementing, or maintaining
state-developed databases that track students over
time, including student unit record systems.”
Because of the reporting requirements for the
primary federal elementary-secondary education
legislation, No Child Left Behind, most states have at
least begun the process of developing state databases
to track individual students’ progress through state
K–12 education systems. In an effort to encourage
states to continue developing these databases (and
possibly link them to create a national nonfederal
database), the Obama administration has established
financial incentives for states to develop robust
unit record systems that include postsecondary
education. The best-known example is Race to
the Top, a $4.3 billion competitive grant initiative
designed to spur systemic reform and innovative
the increased call for more accountability of postsecondary education institutions has spawned talk of a federal student record system.
College graduatioN rates: BeHiNd tHe NumBers 1 4 amer ican Counc i l on educat ion
approaches to teaching and learning in America’s
schools. One of the criteria for qualifying for funding
is “fully implementing a statewide longitudinal data
system.” In addition to Race to the Top, the federal
government has provided $506 million since 2005 to
the Statewide Longitudinal Data System program at
the Institute for Education Sciences to promote the
development of state data systems.
In addition to the encouragement from the
Obama administration, several foundations and non-
profit organizations are assisting states to develop
comprehensive unit record systems. A 2010 report
by the State Higher Education Executive Officers
(SHEEO)23 took inventory of how many states have
student record databases, how many of them link
with other data, and how the data are used. The
report found that 45 states have
unit record systems that cover post-
secondary education institutions.
A 2007 report funded by Lumina
Foundation found that state data-
bases account for 81 percent of the
total enrollment in U.S. colleges and
universities. Among these states, the
databases are commonly used to cal-
culate postsecondary graduation rates.
Also of note is the Common Data Standards (CDS)
Initiative, funded jointly by the U.S. Department
of Education (which is funding the development
of the standards) and the Bill and Melinda Gates
Foundation (which is funding the communica-
tion and adoption of the standards, along with
SHEEO and the Council of Chief State School
Superintendents). The purpose of the CDS is to
develop a model of data standards for K–12 and
postsecondary education. One of the more spe-
cific CDS goals is to identify a list of key K–12-to-
postsecondary variables (including graduation rates)
and “agree upon standard definitions, code sets,
business rules, and technical specifications for those
variables to increase data interoperability, portability,
and comparability across states, districts, and higher
education organizations.”
Advantages
Accurate state-level graduation rates. Because state-
level data are collected at the student level (like the
NCES sample surveys and the Clearinghouse), more
comprehensive graduation rates can be calculated.
Additionally, because an increasing number of state
databases are following students’ activities beyond
graduation, state databases are not limited to a five-
or six-year graduation rate and can calculate gradu-
ation rates based on what makes the most sense for
their states.
Context for students. In addition to being able to cal-
culate accurate graduation rates at the student and
institutional levels (at least for public institutions),
state data systems can provide impor-
tant contextual information on stu-
dents to better understand graduation
rates. For example, among the data
elements the DQC considers essen-
tial to developing a comprehensive
longitudinal data system are eco-
nomic status; and transcript data that
includes items such as rigor of K–12
curricula, standardized test data, and teacher prepa-
ration data. These data will provide a better sense
of the many pre-collegiate factors that can affect
whether a student will complete his or her degree.
Disadvantages
Limited coverage of private nonprofit and for-profit
institutions. While state data systems can provide a
wealth of information on public institutions, they
typically have very little information on private insti-
tutions. An increasing number of private institutions
are moving toward participating in state databases;
however, they may not participate in all aspects of
the database. For example, enrollment data may
include only state residents who receive state finan-
cial aid. Although this is less of an issue for states
several foundations and nonprofit organizations are assisting states to develop comprehensive unit record systems.
23 Garcia, T ., L’Orange, H ., (2010) . Strong foundations: The state of postsecondary data systems . Boulder, CO: State Higher Education Executive Officers .
College graduatioN rates: BeHiNd tHe NumBers 1 5 amer ican Counc i l on educat ion
such as Wyoming, where private institutions account
for slightly more than 30 percent of colleges and uni-
versities in the state, in states such as Massachusetts
(where 80 percent of postsecondary education insti-
tutions are private), this would be problematic.
Tracking students out of state. Nationally, 12 per-
cent of students attend college out of state (National
Postsecondary Student Aid Study [NPSAS], 2008).
Only eight of the 45 states with a unit record system
have the ability to track students across state lines
(Garcia and L’Orange, 2010). According to resi-
dency and migration data from IPEDS, states rang-
ing in size of student population from Alaska and
Connecticut to California and Texas have more out-
of-state students enrolled among their first-year
classes than in-state resi-
dents. This includes stu-
dents who may have
started their postsecond-
ary education in state but
then transferred to college
or university out of state. Without the ability to link
to databases in other states, students who enroll in
postsecondary education out of state would be lost
in a state data system.
Good state-level data, but hard to aggregate to a
national level. Because few states have yet to link
their data with other states, there currently is no way
to aggregate data from the current state databases
into a national graduation rate. Part of the chal-
lenge in linking state databases is establishing con-
sistent definitions for data elements across all states.
Without common data definitions, it will be impos-
sible to compare graduation rates among states.
Organizations like the DQC are working with states
to help create these standard definitions.
Implications for Policy MakersFor state policy makers, comprehensive state unit–
record data systems are more valuable than any
existing national database. Being able to track stu-
dents’ educational activities from kindergarten into
the workforce allows for more targeted policy deci-
sions around increasing state graduation rates. At the
federal level, however, state data systems currently
have little to no value.
Despite the numerous initiatives and organizations
hard at work to develop common data standards
and definitions across all 50 states, very few states
have similar-enough data systems to compare
student outcomes. Until common data standards are
developed among states, it will be difficult for states
to have comprehensive data on students who leave
their boundaries for any portion of their education.
Additionally, private institutions, particularly in the
for-profit sector, have been slow to participate in the
state data systems. Inclusion of the private sector is
essential for a comprehensive database of students’
educational experiences.
If at some point all 50 states develop common
data definitions and standards that allow for national
comparisons, these systems could be valuable tools
to better understand where federal resources are best
allocated to improve both postsecondary education
graduation rates as well as U.S. educational
attainment.
Very few states have similar-enough data systems to compare student outcomes.
College graduatioN rates: BeHiNd tHe NumBers 1 6 amer ican Counc i l on educat ion
Non-institutional Databases
Beginning Postsecondary Students (BPS) StudyThe Beginning Postsecondary Student (BPS) Study
is another survey from NCES that follows a cohort
of students who enroll in postsecondary education
for the first time. The study collects data on student
persistence in college, transitions to the workforce,
demographic characteristics, and changes over time
in the students’ goals, marital status, income, and
debt.24 Because BPS follows students over a six-year
period, it can be used to calculate a graduation rate
that is nationally representative of col-
lege students. In addition to graduation
rates, BPS data can answer questions
such as why students leave school,
how financial aid influences persis-
tence and completion, and what per-
centages of students complete various
degree programs.
BPS is a sample survey, meaning
that it captures a sample of entering
undergraduate students that are demonstrative of
the national student body. BPS draws its initial
cohorts from NPSAS, which uses a large, nationally
representative sample of postsecondary students and
institutions to examine how students pay for college.
For the most recent BPS (2004), 19,000 students
were included in the sample. BPS conducts follow-up
interviews two and five years after the students’
entrance into college.
With the establishment of IPEDS, a national
source of information on enrollments and
completions in postsecondary education existed.
However, during the mid-1980s, as Title IV
financial aid programs were expanding along with
a concern about how students were financing their
postsecondary education, it was clear that IPEDS
could not provide the information on participation
in financial aid programs that the Department of
Education needed. After much deliberation between
the Office of Management and Budget and NCES,
it was concluded that the only way to obtain
reasonable data in these areas would be to survey
students enrolled in postsecondary education. This
led to the development of NPSAS in 1984, the
cross-sectional survey from which the BPS cohort
is derived. However, it became clear from the first
wave of NPSAS that students in postsecondary
education were not solely individuals who made the
immediate transition from high school to college,
but were a much more heterogeneous
group.
As a result, it became obvious that
NCES longitudinal studies of high
school cohorts were not sufficient to
study such topics as persistence and
completion in postsecondary education.
Because NPSAS sampled students at
all levels of postsecondary education—
from freshmen to graduate and first-
professional students—it was the natural vehicle
for identifying a sample of first-time beginning
postsecondary students who could be followed
as they persisted and completed postsecondary
education and went into the workforce or graduate
school. This led to the development of BPS. Although
students are not obligated to participate in NPSAS,
NCES is required by law to conduct NPSAS and
disseminate the findings at least every four years.
Advantages
Follows the student, not the institution. The main
advantage of using BPS to calculate a graduation
rate is that it follows the student, not the institu-
24 See the BPS web site at http://nces .ed .gov/surveys/bps/about .asp .
Because BPs follows students over a six-year period, it can be used to calculate a graduation rate that is nationally representative of college students.
College graduatioN rates: BeHiNd tHe NumBers 1 7 amer ican Counc i l on educat ion
tion. Therefore, the survey will track a sample of all
types of students who enter college in a given year:
part-time students, students who transfer as well
as students who stop out, and those who co-enroll.
By following the student, BPS measures the rate at
which students graduate as opposed to the rate at
which institutions graduate students.
BPS also accounts for those students who have
not yet attained a degree but are still enrolled.
According to the 1996 BPS, 14 percent of degree-
seeking students were still enrolled after six years.
Accounting for students who are still enrolled is
valuable because their persistence indicates that
those students are still making progress toward
completing a degree.
Provides contextual information for graduation rates.
The BPS student participants were surveyed over the
web, by phone, and in some cases in person. These
research methods yield personal, self-reported data
that IPEDS and other sur-
veys cannot capture. For
example, among some of
the information contained
in BPS is race/ethnicity,
gender, and income data,
as well as frequency of stop
outs and transfers, current
employment situations, remedial courses taken, and
educational goals. This makes BPS a dataset that not
only allows the calculation of a graduation and per-
sistence rate, but also provides researchers with con-
textual data that allows for predicting graduation
rates for populations like minority and low-income
students. These data are extremely valuable, particu-
larly when using persistence and degree completion
as a measure of institutional quality. Having con-
textual data on factors that affect a student’s ability
to complete a degree program allows institutions to
create programming to address the issues most com-
monly associated with students dropping or stopping
out.
Disadvantages
Age and frequency of the data. A complex longi-
tudinal study such as BPS brings with it an inher-
ent complexity, primarily the time that it takes to
track students and make the data readily available to
the public. Because BPS starts a new cohort every
seven to eight years, the lapse between cohorts can
be a considerable amount of time. This means that
it takes longer to understand the trends in gradua-
tion rates, and once trends can be developed, there
remains a question of relevance. For example, the
cohort that started college in 2004 was interviewed
in 2006 and again in 2009. Results from the 2009 col-
lection may not be released until 2011. If a higher
education professional or policy maker in 2010
wanted to know the most up-to-date graduation rate
using BPS, he would have to go back to a previ-
ous cohort who entered college in 1996 and whose
last interview was in 2001, thus providing a gradua-
tion rate that is nearly a decade old and not neces-
sarily reflective of today’s higher education student
demographics, enrollment, and completion patterns.
The dated nature of these data is largely a function
of most longitudinal studies. Because longitudinal
studies “mature” over time, conditions present at the
start of the study could change, making the data less
relevant.
No state or institutional data. Because BPS is a
student-focused sample survey, it does not provide
institution-level data. It provides data on students
only at an aggregate level, such as data on stu-
dents at particular types of institutions. Additionally,
it does not provide state-level data. This is due to
a relatively small sample size that does not allow
for state-level comparisons. NCES has explored
the possibility of expanding the sample to allow
for state-level analysis, but has deemed it too cost
prohibitive.
Implications for Policy MakersBPS can be a valuable tool for policy makers
because, unlike IPEDS, it measures how success-
ful students are at completing a degree (within six
BPs can be a valuable tool for policy makers because, unlike iPeds, it measures how successful students are at completing a degree.
College graduatioN rates: BeHiNd tHe NumBers 1 8 amer ican Counc i l on educat ion
years) regardless of how many institutions they
attend. As the example cited earlier in the report
reveals, the IPEDS institutional graduation rate for
students entering a baccalaureate institution in 1995
was 56 percent, while the BPS student graduation
rate for the same cohort was 66 percent. This dis-
parity suggests that although institution-level data
may be important for accountability purposes, policy
makers should not lose sight of how students are
faring in the system of higher education as a whole.
Because BPS studies launch only once every
eight years, policy makers and researchers often
lack current BPS data. With sources like IPEDS
available on an annual basis, BPS, despite the rich
detail it provides, is used much less frequently to
inform policy decisions. However, the gap between
BPS data collections should not be a deterrent
for policy makers. Graduation rates, whether
measuring an institution or following a student, do
not change much even during a five- to seven-year
period. IPEDS shows the six-year graduation rate
of baccalaureate schools for students completing
in fall 1997 as 54.3 percent. The graduation rate
for students five years later in the 2002 cohort
was 55.9 percent. Likewise, BPS shows the five-
year graduation rate for students graduating from
a baccalaureate institution in 1994 as 51 percent,
compared with a graduation rate of 53 percent for a
similar group of students in 2001. These data suggest
that despite the gap in data collection for BPS, it can
still be a useful resource for policy makers.
National School-to-College Longitudinal StudiesOther longitudinal surveys from NCES include the
National Longitudinal Survey (NLS), High School and
Beyond (HS&B), National Education Longitudinal
Study (NELS), Education Longitudinal Study (ELS),
and High School Longitudinal Study (HSLS) surveys.
These surveys are grouped together because of their
similarities in following cohorts of K–12 students
through their postsecondary and workforce transi-
tions after high school. The cohorts for these studies
are nationally representative samples of eighth grade
and high school students. These databases differ
from BPS in that in addition to calculating a tradi-
tional graduation rate, they also can also be used to
examine what percentage of high school graduates in
a given year have earned a college degree a certain
number of years after high school graduation.
The NLS survey was conducted in 1972 and
followed high school seniors for 14 years until 1986.
A similar survey, NELS started a cohort in 1988 and
followed eighth grade students for 12 years, until
2000. Both the NLS and NELS cohorts surveyed not
only the students, but also the students’ teachers,
parents, and school administrators to provide an
accurate picture of the
students. Postsecondary
transcript data were
collected for those
students who attended a
postsecondary education
institution. In the middle
of NLS and NELS was
the HS&B study. HS&B was launched in 1980 and
followed high school seniors and sophomores
for seven and 12 years, respectively, not only to
document postsecondary education attainment, but
also to gain insight on family formation and career
and work outcomes.
The ELS survey is more recent than NELS, and
was launched in 2001 with a cohort of high school
sophomores. It is scheduled to run through at least
2012 and as late as 2016 or 2018, depending upon
funding. The ELS survey is designed to answer
more policy-based questions than NELS. ELS seeks
to answer questions of school attributes associated
with student achievement, factors that influence
high school dropouts, and the transition from high
school to postsecondary education or the workforce
disaggregated by race, ethnicity, gender, and
socioeconomic status. ELS will also examine home
educational support systems, school and classroom
characteristics, postsecondary education choice, and
high school outcomes. Like NLS, HS&B, and NELS,
the ELS survey will be able to calculate a graduation
rate through the use of transcript data.
The most recent secondary education survey is
the HSLS. This survey began with its first cohort of
Both the Nls and Nels cohorts surveyed not only the students, but also the students’ teachers, parents, and school administrators.
College graduatioN rates: BeHiNd tHe NumBers 1 9 amer ican Counc i l on educat ion
nationally representative ninth graders in 2009 and
will follow up with the group in 2012 when the
sample reaches 11th grade. After students graduate
high school, they will be interviewed in 2015 to
survey their opinions about their postsecondary
experiences, and again in 2021 to learn their
opinions about their adulthood decisions and
careers. HSLS has focused its survey questions on
three particular research areas: (1) math and science
course-taking patterns in high school, and STEM
participation in college; (2) the student experience
in secondary education; and (3) postsecondary
education decisions made by students and parents.
In addition to surveying students, HSLS also will
survey students’ parents, school administrators,
math and science teachers, and school counselors.
Transcript data will be used to track postsecondary
participation and graduation rates.
Advantages
Uses transcript data. The strategy of using transcript
data to calculate a graduation rate for the cohort is
advantageous for some of the same reasons inherent
to the BPS: Transcripts follow the student and will
capture any transfers between institutions and any
periods of varying enrollment, whether full time, part
time, or a period of stopping out.
Provides pre-postsecondary data. Although BPS does
provide some information on a select number of
high school experiences, the school-to-college stud-
ies provide much more detailed information on the
educational and social experiences of students prior
to postsecondary enrollment. In particular, NELS:88
followed students for 12 years beginning when
they were in eighth grade. This type of data allows
researchers to better understand the many pre-col-
lege factors that affect student enrollment, persis-
tence, and degree completion at the postsecondary
level.
Disadvantages
NELS is extremely dated, ELS and HSLS are not avail-
able yet. The disadvantage of NLS, HS&B, and NELS
for graduation rates is clear: The data are simply too
old to use for shaping today’s policies around gradu-
ation rates. They can provide graduation rates only
for cohorts ending in 1984, 1993, and 2000. New
graduation rates from the other surveys cannot be
calculated for a number of years, leaving a large gap
between what was known about graduation rates in
2000 and what we want to know about today’s col-
lege student. ELS would provide the most up-to-date
graduation rate data, but the survey is still underway
and will not calculate a graduation rate for its cohort
until the third follow up in 2012 (scheduled to be
released to the public one year later). HSLS will not
provide a college graduation rate until several years
after the second follow up in 2015.
Longitudinal surveys such as BPS, NLS, HS&B,
NELS, ELS, and HSLS use inclusive and accurate
methods for calculating
a graduation rate.
The downside is that
the age of the data is
compromised when the
method is most accurate.
Following students is
an expensive and time-
consuming process. Not
only do researchers have to wait for the passing of
time, but they also need time to run their analyses
and to study the results at the end of the survey.
Again, this creates large gaps in time when the
most current graduation rate data are too old, and
knowing the upcoming rates is still years away.
Age (not event) cohort. Unlike BPS, which uses a
cohort built around students entering postsecond-
ary education for the first time in a given year (or
an event cohort), the school-to-college studies are
based on an age cohort. That is, the cohort is built
around students who are in a specific grade and thus
are all around the same age. Such a cohort would
not account for the increasing number of college stu-
dents who are not recent high school graduates.
the disadvantage of Nls, Hs&B, and Nels for graduation rates is clear: the data are simply too old to use for shaping today’s policies.
College graduatioN rates: BeHiNd tHe NumBers 2 0 amer ican Counc i l on educat ion
Implications for Policy MakersThe school-to-college longitudinal studies contain
the most comprehensive and informative data on the
pre-college characteristics and experiences of tradi-
tional-aged college students. Although college grad-
uation rates are a relevant measure of institutional
success, the factors that influence a student’s abil-
ity to complete a college degree successfully are not
limited to those that occur during his or her postsec-
ondary education. To improve postsecondary degree
completion, a better understanding of prior educa-
tional, familial, and social experiences is necessary.
Unfortunately, studies such as the school-to-
college longitudinal studies are complex and costly.
As a result, they are not done frequently. The most
recent graduation rate data currently available from
these studies are nearly a decade old. And while
graduation rates may not change much during a
10-year period as discussed earlier, the pre-college
factors that affect those graduation rates may change.
Although this is an extremely rich source of data on
the many factors that affect postsecondary outcomes,
because of the age of some of the data, many of the
variables have an extremely short shelf life. They
also exclude the large and important population of
adult learners who do not proceed directly from high
school to college. As a result, policy makers may
find relying on these data to inform policy decisions
to be problematic.
College graduatioN rates: BeHiNd tHe NumBers 2 1 amer ican Counc i l on educat ion
Discussion
As stated previously, graduation rates are increas-
ingly becoming a significant part of the account-
ability conversation on postsecondary education
institutions. As this report reveals, there are numer-
ous databases from which to calculate national grad-
uation rates; however, as this report also highlights,
no single database can calculate annual, comprehen-
sive graduation rates for all institutions and/or stu-
dents enrolled in postsecondary education. In fact,
the database used most frequently to calculate gradu-
ation rates, IPEDS GRS, not only does not calculate
a student-focused graduation rate, but also calculates
institutional graduation rates that exclude at least 48
percent of enrolled students.
As a result, IPEDS GRS is frequently criticized
as an incomplete source of data. In
fact, the Spellings Commission, in
commenting on higher education’s
ability to capture reliable graduation
rate data, cited the current crop of
databases as “limited and inadequate.”
While this characterization of IPEDS
GRS and the other databases detailed
in this publication are shared by many
in the higher education community, it is important
to realize that many of these databases, particularly
IPEDS GRS, do exactly what they were designed to
do. For IPEDS GRS, that purpose was to provide the
graduation rates for a population of students that can
be compared behaviorally with scholarship athletes.
Although the current crop of databases used
to calculate graduation rates were not designed
with current policy demands in mind and vary in
their ability to account for the changing enrollment
patterns and demographics of students, this does
not render them useless. As this report details, each
of these databases provides valuable information on
graduation rates. However, as the disadvantages of
these databases indicate, these data should be used
carefully as a measure of the overall productivity of
postsecondary education institutions. For example,
using one of them individually to measure an
institution’s graduation rate against an established
national benchmark may not accurately portray the
quality or effectiveness of the institution.
As stated at the beginning of the report, our
purpose is not to recommend ways to fix the
existing databases or to suggest how to develop
a new one-stop, comprehensive source of data
for graduation rates. However, as policy makers
continue their efforts to measure the quality of
postsecondary education institutions, we offer the
following suggestions of factors to consider before
using graduation rates as a high-stakes accountability
metric.
Institutional DiversityWhile institutional missions are
reported to IPEDS, no other data-
base provides this contextual infor-
mation. Conversely, sample surveys
such as BPS and the national school-
to-college longitudinal studies are
the only databases that provide stu-
dent background information (e.g.,
parents’ education, family income, and high school
GPA). Unfortunately, these data are not available
at the institutional level. Student outcomes, particu-
larly graduation rates, should be viewed within the
context of institutional mission and student demo-
graphics. According to IPEDS, in 2008, 54 percent of
baccalaureate schools (or 1,481 institutions) admitted
at least half of the students that applied for admis-
sion. These less-selective institutions frequently have
a mission to serve low-income and other education-
ally disadvantaged populations. Consequently, they
are less likely to have graduation rates comparable to
more-selective institutions that enroll students with
better academic preparation. Creating one national
graduation benchmark for all institutions (or even
one for each sector) not only places less selective
No single database can calculate annual, comprehensive graduation rates for all institutions and/or students enrolled in postsecondary education.
College graduatioN rates: BeHiNd tHe NumBers 2 2 amer ican Counc i l on educat ion
schools at a significant disadvantage but also may
force many of them to modify their open admission
policies.
Account for Students Still on Track to GraduateIn most discussions of college completions, gradu-
ation rates are treated as a dichotomous measure.
That is, if a school has a graduation rate of 64 per-
cent, the implication is that 36 percent dropped out.
This is, of course, not true. Because most graduation
rates are calculated within a six-year window, there
are students who are still enrolled but have not grad-
uated within the six-year timeframe. According to the
2003 BPS, among degree-seeking students at bacca-
laureate institutions, 14 percent were still enrolled
after six years. With an increasing number of stu-
dents taking longer to graduate (NELS data indicate
the average time to degree is nearly six years), it is
important to not only look at what percent of stu-
dents graduate in a six- (or eight-) year period, but
also account for what percent of students are still on
track to complete a degree program.
Alternative Measures to Graduation RatesThere has been an increasing amount of attention
given to alternatives to graduation rates as mea-
sures of institutional success. One of the more popu-
lar alternatives is the ratio of degrees and certificates
produced per 100 students enrolled. While not a
cohort measure of graduation rates, the degree-to-
enrollment ratio (DER) can answer an important
question: As postsecondary education enrollments
have increased, have these enrollments translated
into commensurate growth in degrees conferred?
Unlike graduation rates, the DER provides valuable
information on both enrollment trends as well as
completion trends. This measure is gaining popular-
ity as it has been used in the American Council on
Education’s Minorities in Higher Education Status
Report25 as well as the Delta Cost Project’s Trends in
College Spending.26
Expand the Focus Beyond Undergraduate EducationOne of the reasons for the federal government’s
increased calls for more institutional accountability
is the increasing amount of federal dollars going to
postsecondary education. Interestingly, the account-
ability conversation has focused almost exclusively
on undergraduate education. Although a significant
amount of federal dollars are spent on graduate edu-
cation, there is currently no federal database that
allows for the calculation of a cohort-based gradua-
tion rate for graduate education.
25 Ryu, M . (2008) . Minorities in higher education 2008: Twenty-third status report. Washington, DC: American Council on Education .26 Desrochers, D ., Lenihan, C ., & Wellman, J . (2010) . Trends in college spending 1998–2008: Where does the money come from? Where does it go?
What does it buy? Washington, DC: Delta Cost Project .
College graduatioN rates: BeHiNd tHe NumBers 2 3 amer ican Counc i l on educat ion
Conclusion
The aforementioned suggestions represent factors that would be present in the perfect database for calculat-
ing graduation rates. Unfortunately, that database does not exist. Because of the importance of these fac-
tors to truly assessing the effectiveness of an institution at graduating its students, using any of the databases
mentioned in this report individually may paint an incomplete picture of institutional quality. Conversely,
because all these factors are present in at least one of the existing national databases, using them together can
provide a more complete understanding of the effectiveness of postsecondary education institutions at retain-
ing and graduating students.
This report has illustrated the complexities of measuring what many policy makers view as a simple
compliance metric of institutional accountability with the existing national databases. While these databases
are not intended to and cannot fully meet the pressing policy demand for institutional accountability
measures, they are useful in helping inform policy decisions.
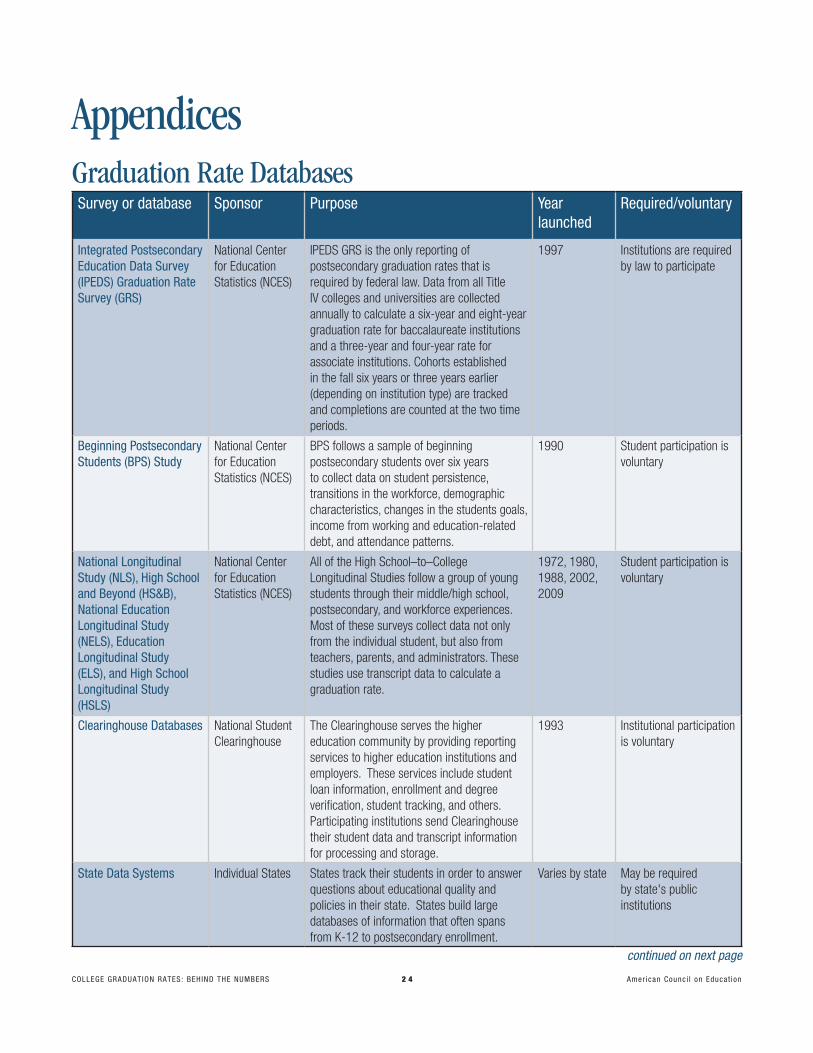
College graduatioN rates: BeHiNd tHe NumBers 2 4 amer ican Counc i l on educat ion
Appendices
continued on next page
survey or database sponsor Purpose Year launched
required/voluntary
integrated Postsecondary education data survey (iPeds) graduation rate survey (grs)
National Center for Education Statistics (NCES)
IPEDS GRS is the only reporting of postsecondary graduation rates that is required by federal law . Data from all Title IV colleges and universities are collected annually to calculate a six-year and eight-year graduation rate for baccalaureate institutions and a three-year and four-year rate for associate institutions . Cohorts established in the fall six years or three years earlier (depending on institution type) are tracked and completions are counted at the two time periods .
1997 Institutions are required by law to participate
Beginning Postsecondary students (BPs) study
National Center for Education Statistics (NCES)
BPS follows a sample of beginning postsecondary students over six years to collect data on student persistence, transitions in the workforce, demographic characteristics, changes in the students goals, income from working and education-related debt, and attendance patterns .
1990 Student participation is voluntary
National longitudinal study (Nls), High school and Beyond (Hs&B), National education longitudinal study (Nels), education longitudinal study (els), and High school longitudinal study (Hsls)
National Center for Education Statistics (NCES)
All of the High School–to–College Longitudinal Studies follow a group of young students through their middle/high school, postsecondary, and workforce experiences . Most of these surveys collect data not only from the individual student, but also from teachers, parents, and administrators . These studies use transcript data to calculate a graduation rate .
1972, 1980, 1988, 2002, 2009
Student participation is voluntary
Clearinghouse databases National Student Clearinghouse
The Clearinghouse serves the higher education community by providing reporting services to higher education institutions and employers . These services include student loan information, enrollment and degree verification, student tracking, and others . Participating institutions send Clearinghouse their student data and transcript information for processing and storage .
1993 Institutional participation is voluntary
state data systems Individual States States track their students in order to answer questions about educational quality and policies in their state . States build large databases of information that often spans from K-12 to postsecondary enrollment .
Varies by state May be required by state's public institutions
Graduation Rate Databases
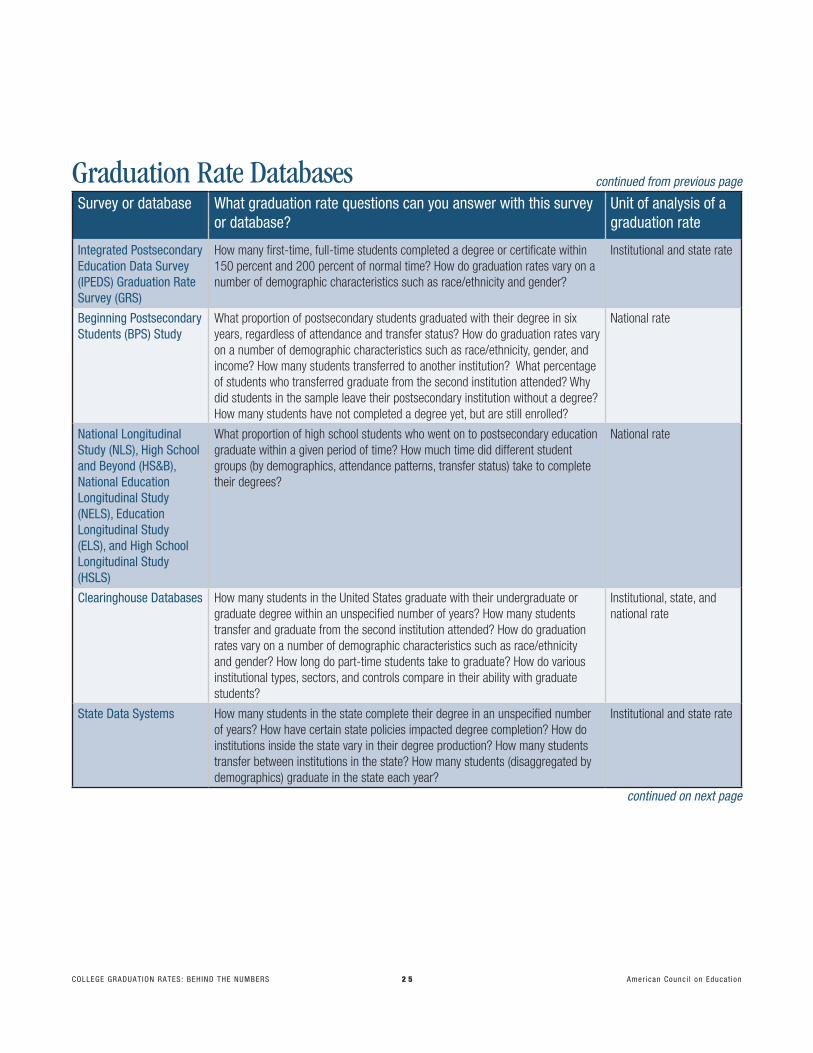
College graduatioN rates: BeHiNd tHe NumBers 2 5 amer ican Counc i l on educat ion
continued on next page
continued from previous page
survey or database What graduation rate questions can you answer with this survey or database?
unit of analysis of a graduation rate
integrated Postsecondary education data survey (iPeds) graduation rate survey (grs)
How many first-time, full-time students completed a degree or certificate within 150 percent and 200 percent of normal time? How do graduation rates vary on a number of demographic characteristics such as race/ethnicity and gender?
Institutional and state rate
Beginning Postsecondary students (BPs) study
What proportion of postsecondary students graduated with their degree in six years, regardless of attendance and transfer status? How do graduation rates vary on a number of demographic characteristics such as race/ethnicity, gender, and income? How many students transferred to another institution? What percentage of students who transferred graduate from the second institution attended? Why did students in the sample leave their postsecondary institution without a degree? How many students have not completed a degree yet, but are still enrolled?
National rate
National longitudinal study (Nls), High school and Beyond (Hs&B), National education longitudinal study (Nels), education longitudinal study (els), and High school longitudinal study (Hsls)
What proportion of high school students who went on to postsecondary education graduate within a given period of time? How much time did different student groups (by demographics, attendance patterns, transfer status) take to complete their degrees?
National rate
Clearinghouse databases How many students in the United States graduate with their undergraduate or graduate degree within an unspecified number of years? How many students transfer and graduate from the second institution attended? How do graduation rates vary on a number of demographic characteristics such as race/ethnicity and gender? How long do part-time students take to graduate? How do various institutional types, sectors, and controls compare in their ability with graduate students?
Institutional, state, and national rate
state data systems How many students in the state complete their degree in an unspecified number of years? How have certain state policies impacted degree completion? How do institutions inside the state vary in their degree production? How many students transfer between institutions in the state? How many students (disaggregated by demographics) graduate in the state each year?
Institutional and state rate
Graduation Rate Databases
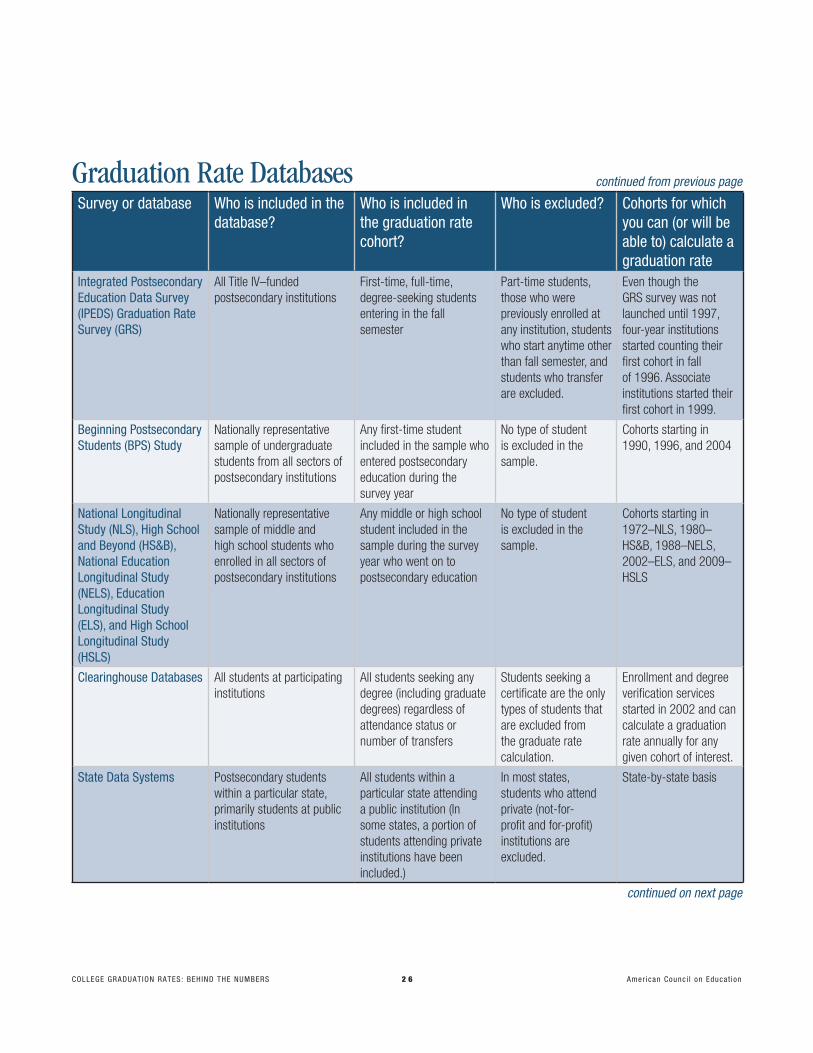
College graduatioN rates: BeHiNd tHe NumBers 2 6 amer ican Counc i l on educat ion
survey or database Who is included in the database?
Who is included in the graduation rate cohort?
Who is excluded? Cohorts for which you can (or will be able to) calculate a graduation rate
integrated Postsecondary education data survey (iPeds) graduation rate survey (grs)
All Title IV–funded postsecondary institutions
First-time, full-time, degree-seeking students entering in the fall semester
Part-time students, those who were previously enrolled at any institution, students who start anytime other than fall semester, and students who transfer are excluded .
Even though the GRS survey was not launched until 1997, four-year institutions started counting their first cohort in fall of 1996 . Associate institutions started their first cohort in 1999 .
Beginning Postsecondary students (BPs) study
Nationally representative sample of undergraduate students from all sectors of postsecondary institutions
Any first-time student included in the sample who entered postsecondary education during the survey year
No type of student is excluded in the sample .
Cohorts starting in 1990, 1996, and 2004
National longitudinal study (Nls), High school and Beyond (Hs&B), National education longitudinal study (Nels), education longitudinal study (els), and High school longitudinal study (Hsls)
Nationally representative sample of middle and high school students who enrolled in all sectors of postsecondary institutions
Any middle or high school student included in the sample during the survey year who went on to postsecondary education
No type of student is excluded in the sample .
Cohorts starting in 1972–NLS, 1980–HS&B, 1988–NELS, 2002–ELS, and 2009–HSLS
Clearinghouse databases All students at participating institutions
All students seeking any degree (including graduate degrees) regardless of attendance status or number of transfers
Students seeking a certificate are the only types of students that are excluded from the graduate rate calculation .
Enrollment and degree verification services started in 2002 and can calculate a graduation rate annually for any given cohort of interest .
state data systems Postsecondary students within a particular state, primarily students at public institutions
All students within a particular state attending a public institution (In some states, a portion of students attending private institutions have been included .)
In most states, students who attend private (not-for-profit and for-profit) institutions are excluded .
State-by-state basis
Graduation Rate Databases
continued on next page
continued from previous page
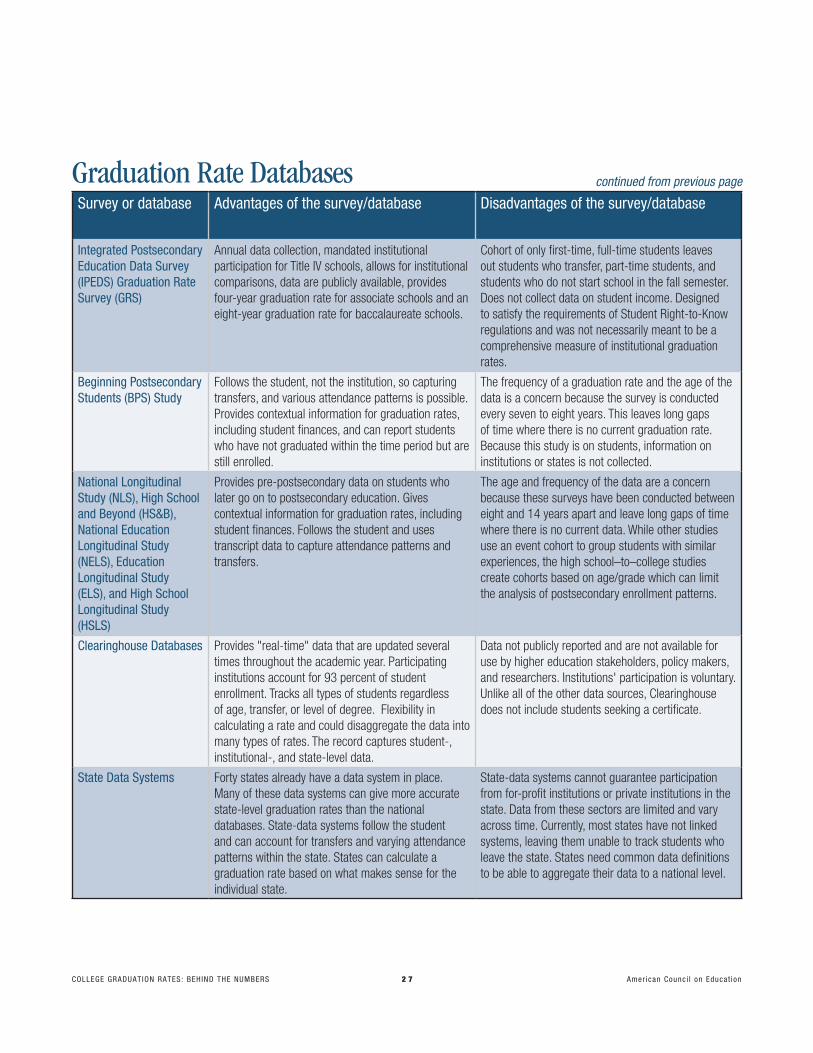
College graduatioN rates: BeHiNd tHe NumBers 2 7 amer ican Counc i l on educat ion
survey or database advantages of the survey/database disadvantages of the survey/database
integrated Postsecondary education data survey (iPeds) graduation rate survey (grs)
Annual data collection, mandated institutional participation for Title IV schools, allows for institutional comparisons, data are publicly available, provides four-year graduation rate for associate schools and an eight-year graduation rate for baccalaureate schools .
Cohort of only first-time, full-time students leaves out students who transfer, part-time students, and students who do not start school in the fall semester . Does not collect data on student income . Designed to satisfy the requirements of Student Right-to-Know regulations and was not necessarily meant to be a comprehensive measure of institutional graduation rates .
Beginning Postsecondary students (BPs) study
Follows the student, not the institution, so capturing transfers, and various attendance patterns is possible . Provides contextual information for graduation rates, including student finances, and can report students who have not graduated within the time period but are still enrolled .
The frequency of a graduation rate and the age of the data is a concern because the survey is conducted every seven to eight years . This leaves long gaps of time where there is no current graduation rate . Because this study is on students, information on institutions or states is not collected .
National longitudinal study (Nls), High school and Beyond (Hs&B), National education longitudinal study (Nels), education longitudinal study (els), and High school longitudinal study (Hsls)
Provides pre-postsecondary data on students who later go on to postsecondary education . Gives contextual information for graduation rates, including student finances . Follows the student and uses transcript data to capture attendance patterns and transfers .
The age and frequency of the data are a concern because these surveys have been conducted between eight and 14 years apart and leave long gaps of time where there is no current data . While other studies use an event cohort to group students with similar experiences, the high school–to–college studies create cohorts based on age/grade which can limit the analysis of postsecondary enrollment patterns .
Clearinghouse databases Provides "real-time" data that are updated several times throughout the academic year . Participating institutions account for 93 percent of student enrollment . Tracks all types of students regardless of age, transfer, or level of degree . Flexibility in calculating a rate and could disaggregate the data into many types of rates . The record captures student-, institutional-, and state-level data .
Data not publicly reported and are not available for use by higher education stakeholders, policy makers, and researchers . Institutions' participation is voluntary . Unlike all of the other data sources, Clearinghouse does not include students seeking a certificate .
state data systems Forty states already have a data system in place . Many of these data systems can give more accurate state-level graduation rates than the national databases . State-data systems follow the student and can account for transfers and varying attendance patterns within the state . States can calculate a graduation rate based on what makes sense for the individual state .
State-data systems cannot guarantee participation from for-profit institutions or private institutions in the state . Data from these sectors are limited and vary across time . Currently, most states have not linked systems, leaving them unable to track students who leave the state . States need common data definitions to be able to aggregate their data to a national level .
Graduation Rate Databases continued from previous page
College graduatioN rates: BeHiNd tHe NumBers 2 8 amer ican Counc i l on educat ion
Making Graduation Rates Matter27
By Clifford Adelman
Education Secretary Margaret Spellings recently
wrote a letter to the editor of The Detroit News
in defense of her higher education commission’s pro-
posal for a national “student unit record” system to
track all college entrants to produce a more accu-
rate picture of degree completion. “Currently,” she
said, “we can tell you anything about first-time, full-
time college students who have never transferred—
about half of the nation’s undergraduates.” It took
a long time to bring Education Department offi-
cials to a public acknowledgment of what its staff
always knew: that the so-called “Congressional
Methodology” of our national college graduation rate
survey doesn’t pass the laugh test. If the Secretary’s
Commission on the Future of Higher Education made
one truly compelling recommendation, it was for a
fuller and better accounting through student unit
records.
But it was well known that the establishment of a
national student unit record system was a non-starter
in Congress due to false worries about privacy and
data security. So one wonders why the department
hasn’t simply proposed a serious revision of the pro-
cess and formula for determining graduation rates.
Having edited and analyzed most of the department’s
postsecondary data sets, may I offer an honest and
doable formula?
There are four bins of graduates in this for-
mula, and they account for just about everyone the
Secretary justly wants us to count. They count your
daughter’s friends who start out as part-time stu-
dents—who are not counted now. They count your
31-year-old brother-in-law who starts in the winter
term—who is not counted now. They count active-
duty military whose first college courses are deliv-
ered by the University of Maryland’s University
College at overseas locations—who are not counted
now. They count your nephew who transferred
from Oklahoma State University to the University of
Rhode Island when he became interested in marine
biology—and who is not counted now. And so forth.
How do you do it, dear Congress, when you reau-
thorize the Higher Education Amendments this year?
First, define an “academic calendar year” as July 1
through the following June 30, and use this as a ref-
erence period, instead of the fall term only. Second,
define the tracking cohort as all who enter a school
(college, community college, or trade school) as
first-time students at any point during that period,
and who enroll for six or more semester-equivalent
credits in their first term (thus excluding incidental
students).
Automatically, institutions would be tracking stu-
dents who enter in winter and spring terms and
those who enter part time. Your brother-in-law,
along with other nontraditional students, is now in
the denominator along with your daughter. Ask our
colleges to divide this group between dependent
traditional-age beginners (under age 24) and inde-
pendent student beginners (age 24 and up), and to
report their graduation rates separately. After all,
your daughter and your brother-in-law live on dif-
ferent planets, in case you haven’t noticed. You now
have two bins.
Third, establish another bin for all students who
enter a school as formal transfers. The criteria for
entering that bin are (a) a transcript from the send-
ing institution and (b) a signed statement of trans-
fer by the student (both of which are usually part of
the application protocol). These criteria exclude the
nomads who are just passing through town.
At the present moment, community colleges get
credit for students who transfer, but the four-year
colleges to which they transfer get no credit when
these transfer students earn a bachelor’s degree,
as 60 percent of traditional-age community college
transfers do. At the present moment, 20 percent of
the bachelor’s degree recipients who start in a four-
27 This essay originally appeared in Inside Higher Ed on March 12, 2007 . Reprinted with permission .
College graduatioN rates: BeHiNd tHe NumBers 2 9 amer ican Counc i l on educat ion
year school earn the degree from a different four-
year school. That we aren’t counting any of these
transfers-in now is a travesty—and makes it appear
that the U.S. has a much lower attainment rate than,
in fact, we do. All this hand-wringing about interna-
tional comparisons that puts us on the short end of
the stick just might take a different tone.
Fourth, ask our postsecondary institutions to
report all students in each of the three bins who
graduate at two intervals: for associate degree–grant-
ing institutions, at four years and six years; for bach-
elor’s degree–granting institutions at six years and
nine years. For institutions awarding less than asso-
ciate degrees, a single two-year graduation rate will
suffice. Transfers-in are more difficult, because they
enter an institution with different amounts of cred-
its, but we can put them all on the same reporting
schedule as community colleges, i.e., four and six
years.
These intervals will account for nontraditional stu-
dents (including both active-duty military and vet-
erans) who move through the system more slowly
due to part-time terms and stop-out periods, but ulti-
mately give due credit to the students for persisting.
These intervals will also present a more accurate pic-
ture of what institutions enrolling large numbers of
nontraditional students, e.g., the University of Texas
at Brownsville, DePaul University in Chicago, and
hundreds of community colleges, actually do for a
living.
Colleges, community colleges, and trade schools
have all the information necessary to produce this
more complete account of graduation rates now.
They have no excuse not to provide it. With June 30
census dates for both establishing the tracking cohort
and counting degrees awarded, the algorithms are
easy to write, and data systems can produce the core
reports within a maximum of two months. It’s impor-
tant to note that the tracking cohort report does not
replace the standard fall term enrollment report, the
purposes of which are very different.
But there is one more step necessary to judge
institutions’ contribution to the academic attainment
of the students who start out with them.
So, in rewriting the graduation rate formula in
the coming reauthorization of the Higher Education
Amendments, Congress should also ask all institu-
tions to make a good faith effort to find the stu-
dents who left their school and enrolled elsewhere
to determine whether these students, too, gradu-
ated. The National Student Clearinghouse will help
in many of these cases, the Consortium for Student
Retention Data Exchange will help in others, state
higher education system offices will help in still
others, and we might even get the interstate com-
pacts (e.g., the Western Interstate Commission on
Higher Education) into the act. Require our postsec-
ondary institutions to report the students they find in
a fourth bin. They will not be taking credit for cre-
dentials, but will be acknowledged as contributing to
student progress.
No, this is not as full an account as we would get
under a student unit record system, but it would be
darned close—and all it takes is rewriting of a bad
formula.
After 27 years of research for the U.S. Department
of Education, Clifford Adelman recently left to be a
senior associate at the Institute for Higher Education
Policy. His last monograph for the department was
The Toolbox Revisited: Paths to Degree Completion
from High School Through College (2006).

56 940
7
2
31
1
American Council on Education
Center for Policy Analysis


