44

College of Southern Nevada Work Climate Committee 2017 Snapshot Survey Results
January 2018
All Other* (N = 73) 48% 44% 8%
*Other includes student workers, LOA's hourly workers, teaching assistants, etc.
Pearson Chi-Square was run along with the crosstabulaltions in the Statistical Package for the Social
Sciences (SPSS). Chi-square is a statistic that is used to determine whether the degree of association
between two variables is statistically significant. It does not measure the strength of the relationship.
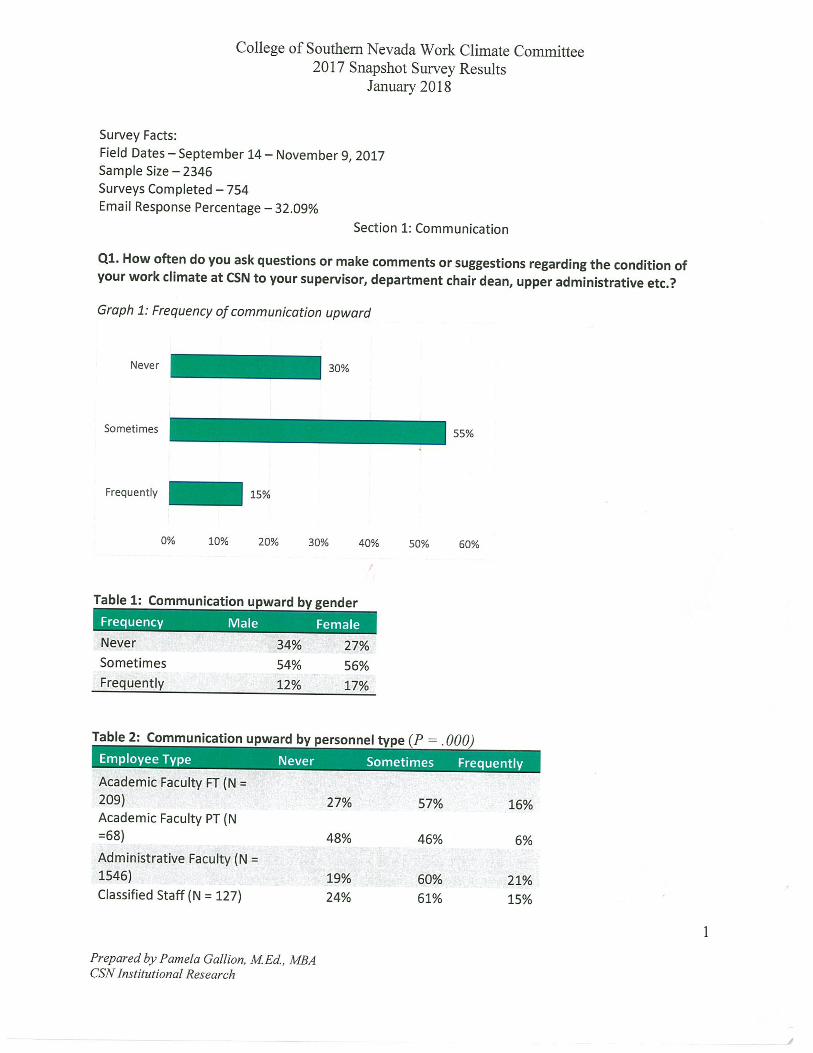
There is a statistically significant relationship between frequency of communication upwards with
supervisors, deans etc. and the personnel type. (P = .000)
Table 3: Communication upward by personnel Status (P = . 000)
Employee Status Never Sometimes Frequently
Full-Time Employee (N = 485) 23.1%
59.4% 17.5%
Part-Time Employee (N = 142) 50.1% 43.0% 7.0%
One additional crosstab was statistically significant that was whether or not the employee is full-time or
part time. As is indicated in Table 3 above, 50% of part time employees reported that they never
communicate with their supervisors, this compared to only 23% of full-time employees who do the
same.
Q3. Do you feel that the comments or suggestions you made regarding your work climate at CSN were
adequately addressed by your supervisor, department chair etc. that you provided the information
to?
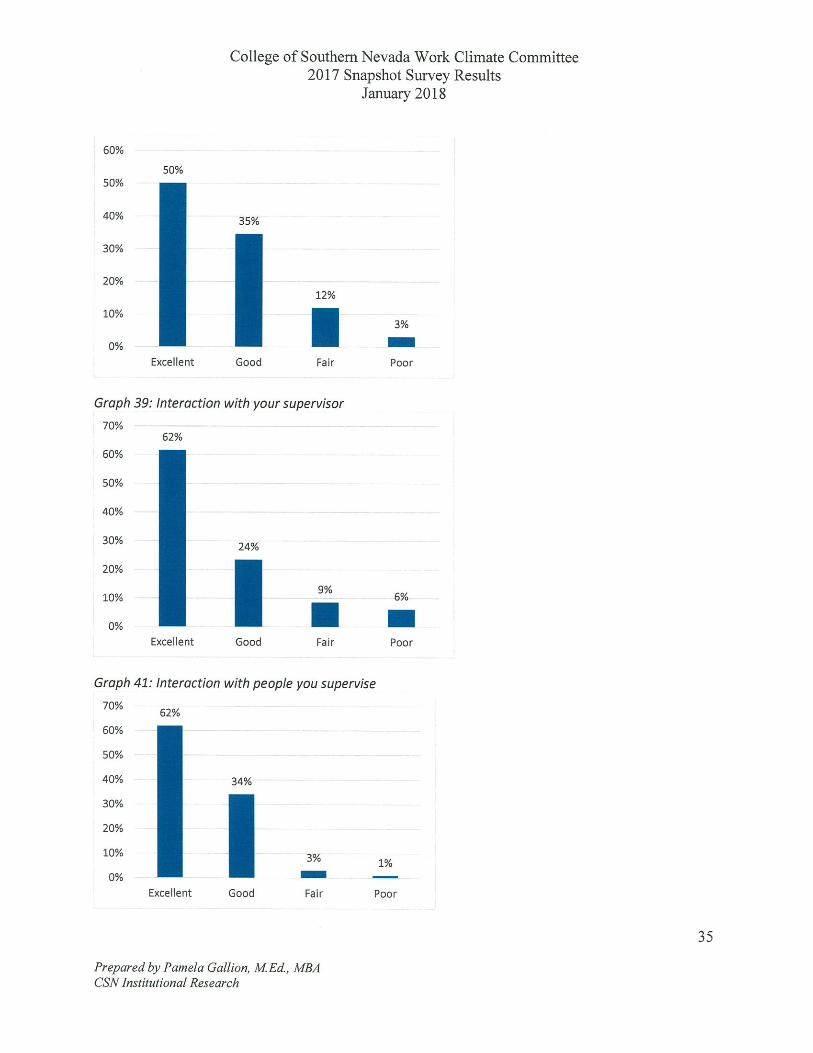
Graph 2: Positive result from communicating upward
Prepared by Pamela Gallion, MEd., MBA CSN Institutional Research
2

College of Southern Nevada Work Climate Committee
2017 Snapshot Survey Results January 2018
Yes 40%
Somewhat 35%
No 26%
0% 10% 20% 30% 40% 50%
Table 5: Communication upward by personnel Type (P = .001)
Employee Type Yes Somewhat No
Academic Faculty 31% 36% 33%
Academic Faculty PT 56% 27% 17%
Administrative Faculty 39% 35% 26%
Classified Staff 39% 37% 24%
All Other 61% 26% 14%
Section 2: Campus Safety
Q4. What time of day are you most likely to be on campus? (Select all that apply)
Graph 3: Times most likely to be on campus
Prepared by Pamela Gallion, MEd., MBA CSN Institutional Research
3


College of Southern Nevada Work Climate Committee 2017 Snapshot Survey Results
January 2018
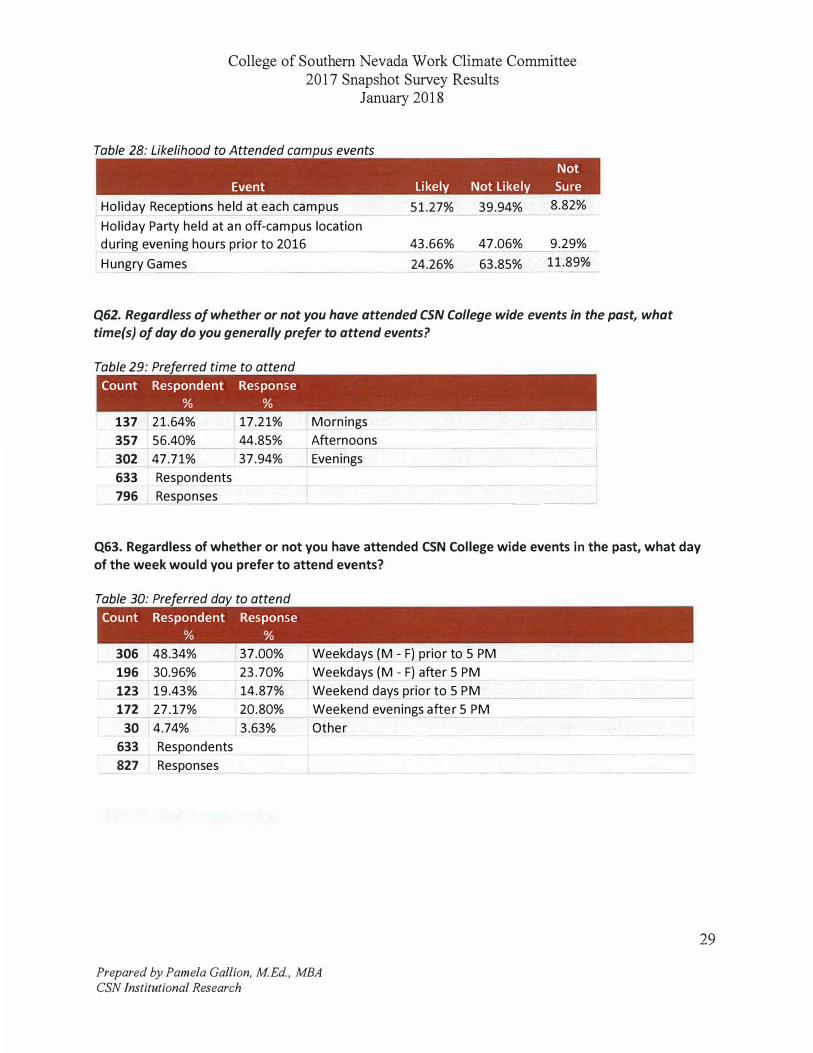
Table 28: Likelihood to Attended campus events
Not
Event Likely Not Likely Sure
Holiday Receptions held at each campus 51.27% 39.94% 8.82%
Holiday Party held at an off-campus location
during evening hours prior to 2016 43.66% 47.06% 9.29%
Hungry Games 24.26% 63.85% 11.89%
Q62. Regardless of whether or not you have attended CSN College wide events in the past, what
time(s) of day do you generally prefer to attend events?
Table 29: Preferred time to attend
Count Respondent Response
% %
137 21.64% 17.21% Mornings
357 56.40% 44.85% Afternoons
302 47.71% 37.94% Evenings
633 Respondents
796 Responses -
Q63. Regardless of whether or not you have attended CSN College wide events in the past, what day
of the week would you prefer to attend events?
Table 30: Preferred day to attend
Count Respondent Response
% %
306 48.34% 37.00% Weekdays (M - F) prior to 5 PM
196 30.96% 23.70% Weekdays (M - F) after 5 PM
123 19.43% 14.87% Weekend days prior to 5 PM
172 27.17% 20.80% Weekend evenings after 5 PM
30 4.74% 3.63% Other
633 Respondents
827 Responses
Prepared by Pamela Gallion, MEd., MBA CSN Institutional Research
29


College of Southern Nevada Work Climate Committee 2017 Snapshot Survey Results
January 2018
5 Interacting with people in my own division 3.316 .8050
Interacting with people in your own school
6 department 3.302 .8629
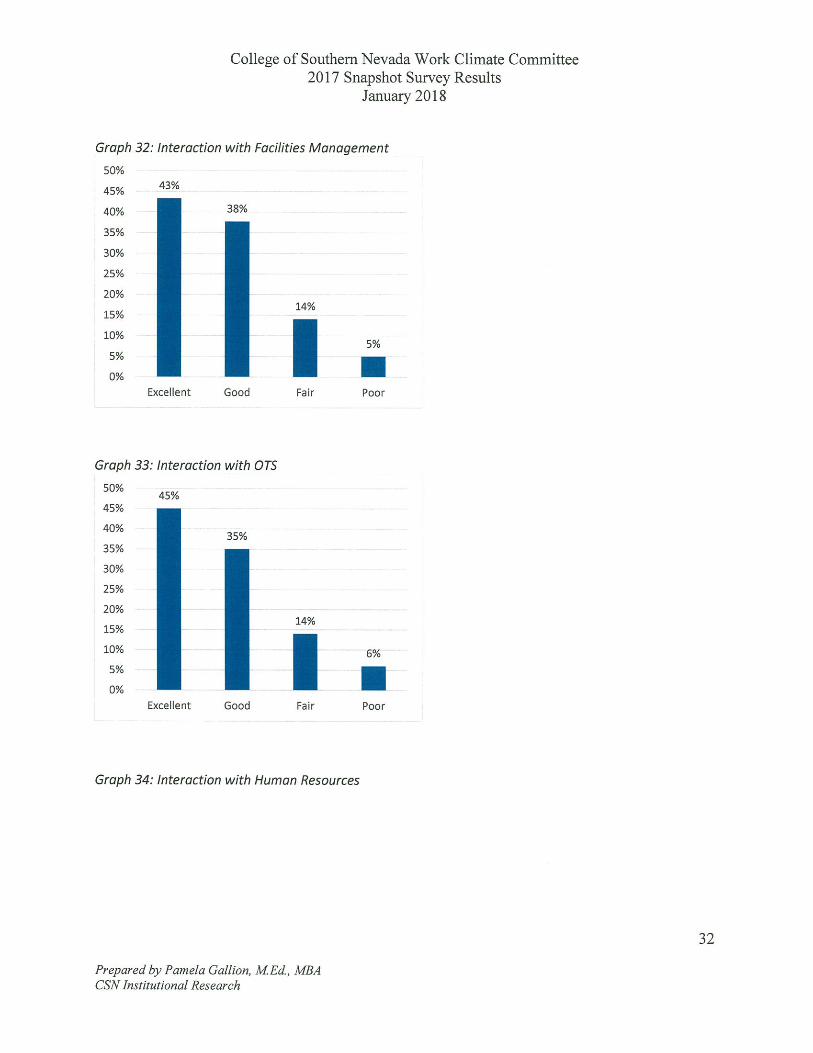
7 Interacting with OTS for help with a problem 3.193 .8906
Interacting with Facilities Management for
7 help or a problem 3.193 .8581
9 Interacting with mid-management 3.024 1.019
10 Interacting with Human Resources 3.023 .9961
11 Interacting with Executive Leadership 2.877 1.043
QBO. How would you rate your overall customer service experience as an employee at CSN?
271 42.15%
111 17.26% Fair
28 4.35% Poor
21 3.27% Not Sure/Don't Know
643 Respondents
QBl. Does your department/area hold regular department meetings?
Table 37: Ever hold department meetings
Count Percent
467 72.63% Yes
114 17.73% No
62 9.64% Not Sure
643 Respondents
Prepared by Pamela Gallion, MEd., MBA CSN Institutional Research
37