1 College or Unit Level Annual Assessment Report Template and Guidelines College or Unit Name: College of Technology Report Year: 2015-16 Submitted by: Mary L. Brake, Interim Associate Dean Submitted on (date): June, 2016 1. Description of Council/Committee. The College committee is currently made up of (Interim) Associate Dean (AD) (Mary Brake) and the Director of the School of Engineering Technology and Interim Director of the School of Information Security & Applied Computing (Bob Lahidji) and the Interim Director of the School of Visual and Built Environments and the School of Technology & Professional Services Management, (Deb deLaski-Smith). The Directors work with program coordinators on assessment reports and then submit them to the AD, who recommends changes when necessary. Because some faculty are actively involved in accreditation, they understand assessment well, whereas other faculty are still learning and the AD is working with those faculty to help them improve their assessment. 2. Assessment Goals: In addition to the primary goal of assessing student learning, list other 2015-16 unit goals that support assessment of student learning (note whether these are direct (DA), indirect (IA) or operational (OA)). Ensure overall student success Enable full time faculty to own and take charge of courses in their programs Improve quality and financial health of current programs, (OA) this year and (IA) next year. Propose and advance quality programs Develop and execute a student recruitment campaign (OA) this year and (IA) in future years. Support the EMU Foundation (OA) Advance research portfolio of faculty and COT, (OA) Improve infrastructure, (OA) 3. Summary of Accomplishments: Improve Student Success o All programs assessed at least one student learning outcome (DA). o The COT advising office put together curriculum maps for all majors, based upon the university course catalog (OA). The analysis of the road pointed to areas of improvement. For example, embedded prerequisites that are not listed in the program of study need to be formally added to the programs, via the input
Transcript
1
College or Unit Level Annual Assessment Report Template and Guidelines
College or Unit Name: College of Technology Report Year: 2015-16 Submitted by: Mary L. Brake, Interim Associate Dean Submitted on (date): June, 2016 1. Description of Council/Committee.
The College committee is currently made up of (Interim) Associate Dean (AD) (Mary Brake) and the Director of the School of Engineering Technology and Interim Director of the School of Information Security & Applied Computing (Bob Lahidji) and the Interim Director of the School of Visual and Built Environments and the School of Technology & Professional Services Management, (Deb deLaski-Smith). The Directors work with program coordinators on assessment reports and then submit them to the AD, who recommends changes when necessary. Because some faculty are actively involved in accreditation, they understand assessment well, whereas other faculty are still learning and the AD is working with those faculty to help them improve their assessment.
2. Assessment Goals: In addition to the primary goal of assessing student learning, list other
2015-16 unit goals that support assessment of student learning (note whether these are direct (DA), indirect (IA) or operational (OA)).
Ensure overall student success Enable full time faculty to own and take charge of courses in their programs Improve quality and financial health of current programs, (OA) this year and (IA)
next year. Propose and advance quality programs Develop and execute a student recruitment campaign (OA) this year and (IA) in
future years. Support the EMU Foundation (OA) Advance research portfolio of faculty and COT, (OA) Improve infrastructure, (OA)
3. Summary of Accomplishments:
Improve Student Success o All programs assessed at least one student learning outcome (DA). o The COT advising office put together curriculum maps for all majors, based upon
the university course catalog (OA). The analysis of the road pointed to areas of improvement. For example, embedded prerequisites that are not listed in the program of study need to be formally added to the programs, via the input
2
system. Some programs are evaluating their many technical electives, which make it difficult for students to graduate in 4 years.
o Analysis of course roll outs to improve the graduation rates of students (OA). Several programs were analyzed. This process is on-going.
o Assess the number and offerings of sections to ensure that students will be able to take classes in sequential order with the goal of graduating in a timely manner. (OA this year and IA next year)
o Initiated contacts with key companies that will help bring internship and employment opportunities for current and graduating students
Enable full time faculty to own and take charge of courses in their programs. o Dean’s office helped programs with an analysis of section offerings. Section
offerings were optimized to offer adequate numbers of popular courses and to cancel inefficient sections and to improve the plan of offering these sections so that students can plan on courses that will have a large enough enrollment to be offered. (OA)
o Overall SCH of winter 2016 was up compared to SCH of winter 2015. Assessment for Fall 2016 SCH shows 9% increase when compared with same time last year.
o The programs are in the process of putting together consistent course roll outs and advertising these roll outs to students when they come in for advising and putting the roll outs on the program website in an effort to educate students so they can plan their education and graduate in a timely manner. Assessment of these measures will occur next year.
o Extra sections of popular classes were added to the winter session and low enrollment classes were cancelled. These low enrollment classes are still under assessment to determine the optimal semester for them to be offered. Extra sections of popular classes were added to the fall semester before registration to offer students as many course offerings as possible.
Improve quality and financial health of current programs to improve student
learning. o The course offerings taught by tenure track faculty versus part-time lecturers
were analyzed. Based upon this analysis two tenure track faculty lines were requested from the Provost, along with six full time lecturer positions.
o Assessment of quality and financial health of programs on student learning will occur next year.
o Was recognized to have been the only college that met its budget for 15-16.
Propose and advance quality programs. o A mechanical engineering program proposal and the course proposals were
written and submitted to the input process for approval. (OA) o A program on information technology and accompanying course proposals were
written and submitted through the curricular process. o Supported accreditation efforts of IDE, SAG, and the engineering technology
programs.
Student Recruitment o Visited several local high schools.
3
o Initiated a ‘student ‘ambassador’ recruitment and retention program. COT undergraduate students were recruited this summer and training will start this summer and fall. They will interact with prospective EMU students at events like Explore Eastern and in the future will be involved in retention events.
Support EMU Foundation and its efforts to support student learning.
o Hired Vince Cavataio, Director of Annual Giving now has an office in Sill Hall. Worked with Foundation to host events for alumni (MET, IDE, Aviation and Construction). The Construction golf outings was particularly successful.
o Hosted events to introduce potential industrial partners (Hyundai, Tenneco, Henkel, BASF, Gentex, and others) to our programs. We are working to provide more interaction between our students and industry via alumni and other industrial partners. This will be assessed next year.
Advance research portfolio of faculty to ensure students are taught up-to-date
material and to provide students with research opportunities. o Hired five new faculty members (1 Product Design and Development, 1
Engineering Management, 2 Information Assurance and a permanent director for the School of Visual and Built Environment), with proven research track records were hired and every effort is being made to help them to continue their research at EMU, (with research labs, software etc).
o Encouraged faculty to work on research with all students. Several students participated in the undergraduate research fair and others students participated in the graduate research fair.
o Supported faculty Research – 2 new faculty received new faculty research awards, 7 were awarded a Faculty Research/Creative Activity Fellowship, and 4 were awarded a Sabbatical.
Infrastructure Improvements to provide best learning environment possible.
o Harley Ellis Deveraux (HED) was awarded the bid to analyze the facilities currently used by the College of Technology, starting at the end of May, 2016. They will come up with a set of projects from small to large to help improve the infrastructure of COT, assess use of buildings that will advance the goals of the College, and put together specific plans for renovations for submission to the State of Michigan and for internal funding.
o Upgrades to classroom technology were made to Roosevelt in late summer, 2015 and will occur in Sill Hall in summer, 2017.
Direct Assessment
o All programs participated in assessment of student learning outcomes. Their reports are attached. All programs identified student learning outcomes, which is a huge increase from just two years ago. All programs performed assessment, typically direct assessment, but in some cases indirect assessment where a program issue needed to be assessed.
4. Examples:
The Polymers and Coatings did a particularly thorough job of assessing one of their student learning outcomes. Their program has six student learning outcomes (SLO) and faculty chose one of their SLOs to assess this year, in an appropriate course. The faculty picked five
4
detailed indicators to assess the SLO “students will be able to compare various coating technologies and evaluate their usefulness and limitations.” Faculty used a quiz, a midterm, group assignments, and a research paper to determine the level of achieving of the indicators they defined. They found that their SLO was largely achieve, except on one indicator. They plan on bringing in guest speakers in the future to improve students’ understanding of the regulations and performance needs of customers of UV-cure coatings. An example of assessment that indirectly influences student learning is Engineering Management. In this case the faculty in Engineering Management examined the program of study that they would like students to follow and modeled the course roll out so that a students can be successful in finishing the program. This analysis led to 9 program change objectives, which they will work on in the near future. Aviation Flight Technology and Management Programs assessed “knowledge of contemporary issues” in their senior seminar course by analyzing the weekly grades of a writing assignment. They found that the results showed a polar distribution, with students doing quite well or very poorly, but most did well. They found that it wasn’t that the students did not understand the SLO but the students did poorly on the method of the assessment, i.e. missed or were late in their blog assignments, or the quality of research or writing of the blog assignments was poor. They state, “A clear demonstration of knowledge in contemporary issues in the aviation industry was represented in almost all cases when blog assignments were completed.” Their continuous improvement includes identifying and addressing possible logistical issues that prevent the student from completing the assignment. Improvements include increasing the clarity of due dates and requirement in the syllabus as well as discussing the format of the blog writing.
5. Closing the Loop.
Most of the closing the loop plans of each program include altering course material. The Paralegal Studies program plans to change their assessment by requiring a pre- and post-assessment in courses that are prerequisite courses to the senior level course that was assessed this year. Some programs gave vague plans of action, such as the program will come up with additional assessment or different assessment. Programs will be encourage to turn in their report earlier next year (well before the end of the winter semester) so that they can receive help on ‘closing the loop’. Closing the Loup or a Plan of Action has been difficult for many faculty to grasp, but each year more and more programs have come up with meaningful plans that are based upon the results of their assessment.
6. Next Year’s Goals.
In addition to the goals listed under item 2 that are on-going, faculty will be encourage to perform their assessment by January so that they can receive feedback in the winter semester and if necessary, re-do their assessment. Also, programs will be asked to comment on the results of their ‘plans of action’ that they list in this year’s report.
5
7. Program Annual Assessment Report Template
Program Name:
Report Year: 2015-2016
Submitted on (date):
Program Student Learning Outcome Or Program Learning Objective Assessed:
Method of Assessment:
Assessment Findings:
Plan of Action: (plan on improvement to program)
6
Appendix A: Individual Reports for the College of Technology page School of Engineering Technology
fall EM540 EM531 Elective Project/Program Management
winter EM580 EM609 EM695OL Design and Manufacturing summer Custom
Assignments Course# Core Course Title Online f2f fall winter summer
EM505 Managing Engineering and Technology F and W F BB/RT BB EM509 Engineering Project Management F and W F GP/UR GP EM520 Engineering Value and Economic Analysis W*2 W
BB/BB
EM531 Engineering Management Analysis F*2 F SA/SA EM540 Engineering Resource Management F*2 F SA/Lec EM580 Engineering and Enterprise Integration (21 credits) W*2 W
SA/SA**
EM695 Leadership & Ethics; EM Capstone (30 credits) F and W NA SA SA
Average Course Count / Year = 14 6
Assignments Course# Elective Course Title Online f2f fall winter summer
EM511 Manufacturing Engineering Fundamentals F NA BB EM519 Applied Engineering Project Management (EM509) F W New /UR
EM609 Professional Project Management (EM519) W W
SA/Lec EM547alt Mgt. of Research, Development & Technology F* NA Lec
14
EM558 Lean Production F NA BB EM570 Patents and Engineering Law W NA
CK**
EM659 Advanced Lean Systems (EM558) S**
SA**
EM669 Lean Leadership Standards and Integration (EM659) S*
BB*
EM620 Integrated Product/Process Design (EM509&649/659) W* NA
New EM649 Manufacturing Process Planning F** NA GV
EM630 High Tech Engineering Innovation W** NA
New Business Process Engineering W and S NA
SA SA
EM681 Special Topics Any Any
Average Course Count / Year = 10 2 * Offered odd years
** Offered even years Special Topic Examples: NA: Not Available
Environmental Engineering & Policy
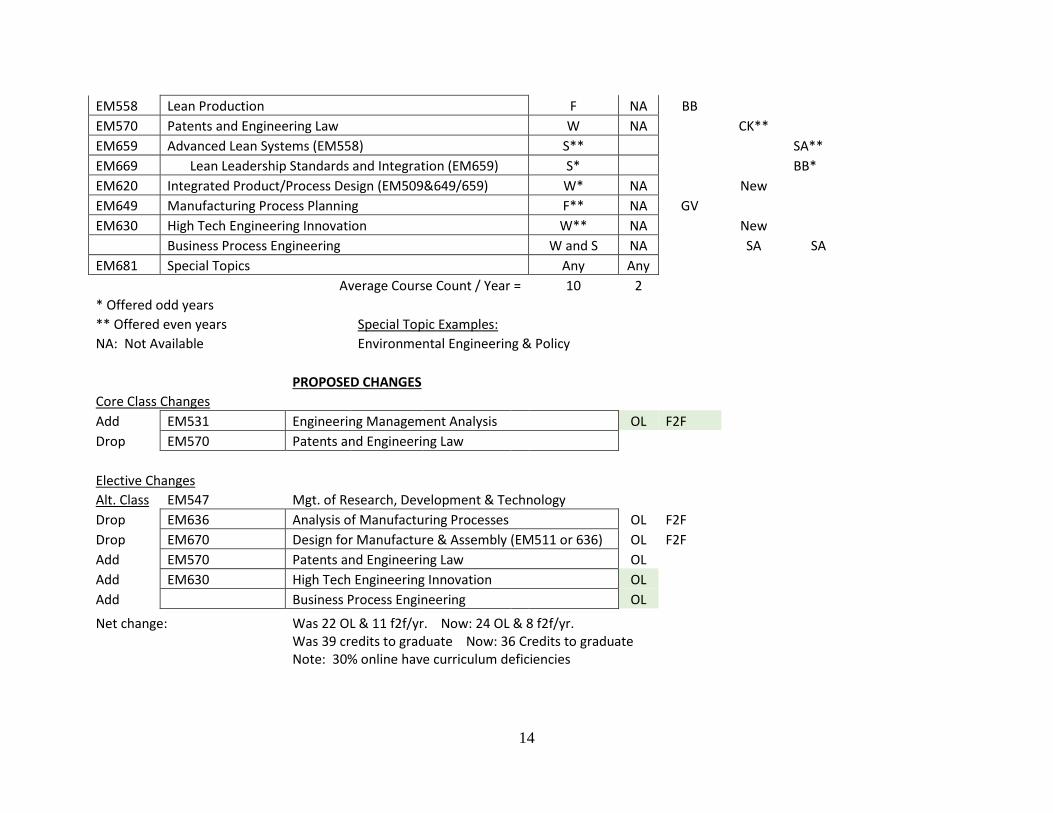
PROPOSED CHANGES Core Class Changes
Add EM531 Engineering Management Analysis OL F2F Drop EM570 Patents and Engineering Law
Elective Changes Alt. Class EM547 Mgt. of Research, Development & Technology
Drop EM636 Analysis of Manufacturing Processes OL F2F Drop EM670 Design for Manufacture & Assembly (EM511 or 636) OL F2F Add EM570 Patents and Engineering Law OL
Add EM630 High Tech Engineering Innovation OL Add Business Process Engineering OL Net change: Was 22 OL & 11 f2f/yr. Now: 24 OL & 8 f2f/yr.
Was 39 credits to graduate Now: 36 Credits to graduate Note: 30% online have curriculum deficiencies
15
Program Change Objectives: 1. Enable face-to-face and online students to graduate within two years
2. Increase SCH/Class ratio 3. Reduce likelihood of class cancelation due to low enrollment
f o O P 2 f505oO f509oO w520oO f531eO f540eO w580eO w695eO 1 1 1 0.5 0.5 0.5 0.3 foOP2
f e O P 2 f505eO f509eO w520eO f531oO f540oO w580oO w695oO 1 1 1 0.5 0.5 0.5 0.3 feOP2
f o F P 2 f505oF f509oF w520oF f531eF f540eF w580eF w695eF 1 1 1 0.5 0.5 0.5 0.3 foFP2
f e F P 2 f505eF f509eF w520eF f531oF f540oF w580oF w695oF 1 1 1 0.5 0.5 0.5 0.3 feFP2
f o O D 2 f505oO f509oO w520oO f531eO f540eO w580eO w695eO 0.3 0.4 1 0.5 0.5 0.6 0.4 0.3 0.1 0.2 foOD2
f e O D 2 f505eO f509eO w520eO f531oO f540oO w580oO w695oO 0.3 0.4 1 0.5 0.5 0.6 0.4 0.3 0.1 0.2 feOD2
f o O C 2 f505oO f509oO w520oO f531eO f540eO w580eO w695eO 0.4 0.3 0.5 0.4 0.4 0.3 0.2 0.3 0.2 foOC2
f e O C 2 f505eO f509eO w520eO f531oO f540oO w580oO w695oO 0.4 0.3 0.5 0.4 0.4 0.3 0.2 0.3 0.2 feOC2
f o F C 2 f505oF f509oF w520oF f531eF f540eF w580eF w695eF 0.4 0.3 0.5 0.4 0.4 0.3 0.2 0.3 0.2 foFC2
f e F C 2 f505eF f509eF w520eF f531oF f540oF w580oF w695oF 0.4 0.3 0.5 0.4 0.4 0.3 0.2 0.3 0.2 feFC2
f o O P 4 f505oO f509oO w520eO f531eO f540oO w580oO f695oO 1 1 1 0.5 0.5 0.5 0.3 foOP4
f e O P 4 f505eO f509eO w520oO f531oO f540eO w580eO f695eO 1 1 1 0.5 0.5 0.5 0.3 feOP4
f o F P 4 f505oF f509oF w520eF f531eF f540oF w580oF f695oF 1 1 1 0.5 0.5 0.5 0.3 foFP4
f e F P 4 f505eF f509eF w520oF f531oF f540eF w580eF f695eF 1 1 1 0.5 0.5 0.5 0.3 feFP4
f o O D 4 f505oO f509oO w520eO f531eO f540oO w580oO f695oO 0.3 0.4 1 0.5 0.5 0.6 0.4 0.3 0.1 0.2 foOD4
f e O D 4 f505eO f509eO w520oO f531oO f540eO w580eO f695eO 0.3 0.4 1 0.5 0.5 0.6 0.4 0.3 0.1 0.2 feOD4
f o O C 4 f505oO f509oO w520eO f531eO f540oO w580oO f695oO 0.4 0.3 0.5 0.4 0.4 0.3 0.2 0.3 0.2 foOC4
f e O C 4 f505eO f509eO w520oO f531oO f540eO w580eO f695eO 0.4 0.3 0.5 0.4 0.4 0.3 0.2 0.3 0.2 feOC4
f o F C 4 f505oF f509oF w520eF f531eF f540oF w580oF f695oF 0.4 0.3 0.5 0.4 0.4 0.3 0.2 0.3 0.2 foFC4
f e F C 4 f505eF f509eF w520oF f531oF f540eF w580eF f695eF 0.4 0.3 0.5 0.4 0.4 0.3 0.2 0.3 0.2 feFC4
f o O P 6 f505oO w509oO w520eO f531eO f540oO w580oO f695oO 1 1 1 0.5 0.5 0.5 0.3 foOP6
f e O P 6 f505eO w509eO w520oO f531oO f540eO w580eO f695eO 1 1 1 0.5 0.5 0.5 0.3 feOP6
f o O D 6 f505oO w509oO w520eO f531eO f540oO w580oO f695oO 0.3 0.4 1 0.5 0.5 0.6 0.4 0.3 0.1 0.2 foOD6
f e O D 6 f505eO w509eO w520oO f531oO f540eO w580eO f695eO 0.3 0.4 1 0.5 0.5 0.6 0.4 0.3 0.1 0.2 feOD6
f o O C 6 f505oO w509oO w520eO f531eO f540oO w580oO f695oO 0.4 0.3 0.5 0.4 0.4 0.3 0.2 0.3 0.2 foOC6
f e O C 6 f505eO w509eO w520oO f531oO f540eO w580eO f695eO 0.4 0.3 0.5 0.4 0.4 0.3 0.2 0.3 0.2 feOC6
w o O P 2 w505oO w509oO w520eO f531eO w540eOw580eO w695eO 1 1 1 0.5 0.5 0.5 0.3 woOP2
w e O P 2 w505eO w509eO w520oO f531oO w540oOw580oO w695oO 1 1 1 0.5 0.5 0.5 0.3 weOP2
w o O D 2 w505oO w509oO w520eO f531eO w540eOw580eO w695eO 0.3 0.4 1 0.5 0.5 0.6 0.4 0.3 0.1 0.2 woOD2
w e O D 2 w505eO w509eO w520oO f531oO w540oOw580oO w695oO 0.3 0.4 1 0.5 0.5 0.6 0.4 0.3 0.1 0.2 weOD2
w o O C 2 w505oO w509oO w520eO f531eO w540eOw580eO w695eO 0.4 0.3 0.5 0.4 0.4 0.3 0.2 0.3 0.2 woOC2
w e O C 2 w505eO w509eO w520oO f531oO w540oOw580oO w695oO 0.4 0.3 0.5 0.4 0.4 0.3 0.2 0.3 0.2 weOC2
w o O P 4 w505oO w509oO w520eO f531eO w540oOw580oO w695oO 1 1 1 0.5 0.5 0.5 0.3 woOP4
w e O P 4 w505eO w509eO w520oO f531oO w540eOw580eO w695eO 1 1 1 0.5 0.5 0.5 0.3 weOP4
w o O D 4 w505oO w509oO w520eO f531eO w540oOw580oO w695oO 0.3 0.4 1 0.5 0.5 0.6 0.4 0.3 0.1 0.2 woOD4
w e O D 4 w505eO w509eO w520oO f531oO w540eOw580eO w695eO 0.3 0.4 1 0.5 0.5 0.6 0.4 0.3 0.1 0.2 weOD4
w o O C 4 w505oO w509oO w520eO f531eO w540oOw580oO w695oO 0.4 0.3 0.5 0.4 0.4 0.3 0.2 0.3 0.2 woOC4
w e O C 4 w505eO w509eO w520oO f531oO w540eOw580eO w695eO 0.4 0.3 0.5 0.4 0.4 0.3 0.2 0.3 0.2 weOC4
w o O P 6 w505oO f509oO w520eO f531eO f540oO w580oO w695oO 1 1 1 0.5 0.5 0.5 0.3 woOP6
w e O P 6 w505eO f509eO w520oO f531oO f540eO w580eO w695eO 1 1 1 0.5 0.5 0.5 0.3 weOP6
w o O D 6 w505oO f509oO w520eO f531eO f540oO w580oO w695oO 0.3 0.4 1 0.5 0.5 0.6 0.4 0.3 0.1 0.2 woOD6
w e O D 6 w505eO f509eO w520oO f531oO f540eO w580eO w695eO 0.3 0.4 1 0.5 0.5 0.6 0.4 0.3 0.1 0.2 weOD6
w o O C 6 w505oO f509oO w520eO f531eO f540oO w580oO w695oO 0.4 0.3 0.5 0.4 0.4 0.3 0.2 0.3 0.2 woOC6
w e O C 6 w505eO f509eO w520O f531oO f540eO w580eO w695eO 0.4 0.3 0.5 0.4 0.4 0.3 0.2 0.3 0.2 weOC6
General
Engineering Management Electives
Routing
EM Core Courses
PM Track Design & Manufacturing Track
17
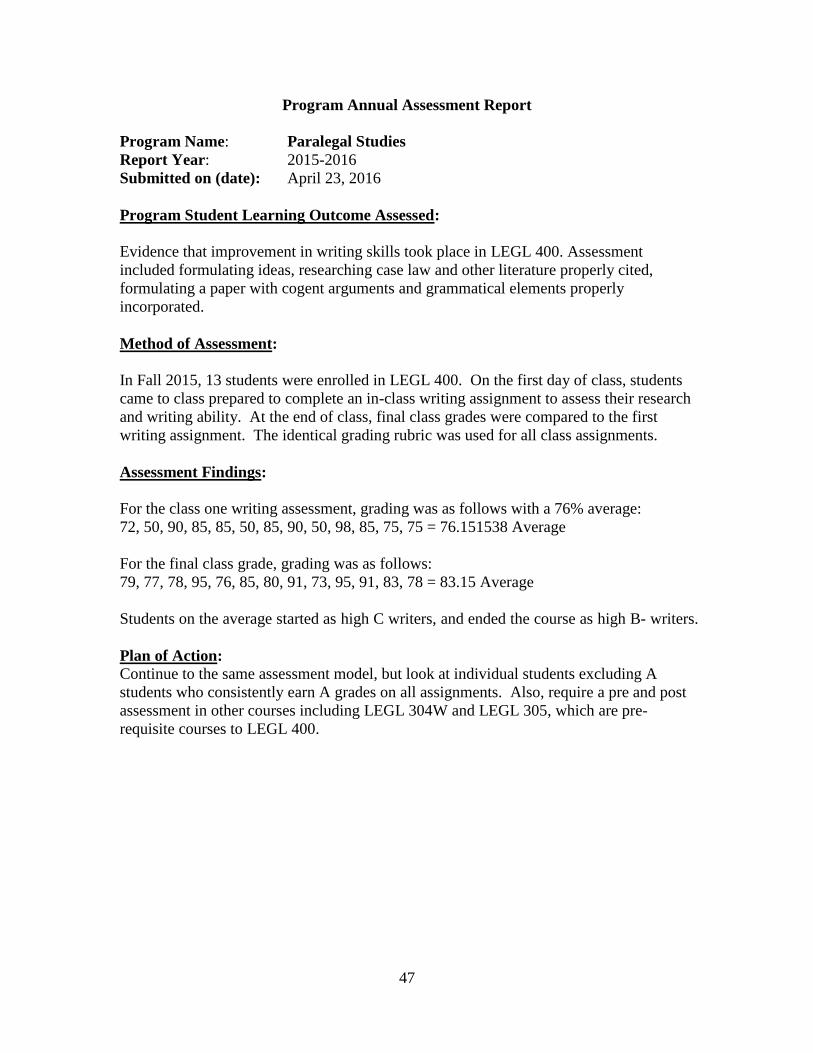
Program Annual Assessment Report
Program Name: Mechanical Engineering Technology
Report Year: 2015-2016
Submitted on (date): April 27, 2016
Program Student Learning Outcome Assessed:
l) Technical expertise encompassing the area of materials (including strength of materials),
applied mechanics, statics and dynamics, thermal/fluid system design/analysis, conventional or
alternative energy system design/analysis, and power generation.
MET 312 Applied Dynamics, use and exam problem to assess the students’ ability to
apply the relative velocity equation to analyze the kinematic behavior of a rigid body
subjected to planar motion.
Method of Assessment:
The assessment method used to assess this student learning outcome was a faculty developed
exam problem.
Assessment Findings:
The following problem was used to assess this student learning outcome,
The corresponding rubric:
On the slider crank mechanism
shown, locate the instantaneous
center of zero velocity (IC) of the
connecting rod (member BC).
Also, calculate the velocity of the
slider.
Note that member BC is horizontal
at the instant shown.
18
The results of this assessment were
Since more than 70% of the students that were evaluated earned a rating of Satisfactory or above,
no corrective action is required.
Plan of Action:
Continue to review and demonstrate the application of vector multiplication theory prior to
delivering the lecture on planar rigid body kinematic analysis.
Student A 3
Student B 3 Student C 3 Student D 4 Student E 4 Student F 4 Student G 2 Student H 2 Student I 4 Student J 3 Student K 3 Student L 4 Student M 2 Student N 1 Student O 3
Novice 0.07 7%
Aware of basic concepts 0.20 20%
Satisfactory 0.40 40%
Proficient 0.33 33%
19
Program Annual Assessment Report
Program Name: Product Design and Development
Report Year: 2015-2016
Submitted on (date): April 22, 2016
Program Student Learning Outcome Assessed:
Work effectively both individually and in teams.
Method of Assessment:
In PDD 156 Teamwork in Product Design, students are placed in teams of 4-5 to work on a
project. They have regularly scheduled, in-class, meetings.
All members of each team complete a meeting evaluation form (attached) at the end of each team
meeting. Forms are reviewed with them each week and all of them are collected when they
submit their project.
Assessment Findings:
The acceptable level of achievement is a 4 or higher with the exception of Pace. Pace should be
2, 3 or 4.
85% of the students achieved an acceptable level or higher.
Conclusion: Students are using teamwork tools covered in class to work effectively in teams.
Plan of Action:
No action required.
20
Meeting Evaluation Form Team #________ Date_____________
1. Our meeting today was: Rambling 2 3 4 Focused
2. The pace was: Too slow 2 3 4 Too fast
3. Everyone got a chance to participate: No 2 3 4 Yes
4. Our purpose was: Confused 2 3 4 Clear
5. We made good progress: No 2 3 4 Yes
6. We followed our ground rules: No 2 3 4 Yes
7. Agenda was distributed in time: No 2 3 4 Yes
8. Agenda was useful: No 2 3 4 Yes
9. Reviewed minutes from last time: No 2 3 4 Yes
10. Minutes from last meeting were complete: No 2 3 4 Yes
11. My input/ideas were fully considered: No 2 3 4 Yes
Comments:
21
Program Annual Assessment Report
Program Name: M.S. Program in Polymers and Coatings
Report Year: 2015-2016
Submitted on (date): April 18, 2016
Program Student Learning Outcome Assessed:
1. Will develop polymers and coating products and be knowledgeable in broad aspects of
polymers, coatings and raw materials and their applications in industries.
2. Will be able to design experiments for preparation, evaluation and applications of coatings for
specified end uses.
3. Will be able to select raw materials, design and formulate coatings for specified end uses.
4. Will be able to compare various coating technologies and evaluate their usefulness and
limitations
5. Will be able to apply concepts of interdisciplinary areas (chemistry, physics, material science,
patents and patenting etc.) to the problems of polymers and coatings.
6. Will demonstrate their ability to design and undertake independent study or research project to
satisfactory completion.
SLO Assessed this academic year:
Will be able to compare various coating technologies and evaluate their usefulness and
limitations
Method of Assessment:
The method used for assessment is outlined below.
For the selected SLO 4 appropriate course, PC-540 (UV-cure coatings) was identified.
For PC-540, in keeping with the SLO selected, five indicators have been identified that can fully
address the selected SLO. A list of SLO selected is shown below.
During the semester, student evaluation was conducted based on these five indicators. For
example, Assignment-I was mainly focusing on Indicator-I. In quiz, mid-terms tests were
designed to substantially evaluate indicators I and II. Test questions were so included that they
address, where possible, all five indicators. Two “group assignments” (problem solving theme)
were given that were targeted to evaluate indicator II and IV. All students were required to
research and write a term paper on a topic assigned. This assignment would assess indicators –
III, IV, and V. Class room discussions were also used to assess one or all indicators.
22
The data so collected (see attached table) were analyzed to identify how they met the SLO.
Overall rating was then calculated to determine how well the PC-540 met the selected SLO. We
also identified the areas of concern or of interests for continuous improvement.
Course evaluated: PC-540 UV-cure coatings
For this course we will evaluate students learning based on the following indicators.
Indicator-I: Have adequate knowledge of commonly used contemporary coatings
technologies such as – water-borne, High-solids, powder-coatings and
solvent-based coatings.
Indicator-II Able to relate various coating technologies with their applications (Why
certain technologies are more suitable for specific applications?
Indicator-III Able to understand purpose and significance of UV-cure coatings in light
of current regulations and performance needs of the end users (customers).
Indicator-IV Demonstrate understanding of UV-cure coating formulations and problem
solving of technical issues in UV-cure coatings / inks industries.
Indicator-V Be able to compare coating technologies within UV-cure coatings and their
suitability for a given application and performance.
23
Course No. PC-540 UV-Cure Coatings
SLO Will be able to compare various coating technologies and evaluate their
usefulness and limitations
Indicators Not Poorly Average Above Fully
achived acieved achived average acieved
achivedScale < 25 25 - 55 55 -75 75- 90 >90
Indicator-I: 0 0 0 45 55
Indicator-II 10 10 20 30 30
Indicator-III 0 0 40 25 35
Indicator-IV 0 0 10 0 90
Indicator-V 0 0 5 60 35
Total 10 10 75 160 245
Mean 2 2 15 32 49
Indicator-I: Have adequate knowledge of commonly used contemporary coatings technologies such
as – water-borne, High-solids, powder-coatings and solvent-based coatings
Indicator-II Able to relate various coating technologies with their applications
(Why certain technologies are more suitable for specific applications?
Indicator-III Able to understand purpose and significance of UV-cure coatings in light of current
regulations and performance needs of the end users (customers).
Indicator-IV Demonstrate understanding of UV-cure coating formulations and problem solving of
technical issues in UV-cure coatings / inks industries.
Indicator-V Be able to compare coating technologies within UV-cure coatings and their suitability .
for a given application and performance
% of Students showing achievement of this SLO
Findings:
1. The selected SLO (4) largely achieved > 80%.
2. There is much scope to further improve the achievement of this SLO for PC-540.
24
Changes recommended for instructions:
1. Some students were not able to effectively relate various coatings technologies to their
applications. Perhaps, this topic area can be incorporated in the first unit or add pre-
requisite of PC-502/503 where these are included. This will be done by introducing some
additional topics in PC 540 in the first unit and perhaps consider adding a pre-requisite.
2. In light of lower achievement of indicator –III, recommendations to include topics related
to extant regulations related to coatings as well as emerging applications and performance
requirements of this rapidly growing coating technology. It is recommended that we
bring in expert guest speakers from industry or government organization to the class to
share such information. Closer tie up with RadTech organization (Industry organization
for radiation curing industry) is recommended to facilitate this aspect.
25
Program Annual Assessment Report
Program Name: Master of Science in Quality Management
Report Year: 2015-2016
Submitted on (date): April 6, 2016
Program Student Learning Outcome Assessed:
Students will be able to select and utilize appropriate quality tools and procedures to
solve or prevent problems and improve quality. (QUAL 548 – Tools for Continuous
Improvement)
Method of Assessment:
Review of course content by Quality Management faculty.
Assessment Findings:
1. Course content was too narrowly focused on statistics.
2. The course shell lacked student learning outcome objectives.
3. As a result of these two items, approximately 1/3 of students were either failing or
dropping out of the course and QM program.
Plan of Action:
1. The course was totally redesigned.
2. Content was revised to include a variety of quality tools and procedures to solve or
prevent problems and improve quality.
3. A new text, “Besterfield, Quality Improvement”, 9th ed. 2013, was adopted.
4. The course Canvas shell was rewritten to include outcome based learning objectives for
each unit, supplemental instruction, and more exercises. An example of unit learning
objectives is provided below.
5. Weekly discussion was added to more closely working with the students.
6. Course application project was added to guide students applying what they learned.
New course content with the new Canvas shell is reflected below as it was successfully delivered
Fall 15. As a result, there was only one student who did not complete the course due to work
conflicts. The course passing rate was 93.8% (15/16) and average grade was 87.5. The course
was rated 77.8% “much above average” and “above average” combined, anonymously by the
students at the end of course.
An example from new course shell:
Unit 1 (Chapter 1 Introduction to Quality Improvement) Objectives
Upon completion of this unit, students will be able to:
1. Describe why quality is somewhat of an intangible.
2. Define quality, according to the American Society for Quality.
26
3. Define quality, according to ISO 9000.
4. Describe quality control and its purpose.
5. Describe quality improvement and its purpose.
6. Describe statistical quality control.
7. Describe quality assurance and its purpose.
8. Describe a process and its purpose.
9. Describe internal and external customers.
10. Describe internal and external suppliers.
11. Describe Failure Mode and Effect Analysis (FMEA) and what it combines.
12. List the things that FMEA is intended do.
13. Describe the two types of FMEA.
14. Describe Quality Function Deployment (QFD) and what it is intended to lead to.
15. List the questions that QFD answers.
16. Describe what QFD reduces.
17. Describe the ISO 9000.
18. List the three standards that the ISO 9000 series consists of and their contents.
19. Describe the ISO 14000 standard.
20. Describe what benchmarking searches for what and what it is intended to lead to.
21. Describe what Total Productive Maintenance (TPM) is with regard to the workforce and
what it is intended to obtain.
22. List the technical skills used in Total Productive Maintenance.
23. Describe quality by design, who uses it, and for what purpose.
24. Describe what quality by design is also known as.
25. List the major benefits of quality by design.
26. Describe how product liability is related to quality.
Course revised contents and schedule:
27
Contents Text Chapter Exercise Discussion Project Exam