27
COLLEGE STUDENTS HELPING AMERICA FULL REPORT

COLLEGE STUDENTSHELPING AMERICA
FULL REPORT

Corporation for National and Community Service AuthorsLillian Dote, Policy Analyst, Office of Research and Policy DevelopmentKevin Cramer, Deputy Director for Evaluation and Research, Office of Research and Policy DevelopmentNathan Dietz, Research Associate and Statistician, Office of Research and Policy DevelopmentRobert Grimm, Jr., Director, Office of Research and Policy Development
AcknowledgementsThere were several individuals that generously provided their time and input on this project. Their comments and thoughts contributed mightily to improving the quality of the final report. We would like to thank the following staff at the Corporation for National and Community Service: Sandy Scott, Peter Shifter, Amy Cohen, Shelby Jennings, Carla Manuel, Amiko Matsumoto, LaMonica Shelton, Kimberly Spring, and Norris West who were helpful in shaping the final direction of the report, and reviewed drafts. We are also grateful for our partnership with the U.S. Census Bureau and the Bureau of Labor Statistics.
The Office of Research and Policy DevelopmentThe Office of Research and Policy Development (RPD) is part of the CEO’s Office within the Corporation for National and Community Service. RPD’s mission is to develop and cultivate knowledge that will enhance the mission of the Corporation and of volunteer and community service programs.
Related Research Reports on VolunteeringVolunteering in America: State Trends and Rankings, June 2006. Presents a national, regional, and state-by-state analysis of volunteering trends.
Volunteers Mentoring Youth: Implications for Closing the Mentoring Gap, May 2006. Provides a greater understanding of the characteristics and traits that distinguish individuals whose volunteering includes mentoring youth from volunteers who do not mentor.
Youth Helping America Series: Educating for Active Citizens: Service-Learning, School-Based Service, and Youth Civic Engagement, March 2006. Takes a closer look at participation in school-based service among middle school and high school aged youth, paying particular attention to the relationship between different service-learning experiences and civic attitudes and outcomes.
Youth Helping America Series: Building Active Citizens: The Role of Social Institutions in Teen Volunteering, November 2005. Explores the state of youth volunteering and the connections between youth volunteering and the primary social institutions to which teenagers are exposed—family, schools, and religious congregations.
To read or download our reports, visit www.nationalservice.gov.
Upon request this material will be made available in alternative formats for people with disabilities. October 2006
The mission of the Corporation for National and Community Service is to improve lives, strengthen communities, and foster civic engagement through service and volunteering. Each year, the Corporation provides opportunities formore than two million Americans of all ages and backgrounds to serve their communities and country through Senior Corps, AmeriCorps and Learn and Serve America.

CONTENTSTABLE OF
4 Introduction
2 Executive Summary
5 College Student Volunteering Displays Substantial Growth
7 College Students Engage More in Episodic Volunteering
9 Who Are College Student Volunteers?
11 Where Do College Students Volunteer?
13 Many College Students Tutor and Mentor Youth
14 State Rankings of College Student Volunteering
16 The Future of College Student Volunteering
22 References
20 Technical Note
18 Footnotes
9 How Does Going to College and Working Affect Volunteering?

BACKGROUND
Every day, colleges and universities provide college students—who represent a large and growing source of the nation’s volunteers—with opportunities to deliver valuable services to communities across the country. Since the terrorist attacks of September 11, 2001, the nation has witnessed a significant upsurge in volunteers, particularly among this demographic. Both on campuses and in surrounding communities, millions of college students are participating in a wide range of volunteer service activities, from teaching and mentoring children from disadvantaged circumstances, to raising funds for worthy causes, to helping their fellow Americans recover from hurricanes and other disasters.
The mission of the Corporation for National and Community Service is to improve lives, strengthen communities, and foster civic engagement through service and volunteering. As part of that mission, the Corporation makes a significant investment in nurturing a culture of service on college campuses. Building on that support, the Corporation is working with other federal agencies, colleges and universities, higher education and student associations, and nonprofit organizations to encourage even greater levels of college student volunteering and to ensure that college graduates embark on a lifetime of service. Our goal is to increase the number of college students volunteering each year, reaching 5 million by 2010.
To identify key trends in college student volunteering and to understand their implications for growing volunteering among college students, the Corporation has produced a new report, titled College Students Helping America. The report analyzes data collected from 2002 to 2005 as part of the Current Population Survey (CPS), a comprehensive and scientifically rigorous survey of 60,000 American house-holds conducted by the U.S. Census Bureau and the Bureau of Labor Statistics. With the Corporation’s support, the Census Bureau has administered a volunteer supplement to the CPS each September since 2002.1 For the purposes of this analysis, college students were defined as individu-als between 16 and 24 years of age who, at the time of the survey, were enrolled in a post-secondary higher education institution.
To read or download the full report, visit www.nationalservice.gov.
KEY FINDINGS
The number of college students who volunteer is up by approximately 20 percent from 2002 to 2005
n The number of college students volunteering grew by 600,000 from 2.7 million in 2002 to 3.3 million in 2005. n The growth rate of college student volunteers (approximately 20%) is more than double the growth rate of all adult volunteers (9%). n In 2005, approximately 30.2 percent of college students volunteered, exceeding the volunteer rate for the general adult population of 28.8 percent.
The growth in college volunteering has been gener-ated primarily by youth who attended high school or were first-year college students during the terrorist attacks of 9/11
n The vast majority (84%) of current college student volunteers were of high-school age (14 to 18 years old) in 2001. n Since September 2001, the overall percent of college students who volunteer has increased from 27.1 percent to 30.2 percent. n The bulk of the increase in the college student volunteering rate comes from the difference in the volunteer rates of 18 to 24 year old college students in 2005 (30.2%) and 18 to 24 year old college students in 2002 (26.8%).
Tutoring and mentoring are the most popular volunteer activities among college students
n Among college student volunteers, tutoring (26.6%) and mentoring (23.8%) are the most popular volunteer activities. n 39.2 percent of black college student volunteers engage in mentoring activities, compared to 22.3 percent of white college student volunteers.
Students who work part time volunteer more than students who do not work at all
n Volunteer rates are highest among students who work 1-10 hours (46.4%) and 11-15 hours (35%) a week, while students who are not employed volunteer at a considerably lower rate (29.8%).n The volunteering rate declines substantially as college students work more hours each week. Students who work 31-35 hours and 36-40 hours exhibit volunteer rates of 22.8 percent and 23.2 percent, respectively.
EXECUTIVE SUMMARY2

PROFILE OF COLLEGE STUDENT VOLUNTEERS
Who Volunteers
n College students follow the national trend in volun-teering, with females (33%) volunteering at a higher rate than males (26.8%), and whites (32%) volunteering at a higher rate than students of other races and ethnicities (23.6%).n College students are twice as likely to volunteer as individuals of the same age who are not enrolled in an institution of higher education (30.2% and 15.1%, respectively).n College students who are enrolled full time (31.4%) are more likely to be volunteers than college students who are enrolled part time (21%). Where They Volunteer
n Nearly a third (31.6%) of college student volunteers serve with educational or youth services organizations, compared to about a quarter (26.3%) of the general adult volunteer population. n Less than a quarter (23.4%) of college student volunteers serve with religious organizations, compared to more than a third (34.8%) of the general adult volunteer population.
How They Volunteer
n 44.1 percent of college student volunteers engage in “regular” volunteering (volunteering 12 or more weeks a year with their main organization). n College student volunteers are more likely than the general adult volunteer population (27% to 23.4%) to be “episodic” volunteers (volunteering fewer than two weeks per year with their main organization).
State Rankings of College Student Volunteering
As part of our 2006 report Volunteering in America: State Trends and Rankings, the Corporation produced the first-ever state volunteer rankings for the overall population and college students. Those results are reproduced
in the full College Students Helping America report. Key findings include: n Across the 50 states and the District of Columbia, college student volunteer rates ranged from 21.4 percent to 62.9 percent between 2003 and 2005. n Six of the 10 states that rank in the top ten for overall volunteering rates also rank in the top 10 for college student volunteering rates.
BUILDING A CULTURE OF COLLEGE SERVICE
The Corporation for National and Community Service applauds the growing number of higher education institutions that are embracing their civic mission and building strong community connections in new and creative ways. The Corporation believes that colleges and universities and the students that attend them are critical to building a culture of citizenship, service, and responsibility in America.
Each year, the Corporation makes a significant investment in building a culture of service on college campuses through: Learn and Serve America, Ameri-Corps, VISTA, and Senior Corps grant programs; the provision of training and technical assistance; and Segal AmeriCorps Education Awards provided to AmeriCorps members who use their awards to pay for college tuition or to pay back student loans.
In addition, the Corporation is working closely with our various governmental, educational, and nonprofit partners to increase the number of college students who volunteer to 5 million a year by 2010. Key strategies include: n Strengthening and expanding our network of intermediary organizations and institutions (Campus Compacts, higher education and student associations, Volunteer Centers, State Service Commissions, faith-based and other community-based organizations) that provide key support for service and service-learning.n Ensuring that more college students have opportu-nities to serve as part of their academic studies through high-quality service-learning, and building the pipeline for future college student volunteers by expanding service-learning in K-12 schools. n Encouraging campuses to develop more community service offices, offer more courses and degrees in nonprofit management, and take other steps to build connections with community organizations.n Increasing the number of college students serving as tutors and mentors to youth from disadvantaged circumstances, particularly to prepare them for high school completion and college attendance.n Supporting efforts to expand service opportunities through the Federal Work-Study program. n Promoting the value and importance of service on campus and reducing barriers that inhibit students from engaging in service.
Results do not include volunteer activities since Hurricane Katrina.
Annual College Student Volunteering
3.2
3.0
2.8
2.5
3.4
2002 2003 2004 2005
3.0
2.7
3.3 3.3
(In
mill
ions
)3

COLLEGE STUDENTS HELPING AMERICA
INTRODUCTION
America’s colleges and universities promote volunteering and community service among their students in an effort to cultivate an ethic of civic responsibility1 and in part to respond to concerns that active civic and political engagement may be in decline.2 In many respects, institutions of higher learning are uniquely positioned for the task. The college environment, with its adult population, its flexible course schedules, and its emphasis on practical experience to enrich students’ academic growth, is particularly conducive to involving students in volunteer activities.3 Colleges provide the administrative, organizational, and cultural supports for volunteering, encourage the inclusion of service-learning in academic courses,4 have expectations that students will serve,5 and provide pathways to connect students with their surrounding communities by identifying local volunteer opportunities.6 In addition, service organizations often recruit on college campuses. As a result, college campuses have become settings where students are exposed to a variety of volunteering organizations and can easily find opportunities to match their interests.
The importance of colleges, and of college education, to volunteering cannot be overstated. We have seen how colleges can be very influential in facilitating volunteering behaviors. We have also seen unequivocal research that those who attend college are significantly more likely to volunteer than those who do not.7 As indicated in the 2005 Current Population Survey’s
Volunteer Supplement, college graduates volunteered at more than twice the rate of high school graduates. Among those over the age of 25, the volunteering rate was 46 percent for college graduates, compared to 21 percent for high school graduates.
As more Americans pursue and attain a college degree, the United States is experiencing record enrollments in higher education institutions. According to the National Center for Education Statistics, annual enrollment in degree-granting institutions is expected to exceed 18 million by 2010. With this increase, colleges and universities have the potential to further establish themselves as powerful institutions for developing students’ volunteering and civic engagement in conjunction with students’ education. Research suggests that college experience and substantial volunteering8 are associated with higher levels of civic engagement.9 When college and universities incorporate volunteering into the educational practice known as service-learning, the relationship is even stronger.10
Concurrent with our increased understanding of the relationship between college education and volunteering, and with rising college enrollments, we are now seeing the first cohort of what some people call the “9/11 Generation” transition into college. They may bring an acute sense of civic responsibility to the college campus, but the effects of their enrollment in college are just emerging. Thus, exploring the connection between college and volunteering has never been more salient.
4
COLLEGE STUDENTS HELPING AMERICA
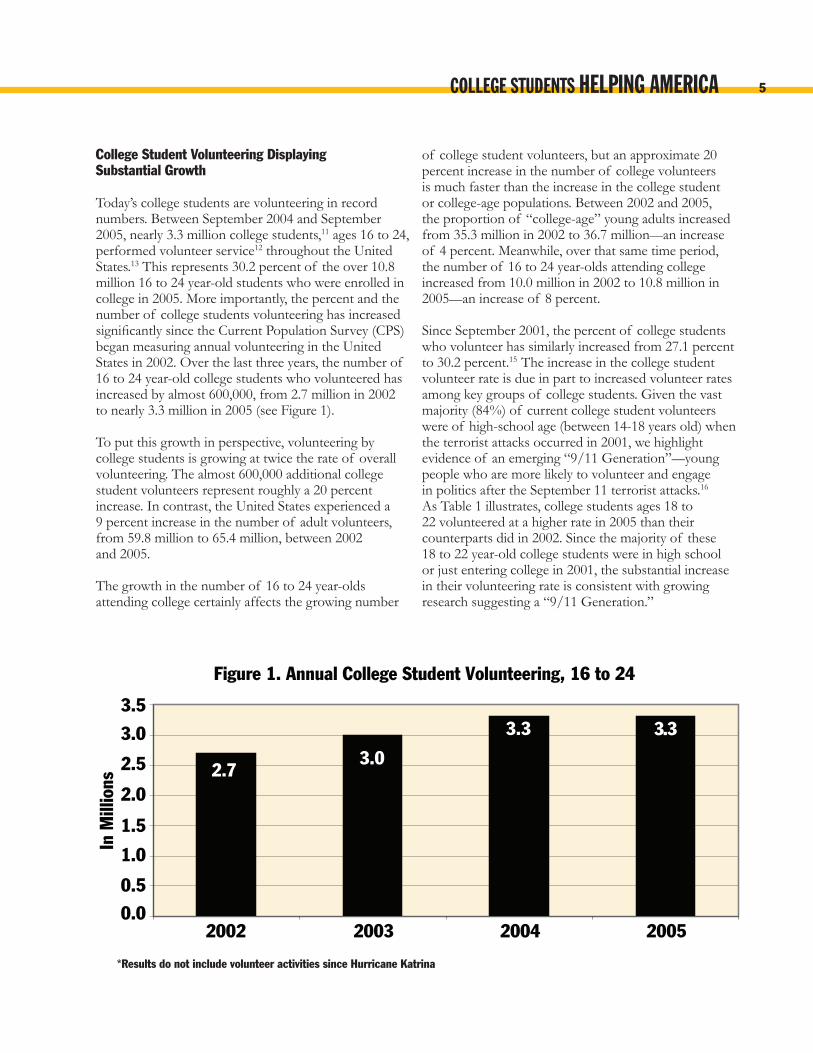
College Student Volunteering Displaying Substantial Growth
Today’s college students are volunteering in record numbers. Between September 2004 and September 2005, nearly 3.3 million college students,11 ages 16 to 24, performed volunteer service12 throughout the United States.13 This represents 30.2 percent of the over 10.8 million 16 to 24 year-old students who were enrolled in college in 2005. More importantly, the percent and the number of college students volunteering has increased significantly since the Current Population Survey (CPS) began measuring annual volunteering in the United States in 2002. Over the last three years, the number of 16 to 24 year-old college students who volunteered has increased by almost 600,000, from 2.7 million in 2002 to nearly 3.3 million in 2005 (see Figure 1). To put this growth in perspective, volunteering by college students is growing at twice the rate of overall volunteering. The almost 600,000 additional college student volunteers represent roughly a 20 percent increase. In contrast, the United States experienced a 9 percent increase in the number of adult volunteers, from 59.8 million to 65.4 million, between 2002 and 2005.
The growth in the number of 16 to 24 year-olds attending college certainly affects the growing number
of college student volunteers, but an approximate 20 percent increase in the number of college volunteers is much faster than the increase in the college student or college-age populations. Between 2002 and 2005, the proportion of “college-age” young adults increased from 35.3 million in 2002 to 36.7 million—an increase of 4 percent. Meanwhile, over that same time period, the number of 16 to 24 year-olds attending college increased from 10.0 million in 2002 to 10.8 million in 2005—an increase of 8 percent.
Since September 2001, the percent of college students who volunteer has similarly increased from 27.1 percent to 30.2 percent.15 The increase in the college student volunteer rate is due in part to increased volunteer rates among key groups of college students. Given the vast majority (84%) of current college student volunteers were of high-school age (between 14-18 years old) when the terrorist attacks occurred in 2001, we highlight evidence of an emerging “9/11 Generation”—young people who are more likely to volunteer and engage in politics after the September 11 terrorist attacks.16 As Table 1 illustrates, college students ages 18 to 22 volunteered at a higher rate in 2005 than their counterparts did in 2002. Since the majority of these 18 to 22 year-old college students were in high school or just entering college in 2001, the substantial increase in their volunteering rate is consistent with growing research suggesting a “9/11 Generation.”
*Results do not include volunteer activities since Hurricane Katrina
5
2005200420032002
3.33.3
3.02.7
In M
illio
ns
Figure 1. Annual College Student Volunteering, 16 to 24
3.5
3.0
2.5
2.0
1.5
1.0
0.5
0.0

COLLEGE STUDENTS HELPING AMERICA
In 2005, the volunteer rate among college students was also much higher than 16 to 24 year-olds in general, and higher than many other age-groups in the general adult population (see Figure 2). At 30.2 percent, the college student volunteering rate exceeded the national volunteering rate of 28.8 percent, the volunteering rate of 25 to 34 year-olds (25.3%), and the volunteering
Ages 2002 2005 Difference18-22 27.9% 30.7% +2.8%
TTaabbllee 11:: 22000022 aanndd 22000055 VVoolluunntteeeerriinngg RRaatteess ffoorr CCoolllleeggee SSttuuddeennttss
Volunteering Rate
* The 18 to 22 year-olds in 2005 were 14 to 18 year-olds in 2002.
rate of those over 65 (24.8%). Only 35 to 44 year-olds (34.5%) and 45 to 54 year-olds (32.7%) had higher volunteering rates than college students. College students were also nearly twice as likely to volunteer as their 16 to 24 year-old peers who were not enrolled in college (30.2% vs. 15.1%, respectively).
6
Figure 2. 2005 Volunteering Rates
0% 5% 10% 15% 20% 25% 30% 35% 40%65 and Over
55-64
45-54
35-4425-34
General Adult Population
College Students, 16-24
24.8%30.2%
32.7%
34.5%25.3%
24.4%
28.8%
30.2%
All Young Adults, 16-24

COLLEGE STUDENTS HELPING AMERICA
College Students Engage More In Episodic Volunteering
While the college student volunteering rate was higher than that of other cohorts of Americans, college students volunteered fewer hours than the general adult population. In 2005, the median number of hours served by a college student volunteer was 40 hours, compared to 36 hours for all youth ages 16 to 24, and 50 hours for the general adult population (see Table 2).
Several observers have speculated that while volunteering in general may have increased over the past few years, the nature of volunteering may be changing. In a more traditional model, volunteers would provide intensive, regular service at one or a few organizations; but a “new style” of volunteering would involve more episodic or occasional volunteering. As Figure 3 shows, the volunteering behavior of college students tends to be consistent with this new style of volunteering. Compared to the general adult population, college students are more likely to be episodic volunteers (defined as volunteers who serve fewer than two weeks per year with their main service organization) or occasional volunteers (defined as volunteers who serve three to eleven weeks per year with their main service organization) and less likely to be regular volunteers (twelve weeks or more with their main organization).
The largest group of college student volunteers (27%) served 15-49 hours in 2005. In comparison, the largest group of volunteers in the general adult population (27.8%) reported contributing 100-499 hours. Nonetheless, it is important to emphasize that a substantial number of college students spend a lot of time volunteering each year. We found that 44.1 percent of all college student volunteers engage in regular volunteering (volunteering twelve or more weeks a year with their main organization) and 24.4 percent of college student volunteers gave 100-499 hours in 2005 (see Figure 4).
7
Population Median Hours
College Students 40
General Adult Population 50
All Young Adults, 16-24 36
25-34 3635-44 4845-54 5055-64 56Over 65 96
Table 2: Median Hours Volunteered in 2005

COLLEGE STUDENTS HELPING AMERICA8
General Adult PopulationCollege Student
Figure 3. Volunteering Frequency: College Students vs. General Adult Population in 2005
28.9%23.7%
52.9%
44.1%
27.0%23.4%
Episodic Volunteering (0–2 weeks per year)
Regular Volunteering (12 or more weeks per year)
Occasional Volunteering (3–11 weeks per year)
10%
20%
30%
40%
50%
60%
0%
100-499 hours
15-49 hours
0% 5% 10% 15% 20% 25% 30%
Over 500 hours
50-99 hours
1-14 hours
2.7%
24.4%
15.2%27.0%
22.7%
Figure 4. How Much Time Did College Students Spend Volunteering in 2005?

COLLEGE STUDENTS HELPING AMERICA
Who Are College Student Volunteers?
In our 2006 Volunteering in America: State Trends and Rankings report,17 we found that among Americans of all ages and in every state across the country, females volunteered at higher rates than males, and whites volunteered at higher rates than persons of other races and ethnicities. Following these national patterns, female college students volunteered at higher rates than males and white college students volunteered at higher rates than students of other races (see Tables 3 and 4). Among female college students, the volunteering rate was 33.0 percent, compared to 26.8 percent for male college students. Among white college students, the volunteering rate was 32.0 percent, compared to 24.1 percent for black/African American college students and 22.9 percent for college students of other races.18
students who work 1-10 hours (46.4%) and 11-15 hours (35%) a week while students who are not employed volunteer at a considerably lower rate (29.8%).
However, as illustrated in Figure 5, volunteering among students working part-time declines with additional hours of work. In fact, the volunteering rate declines substantially as college students work more hours each week: college students employed 31-35 hours and 36-40 hours exhibit volunteer rates of 22.8 percent and 23.2 percent respectively. Within both the college student and general adult population, the high volunteering rates for individuals working part-time seems to be driven by very high volunteer rates among college students with part-time jobs of only a few hours per week.
Interestingly, the hardest-working college students (over 40 hours per week) are actually more likely to volunteer than students employed 26-40 hours. It is a pattern seen among adults in the general population as well. Lewis Friedland and Shauna Morimoto offer one explanation: students working over 40 hours a week, and volunteering, may be “high-achievers,” 21 engaged in a “remarkable range of activities.” 22 John Wilson offers an alternative explanation: it may be that work-ing hours are measuring job prestige, and “people with higher prestige jobs tend to volunteer more.” 23 Still, college students juggling school responsibilities and 40+ work hours each week volunteer at rates below students working fewer (1-25) hours.
How Does Going to College and Working Affect Volunteering?
In addition to their educational activities (e.g., attending class, studying, meeting with professors, participating in labs), college students face an array of demands on their time. Many students engage in out-of-classroom extracurricular activities such as, participating in athletics, joining clubs, sororities, or fraternities, and socializing with peers.19 Equally demanding, a growing number of college students are working, or are planning to work,20 while attending school.
Whether a student is employed, and the number of hours he/she works, appears to be a factor in explaining college student volunteering rates. Contrary to some assumptions, college students who are employed are more likely to be volunteers than college students who are not working at all; volunteer rates are highest among
9
GGeennddeerr VVoolluunntteeeerriinngg RRaatteeMale 26.8%Female 33.0%
RRaaccee VVoolluunntteeeerriinngg RRaatteeWhite 32.0%Black/African American 24.1%Other 22.9%
TTaabbllee 33:: VVoolluunntteeeerriinngg RRaatteess ffoorr CCoolllleeggee SSttuuddeennttss,, bbyy GGeennddeerr
TTaabbllee 44:: VVoolluunntteeeerriinngg RRaatteess ffoorr CCoolllleeggee SSttuuddeennttss,, bbyy RRaaccee

COLLEGE STUDENTS HELPING AMERICA10
0%
10%
20%
30%
40%
50%
60%
College Students 29.8% 46.4% 35.0% 32.5% 31.5% 28.4% 22.8% 23.2% 30.3%
General Adult Population 24.4% 50.3% 44.8% 39.4% 36.7% 34.1% 31.0% 25.8% 37.9%
Not in the LaborForce
1-10 11-15 16-20 21-25 26-30 31-35 36-40 Over 40
Figure 5. Volunteer Rate by Hours Worked per Week:College Students vs. General Adult Popluation

COLLEGE STUDENTS HELPING AMERICA
Where Do College Students Volunteer?
For college student volunteers, educational or youth services organizations are the most popular type of organization in which to serve, followed by religious organizations. In 2005, 31.6 percent of college student volunteers served at an educational or youth services organization, while 23.4 percent served at a religious organization. Both male and female college students were more likely to volunteer for an educational or youth services organization than any other type of organization: 33.6 percent of male college students, and 30.2 percent of female college students volunteered at an educational or youth services organization. With a little over 22 percent of both male and female college students, religious organizations remained the second most popular place for volunteering among both genders (see figures 6, 7, and 8).
In comparison, volunteers in the general adult population are more likely to volunteer at religious organizations, followed by educational or youth services organizations. More than a third of volunteers in the general population served at a religious organization (34.8%), and more than a quarter served in an educational or youth services organization (26.3%). Compared to college students, 16 to 24 year-old young adults not enrolled in college are also more likely to volunteer at religious organizations. Over 30 percent of 16 to 24 year-old young adults not enrolled in college volunteered at a religious organization.
Within organizational types, sports, hobby and related organizations had the highest proportion (56.7%) of male college student volunteers. Meanwhile, hospital or other health-related organizations are likely to find that their college student volunteers are predominantly female (64.5%).
11
0%
10%
20%
30%
40%
50%
60%
College Students 29.8% 46.4% 35.0% 32.5% 31.5% 28.4% 22.8% 23.2% 30.3%
General Adult Population 24.4% 50.3% 44.8% 39.4% 36.7% 34.1% 31.0% 25.8% 37.9%
Not in the LaborForce
1-10 11-15 16-20 21-25 26-30 31-35 36-40 Over 40
Figure 5. Volunteer Rate by Hours Worked per Week:College Students vs. General Adult Popluation
Civic, professional, political, or international 5.4%
Religious 23.4%
Environmental or animal care 2.0%
Hospital or health care 10.5%
Public safety 1.2%
Social or community service 16.3%
Educational or youth services 31.6%
Figure 6. College Student Volunteering by Type of Organization
Other 4.1%
Undetermined 2.3%
Sports, hobby, cultural, or arts 3.2%

COLLEGE STUDENTS HELPING AMERICA
Civic, professional, political, or international 5.6%
Religious 22.0%
Environmental or animal care 1.9%
Hospital or health care 9.3%
Public safety 1.5%
Social or community service 14.8%
Educational or youth services 33.6%
Figure 7. Male College Student Volunteering by Type of Organization
Other 4.0%
Undetermined 2.8%
Sports, hobby, cultural, or arts 4.5%
Civic, professional, political, or international 5.2%
Religious 24.3%
Environmental or animal care 2.1%
Hospital or health care 11.4%
Public safety 1.0%
Social or community service 17.3%
Educational or youth services 30.2%
Figure 8. Female College Student Volunteering by Type of Organization
Other 4.1%
Undetermined 2.0%
Sports, hobby, cultural, or arts 2.3%
12

COLLEGE STUDENTS HELPING AMERICA
Many College Students Tutor and Mentor Youth In 2005, tutoring, teaching, and mentoring were the most popular activities performed by college student volunteers.24 Over a quarter of college student volunteers tutored or taught (26.6%), and 23.8 percent mentored. In comparison, among members of the general adult population, 21.3 percent tutored or taught, and 17.6 percent mentored youth. In fact, tutoring, teaching and mentoring are the most common volunteer activities for college students, when they are analyzed as a group. For both males and females, tutoring and teaching, followed by mentoring, were the most popular activities. The trend was similar for whites and other races.25 For black/African Americans,
however, mentoring was the most popular volunteer activity, followed by tutoring or teaching (see Figures 9 and 10).
Following tutoring, teaching and mentoring, other popular activities for college students included fundraising or selling items to raise money (23.1%); collecting, preparing, distributing, or serving food (20.5%); and engaging in general labor or supplying transportation for people (19.9%). The popularity of some volunteer activities differed by gender, with female college students being more likely to fundraise, while male college students were more likely to engage in general labor or supply transportation.
13
0% 5% 10% 15% 20% 25% 30% 35%
Females
Males
Figure 9. What activities do college students perform, by gender?
Engage in general labor or supply transportation for people
Collect, prepare, distribute,or serve food
Fundraise or sell items to raise money
Mentor
Tutor or teach
15.7%
20.6%
24.2%
21%
20.5%
21.5%
20.4%
26%
26%
30.4%
0% 5% 10% 15% 20% 25% 30% 35% 40% 45%
White
Black/African American
Other
Figure 10. What activities do college students perform, by race?
33.7%
20.2%
15.9%
9.2%
22.6%
32.2%
39.2%
22.0%
29.6%
14.0%20.3%
20.5%
23.9%
22.3%
25.3%
Engage in general labor or supply transportation for people
Collect, prepare, distribute,or serve food
Fundraise or sell items to raise money
Mentor
Tutor or teach

COLLEGE STUDENTS HELPING AMERICA
State Rankings of College Student Volunteering
In Volunteering in America: State Trends and Rankings,26 we reported that the general adult population (age 16+) volunteering rate varied from 48 percent to 18.8 percent among states and the District of Columbia. We also found that volunteering rates among college students varied considerably by state, with rates ranging from 21.4 percent to 62.9 percent. Table 5 compares each state’s adult volunteering rate to its college student volunteering rate27 while the United States map further illustrates the geographical differences in the college student rates.
We find that the ranking of states on college student volunteering does not always follow the states’ adult volunteer ranking. In fact, more often than not, a states’ college student volunteering rate differs from its overall adult volunteering rate. We do find that six of the ten states that rank in the top ten, based on the adult volunteering rate, also rank in the top ten for their college student volunteering rate. At the same time, the sometimes wide variation between a state’s adult volunteer ranking and its college volunteer ranking shows that a high rate among adults or college students does not necessarily translate into a high rate with the other.
14
C O L L E G E S T U D E N T V O L U N T E E R I N G R A T E S B Y S T A T E *
Th is map illustrates diff erences between the states in their rates of volunteering among college students
for 2003 to 2005. Over 3 million people attending college performed volunteer work per year over the 3 year
period, for a college student volunteering rate of 30.5%. During this same period, the state college volunteer-
ing rates ranged from 21.4% to 62.9%.
Rate = More than 37%
Rate = 33%–37%
Rate = 31%–32%
Rate = 27%–30%
Rate = Less than 27%
*Rankings are based on 3-year rate for 2003–2005.
T O P S T A T E S
1. Utah 6. Wyoming 11. Washington 2. Idaho 7. Alaska 3. Oklahoma 8. Minnesota 4. Vermont 9. Missouri 5. Nebraska 10. Colorado
For more information, including detailed state-level volunteering tables for 2002–2005, go to www.nationalservice.gov

COLLEGE STUDENTS HELPING AMERICA 15
Volunteering Rate State Rank Volunteering Rate State
RankAlabama 28.9% 32 34.8% 16Alaska 38.9% 5 40.1% 7Arizona 24.9% 45 30.8% 32Arkansas 25.6% 43 31.7% 22California 26.1% 40 28.5% 38Colorado 32.8% 17 38.3% 10Connecticut 30.8% 21 31.5% 23Delaware 26.7% 37 26.4% 42District of Columbia 30.8% 22 31.0% 30Florida 24.1% 48 25.9% 43Georgia 25.9% 41 21.4% 51Hawaii 25.4% 44 29.6% 35Idaho 35.5% 14 44.4% 2Illinois 29.7% 28 31.2% 27Indiana 29.5% 29 37.3% 13Iowa 39.2% 4 31.1% 29Kansas 38.6% 8 31.5% 24Kentucky 29.8% 27 30.4% 33Louisiana 22.7% 49 27.8% 40Maine 33.2% 16 31.4% 25Maryland 30.3% 25 30.2% 34Massachusetts 27.0% 36 24.0% 47Michigan 32.1% 18 37.4% 12Minnesota 40.7% 3 39.9% 8Mississippi 26.4% 39 33.1% 20Missouri 31.9% 20 38.9% 9Montana 37.9% 10 34.6% 17Nebraska 42.8% 2 41.5% 5Nevada 18.8% 51 23.6% 49New Hampshire 32.0% 19 32.0% 21New Jersey 26.5% 38 25.0% 45New Mexico 28.5% 33 31.3% 26New York 21.3% 50 23.4% 50North Carolina 29.1% 30 28.8% 37North Dakota 36.5% 13 33.7% 19Ohio 30.7% 24 34.4% 18Oklahoma 30.0% 26 43.0% 3Oregon 33.6% 15 31.1% 28Pennsylvania 30.8% 23 35.1% 15Rhode Island 24.9% 46 25.8% 44South Carolina 28.0% 35 28.3% 39South Dakota 38.8% 6 31.0% 31Tennessee 25.9% 42 24.0% 48Texas 28.3% 34 29.2% 36Utah 48.0% 1 62.9% 1Vermont 38.1% 9 41.5% 4Virginia 29.0% 31 24.6% 46
West Virginia 24.6% 47 27.4% 41Washington 36.8% 12 37.6% 11
State
General Adult Population College Students, ages 16-24
Table 5. States’ General Adult Population Volunteer Rates vs. States’ College Student Volunteer Rates, 2003-2005
Wisconsin 37.0% 11 36.2%Wyoming 38.8% 7 40.3%
146

COLLEGE STUDENTS HELPING AMERICA
The Future of College Student Volunteering
The years spent in college provide an opportunity to foster and sustain volunteering and civic engagement behaviors among incoming undergraduates who volunteered in high school, as well as to develop those behaviors in college students who have never volunteered in the past.28 Those efforts are extremely important given researchers’ suggestion that volunteering as a youth is a strong predictor of volunteering later in life.29 Despite the encouraging findings in this report, some researchers have started questioning the nature of volunteering among young people. Research conducted by Friedland and Morimoto30 argues that many youth volunteer out of self-interest and to “pad their resume.”31 Similarly, Helen Marks and Susan Jones32 have found that volunteering increases are occurring among those who volunteer for situational purposes, rather than among those who view volunteering as an expression of their core values.
There is cause for optimism, however. Regardless of young adults’ motivations for volunteering, there are positive outcomes for communities and students. Communities benefit from the valuable services provided by students,33 and students can begin to shape their civic interests and participation. Researchers note that quality volunteering experiences can have a significant impact on young people’s civic attitudes and behaviors.34 America’s future college volunteers—today’s high school students—are being introduced to volunteering and service in record numbers and demonstrating positive pro-social behaviors.
In Our Youth Helping America 35 series, we found that 31 percent of high school students had participated in school-based service in the past year. More importantly, when students participate in quality service activities—that is, when they are given the opportunity to shape their activities and reflect on their experiences—they are more likely to demonstrate other positive civic attitudes and behaviors.36
There are other promising signs among what is being characterized as the “9/11 Generation.” Recent research highlights the record high levels of commitment to civic and social responsibility among incoming freshman. In 2005, the Higher Education Research Institute (HERI) reported that two-thirds of entering college students believed it was very important to help others, which is the highest percentage in the last 25 years.37 Similarly, HERI found a nine-year high in the percentage of entering college students (25.6%) that report that it is essential or very important to personally participate in community action programs.38
The most significant impact on the future of college student volunteering may be the consistently high volunteering rates among high school and college students, coupled with the rising number of young adults attending college. As described in this report, between 2002 and 2005 the number of college student volunteers increased from 2.7 million to nearly 3.3 million. As the proportion of young adults enrolling in college continues to rise, the effects on volunteering numbers may be significant. According to the National Center on Education Statistics,39 in the ten years between 1994 and 2004, enrollment in degree-granting
16

COLLEGE STUDENTS HELPING AMERICA
postsecondary institutions increased by 21 percent, surpassing a 17 percent increase between 1984 and 1994. Projecting into the future, the National Center on Education Statistics predicts that by 2010, over 18.8 million people will enroll annually in postsecondary institutions. By 2014, the number of annual enrollments will be more than 19.4 million. With the projected growth in the number of college students and strong support for service on campus, the number of college volunteers could increase substantially over the coming years.
Concurrent with rising youth volunteering and college enrollments, however, there are shifts in higher education that may present some challenges to college student volunteering rates in the future. Rising tuition might somewhat adversely affect volunteering rates as more students work more hours to pay for their education. The College Board, in its Trends in College Pricing, 2005,40 noted that tuition and fees at 4-year public colleges and universities increased 7.1 percent between the 2004-2005 and 2005-2006 school years. Using College Board data and similar estimates, the Educational Policy Institute predicted that tuition at public 4-year colleges and universities will increase to $8,552 by 2014-2015 and to $11,972 by 2024-2025.41
These increases in tuition may result in an increased use of student loans, and a greater number of students working more hours.42 Already researchers have documented this trend. Students report a growing anxiety over their ability to finance their education43 and a growing number of college students are working, or planning to work,44 while attending school. In some
instances, students are spending more time working and less time studying.45
The consequences for college student volunteering may be important to watch. Large student loans increase the likelihood that a student will stop volunteering.46 As described in this report, volunteering rates varied by the number of hours a student works while attending college. Students working the fewest hours had the highest volunteering rate, and the volunteering rate declined as students worked additional hours up to full-time work status. If an increasing number of students increase their work hours to pay for college,47 the number of college volunteers and/or the number of volunteer hours given by college students could decline.
Despite these challenges, the positive trends in college student volunteering and record number of students who will attend college in the coming years present an opportunity to provide these students with quality volunteer experiences, whether through service-learning, alternative spring breaks, AmeriCorps, work-study, or a local community organization. Colleges and other non-profit organizations can seize this opportunity to collaborate on service projects that both meet students’ interests and work toward the goal of engaging five million college students by 2010. While bolstering America’s civic traditions, the effort has the potential to substantially increase the number of children tutored and mentored, the amount of food distributed to people in need, the number of homes rebuilt after a disaster, and the amount of funds raised for charity.
17

COLLEGE STUDENTS HELPING AMERICA18
FOOTNOTES
EXECUTIVE SUMMARY1 The 2002 data include results from September 2001 to September 2002, thus including volunteering that occurred in the year immediately after the September 11 attacks. The September 2005 survey asks individuals not only if they volunteer, but also where they volunteer, how they volunteer and how often they volunteer. Results do not include data since Hurricane Katrina.
FULL REPORT 1 J.R. Ferrari & M.J. Bristow, Are We Helping Them Serve Others? Student Perceptions of Campus Altruism in Support of Community Service Motives, Education, 125(3), 2005: 404-413. S. Dodge, Colleges Urge Students to do Community Service Work: Some Even Require It, Chronicle of Higher Education 36(38), 1990:A1 & A30.2 R. Putnam, Bowling Alone: The Collapse and Revival of American Community (New York: Simon and Schuster, 2000).3 J.R. Ferrari & M.J. Bristow, 2005. M.J. Gray, E.H. Ondaatje, R.D. Fricker, Jr., & S.A. Geschwind, 2000. H.M. Marks & S.R. Jones, Community Service in Transition, The Journal of Higher Education 75(3), 2004: 307-339.4 M.J. Gray, E.H. Ondaatje, R.D. Fricker, Jr., & S.A. Geschwind, Assessing Service-Learning: Results from a Survey of “Learn and Serve America, Higher Education,” Change, 2000: 30-39.5 J.R. Ferrari & M.J. Bristow, Are We Helping Them Serve Others? Student Perceptions of Campus Altruism in Support of Community Service Motives, Education, 125(3), 2005: 404-413. S. Dodge, Colleges Urge Students to do Community Service Work: Some Even Require It, Chronicle of Higher Education 36(38), 1990:A1 & A30.6 M. Gwynne. A Place for National Service in Higher Education. Educational Record 70(3-4), 1989: 66-70. R.G. Bringle & J.A. Hatcher, Implementing Service Learning in Higher Education, Journal of Higher Education, 67(2), 1996: 221-239. R.T. Taylor & M.C. Keim, Student Community Service Programs in Illinois Public Universities. College Student Affairs Journal 18(2), 1999: 81-91.7 E. Brown, The Scope of Volunteer Activity and Public Service, Law and Contemporary Problems 62(4), 1999: 17-42. S.B. White, Volunteering in the United States, 2005, Monthly Labor Review. (Washington, D.C.: U.S. Department of Labor, Bureau of Labor Statistics, 2006).8 R.G. Niemi, M.A. Hepburn, & C. Chapman, Community Service by High School Students: A Cure for Civic Ills? Political Behavior 22(1), 2000: 45-69.9 M.J. Gray, E.H. Ondaatje, R.D. Fricker, Jr., & S.A. Geschwind, 2000. 10 S.J. Myers-Lipton, Effect of a Comprehensive Service-Learning Program on College Students’ Civic Responsibility. Teaching Sociology 26(4), 1998: 243-258.11 The CPS only asks respondents between the ages of 16-24 about school enrollment. As a result, “young adult college student” is defined as a respondent between the ages of 16-24, who was
enrolled in a post-secondary institution (i.e., college, university, technical school) in the week prior to the administration of the CPS. The primary strength of the CPS Volunteering Supplement is the size of its sample, which permits detailed analysis of narrowly defined subpopulations. In a typical annual September Volunteer Supplement dataset, about 13,000 respondents [unweighted] to the Volunteer Supplement fall within this age range. About 3,800 of these respondents are college students, and of these, about 1,200 are volunteers. See the Technical Note for more detailed information about the CPS. 12 This report uses the CPS definition of “volunteer.” Specifically, “volunteers are persons who performed unpaid volunteer activities at any point from September 1 of the survey year through the survey period in September of the following year. The count of volunteers only includes persons who volunteered through or for an organization; the data do not include persons who volunteered in a more informal manner.”13 The volunteering data in this report were collected for volunteer services performed before September 2005. Therefore, the data do not reflect volunteering in response to Hurricane Katrina. Data on volunteering in the year following Hurricane Katrina will be collected in September 2006 and will be available in summer 2007.14 The CPS only includes questions about school enrollment to respondents between the ages of 16-24. As a result, the college student information presented in this report reflects only 16-24 year olds enrolled in post-secondary higher education institutions. Defining “college-age” students using the 16-24 age range excludes, among others, graduate students over the age of 25 as well as “non-traditional” undergraduates.15 The 2002 volunteer rate, 27.1 percent, represents volunteering between September 2001 and September 2002.16 See for example, the report entitled, America’s Civic Health Index: Broken Engagement (Washington, D.C.: National Conference on Citizenship, 2006). 17 Corporation for National and Community Service, Volunteering in America: State Trends and Rankings, (Washington, DC: Corporation for National and Community Service, 2006).18 Includes Alaskan Native, American Indian, Asian, Hawaiian/Pacific Islander, and those indicating more than one race.19 M. Moffatt, College Life: Undergraduate Culture and Higher Education, Journal of Higher Education 62(1), 1991: 44-61.20 L.J. Sax, Our Incoming Students: What are They Like? About Campus, 2003: 5-20.21 L.A. Friedland & S. Morimoto, The Changing Lifeworld of Young People: Risk, Resume-Padding, and Civic Engagement, The Center for Information and Research on Civic Learning & Engagement (CIRCLE) Working Paper 40, 2005: 13.22 Ibid., 13.23 J. Wilson, Volunteering, Annual Review of Sociology, 26, 2000: 220-221.24 Prior to 2005, mentoring, tutoring, teaching, coaching, and

COLLEGE STUDENTS HELPING AMERICA 19
refereeing were included in one response category. In 2005, the CPS separated the category into three categories: 1) mentoring; 2) tutoring and teaching; and 3) coaching, refereeing, or supervising a sports team. As a result, a more in-depth analysis was possible. The 2005 data suggests tutoring, teaching and mentoring were the most common activities in this category, with significantly fewer responses for coaching and refereeing. 25 Includes Alaskan Native, American Indian, Asian, Hawaiian/Pacific Islander, and those indicating more than one race.26 Corporation for National and Community Service, 2006.27 Data for these tables were collected from 2003-2005, and were derived from the Current Population Survey (CPS). We used three years of data to ensure an adequate number of cases per state. 28 S. Oesterle, M.K. Johnson, & J.T. Mortimer, Volunteerism During the Transition to Adulthood: A Life Course Perspective. Social Forces 82(3), 2004: 1123-1149.29 E. Brown, 1999. A.W. Astin, L.J. Sax, & J. Avalos, Long-term Effects of Volunteerism During the Undergraduate Years. The Review of Higher Education, 22.2, 1999: 187-202.30 L.A. Friedland & S. Morimoto, 2005.31 Ibid.: 3.32 H.M. Marks & S.R. Jones, 2004.33 Ibid.34 S. Oesterle, M.K. Johnson, & J.T. Mortimer, 2004.35 Corporation for National and Community Service, Educating for Active Citizenship: Service-Learning, School-based Service, and Civic Engagement, Brief 2 in the Youth Helping America Series
(Washington, D.C.: Corporation for National and Community Service, 2006).36 Hedin, D. P. (1989). The Power of Community Service. Proceedings of the Academy of Political Science 37(2), Caring for America’s Children, 201-213.37 Higher Education Research Institute, The American Freshman: National Norms for Fall 2005. (Los Angeles: University of California, 2005).38 Ibid.39 U.S. Department of Education, National Center for Education Statistics, Digest of Education Statistics, 2004, (Washington, D.C., 2004).40 College Board, Trends in College Pricing, 2005.41 Educational Policy Center, Tuition Prices: History and Future, 2004.42 S.A. Nonis & G.I. Hudson, Academic Performance of College Students: Influence of Time Spent Studying and Working, Journal of Education for Business, 2006: 151-159.43 L.J. Sax, 2003.44 Ibid.45 S.A. Nonis & G.I. Hudson, 2006.46 H.M. Marks & S.R. Jones, 2004.47 S.A. Nonis & G.I. Hudson, 2006.

COLLEGE STUDENTS HELPING AMERICA
TECHNICAL NOTE
The purpose of this technical note is to document data sources, identify differences in the survey instrument from year to year, address issues of statistical reliability, and define terms used in the report. Readers requiring further technical information should refer to the technical notes prepared for the report, Volunteering in America: State Trends and Rankings 2002–2005, and to the technical notes prepared by Bureau of Labor Statistics for each of the annual reports on Volunteering in the United States from 2002 to 2005.
The data used in this report were collected through a supplement to the September 2002, 2003, 2004, and 2005 Current Population Survey (CPS). The CPS is a monthly survey of about 60,000 households conducted by the U.S. Census Bureau for the Bureau of Labor Statistics. It focuses on obtaining information on employment and unemployment among the nation’s civilian noninstitutional population age 16 or older. The purpose of this supplement is to obtain information on the incidence of volunteering and the characteristics of volunteers in the United States.
Reliability of the Estimates
Statistics based on the CPS are subject to both sampling and nonsampling error. When a sample, rather than the entire population, is surveyed, there is a chance that the sample estimates may differ from the “true” population values they represent. The exact difference, or sampling error, varies depending on the particular sample selected, and this variability is measured by the standard error of the estimate. There is about a 90 percent chance, or level of confidence, that an estimate based on a sample will differ by no more than 1.6 standard errors from the “true” population value because of sampling error.
The CPS data also are affected by nonsampling error. Nonsampling error can occur for many reasons, including the failure to sample a segment of the population, inability to obtain information for all respondents in the sample, inability or unwillingness of respondents to provide correct information, and errors made in collecting or processing the data.
COMMON TERMS
College
College, as defined in this report, refers to any post-secondary higher education institution. Therefore, it includes colleges, universities, and technical and vocational schools.
College Student
College student, as defined in this report, is a respondent between the ages of 16 to 24, who was enrolled in a post-secondary institution. College student includes undergraduate and graduate students, as well as students enrolled in a technical or vocational school.
The CPS only includes questions about college enrollment for respondents between the ages of 16 and 24. That is close to what many people mean when they say “college age,” but the CPS data do not allow for the identification of other subgroups of college students, such as college students over age 24.
Employed
Persons 16 years of age and over in the civilian noninstitutional population who, during the reference week, (a) did any work at all (at least 1 hour) as paid employees; worked in their own business, profession, or on their own farm, or worked 15 hours or more as unpaid workers in an enterprise operated by a member of the family; and (b) all those who were not working but who had jobs or businesses from which they were temporarily absent because of vacation, illness, bad weather, childcare problems, maternity or paternity leave, labor-management dispute, job training, or other family or personal reasons, whether or not they were paid for the time off or were seeking other jobs. Each employed person is counted only once, even if he or she holds more than one job.
General Adult Population
General adult population refers to any non-institutionalized civilian over the age of 16.
20

COLLEGE STUDENTS HELPING AMERICA
Not in the Labor Force
Includes persons aged 16 years and older in the civilian noninstitutional population who are neither employed nor unemployed in accordance with the definitions contained in this glossary. Information is collected on their desire for and availability for work, job search activity in the prior year, and reasons for not currently searching.
Organizations and Activities
For the purpose of this CPS supplement, organizations are grouped into major categories, including religious, youth, and social or community service organizations. In 2005, immigrant/refugee assistance was added to the questionnaire; however, few people reported volunteering for immigrant/refugee assistance organizations and because the group was not a definite subset of any of the major organization categories, those persons who did report that they volunteered for immigrant/refugee assistance organizations were placed in the “other” group.
The main organization is the organization for which the volunteer worked the most hours during the year. If a respondent volunteered for only one organization, it was considered the main organization. To identify the type of main organization, respondents had to provide information about the organization and, for those who volunteered for more than one organization, annual hours worked for each.
Undergraduate Student
The definition of an undergraduate student is a respondent who was between the ages of 16 to 24, enrolled in a postsecondary institution, and who had not yet received a Bachelor’s degree or higher at the time of the survey.
Volunteers
Volunteers are persons who performed unpaid volunteer activities at any point from September 1 of the survey year through the survey period in September of the following year. The count of volunteers only includes persons who volunteered through or for an organization; the data do not include persons who volunteered in a more informal manner.
Young Adult
A young adult is defined in this report as a respondent between the ages of 16 to 24. Note that young adult includes college students, as well as high school students.
WEIGHT ESTIMATION
The final weight for each case is the product of the inverse of the selection probability (accounting for selection to the CPS and selection into the volunteer survey), a weight adjustment to account for noninterviews, a first-stage weighting factor to reduce the variance due to the selection on non-self-representing primary sampling units (PSUs), and a second-stage weighting factor to bring sample estimates into agreement independent population controls by age, race, and sex.
21

COLLEGE STUDENTS HELPING AMERICA22
REFERENCES Astin, A. W., Sax, L. J., & Avalos, J. (1999). Long-term Effects of Volunteerism During the Undergraduate Years. The Review of Higher Education, 22.2, 187-202. Bringle, R. G. & Hatcher, J. A. (1996). Implementing Service-Learning in Higher Education. Journal of Higher Education, 67(2), 221-239. Brown, E. (1999). The Scope of Volunteer Activity and Public Service. Law and Contemporary Problems 62(4), 17-42. College Board. (2005). Trends in College Pricing, 2005. Corporation for National and Community Service. (2006). Educating for Active Citizenship: Service-Learning, School-based Service, and Civic Engagement. Brief 2 in the Youth Helping America Series. Washington, D.C.: Corporation for National and Community Service. Corporation for National and Community Service. (2006). Volunteering in America: State Trends and Rankings. Washington, DC: Corporation for National and Community Service.
Dodge, S. (1990). Colleges Urge Students to Do Community Service Work: Some Even Require It. Chronicle of Higher Education 36(38), A1 & A30. Educational Policy Center. (2004). Tuition Prices: History and Future. Ferrari, J. R., & Bristow, M. J. (2005). Are We Helping Them Serve Others? Student Perceptions of Campus Altruism in Support of Community Service Motives. Education, 125(3), 404-413. Friedland, L. A. & Morimoto, S. (2005). The Changing Lifeworld of Young People: Risk, Resume-Padding, and Civic Engagement. The Center for Information and Research on Civic Learning & Engagement (CIRCLE) Working Paper 40. Gray, M. J., Ondaatje, E. H., Fricker, Jr., R. D., & Geschwind, S. A. (2000). Assessing Service- Learning: Results from a Survey of “Learn and Serve America, Higher Education.” Change, 30-39. Gwynne, M. (1989). A Place for National Service in Higher Education. Educational Record 70(3-4), 66-70. Hedin, D. P. (1989). The Power of Community Service. Proceedings of the Academy of Political Science 37(2), Caring for America’s Children, 201-213.

COLLEGE STUDENTS HELPING AMERICA 23
Higher Education Research Institute. (2005). The American Freshman: National Norms for Fall 2005. Los Angeles: University of California. Horn, L., Wei, C.C., & Berker, A. (2002). What Students Pay for College: Changes in Net Price of College Attendance Between 1992-93 and 1999-2000. Washington, DC: U.S. Department of Education, National Center for Education Statistics. Jones, S. R., & Hill, K. E. (2003). Understanding Patterns of Commitment. The Journal of Higher Education, 74(5), 516-539. Marks, H. M. & Jones, S. R. (2004). Community Service in Transition. The Journal of Higher Education 75(3), 307-339. Moffatt, M. (1991). College Life: Undergraduate Culture and Higher Education. Journal of Higher Education 62(1), 44-61. Myers-Lipton, S. J. (1998). Effect of a Comprehensive Service-Learning Program on College Students’ Civic Responsibility. Teaching Sociology 26(4), 243-258. National Conference on Citizenship. (2006). America’s Civic Health Index: Broken Engagement. Washington: D.C.: National Conference on Citizen ship, Center for Information and Research on Civic Learning & Engagement (CIRCLE), and Saguaro Seminar.
Niemi, R. G., Hepburn, M. A., & Chapman, C. (2000). Community Service by High School Students: A Cure for Civic Ills? Political Behavior 22(1), 45-69. Nonis, S. A., & Hudson, G. I. (2006). Academic Performance of College Students: Influence of Time Spent Studying and Working. Journal of Educa tion for Business, 151-159. Oesterle, S., Johnson, M. K., & Mortimer, J T. (2004). Volunteerism During the Transition to Adulthood: A Life Course Perspective. Social Forces 82(3), 1123-1149. Putnam, R. (2000). Bowling Alone: The Collapse and Revival of American Community. New York: Simon & Schuster. Sax, L. J. (2003). Our Incoming Students: What are They Like? About Campus, 15-20. Sax, L. J., Lindholm, J. A., Astin, A. W., Korn, W. S., & Mahoney, K. M. (2002). The American Freshman: National Norms for Fall 2002. Los Angeles, CA: Higher Education Research Institute, University of California, Los Angeles Taylor, R. T. & Keim, M. C. (1999). Student Community Service Programs in Illinois Public Universities. College Student Affairs Journal 18(2), 81-91. U.S. Department of Education, National Center for Education Statistics. (2004). Digest of Education Statistics, Washington, D.C. Vogelgesang, L. J., & Astin, A. W. (2005). Post-College Civic Engagement Among Graduates. Research report. Los Angeles, CA: Higher Education Research Institute, University of California, Los Angeles White, S. B. (2006). Volunteering in the United States, 2005. Monthly Labor Review. Washington, D.C.: U.S. Department of Labor, Bureau of Labor Statistics. Wilson, J. (2000). Volunteering. Annual Review of Sociology 26, 215-246.

COLLEGE STUDENTS HELPING AMERICA

CORPORATION FOR NATIONAL AND COMMUNITY SERVICE1201 NEW YORK AVENUE, NWWASHINGTON, DC 20525
Tel.: (202) 606-5000
TTY: (202) 606-3472
e-mail: [email protected]
www.nationalservice.gov


