COLLISION AVOIDANCE FOR AIRPORT TRAFFIC SIMULATION EVALUATION Denise R. Jones, Lawrence J. Prinzel, III, Kevin J. Shelton, and Randall E. Bailey National Aeronautics and Space Administration, Hampton, VA Sharon D. Otero and Glover D. Barker, Lockheed Martin Mission Services, Hampton, VA Abstract A Collision Avoidance for Airport Traffic (CAAT) concept for the airport Terminal Maneuvering Area (TMA) was evaluated in a simulation study at the National Aeronautics and Space Administration (NASA) Langley Research Center. CAAT is being designed to enhance surface situation awareness and provide cockpit alerts of potential conflicts during runway, taxi, and low altitude air-to-air operations. The purpose of the study was to evaluate pilot reaction to conflict events in the TMA near the airport, different alert timings for various scenarios, alerting display concepts, and directive alerting concepts. This paper gives an overview of the conflict detection and resolution (CD&R) concept, simulation study, and test results. Introduction The Next Generation Air Transportation System (NextGen) concept for the year 2025 and beyond envisions the movement of large numbers of people and goods in a safe, efficient, and reliable manner [1, 2]. NextGen will remove many of the constraints in the current air transportation system, support a wider range of operations, and deliver an overall system capacity up to three times that of current operating levels. Emerging NextGen operational concepts [3], such as four-dimensional trajectory (4DT) – based airborne and surface operations, equivalent visual operations, and super density arrival and departure operations, represent a different approach to air traffic management and as a result, a dramatic shift in the tasks, roles, and responsibilities for the flight deck and Air Traffic control (ATC) to ensure a safe, sustainable air transportation system. NASA has initiated a Collision Avoidance for Airport Traffic (CAAT) research topic to develop technologies, data, and guidelines to enable conflict detection and resolution (CD&R) in the Terminal Maneuvering Area (TMA) under current and emerging NextGen operating concepts. The goal of CAAT is to provide an additional, protective safety layer of CD&R for NextGen TMA operations. CAAT builds on substantial NASA research and testing for surface operations situation awareness and runway incursion conflict detection and alerting (i.e., the Runway Incursion Prevention System) [4, 5, 6, 7]. CAAT concepts use cockpit display designs to promote surface situation awareness and add associated CD&R concepts for safety assurance. The concepts employ continual own-ship and traffic data monitoring and algorithms to detect conflicts on the runway, at low altitudes near the airport, and during taxi operations. Indications and alerts create awareness of traffic in the event that TMA safety or operational conditions may warrant flight crew response. A piloted simulation study was conducted to evaluate initial CAAT concepts for NextGen, including pilot reaction to conflict events for runway, taxi, and low altitude conflict scenarios; variations on alert generation timing; indication and alerting display concepts; and directive alerting concepts. This paper will present an overview of the CD&R concept, simulation study, and test results. System Description Simulation Facility Flight Deck Simulator This research was conducted in the Research Flight Deck (RFD) simulator at NASA Langley Research Center (Figure 1). The simulated aircraft dynamics model was a medium to long-haul commercial passenger aircraft. The RFD configuration is a fixed-based, dual-pilot simulator with a collimated 200º panoramic out-the-window scene. Operations were conducted at the Chicago O’Hare International (ORD) airport. The out-the- window scene included realistic taxiways and runways with appropriate markings, airport lighting, https://ntrs.nasa.gov/search.jsp?R=20100035760 2018-07-29T20:10:57+00:00Z
Transcript
COLLISION AVOIDANCE FOR AIRPORT TRAFFIC SIMULATION EVALUATION
Denise R. Jones, Lawrence J. Prinzel, III, Kevin J. Shelton, and Randall E. Bailey
National Aeronautics and Space Administration, Hampton, VA
Sharon D. Otero and Glover D. Barker, Lockheed Martin Mission Services, Hampton, VA
Abstract A Collision Avoidance for Airport Traffic
(CAAT) concept for the airport Terminal Maneuvering Area (TMA) was evaluated in a simulation study at the National Aeronautics and Space Administration (NASA) Langley Research Center. CAAT is being designed to enhance surface situation awareness and provide cockpit alerts of potential conflicts during runway, taxi, and low altitude air-to-air operations. The purpose of the study was to evaluate pilot reaction to conflict events in the TMA near the airport, different alert timings for various scenarios, alerting display concepts, and directive alerting concepts. This paper gives an overview of the conflict detection and resolution (CD&R) concept, simulation study, and test results.
Introduction The Next Generation Air Transportation System
(NextGen) concept for the year 2025 and beyond envisions the movement of large numbers of people and goods in a safe, efficient, and reliable manner [1, 2]. NextGen will remove many of the constraints in the current air transportation system, support a wider range of operations, and deliver an overall system capacity up to three times that of current operating levels. Emerging NextGen operational concepts [3], such as four-dimensional trajectory (4DT) – based airborne and surface operations, equivalent visual operations, and super density arrival and departure operations, represent a different approach to air traffic management and as a result, a dramatic shift in the tasks, roles, and responsibilities for the flight deck and Air Traffic control (ATC) to ensure a safe, sustainable air transportation system.
NASA has initiated a Collision Avoidance for Airport Traffic (CAAT) research topic to develop technologies, data, and guidelines to enable conflict detection and resolution (CD&R) in the Terminal Maneuvering Area (TMA) under current and emerging NextGen operating concepts. The goal of
CAAT is to provide an additional, protective safety layer of CD&R for NextGen TMA operations. CAAT builds on substantial NASA research and testing for surface operations situation awareness and runway incursion conflict detection and alerting (i.e., the Runway Incursion Prevention System) [4, 5, 6, 7].
CAAT concepts use cockpit display designs to promote surface situation awareness and add associated CD&R concepts for safety assurance. The concepts employ continual own-ship and traffic data monitoring and algorithms to detect conflicts on the runway, at low altitudes near the airport, and during taxi operations. Indications and alerts create awareness of traffic in the event that TMA safety or operational conditions may warrant flight crew response.
A piloted simulation study was conducted to evaluate initial CAAT concepts for NextGen, including pilot reaction to conflict events for runway, taxi, and low altitude conflict scenarios; variations on alert generation timing; indication and alerting display concepts; and directive alerting concepts. This paper will present an overview of the CD&R concept, simulation study, and test results.
System Description
Simulation Facility Flight Deck Simulator
This research was conducted in the Research Flight Deck (RFD) simulator at NASA Langley Research Center (Figure 1). The simulated aircraft dynamics model was a medium to long-haul commercial passenger aircraft. The RFD configuration is a fixed-based, dual-pilot simulator with a collimated 200º panoramic out-the-window scene. Operations were conducted at the Chicago O’Hare International (ORD) airport. The out-the-window scene included realistic taxiways and runways with appropriate markings, airport lighting,
and other aircraft in various simulated weather/lighting conditions. The visual acuity of the out-the-window scene provided approximately 20/40 visual acuity. The RFD was equipped with a 30º horizontal x 24º vertical field-of-view stroke-on-raster head-up display located on the left or captain’s side.
As shown in Figure 1, the simulator had four large main instrument panel displays referred to as: (left to right) Pilot’s Primary Flight Display (PFD), Pilot’s Navigation Display (ND), Co-pilot’s ND, and Co-pilot’s PFD. The four display panels were Liquid Crystal Displays with 13.25” x 10.5” viewable space at 1280 x 1024 resolution.
Figure 1. RFD Flight Deck
Two Electronic Flight Bags (EFBs) were installed. Each provided a display resolution of 1024 x 768 pixels over a 10.4” diagonal area. The EFBs were mounted above and outboard of the sidestick control inceptors. The EFB was used as a flight crew’s interface for ATC data-link communications (i.e., Controller-Pilot Data-Link Communications, CPDLC) and electronic airport maps and charts.
An ATC environment was simulated using auditory and data-link messages for own-ship instructions. The ATC messages were triggered based on specific events and timings to coincide with the task scenario.
Traffic data was integral to the CAAT concepts. Traffic data was “broadcast” at a 1 Hz rate, loosely mimicking an Automatic Dependent Surveillance-Broadcast (ADS-B)-In environment. However, no latency in traffic position or imprecision was added. Own-ship position data was updated at a 50 Hz rate. Stationary and moving traffic were simulated to represent a heavy traffic flow in the airport environment.
Flight Deck Displays The PFD, ND, and Engine Indication and Crew
Alerting System display (EICAS) were modeled after current state-of-the-art production aircraft. Additions from this baseline were made to accommodate CAAT surface and airborne traffic and route awareness.
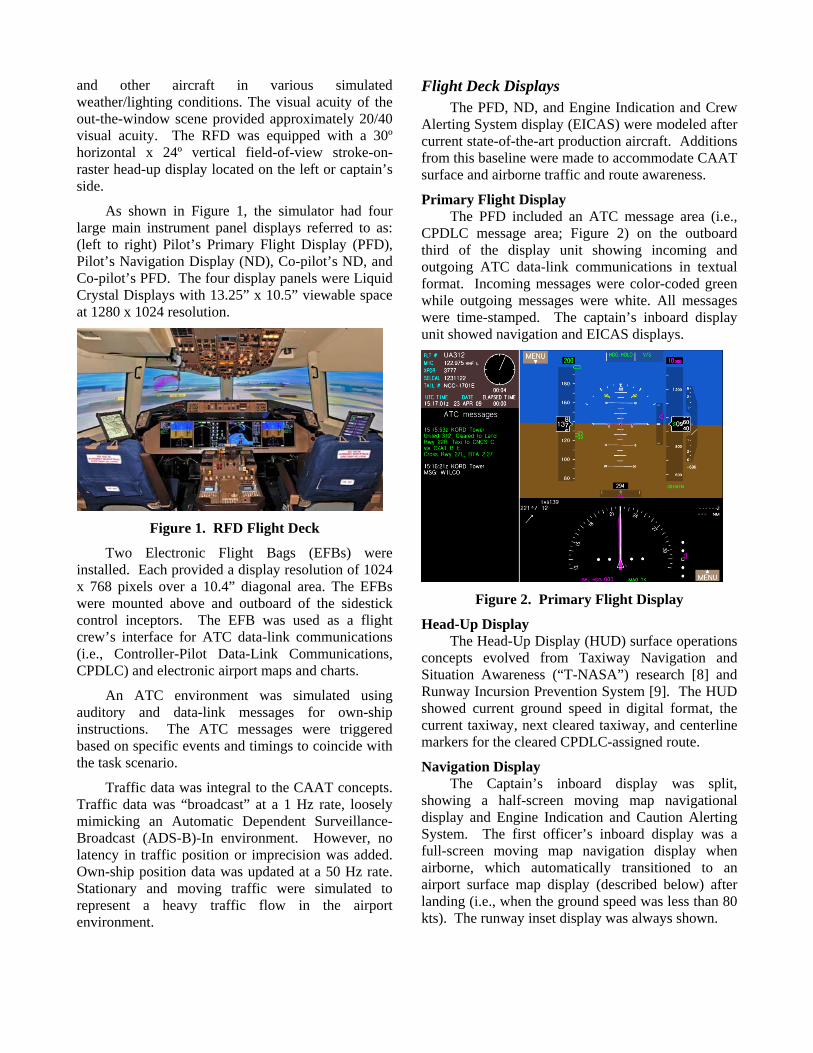
Primary Flight Display The PFD included an ATC message area (i.e.,
CPDLC message area; Figure 2) on the outboard third of the display unit showing incoming and outgoing ATC data-link communications in textual format. Incoming messages were color-coded green while outgoing messages were white. All messages were time-stamped. The captain’s inboard display unit showed navigation and EICAS displays.
Figure 2. Primary Flight Display
Head-Up Display The Head-Up Display (HUD) surface operations
concepts evolved from Taxiway Navigation and Situation Awareness (“T-NASA”) research [8] and Runway Incursion Prevention System [9]. The HUD showed current ground speed in digital format, the current taxiway, next cleared taxiway, and centerline markers for the cleared CPDLC-assigned route.
Navigation Display The Captain’s inboard display was split,
showing a half-screen moving map navigational display and Engine Indication and Caution Alerting System. The first officer’s inboard display was a full-screen moving map navigation display when airborne, which automatically transitioned to an airport surface map display (described below) after landing (i.e., when the ground speed was less than 80 kts). The runway inset display was always shown.
Surface Map Display The surface map display (Figure 3) was an
enhanced version of the track-up navigation display.
Surface and airborne traffic icons were shown using ADS-B In data. The design largely reflects current Radio Technical Commission for Aeronautics (RTCA) Special Committee (SC)-183 working group findings with regard to element shape and color assignments. The traffic icons were displayed as medium tan chevrons when on the surface and cyan when airborne. The own-ship icon was a large white chevron.
Own-ship’s cleared taxi route was graphically depicted in magenta. The taxi route was also written at the bottom of the surface map with the current location highlighted in magenta. The Evaluation Pilots (EPs) could change the map scale as desired with a lowest setting of 0.5 nm.
An inset runway display was rendered on the right side of the first officer’s surface map display. The destination runway was presented in “runway heading up” orientation with a fixed scale that showed the entire runway and surrounding taxiways.
Figure 3. Surface Map Display
Indications and Alerts Traffic conflict indications and alerts were
added to the surface map and HUD as described in detail below.
Indications and alerts were implemented based on concepts developed by RTCA SC-186 Working Group (WG)-1, called Enhanced Traffic Situational Awareness on the Airport Surface with Indications
and Alerts (ATSA SURF IA). This WG is developing an application description for flight deck-based indication and alerting of traffic conflicts in the runway environment. The application description was not finalized during study planning; therefore, the definition of indications and alerts as specified in a draft version of the document [10] were utilized.
Indications Indications are intended to generate pilot
awareness and situation assessment by highlighting the runway and traffic status as relevant to own-ship operations. Indications identify normal operational conditions to the flight crew that are generally relevant for runway safety but could be a precursor to a non-normal situation [11]. Two types of indications were defined.
Traffic indication (TI) highlights a potential runway traffic collision/hazard that may emerge in the near future. TIs are intended to increase the flight crews’ awareness of the relevant runway traffic.
A TI was indicated on the surface map (Figure 4) by an enlarged traffic symbol for the relevant traffic surrounded by a blue and white dashed circle, an identification tag that showed flight ID and ground speed in knots, and a blue and white dashed line around the relevant runway, if applicable. A status message (“Traffic”) was displayed on both the surface map and HUD. In the event the traffic symbol was not displayed on the surface map due to the current map scale setting, an off-scale symbol was pegged on the edge of the display in the direction of the traffic.
Figure 4. Surface Map showing Traffic Indication
Runway status indication (RSI) identifies if the runway that own-ship is approaching or using is in-use or occupied by other traffic and is not suitable for entering, takeoff, or landing. Before proceeding, the crew should ensure they have the appropriate clearance and the indicated traffic is not a factor.
A RSI was displayed on the surface map and HUD in the same manner as a TI except on the surface map, the relevant runway outline and circle surrounding relevant traffic was a solid blue line.
Auditory annunciations are not used in conjunction with indications.
Alerts Alerts identify to the flight crew a potential
collision hazard which may require timely response to avoid a collision. A two-level alerting scheme was employed.
Caution alerts are generated for conditions that require immediate flight crew awareness and subsequent flight crew response.
A caution alert was indicated on the surface map (Figure 5) by an enlarged yellow traffic symbol surrounded by a yellow circle for the relevant traffic; an identification tag that showed flight ID, ground speed in knots, and distance between the own-ship and traffic in nautical miles (nm) when greater than 1 nm and in feet when below 1 nm; and a yellow line around the relevant runway, if applicable. On the HUD, a circular target designator symbol highlighted the conflict traffic (Figure 6). An alert message (“Caution, Traffic”) was displayed on the HUD and also at the bottom of the surface map in yellow text. An off-scale symbol was displayed if the traffic was outside of the HUD or surface map viewing area.
An aural annunciation was simultaneously transmitted over the flight deck speakers saying “Caution, Traffic.”
Warning alerts are generated for conditions that require immediate flight crew awareness and immediate flight crew response.
A warning alert was indicated in the same manner on the surface map as for a caution alert, except the warning was associated with the color red, a square was used to surround the traffic symbol, and the alert message was “Warning, Traffic” (Figure 7). A square was also used for the target designator symbol on the HUD.
Figure 5. Surface Map showing Caution Alert
Figure 6. HUD showing Caution Alert
Figure 7. Surface Map showing Warning Alert
Target Designator
Symbol
An aural annunciation was simultaneously transmitted over the flight deck speakers saying “Warning, Traffic.”
Directive Alerting Directive alerting was also tested. Directive
alerts were designed to specify to the flight crew the action to take to resolve a conflict situation. The directive alert, dependent on scenario, was as follows: “go around” when on approach, “abort” when departing, “stop” when taxiing or rolling-out, and “climb” when air-to-air conflict on approach. The directives were displayed on the surface map and the HUD, analogous to the warning and caution alerts, with the directive also transmitted over the flight deck speakers.
Conflict Detection The indications and alerts were driven from the
Airport Traffic Collision Avoidance Monitor (ATCAM). ATCAM identifies potential traffic conflicts at low altitudes near the airport, on the runway, and during taxi and ramp operations for multiple classes of aircraft and surface vehicles.
ATCAM is comprised of three separate aircraft-based algorithms that rely on traffic state information obtained from ADS-B In:
1. The Runway Safety Monitor (RSM) is designed to detect and alert for runway conflicts. RSM monitors own-ship and traffic located in a three-dimensional virtual zone around the relevant runway using own-ship and traffic state data and separation and closure rate to determine whether an alert should be generated. RSM is described in detail in [12].
2. The Low Altitude Conflict Monitor (LACM) is designed to detect and alert for air-to-air conflicts near the airport at altitudes below 1000 ft (i.e., not conflict with the Traffic Alert and Collision Avoidance System, TCAS). LACM computes closing speed, time to closest point of approach, time to co-altitude, and other data between own-ship and approaching aircraft to determine if criteria and thresholds are met for issuing alerts, similar to the TCAS approach.
3. The Taxi Conflict Monitor (TCM) is designed to detect and alert for ground taxi conflicts in the airport movement areas. The TCM design is similar to that of LACM and computes distances
between own-ship and traffic, closing speeds, time to closest point of approach and other parameters.
The three algorithms are independent but are integrated and share data to increase the probability of detection for all possible conflicts during airport operations. RSM has been through extensive testing [4, 5, 6, 7]; however, LACM and TCM are in the development stage [13]. Green, et al [14] provides a detailed description of ATCAM including initial alerting criteria.
Test Method Data collection occurred for several different
scenarios and test conditions as described below.
Test Scenarios Runway, taxi, and low altitude air-to-air conflict
scenarios were evaluated. Every effort was made to produce similar timing for the scenarios; however, a certain amount of variability was naturally introduced due to the maneuvering conducted by the EP (i.e., deceleration rate, taxi speed, etc.).
Runway Scenario - Arrival / take-off hold This scenario tested the incursion where an
aircraft was in position and holding for departure clearance while another aircraft was approaching the same runway for a landing. Own-ship was on approach to Runway 10, initially at 4 nm from the threshold at 1330 ft above field level (AFL), descending with an indicated airspeed of 138 kts. The EP was cleared to land. The traffic was initially at the Runway 10 hold line nearest to the runway threshold. The traffic taxied into position on the active runway at the start of the test trial and held in that location.
Runway Scenario – Departure / taxi This scenario tested the incursion where an
aircraft is on departure and another aircraft crosses the runway. Own-ship was in position-and-hold on Runway 10 awaiting departure. The traffic was holding on Taxiway F at Runway 10. The EP was cleared for departure. Once the EP initiated departure, the traffic crossed the runway.
Runway Scenario - Taxi / departure This scenario tested the same situation where an
aircraft is on departure and another aircraft crosses the runway. In this instance, however, own-ship was initially on Taxiway T12 as if it just exited Runway
14R. The traffic was located in position-and-hold, awaiting Runway 10 departure. The EP taxied at 15 kts and was cleared to taxi to Concourse H via T12, T, F and cleared to cross Runway 10. When the own-ship was 900 ft from Runway 10, the traffic began its departure.
Runway Scenario – Roll-out / taxi This scenario tested the situation where one
aircraft lands and is rolling out while another aircraft crosses the runway ahead of the roll-out traffic. Own-ship was approaching Runway 10 and was cleared to land. Traffic was holding on Taxiway F at Runway 10. As the own-ship touched down, the traffic crossed the runway.
This scenario tested the situation where aircraft are departing on intersecting runways, heading toward the intersection. Own-ship was in position-and-hold on Runway 14L awaiting departure. The traffic was in position-and-hold on Runway 22R. Own-ship was cleared for departure. As own-ship began its departure, the traffic began its departure.
Taxi Scenario – Traffic ahead This scenario tested the situation where an
aircraft exhibits excessive closure on traffic from behind. Own-ship was taxiing on Taxiway T toward Runway 14R at a ground speed of 25 kts The traffic was also taxiing on Taxiway T toward Runway 14R ahead of the own-ship but at 15 kts ground speed.
Taxi Scenario – Traffic head-on This scenario tested the situation where two
aircraft conflict head-on on a taxiway. Own-ship landed on Runway 28 and was cleared to taxi to Concourse E via T, A9. Traffic was taxiing on Taxiway T toward Runway 28. A conflict occurred on Taxiway T between Taxiways T10 and M.
Taxi Scenario – taxi / taxi This scenario tested the situation where aircraft
conflict at a taxiway intersection. Own-ship landed on Runway 22R and was cleared to taxi to Concourse C via C, B, A5 and cleared to cross Runway 27L. Traffic was parked at the gate at Concourse C. As own-ship was taxiing on Taxiway B, traffic began to exit the ramp on Taxiway E, ahead of own-ship, causing an intersection conflict.
Air-to-air Scenario – Arrival / crossing traffic This scenario tests the situation where traffic
crosses the path of an aircraft on final approach. Own-ship was on approach to Runway 22R, initially at 4 nm from the threshold at 1330 ft AFL at an indicated airspeed of 138 kts. Traffic (a helicopter) was traveling at heading 130, 0.75 nm short and 1.2 nm North of the Runway 22R threshold at 300 ft AFL and at an indicated airspeed of 50 kts. As own-ship approaches, the traffic crossed own-ship’s path.
Evaluation Pilots Thirty-six pilots served as EPs, creating 18 flight
crews. Each pilot flew for a major U.S. air carrier and was paired by airline to ensure crew coordination and cohesion in standard operating procedures. The Captains had an average of over 14,000 flight hours. The first officers had an average of over 10,000 flight hours. All pilots had “glass cockpit” experience. During Phase One testing (see below), the Captain served as the pilot flying and the First Officer served as the monitoring pilot (pilot-not-flying). During Phase Two testing, the roles were reversed, with the First Officer serving as the pilot flying and the Captain serving as the pilot-not-flying. The flight crews were asked to maintain good crew resource management and comply with company-specific procedures.
Test Matrix The testing was conducted in two phases. In
Phase One, pilot reaction to conflict scenarios were evaluated. Sixteen trials were conducted. The conflict scenarios were interspersed among nominal trails to provide sufficient variety and task demands to reduce expectation on the part of the EP. Two alert conditions (alerting and no alerting) were evaluated in a “between subjects” design (i.e., half of the EPs received alerts during conflict events). No indications were used. Trial 10 was the taxi/taxi conflict, Trail 12 was the low altitude air-to-air conflict, and Trial 14 was the roll-out/taxi runway conflict. These test trials were conducted in low visibility (1220 ft runway visual range (RVR)). The final trial in this test phase (Trial 16) evaluated pilot response to a nuisance alert using a slightly modified runway conflict-departure/taxi scenario. As own-ship was departing on Runway 10, traffic taxied up to but did not cross the hold line on Taxiway F. The ADS-B position data, however, indicated that the
traffic had crossed the hold line. The surface map indicated that the traffic was approaching the runway and for half the runs, an alert was generated. This test trial was conducted in 8000 ft RVR so that the EP could visually see the taxi traffic out the window.
During Phase Two, indication and alert timeliness were evaluated for three different detection criteria per scenario, referred to as ‘early’, ‘mid’, and ’late’ conditions. The ATCAM algorithms were adapted to generate early, mid, or late alerting conditions. For most runway conflict scenarios, one of the conditions was similar to implementation examples generated as part of the ATSA SURF IA application description [10]. In addition, a directive alert was evaluated per scenario.
The test trials were grouped by scenario, with the early, mid, and late conditions flown first (with experimental ordering), followed by the directive alert trial. The scenarios were given to the flight crews in different order. During the Phase 2 test trials, the EPs were asked to continue the maneuver until the warning alert was received for evaluation purposes. These test trials were conducted in low visibility (1200 ft RVR) without winds. The effectiveness of indications and alerts were evaluated through EP subjective ratings and comments and quantitative performance comparisons.
Procedure Each EP participated in a briefing and training
session prior to data collection. The EP was trained on the conflict alerting concept using scenarios different from those used during data collection. The EP was not required to take action when an indication or caution alert was issued. For a warning alert, the EP was trained to abort during departure, go-around on approach, and stop during taxi. For a directive alert, the EP was trained to take the action specified.
Before each trial, the pilots were briefed on the operation (approach, departure, or taxi), any required maneuvering constraints (e.g., taxi at 15 kts), and if a directive alert was to be provided. The EPs were not made aware of the alerting condition (early, mid, or late) prior to those trials. Post-trial, post-block, and post-test questionnaires were administered. Audio, video, and digital data were also recorded.
Results A summary of quantitative and qualitative
results is presented for both testing phases. All data is referenced from the own-ship center-of-gravity (CG), unless noted otherwise.
Phase One Testing The first off-nominal test trial was the taxi/taxi
conflict scenario. Unfortunately, the conflicting traffic was too easily noticed out the window. For the 9 trials in which alerting was given to the flight crew, 3 crews had already seen the traffic out the window and slowed or stopped before an alert was generated; 4 crews received a caution alert and slowed or stopped before receiving a warning alert; 1 crew was taxiing at a faster pace (23 kts) and received a warning alert but saw the traffic out the window before receiving the alert; and, 1 crew taxied on the wrong taxiway and missed the conflict event. For the 9 crews that did not get alerts, all saw the traffic out the window and slowed or stopped until the taxiing traffic was clear. The pre-test scenario check-out did not sufficiently represent operational crew procedures and scanning so this trial did not yield the expected data.
The second off-nominal test trial was the air-to-air scenario. When alerts were provided, all 9 crews were alerted to the helicopter and were able to avoid a possible collision. When alerts were not provided, 3 of 9 crews were completely unaware of the conflict and did not make a maneuver to avoid the traffic. These crews had the map set at the lowest scale and traffic was not shown until within 0.5 nm of own-ship. The other 6 crews saw the traffic on the map when the own-ship was 1 nm or more from the traffic. Even so, only 2 of the 6 crews conducted a go-around in enough time to safely avoid a collision. The other 4 crews either seemed unsure of the action desired by the researcher, were waiting for an alert, or thought the traffic was not a factor. An implementation issue that may have affected pilot action was that relative altitude was not always displayed with the traffic symbol and the flight crew did not know how close the traffic was vertically. In future implementations, it is necessary to display relative altitude for airborne traffic.
The third off-nominal test trial was the roll-out/taxi runway scenario. When alerts were not provided, 7 of 9 crews did not see the traffic cross
down the runway. They still stopped prior to the incurring aircraft, but their lack of awareness was troubling. When alerts were provided, the EPs braked more aggressively. As a result, the own-ship came an average of 680 ft closer to the traffic when alerts were not provided.
The final off-nominal trial evaluated pilot response to a nuisance alert. Eight of the crews that received the alert aborted the departure immediately after the alert was received. One crew observed the situation and noted the runway was clear and continued the departure. All 9 crews that did not receive alerts continued the departure without noticing the incorrect CDTI traffic display. (In this case, the traffic was behind the hold line out-the-window.) The results suggest that a pilot is prone to act upon a warning alert without secondary confirmation, especially in a high dynamic maneuver like departure; therefore, maintaining a low nuisance alert rate is critical to avoiding unnecessary maneuvers. However, the results also demonstrate that CDTI alone is not necessarily sufficient for conflict avoidance because flight crews may not be scanning the displays during high workload conditions or when they are mostly head-out, like during departure. The aural alerting component provided the flight crews with a glaring attentional component in this conflict scenario.
Phase Two Testing All trials conducted during Phase Two testing
included conflict events; however, the EPs were not made aware of the type of conflict prior to the initial trial for each scenario type. Data were only collected for 17 flight crews due to a simulator malfunction.
Results by Scenario Each flight crew conducted 40 test trials (680
total for all crews). The results are presented by scenario.
The timeliness of indications and alerts were rated on a scale of 1 to 7 with 1 being “too early,” 4 being “just right,” and 7 being “too late.” The usefulness of the alerts were rated on a scale of 1 to 7 with 1 being “completely useless” and 7 being “completely useful.” Ratings for other queries were based on a 7 point scale with 1 equivalent to “low” and 7 equivalent to “high.” Means and standard deviations (SD) are presented for all subjects.
Runway Scenario - Arrival / take-off hold
A TI was not displayed for this scenario. During 51 trials (102 EP ratings), only 55 EPs (53.9 percent) correctly identified a TI was not displayed.
A RSI was displayed and reported to occur in a timely manner and was useful (Table 1). Of 102 EP ratings, 76 EPs (74.5 percent) correctly identified a RSI was displayed.
The caution alert was reported to be timely and useful (Table 1). The caution alert timing was not varied for this scenario.
A Friedman two-way non-parametric analysis of variance by rank, with post-hoc adjustment, revealed that the early warning alert condition was statistically preferred for timeliness (p = 0.045) and also rated best for timeliness of collision avoidance. No statistical differences were found between early warning alert and RSI or caution alert for timeliness. All warning alert timings were rated as being useful and were not statistically different from each other. The late condition mimicked the ATSA SURF IA criteria.
Table 1. Indication and Alert Data for Arrival / Take-off Hold Runway Scenario
Neither a TI, RSI, nor a caution alert were generated for this scenario. For the 51 trials, all EPs (100 percent) were aware that indications and a caution were not provided.
The mid warning alert condition was preferred for timeliness; however, the late condition was indicated to provide slightly better timing for collision avoidance and was rated slightly more useful (Table 2). The differences are not statistically significant (p > 0.05), however. ATSA SURF IA example criteria was not used for any conditions but would be similar to the early condition. Interestingly, alerts may be inhibited above 80 kts based on proposed ATSA SURF IA requirements, but these data indicate that the late condition, occurring on average at 84 kts, was not problematic.
Runway Scenario - Taxi / departure
For this scenario, it is important to note that the distance from the runway centerline to the runway edge is 75 ft, the distance from the runway edge to the hold line is 290 ft, and the distance from the own-ship CG to the nose is 73 ft. The EP was asked to taxi the aircraft at 15 kts.
A TI was generated for this scenario in a timely manner (Table 3). Of 102 EP ratings, 99 EPs (97 percent) correctly identified a TI was displayed.
A RSI was generated for the mid and late conditions in a timely manner (Table 3). A RSI was not generated for the early condition since a warning alert was generated before the RSI criteria were met. The RSI was based on ATSA SURF IA criteria. Of 102 EP ratings, 68 EPs (66.7 percent) correctly identified display of the RSI.
A caution alert was not generated for this scenario.
The early warning alert condition was rated as the most timely by preference and for collision avoidance as well as being useful (Table 3). The early warning alert, as shown in Table 3, actually occurred before the RSI was scheduled. The mid condition was indicated to be slightly late but still very useful. The late condition was considered way too late and marginally useful. The late condition occurred on average after the aircraft cg was well over the hold line. The mid condition mimicked the ATSA SURF IA criteria.
The results of the Friedman test indicated that the early warning alert was rated significantly preferred for timeliness than the mid and late warning alerts (p = 0.023), but no significant differences were found between early warning and RSI or caution for timeliness or usefulness ratings. The early warning alert was also rated significantly better in terms of usefulness than the late warning alert but was non-significant in comparison to the mid warning alert in terms of usefulness.
Table 2. Alert Data for Departure / Taxi Runway Scenario
It is interesting to note that all EPs commented there was plenty of time to stop with the early condition. For the mid condition, 2 crews did not think there was sufficient time to stop and sped across the runway and 2 other crews just continued across. (On average, the mid condition alerted when the nose of the aircraft had just crossed the hold line.) For the late condition, 9 crews quickly tried to cross the runway stating that the alert was very late. On average, the late condition happened when the aircraft cg was 113 ft past the hold but the aircraft nose was still short of the runway edge line.
Runway Scenario – Roll-out / taxi
Neither a TI, RSI, nor a caution alert were generated for this scenario. One test crew (2 EPs) did not know if a TI, RSI, or caution were generated for this scenario. All other EPs were aware that indications and a caution were not provided.
All conditions were rated timely and useful (Table 4) with negligible, non-significant differences found (p > 0.05). The warning alert timing did not vary that much between the early (i.e., traffic crossed hold line), mid (i.e., traffic 100 ft over hold line), and late (i.e., traffic crossed runway edge) conditions. The early condition mimicked the ATSA SURF IA criteria.
Neither a TI, RSI, nor a caution alert were generated for this scenario. Of 102 EP ratings, 95 EPs
(93.1 percent) correctly identified a TI was not displayed, 101 EPs (99 percent) correctly identified a RSI was not displayed, and 100 EPs (98 percent) correctly identified a caution alert was not displayed.
The warning alert was generated when the conflict traffic was traveling greater than 30 kts for the early condition, 60 kts for the mid condition, and 90 kts for the late condition. The mid alert condition was rated most timely over the early and late conditions (Table 5). The differences were not statistically significant, however (p > 0.05). Neither alerting criteria mimicked the ATSA SURF IA criteria.
Taxi Scenario – Traffic ahead
Indications were not evaluated for taxiway conflicts during this study. The timing was varied for both the caution and warning alerts for the taxiway conflict scenarios.
For both caution (p = 0.031) and warning (p = 0.034) alerts, the early condition was significantly preferred for timeliness preference. The results also suggest that pilots considered the early conditions, for both caution and warning, as most useful (Table 6), but the Friedman Test results were non-significant (p > 0.05). The mid condition, while not preferred for timeliness was still nearly as timely for collision avoidance as the early condition.
Table 4. Alert Data for Roll-out / Taxi Runway Scenario
The caution and warning alert timings for the early and mid conditions were both rated timely and useful (Table 7). The late condition was only slightly degraded for timeliness or utility. The differences did not significantly differ (p > 0.05).
Taxi Scenario – taxi / taxi
The caution and warning alerting timing for the early condition was rated most timely and useful (Table 8). The results of the Friedman statistical test indicated that the early condition for caution (p = 0.015) and warning (p = 0.001) alerts were rated significantly more timely than the late condition. The pattern of results was similar for usefulness ratings, wherein pilots rated the early condition for caution (p = 0.018) and warning (p = 0.011) significantly more useful than the late condition. For both ratings of timeliness and usefulness, pilots did not statistically rate the early conditions higher than the mid condition (p > 0.05).
Air-to-air Scenario – Arrival / crossing traffic
A TI was generated for this scenario in a timely manner (Table 9). A RSI was not applicable since this was an air-to-air scenario.
The caution alert timing was not varied for this scenario and was rated timely and useful (Table 9).
The early warning alerting condition was rated slightly, but statistically non-significant, more timely and useful than the mid alerting condition (Table 9) but was significantly rated more timely (p = 0.021) and useful (p = 0.013) than the late condition. The late timing was considered very late and only moderately useful. On average, only 9 seconds would be available to maneuver and avoid a collision.
Qualitative Results Post-run and post-test questionnaires were
administered as appropriate. Ratings for most of the questions were given on a scale of 1 (“strongly disagree”, “completely useless”, “low”) to 7 (“strongly agree”, “completely useful”, “high”). The post-test questionnaire was given to the EPs to fill out at their leisure. Thirty-two of thirty-six possible questionnaires were returned.
Indications
Indications were found to be helpful in determining critical runway safety information (mean
6.3, SD 0.8) and in determining the location and movement of traffic that was relevant to the safety of the own-ship (mean 6.3, SD 0.7). Of 32 EP ratings, 29 EPs (90.6 percent) responded that indications were desired for runway, taxi, and low altitude air-to-air operations. The enlarged chevron (mean 5.8, SD 1.2), indicated runway (blue and white runway outline) (mean 5.8, SD 1.6), and chevron outline (mean 5.7, SD 1.6) were rated as being the most useful for determining relevant traffic.
During the testing, the EPs were provided with images showing the symbology for the various types of indications. Even having that, it was observed that there was some confusion when identifying the type of indication (TI or RSI). The EPs indicated that it was moderately easy (mean 4.8, SD 1.7) to distinguish between the TI and RSI and the way that the TI and RSI were differentiated was moderately easy (mean 4.9, SD 1.6) to recognize by looking at the display.
Alerts
Regarding the alert display features, the auditory alert (mean 6.0, SD 1.6), indicated runway (yellow or red runway outline, mean 6.0, SD 1.5), chevron outline (yellow circle/red square, mean 6.0, SD 1.6), and enlarged chevron (mean 5.7, SD 1.5) were rated as being most useful. Of 28 EP ratings, 24 EPs (85.7 percent) responded that the audible alert was most likely to bring a conflict situation to their attention.
During an alert, the distance between the traffic and own-ship was displayed as part of the traffic ID tag. The distance information was rated as being somewhat useful (mean 5.1, SD 1.6). The distance was displayed in nautical miles when greater than 1 nm and in feet when below 1 nm. Of 32 EP ratings, 24 EPs (75 percent) indicated the presentation was clearly understood; however, 15 of 31 EPs (80.6 percent) indicated another method of presentation, such as tenths of a nautical mile instead of feet, would be preferred. When queried whether a distance auditory call-out was desirable, of 31 EP ratings, 17 EPs (54.8 percent) thought so for low altitude air-to-air conflicts, 14 EPs (45.2 percent) thought so for runway conflicts, and only 10 EPs (32.2. percent) thought so for taxi conflicts.
On the HUD, a target designator symbol (circle for caution, square for warning) was shown during an alert that overlaid the conflict traffic out the window.
The EPs rated this presentation as being effective (mean 5.5, SD 1.2) and providing a clear indication (mean 5.5, SD 1.3) of the relative location of the conflict traffic.
The alert messages displayed were generic and universal (“Caution, Traffic” and “Warning, Traffic”). Of 32 EP ratings, 13 EPs (40.6 percent) indicated a more descriptive message, such as “Warning, Traffic Departing Runway 10”, would be more effective, while 18 EPs (56.2 percent) did not.
An off-scale symbol was shown when the conflict traffic was not in the viewing area on the HUD or not shown on the surface map. The EPs rated these off-scale presentations as being effective in providing information on the conflict traffic (HUD – mean 4.9, SD 1.4, map – mean 5.5, SD 1.2) and providing a clear indication of the relative location of the conflict traffic (HUD – mean 4.6, SD 1.7, map – mean 5.4, SD 1.2). Of 32 EPs, 19 EPs (59.4 percent) would prefer the surface map to auto-zoom to a scale that shows the traffic symbol, 11 EPs (34.4 percent) would not prefer auto-zoom.
Latency of Alerting
In almost all cases, the early alerting conditions were preferred by the EPs for timeliness, preference for collision avoidance, and usefulness. These data must be viewed in context however. Certainly earlier alerting provides for better crew awareness and preparation for contingency planning. However, early alerting typically means more nuisance alerts in a viable CD&R system. The subjective trend data between the early, mid, and late alerting conditions for timeliness preference for collision avoidance perhaps more accurately indicate the tolerance that flight crews need to avert collisions. Further research is also required to evaluate the integrated systems concepts for indications and alerts.
Directive Alerting
In general, the EPs indicated they felt slightly safer during runway (mean 6.6, SD 0.6), taxi (mean 6.7, SD 0.5), and low altitude air-to-air (mean 6.5, SD 0.8) incidents when directive alerting was provided than when alerts without directives were provided (runway – mean 5.3, SD 1.1, taxi – mean 5.6, SD 1.0, low altitude – mean 5.0, SD 1.4).
For all scenarios, the directive alert was rated very useful (mean 6.6, SD 0.7) and clear in terms of
the action to take (mean 6.9, mean 0.1). The directive given was rated as being the best choice for the situation for most scenarios (mean 6.9, SD 0.4). For the Traffic Ahead taxi scenario, a “stop” directive was given. EPs (16 of 34 (47 percent)) indicated another directive such as “slow down” or “reduce speed” would be more appropriate. For the low altitude air-to-air scenario, a “climb” directive was given. Several EPs (9 of 34 (26.5 percent)) indicated “go around” would be more appropriate since the aircraft was on final approach.
The directive alert was rated as being slightly more beneficial (mean 6.7, SD 0.7) than a warning alert with no directive (mean 5.8, SD 0.7) for all scenarios evaluated. However, ANOVA statistical analysis reported that these differences were not statistically significant, F(1, 35) = 4.19, p < 0.05.
For all scenarios, the EPs indicated that their level of perceived safety during a similar traffic conflict event would be significantly highest if directive alerts were provided (mean 6.8, SD 0.4) than if warning alerts with no directive (mean 5.9, SD 0.6) or no alerts at all (mean 3.3, SD 1.2) were provided, F(2,35) = 4.78, p < 0.05. A Student-Neuman-Keuls test revealed significant difference between all three conditions tested.
The EPs also indicated that directive alerts were desired during most types of operations (final approach – 27 of 32 EPs (84.4 percent), take-off roll – 26 of 32 EPs (81.3 percent), taxiing across a runway – 28 of 32 EPs (87.5 percent), low altitude air-to-air – 28 of 32 EPs (87.5 percent), and taxiing – 20 of 31 EPs (64.5 percent)).
Summary A CAAT concept for the airport TMA was
evaluated in a simulation study. The purpose of the study was to evaluate pilot reaction to conflict events in the TMA, multiple alert timings for various scenarios, alerting display concepts, and directive alerting concepts.
The data from Phase One testing highlighted the importance of designing scenarios carefully to emulate testable conditions witnessed in the real-world. The surface conflict scenario was designed to determine whether or not flight crews would be able to detect traffic outside the primary field-of-view. Because of significant variability in taxiing speeds
across crews, the conflict traffic was not consistent and the efficacy of the surface conflict monitor could not be effectively evaluated.
The low-altitude conflict scenario demonstrated the value of providing alerts below 1000 ft AFL (i.e., when TCAS RAs are inhibited). Without an alerting system, data showed that there was an unacceptably high propensity for missed detections out-the-window. A hybrid alerting system, providing seamless coverage of surveillance and conflict monitoring, by continuing coverage beyond TCAS to the airport surface, including taxi conflicts, would be highly beneficial. With the rapid expansion of ADS-B and applications, the need for integrated traffic conflict alerting systems, that is consistently implemented, should be required for NextGEN envisaged operations.
The runway incursion scenarios supported past research results demonstrating the significant value of alerting systems that can prevent these hazardous events. The data showed that flight crews were not able to adequately detect the presence of incursion traffic with a cockpit display of traffic information without the benefit of the onboard runway incursion alerting. When the system alerted, the flight crews were provided with excellent situation awareness of the hazard and avoided the traffic. That said, the results further made clear that any such systems would need to be highly reliable to avoid false alarms and unnecessary go-arounds and rejected take-offs.
The Phase Two testing provided specific feedback on design of the CAAT technologies. Flight crews quantitative and qualitative feedback on timeliness of alerts, directives, indications, and alert display indicated the essential features and needed improvements to support the various types of operations tested. Overall, the ATCAM algorithm and indications and alerting concepts were well-received. Specific data was collected to tailor the algorithm performance to optimize the onset and symbology display of alerting for the different CAAT system monitors. Finally, the research study indicated value for directive alerting but showed the need for further evaluation.
References [1] Joint Planning & Development Office, Executive Summary Integrated Work Plan for the Next Generation Air Transportation System, Version FY12.
[2] Joint Planning & Development Office, 2008, Next Generation Air Transportation System Integrated Work Plan: A Functional Outline, Version 1.0.
[3] Joint Planning & Development Office, Concept of Operations for the Next Generation Air Transportation System, Version 3.0.
[4] Jones, D. R., C. C. Quach, and S. D. Young, 2001, Runway Incursion Prevention System – Demonstration and Testing at the Dallas/Fort Worth International Airport, Proceedings of the 20th Digital Avionics Systems Conference.
[5] Jones, D. R., 2002, Runway Incursion Prevention System Simulation Evaluation, Proceedings of the AIAA/IEEE 21st Digital Avionics Systems Conference.
[6] Jones, D. R., 2005, Runway Incursion Prevention System Testing at the Wallops Flight Facility, Proceedings of the SPIE Defense & Security Symposium.
[7] Jones, D. R. and L. J. Prinzel, 2006, Runway Incursion Prevention for General Aviation Operations, Proceedings of the AIAA/IEEE 25th Digital Avionics Systems Conference.
[8] Foyle, D. C., A. D. Andre, R. S. McCann, E. Wenzel, D. Begault, and V. Battiste, 1996, Taxiway navigation and situation awareness (T-NASA) system: Problem, design philosophy and description of an integrated display suite for low-visibility airport surface operations, SAE Transactions: Journal of Aerospace, 105:1411{1418.
[9] Jones, D. R. and J. M. Rankin, 2002, A system for preventing runway incursions, Journal of Air Traffic Control, 44(3).
[10] RTCA SC-186, WG-1, 2009, Enhanced Traffic Situational Awareness on the Airport Surface with Indications and Alerts (ATSA SURF IA) Operational Services and Environment Description, Draft Version 1.6.
[11] Moertl, P.M. and J. D. Nickum, 2008, Flight Deck Based Indications and Alerting To Increase
Runway Safety. Paper presented at the 2008 ICNS Conference.
[12] Green, D. F., February 2006, Runway Safety Monitor Algorithm for Single and Crossing Runway Incursion Detection and Alerting, NASA CR-2006-214275.
[13] Jones, D. R., L. J. Prinzel, S. D. Otero, and G. D. Barker, 2009, Collision Avoidance for Airport Traffic Concept Evaluation, Proceedings of the AIAA/IEEE 28th Digital Avionics Systems Conference.
[14] Green, D. F, S. D. Otero, G. D. Barker, D. R. Jones, 2009, Initial Concept for Terminal Area Conflict Detection, Alerting, and Resolution Capability On or Near the Airport Surface, NASA TM-2009-215696.
Acknowledgements The authors would like to express their
appreciation to Simulation Development and Analysis Branch personnel for their support throughout all phases of implementation and testing.