Page 1
1
Collision Study of Rigid Ships with a Deformable
Offshore Wind Turbine Jacket Structure
Andrés Barrera
Master Thesis
presented in partial fulfillment
of the requirements for the double degree:
“Advanced Master in Naval Architecture” conferred by University of Liege
"Master of Sciences in Applied Mechanics, specialization in Hydrodynamics,
Energetics and Propulsion” conferred by Ecole Centrale de Nantes
developed at ICAM, Nantes
in the framework of the
“EMSHIP”
Erasmus Mundus Master Course
in “Integrated Advanced Ship Design”
Ref. 159652-1-2009-1-BE-ERA MUNDUS-EMMC
Supervisor: Prof. Hervé LE SOURNE, ICAM
Reviewer: Prof. Phillipe RIGO, University of Liege
Nantes, February 2014
Page 2
P 2 Andrés Barrera
Master Thesis developed at ICAM, Nantes
CONTENTS
CONTENTS ............................................................................................................................... 2
ABSTRACT ............................................................................................................................... 5
1 INTRODUCTION .............................................................................................................. 6
1.1 Objectives .................................................................................................................... 7
1.1.1 General ................................................................................................................. 7
1.1.2 Specific ................................................................................................................. 7
2 TECHNICAL AND THEORETICAL BACKGROUND .................................................. 8
2.1 Wind Energy ................................................................................................................ 8
2.2 Jacket Structures .......................................................................................................... 9
2.3 Ship Collisions With Offshore Structures ................................................................. 12
2.4 Super-element Method ............................................................................................... 15
2.5 LS-DYNA .................................................................................................................. 20
3 PROJECT DEVELOPMENT ........................................................................................... 21
3.1 Collision Survivability Regulations ........................................................................... 21
3.1.1 Definition of Collision Velocity ......................................................................... 22
3.2 Ship Type Selection ................................................................................................... 22
3.1.2 Crude Oil Carrier ................................................................................................ 23
3.1.3 OSV (Offshore Supply Vessel) .......................................................................... 23
3.3 Jacket Model .............................................................................................................. 24
3.4 Simulations Setup ...................................................................................................... 26
3.4.1 Boundary Conditions and Contact ..................................................................... 26
3.4.2 Hydrodynamic Forces ........................................................................................ 27
3.4.3 Materials ............................................................................................................. 27
3.5 Model Validation ....................................................................................................... 28
3.6 Collision Simulations................................................................................................. 30
Page 3
Collision Failure Study of Rigid Ship Models with a Deformable Offshore Wind Turbine
Jacket Structure
3
“EMSHIP” Erasmus Mundus Master Course, period of study September 2012 – February 2014
3.6.1 Crude Oil Carrier Simulations ............................................................................ 30
3.6.2 OSV Simulations: Determination of Critical Impact Location .......................... 51
3.6.3 OSV Simulations: Sensitivity to collision angle, collision velocity and collision
height ………………………………………………………………………………….59
3.6.4 OSV Simulations: Sensitivity to wind turbine and gravity loads ....................... 74
3.6.5 OSV SIMULATIONS: Effects of OWT Tower ................................................. 97
3.6.6 OSV Simulations: Force Transmission with Single Impact Location ............. 103
3.6.7 OSV Simulations: Superelement Code Comparison for Full Jacket Collision 109
4 ANALYSIS/CONCLUSIONS ....................................................................................... 115
5 FURTHER WORK ......................................................................................................... 119
6 ACKNOWLEDGEMENTS ........................................................................................... 120
7 REFERENCES ............................................................................................................... 121
Page 4
P 4 Andrés Barrera
Master Thesis developed at ICAM, Nantes
Declaration of Authorship
I declare that this thesis and the work presented in it are my own and have been generated by
me as the result of my own original research.
Where I have consulted the published work of others, this is always clearly attributed.
Where I have quoted from the work of others, the source is always given. With the exception
of such quotations, this thesis is entirely my own work.
I have acknowledged all main sources of help.
Where the thesis is based on work done by myself jointly with others, I have made clear exactly
what was done by others and what I have contributed myself.
This thesis contains no material that has been submitted previously, in whole or in part, for the
award of any other academic degree or diploma.
I cede copyright of the thesis in favor of ICAM.
Date: December 20, 2014 Signature:
Page 5
Collision Failure Study of Rigid Ship Models with a Deformable Offshore Wind Turbine
Jacket Structure
5
“EMSHIP” Erasmus Mundus Master Course, period of study September 2012 – February 2014
ABSTRACT
The higher energetic demand of today’s society has required the endeavor of advancing into harsher
environments to convert and obtain energy to ensure its productivity and functioning. For this reason,
wind energy has become an attractive source of renewable energy, as in the long term it is cleaner and
safer for the environment than burning fossil fuels. Recently, wind farms are being developed further
offshore. These require more advanced technologies and more robust structures for support. The jacket
support system originated in the oil and gas field, where it is used at water depths of up to 500 m. It has
been successfully employed in the renewable energy field as the support for offshore wind turbines in
depths of up to 45 m1.
Due to the larger area density of an offshore wind farm, there are concerns on the possible collisions of
either passing or service ships with the wind turbine support structures. Therefore a risk analysis
becomes necessary during the planning stages of the offshore wind farm to ensure a safe operation
throughout its service life and to identify the most likely collision incident.
This thesis deals with the in depth analysis of the collision process of ships with offshore wind turbine
jackets. The results of the collision simulations will be used to validate a simplified collision analysis
software based on the super element method, which will reduce overall design costs serving as a
replacement to Finite Element Analysis during the predesign stage of the wind turbine jackets.
Concretely, CAD models of an Offshore Supply Vessel and a Crude Oil Carrier were implemented into
the collision simulations to study the collapse process of a jacket. The nonlinear finite element code LS
DYNA was used for both scenarios, where different velocities and collision angles were assessed,
maintaining the ship models as rigid and the jacket model deformable. Initial simulations did not account
for the gravity or the effects of the added weight of the wind turbine on the jacket structure. Additional
two part simulations were carried out to study and compare the collapse behavior of the jacket
considering the weight effects of the wind turbine. A “preloading” implicit simulation loaded the stresses
imposed by the wind turbine and the gravity on the jacket structure and a secondary explicit simulation
accounted for the collision of the ship.
With the completed simulations a detailed analysis of the internal energy, crushing force and stress
distribution throughout the jacket with varying kinetic energies and collision angles allowed to
characterize, for the geometry in question, its sensitivity to the added weight of the wind turbine and
whether or not this parameter has to be considered in the simplified super element software. Also, for
all the different scenarios the importance of local (tube crushing) and global (structure bending)
deformation was established.
From the results it was observed that high kinetic energy simulations are less sensitive to the added
weight of the wind turbine and the jacket, while low kinetic energy simulations present a higher
sensitivity to the weight of both the wind turbine and the jacket, which occurs because of the different
stress distribution throughout the structure. However, the overall tendency observed was that the added
weight of the wind turbine and the jacket do not affect the collision simulation in a considerable enough
manner as to account for it in the development of the simplified software for scenarios similar to the
ones modeled.
1 http://www.owectower.no/references/beatrice/
Page 6
P 6 Andrés Barrera
Master Thesis developed at ICAM, Nantes
1 INTRODUCTION
The present Master’s thesis was derived from the CHARGEOL project to study issues related
to the design of foundations for offshore wind turbines, including the behavior of an offshore
wind jacket when submitted to collision loads, strong wave impacts, among others. The project
leader is STX FRANCE SOLUTIONS and the partners for the project include:
Hydrocean: In charge of wave and impact analysis.
GEM Laboratory (ECN): In charge of the seismic and numerical studies.
IFFSTAR Laboratory: Development of the seismic tests.
Bureau Veritas: Validation and user of the developed tools.
STX France: Builder of the jackets and user of the developed tools.
ICAM: Collision numerical studies and development of a simplified tool to dimension
the Offshore Wind Turbine (OWT) Jacket.
The mechanical engineering department of ICAM and two students from the EMSHIP program
were involved in the development of a ship collision analysis tool used by STX Solutions and
Bureau Veritas at the pre-design stages of an OWT. The tool is based on the super-element
method developed by ICAM and PRINCIPIA for ship/ship and ship/lock gate collision
analyses.
The work presented here was based on the analysis of the deformation for the different structural
parts of an OWT jacket using the non-linear finite element code LS-DYNA.
Page 7
Collision Failure Study of Rigid Ship Models with a Deformable Offshore Wind Turbine
Jacket Structure
7
“EMSHIP” Erasmus Mundus Master Course, period of study September 2012 – February 2014
1.1 Objectives
1.1.1 General
Develop the numerical basis for the ship collision analysis tool to be used by STX in the
predesign stage which consists performing several numerical collision simulations with a
defined OWT jacket model varying the impacting ship model.
1.1.2 Specific
Performing a detailed literature review of collision risk assessment methods for vessels
and offshore wind turbines.
Identifying and selecting critical collision scenarios for the offshore jacket provided by
STX, including a reference ship, collision velocity and impact location.
Establishing the sensitivity of the OWT jacket to a variation in velocity, angle, impact
location and collision height.
Determining the variation in the overall failure behavior of the OWT jacket to the effects
of gravity loads to determine if these must be considered in the development of the
simplified tool for jacket collisions.
Perform an initial comparison of the results obtained from the simplified calculation
tool to those obtained from a nonlinear finite element simulation in LS-DYNA.
Page 8
P 8 Andrés Barrera
Master Thesis developed at ICAM, Nantes
2 TECHNICAL AND THEORETICAL BACKGROUND
2.1 Wind Energy
In April 2009 the European Union published the Renewables Directive 2009/28/EC which
aimed to produce at least 20% of the energy consumed in the form of renewable energy2. As of
2012, 106 GW of installed wind power had been contributing to 7% of the EU’s electricity
demand. This has required approximately 17.2 billion euros of investments in wind farms.
Increased concerns over the effects of use of fossil fuel on climate change has sparked the
interest in renewable energies, including wind energy, as it produces no fuel, no greenhouse
gases, no air pollution, no toxic substances and no water pollution.
Technological advancements have permitted the extension of the onshore wind energy turbines
to offshore installations, where larger and more efficient wind turbines can be installed. An
average onshore wind turbine in the EU has a capacity of 2.2 MW with an annual average
energy production of 4702 MWh. On the other hand, an offshore wind turbine presents a
capacity of 3.6 MW with an average annual output of 12961 MWh3 (approximately three times
more). This makes offshore installations very attractive.
Figure 1: Beatrice Wind Farm Demonstrator Project. Source:
http://www.maritimejournal.com/news101/marine-renewable-energy/new-energy-award-for-beatrice-
developer
2 http://eur-lex.europa.eu/LexUriServ/LexUriServ.do?uri=Oj:L:2009:140:0016:0062:en:PDF
3 http://www.ewea.org/uploads/pics/EWEA_Wind_energy_factsheet.png
Page 9
Collision Failure Study of Rigid Ship Models with a Deformable Offshore Wind Turbine
Jacket Structure
9
“EMSHIP” Erasmus Mundus Master Course, period of study September 2012 – February 2014
2.2 Jacket Structures
The jacket structure was developed for the offshore oil and gas industry in the early 20th century
in the Gulf of Mexico. This type of support for offshore platforms can operate in depths of over
300 m in all types of climates (Gerwick, Ben, 2007). This support system was first used
successfully for OWT operations in the Beatrice Wind Farm Demonstrator Project, which was
installed off the coast of Scotland in the North Sea in 2007 (Talisman Energy, 2005) at a depth
of 45 m.
The jacket is based on a truss like structure with a rectangular cross section, composed of 3 or
4 main members that are cross braced by welded tubular members in an “X” or “Y” shape for
rigidity. Several jackets also have “J” shaped tubes for increased rigidity, cable work and so on,
as shown in Figure 2. The “X” shaped structure is seen in the three levels of the jacket, while
the “J” shaped tube travels along the entire length of the jacket. Some of the tubes serve to
protect the piping and cablework essential for the operation of the OWT or platform it supports.
Jacket support structures can reach up to several hundreds of meters and are fixed directly onto
the seabed. Because the jacket is manufactured of sectioned tubes that are welded together, its
production cost is lower than that of a monopile. A major drawback of this support structure is
its weakness in the welded tube nodes which is susceptible to fatigue from dynamic loading.
Cast nodes are a possible solution to the problem but they are more expensive and difficult to
produce.
The upper part of the jacket is called the transition piece, which contains a work platform for
the maintenance and repair crew that also serves as the foundation of the wind turbine tower.
The transition sections can be up to 9 meters high and weigh up to 160 tons (LORC, 2012).
Page 10
P 10 Andrés Barrera
Master Thesis developed at ICAM, Nantes
Figure 2: Offshore Wind Jacket. Source: http://www.wind-energy-the-facts.org/en/part-i-
technology/chapter-5-offshore/wind-farm-design-offshore/offshore-support-structures.html
The foundation of the jacket contains the piles that dig into the seabed to provide support for
the entire structure. These can be either hammered in or secured into place with vibration and
afterwards the jacket is placed onto the foundation.
The post-piling solution involves the positioning of the piles into the seabed after the jacket has
been installed at location. The piles are secured onto the outside of the jacket via sleeves and
mudmats that contact the seabed as shown in Figure 2.
Pre-piling consists in installing the piles into the soil with a template before installing the jacket.
The template is removed to install the completed jacket onto the piles by grouting or other
techniques including quick coupling. Pre-piling is faster than post-piling and less expensive, as
a small vessel can be used to achieve the pre-piling and only after this step has been completed
a large supply vessel is used to install the jacket, reducing operational costs. Since the jacket
has to be level to comply with the deviation of 0.5-2 degrees from the vertical for an adequate
OWT operation, a Remote Operated Vehicle is used to measure the differences between the
installed piles and the jacket is installed in a manner to compensate for the deviations in the
piles.
The jackets are usually transported as complete components, sometimes including the transition
piece, as was done in the Beatrice Wind Farm, Scotland (Beatrice Wind Farm, 2007) using large
barges. Also, large cranes must be hired to hoist them into position, as these weight between
500 and 800 tons (LORC, 2012). The turbines are carried on board a large supply vessel and
Page 11
Collision Failure Study of Rigid Ship Models with a Deformable Offshore Wind Turbine
Jacket Structure
11
“EMSHIP” Erasmus Mundus Master Course, period of study September 2012 – February 2014
installed directly onto the jacket, removing the landing device and joining the jacket interface
frame with the turbine interface frame at the transition piece (Beatrice Wind Farm, 2007). The
following figure shows the installation of the OWT into the completed jacket. The landing
device can be seen above the transition piece.
Figure 3: OWT Installation Procedure on a Jacket. Source: http://offshorewind.net/Other_Pages/Turbine-
Foundations.html
As detailed previously, the present project deals with the characterization of OWT jacket
support structures and the design of a simplified tool to calculate during the design stage the
component’s strength when the jacket is submitted to a ship impact.
Page 12
P 12 Andrés Barrera
Master Thesis developed at ICAM, Nantes
2.3 Ship Collisions With Offshore Structures
Ever since the first offshore structures where installed in the Gulf of Mexico at the beginning
of the last century, the collision with passing and operating ships has been a major concern to
guarantee the safety and operational durability of the structures. For this reason, continuous
research is being carried out in this field to characterize the collision and failure procedure of
the offshore structures and the impacting vessels, to reduce the risk of potential collision,
mitigate structural and environmental damage, prevent the loss of life and overall resources.
In the branch of numerical simulations to characterize offshore collisions, various software have
been employed and developed.
(Visser, 2004) established that to assess the resistance of components of fixed platforms, the
manners in which energy is dissipated include:
Local denting
Elastic beam bending
Plastic bending/hinge formation
Plastic tensile strain
Global deflection of the installation
Local deformation of the ship
These factors are commonly used throughout the literature to characterize the failure behavior
of offshore structures in numerical, analytical and experimental approaches.
(Amdahl and Johansen, 2001) sought to establish design curves for ship bow impacts against
jacket legs using the non-linear finite element code LS-DYNA to be implemented in the
NORSOK N-004 code, which will later be used for the strength calculations of the platforms.
The authors propose three types of energy dissipation behaviors. The one characterized by
strength design where the ship dissipates most of the impact energy (rigid structure), ductile
design where the offshore structure absorbs most of the energy (rigid ship) and a shared energy
design in which both the ship and the structure add to the energy dissipation (deformable ship
and structure).
The idealized bow of a 2-5000 ton vessel is used, modeling the entire structure including
stringers, decks and simplified manholes and cutouts. A piece-wise linear isotropic hardening
model is adopted for the ship, with properties of mild steel without accounting for the effects
of strain rate. For the study of the impact on jacket legs a shared energy design is assumed to
determine the force deformation relationships for jacket legs with diameters in the range of 1.5-
2.2 m, that suffer impacts with an energy of 50 MJ which the leg should resist, preventing
significant denting.
Page 13
Collision Failure Study of Rigid Ship Models with a Deformable Offshore Wind Turbine
Jacket Structure
13
“EMSHIP” Erasmus Mundus Master Course, period of study September 2012 – February 2014
(Grewal and Lee, 2004) conducted an investigation on the minimum strength of several designs
of offshore platforms when subjected to ship collisions to try and establish the minimum amount
of plastic energy absorption the structures must withstand during a collision scenario and to
evaluate the effects on the Reserved Strength Ratio, which is the relation between the shear
force during platform collapse and that of a 100 year environmental lateral loading, according
to the American Petroleum Institute’s API RP2A-LFRD. The types of structures analyzed
included a braced caisson, a 4 pile jacket, a 3 pile monotower and a Vierendeel with a design
waterline of 34 m. The ABAQUS/AQUA software was used to carry out the Finite Element
analysis, accounting for the buoyancy and wave loading. The joints between the tubular
members were rigid and springs were attached in the mudline to represent the soil structure
interaction, with the stiffness values defined in the API RP2A-LFRD. The topsides load was
applied on the highest section of the platform with the deck assumed as rigid. Also, a series of
simulations of all the structures without the foundations was carried out and it was determined
that the Reserved Strength Ratio was very sensitive to the consideration of the foundation. For
the jacket simulations a comparison for the pushover analysis considering the replacement of a
member with one with reduced diameter according to
𝑑𝑟𝑒𝑑 = (𝑀𝑝𝑑
𝑡𝜎𝑦)1/2 + 𝑡 (1)
where 𝑀𝑝𝑑 is the reduced plastic bending moment of the damaged member, 𝜎𝑦 is the yield stress
and t is the thickness of the tube member. For the jacket model, the complete elimination of the
impacted element did not present any influence on the RSR because of its high redundancy.
The analyzed structure thus was fit to survive a ship impact of 3500 tones with an impact
velocity of 2.5 m/s.
Moreover, in the simulations without the foundations, similar results were produced to those
with the foundations, including the fact that most of the kinetic energy is dissipated locally on
the impacted member, so the rest of the platform experiences little deformation. Finally it was
determined that higher damage occurred when pinning the platforms to the seabed than when
using a soil structure interaction.
(Biehl, 2005) discusses the results of a series of collision simulations carried out using LS-
DYNA for ship to OWT mono pile, jacket and tripod support structures. The 4 ship models, a
31,600 deadweight double-hull tanker, a 150,000 single hull tanker, a 2300 TEU container ship
and a 170,000 bulk carrier were modeled as deformable sections with added part inertias to
represent the remainder of the mass of the ship to reduce computational times. Moreover, the
Page 14
P 14 Andrés Barrera
Master Thesis developed at ICAM, Nantes
hydrodynamic forces and the soil-foundation interaction were integrated into the LS DYNA
simulations with existing algorithms. Additionally, an implicit pre-calculation was run to
initialize the soil stress field, the gravity loads and wind turbine working loads.
This investigation focused on side impacts as these were determined to be the most detrimental
for environmental reasons, as the side of the ships are more vulnerable to hull ruptures. Thus
the side impact simulations were carried out at 2, 3 and 4 m/s velocities.
Failure criteria was evaluated according to a 30% plastic strain value for steel.
Figure 4: LS-DYNA Collision Simulation Configuration (Biehl, 2005)
(Haris and Amdahl, 2013) presented a simplified methodology to calculate a collision scenario
between two deformable ships in a right angle. The methodology was compared against LS-
DYNA calculations for numerical validation.
Deformable ship models were used for validation and the meshes were constructed using
Belitschko-Tsay shell elements (Hallquist, 2006). The steel used in the simulation had a power
law stress-strain relationship, with a nominal yield stress of 235 MPa, a modulus of elasticity
equal to 207,000 MPa and a friction coefficient of 0.3
The numerical results showed that for the case of a relatively rigid bow and a rigid bow
impacting the deformable side of a ship the crushing force/indentation curves for the impacted
section were similar, with a 6% difference on the absorbed energy for a 2.20 m penetration.
This is a very interesting conclusion for this thesis, as the simulations were all performed using
rigid ships and possible further work includes assessing the variation in results with a
deformable bow. The results are shown in the following figure.
Page 15
Collision Failure Study of Rigid Ship Models with a Deformable Offshore Wind Turbine
Jacket Structure
15
“EMSHIP” Erasmus Mundus Master Course, period of study September 2012 – February 2014
Figure 5: Comparison of Semi Rigid and Rigid Bow Impact Simulations Against a Deformable Side.
Source: (Haris and Amdahl, 2013)
(Vredeveldt and Schipperen, 2013) on the other hand presented the results of collision
simulations using S460 steel as an elastic material with a piecewise linear isotropic hardening
mechanism using a fracture strain of 22%. For the models, 4 node Belytshko-Tsai shell elements
with 5 integration points were used, with the ship behaving as a rigid body. The legs of the
jacket were considered as fixed to the sea floor, and an implicit pre-load simulation was carried
out to obtain an adequate gravity load. This results in a realistic approach of the loading
condition of a jacket during a ship impact, thus simulating the topside behavior more
realistically, ideally resulting in lower energetic values.
2.4 Super-element Method
Studying the dynamics of a ship collision requires consideration of many factors. The study of
ship collisions can be divided into three categories: experimental, numerical simulations and
simplified analytical methods (Haris and Amdahl, 2013). Experimental studies are generally
used to validate the other two; however because of the high cost associated to them these are
not widely used to assess ship collisions.
The relative (as compared to the other two categories) straightforwardness of simplified
analytical methods is a very interesting characteristic of this solution. One of the earliest
attempts in presenting a simplified analytical solution to ship collisions was (Minorsky, 1959).
More recent studies has been carried out to calculate the crushing resistance and local denting
of web girders under localized loads (Hong and Amdahl, 2008).
Page 16
P 16 Andrés Barrera
Master Thesis developed at ICAM, Nantes
Research has also been performed for impacted panels, and simplified methodologies to
calculate the crushing resistance of metal plates have been presented by (Ohtsubo and Wang,
1995; Wierzbicki, 1995; Zhang, 2002).
With the previously illustrated methodologies closed-form analytical formulations of the
resistance of each component of a ship’s structure (web girders, side panels and intersection
between these) can be obtained. Combining these, the overall capacity of a ship to withstand an
impact with another vessel can be calculated.
The super-element method, which was first proposed by (Lutzen et al., 2000) for perpendicular
ship impacts by a rigid bow, divides the ship into large structural components and estimates its
crushing resistance according to the summation of the results from the different parts. This
produces the internal mechanics behavior of the ship, which must be coupled with the external
mechanics (the global ship motion considering its interaction with the fluid that surrounds it) to
obtain accurate results (Le Sourne et al., 2012).
Therefore the structure of the impacted ship is divided into four types of super-elements (Lutzen
et al., 2000):
1. A rectangular plate simply supported on its four edges that experiences out of plane
deflections and ruptures when the deformations exceed the threshold value. It is used
for longitudinal bulkheads, inner and outer side platings.
2. A rectangular plate simply supported on three edges, with the last free and an in-plane
load in a right angle collision. The failure of this plate is characterized by successive
folds resembling a concertina. It serves to model bulkheads, web girders, frames, bottom
and inner bottom.
3. A beam with a force normal to its axis, with a two phase collapse. First it fails by a
mechanism of plastic hinges and later behaves like a plastic string, with a resistance
equal to zero after fracture.
4. X, T and L type intersections, which are used to model the intersection between
transverse bulkheads and mid-decks and transverse bulkheads and the weather decks.
When the axial reduction is equal to the length of the intersection, its load drops to zero.
Page 17
Collision Failure Study of Rigid Ship Models with a Deformable Offshore Wind Turbine
Jacket Structure
17
“EMSHIP” Erasmus Mundus Master Course, period of study September 2012 – February 2014
Figure 6: Super-element types. Source: (Lutzen et al., 2000)
The basic formulation is based on the evaluation of the external and internal energy rates of the
super-element in question. The external energy rate is evaluated with the following equation:
𝐸𝑒𝑥𝑡̇ = 𝐹 ∗ �̇� (2)
Here, Ėext represents the external rate energy absorbed by the super-element, F represents the
resistance of the super-element and �̇� the penetration rate of the striking ship.
The internal energy rate is represented by:
𝐸𝑖𝑛𝑡̇ = ∫ ∫ ∫ 𝜎𝑖𝑗 ∗ 𝜖𝑖𝑗̇ ∗ 𝑑𝑉 (3)
With V equal to the volume of the body, 𝜎𝑖𝑗 represents the stress tensor and 𝜖𝑖𝑗̇ is the strain rate
tensor. A series of simplifications are carried out to facilitate the analytical solution of the
previous equation. These include:
1. The material of the super-element is assumed to be perfectly rigid and the flow stress
σo is governed by the following equation:
Page 18
P 18 Andrés Barrera
Master Thesis developed at ICAM, Nantes
𝜎𝑜 =𝜎𝑦 + 𝜎𝑢
2 (4)
Where 𝜎𝑢 represents the ultimate stress and 𝜎𝑦 the yield stress. This average serves to
simplify the strain hardening effect.
2. The total internal energy rate has its initial contribution due to the bending internal
energy rate, which as the effects of flexion lie within defined plastic hinge lines m, is
equal to
𝐸�̇� = 𝑀𝑜 ∑ �̇�𝑘
𝑚
𝑘=1
𝑙𝑘 (5)
Here, 𝑀𝑜 equals the plastic bending moment, 𝑙𝑘represents the length of the plastic hinge
and �̇�𝑘 accounts for the rotation.
3. A secondary component of the total energy rate is the membrane energy rate, which if
defined for a plate of a thickness equal to tp,
𝐸�̇� = 𝑡𝑝 ∬ 𝜎𝑖𝑗 ∗ 𝜖𝑖𝑗 ∗ 𝑑𝐴 (6)
Here, A is the area of the plate creating the deformation. Considering a plane
stress state, the Von Mises yield criterion produces:
𝐸�̇� =2𝜎𝑜𝑡𝑝
√3∬ √𝜖𝑋𝑋̇
2 + 𝜖𝑌𝑌̇2 + 𝜖𝑋𝑌̇
2 + 𝜖𝑋𝑋̇ 𝜖𝑌𝑌̇ 𝑑𝑋𝑑𝑌 (7)
Therefore, to obtain the total internal energy rate, the membrane energy rate and the bending
energy rate are added together:
𝐸𝑖𝑛𝑡̇ = 𝐸�̇� + 𝐸�̇� (8)
The previously described simplified procedure was presented in (Le Sourne et al., 2012), which
also states that the most complex component of this calculation is the strain rate tensor 𝜖𝑖𝑗̇ which
is defined by displacement fields defined according to impact trials or numerical simulations.
This leads to overestimations of the resistance of the super-elements if the displacement fields
are not defined in an accurate manner.
The original super-element method was only valid for perpendicular collisions between ships,
however (Buldgen et al., 2013a, 2012) extended the methodology for oblique collisions between
two ships and inclined ship sides and (Buldgen et al., 2013b) devised the super-element
methodology for ship collisions with lock gates.
Page 19
Collision Failure Study of Rigid Ship Models with a Deformable Offshore Wind Turbine
Jacket Structure
19
“EMSHIP” Erasmus Mundus Master Course, period of study September 2012 – February 2014
The extension of the super-element method to simulate the collisions between striking ship
stems and a leg or brace of a jacket of an OWT was presented to the CHARGEOL project
partners by (Buldgen, Loïc and LeSourne, Hervé, “Impact on Cylinders”, 2013). The dynamics
of the collision are characterized by the following variables:
The length of the impacted cylinder L, its radius R, thickness tp, the inclination of the cylinder
ζ, the major and minor axes q and p in the uppermost deck of the striking stem (idealized as an
ellipse), the stem and side angles φb and Ψb respectively and the height of the stem model hb,
the relative inclination between the cylinder and the vessel α, the longitudinal position of the
stem Yp and its vertical position Zs, as shown in the following figure.
Figure 7: Geometrical Variables for the Calculation of the Internal Energy on a Cylinder. Source:
Buldgen, Loïc and LeSourne, Hervé, “Impact on Cylinders”, 2013
The cylinder can be defined as a series of smaller geometries which dissipate the membrane
and bending energy, which summed equal the total internal energy absorbed by the impacted
cylinder.
The current work aims to set the numerical grounds for the preliminary formulation of the
aforementioned super-element scheme for cylinders to OWT jackets. The development of the
project will be discussed in the following sections
Page 20
P 20 Andrés Barrera
Master Thesis developed at ICAM, Nantes
2.5 LS-DYNA
All of the simulations presented in this dissertation were carried out using the LS-DYNA
general purpose finite element program. Its capacities include the ability to simulate nonlinear,
transient problems using explicit or implicit time integration.
A nonlinear software is required for collision simulations because of the large deformations
associated to the deformable components, as well as transient dynamic capabilities to assess
short duration collisions which consider inertial forces.
The implicit capacities of the software were used in the
*CONTROL_DYNAMIC_RELAXATION keycard to initialize the stresses for the preload due
to gravity in some simulations.
For all models Belytschko-Tsai elements were used with three integration points because of
their computational efficiency. These are based on a combined co-rotational and velocity-strain
formulation.
The velocity-strain displacement relations are evaluated at the quadrature points within the
defined shell and the resulting stresses are integrated throughout the thickness of the shell to
produce the local resultant forces and moments. For more information refer to (Hallquist, 2006).
Page 21
Collision Failure Study of Rigid Ship Models with a Deformable Offshore Wind Turbine
Jacket Structure
21
“EMSHIP” Erasmus Mundus Master Course, period of study September 2012 – February 2014
3 PROJECT DEVELOPMENT
3.1 Collision Survivability Regulations
Classification societies and consultancy companies have guidelines for the design, construction
and certification of OWT, which give detailed procedures on the recommended design of the
supporting structure and its survivability during a collision scenario. (DNV, 2010) classifies a
collision as a variable load and it is stated that impact from approaching ships shall be
considered as variable functional loads which must be treated as an ultimate limit strength
analysis, accounting for the environmental loads from wind, waves and current and the added
water mass of the ship. The load to be considered is the largest unintended impact load in normal
service conditions, which must not cause damage to the support structure and the foundation.
The secondary structural elements such as boat landings must not suffer damage that leads to
the loss of their functions. The guideline provides no details on the procedure to calculate the
largest unintended impact load, but suggests that a risk analysis must be performed.
(GL Renewables Certification, 2012) on the other hand, establishes that “The structural design
of offshore wind turbines shall be based on verification of the structural integrity of the load-
carrying components. The ultimate and fatigue strength of structural members shall be verified
by calculations and/or tests to demonstrate the structural integrity of the offshore wind turbine
with the appropriate safety level.”
“The boat impact should be taken to be not less than that caused by the dedicated supply vessel
coming into contact with the offshore wind turbine support structure. It should be assumed in
this case that all the kinetic energy is absorbed by the turbine structure. The total kinetic energy
involved can be expressed as”:
𝐸𝑘𝑖𝑛 = 0.5 ∗ 𝑎 ∗ 𝑚 ∗ 𝑣2 (9)
Where m represents the vessel displacement in tons, a is the added mass coefficient, which is
1.4 for sideways collisions and 1.1 for bow or stern collisions and v is impact speed in m/s.
The vessel’s impact speed is the speed at the moment of collision. This speed is difficult to
control, especially in rough environment. As the intention is normally to approach a boat
landing with zero speed, the actual value is driven by the environmental conditions. The impact
speed can be estimated based on the actual wave height:
𝑉𝑏𝑜𝑎𝑡 = 0.5𝐻𝑠𝑇 (10)
Here, Vboat is the impact speed in m/s and HsT represents the maximum significant wave height
in which the service vessel is allowed to operate, in m.
Page 22
P 22 Andrés Barrera
Master Thesis developed at ICAM, Nantes
3.1.1 Definition of Collision Velocity
As shown in the previous section, (GL Renewables Certification, 2012) defines the collision
velocity according to the maximum significant wave height in which the service vessel can
operate in. Since there is no fixed Offshore Supply Vessel (OSV) in the project it is difficult to
establish a significant wave height. (Smith, 2007) presented a formula to define the design
wave height according to the length of the ship:
𝐻 = 0.61 (𝐿𝑠)0.5 (11)
Where H is the design wave height in meters and Ls is the Ship length in meters.
For the OSV, the CHARGEOL project partners defined the maximum weight and length overall
as 5000 dwt and 80 m respectively (Minute of Meeting 2, M. Gelebart, STX SOLUTIONS
FRANCE, 18-09-2013). This configuration would represent a design wave height of 5.46 m
and an impact velocity of 2.73 m/s using equations (12) and (14).
In the offshore industry, the Norwegian Petroleum Directorate requires that platforms be
designed for impacts from supply vessels of 5000 tons displacement with a 2 m/s speed and a
resulting kinetic energy of 11 MJ for a bow or stern impact (Amdahl and Johansen, 2001).
(Amdahl and Johansen, 2001) established how risk analysis of planned North Sea jacket
installations located close to lanes with heavy ship traffic produced possible collisions with
passing vessels with a kinetic energy in the range of 40-50 MJ, which are equal to a collision
with a 2000 to 3000 ton displacement ship travelling 6-7 m/s. Higher kinetic energies from
more damaging collisions than those presented by the NPD are therefore a possibility. On these
grounds, the simulation velocities were defined. The reference velocity was established as 2
m/s, and additional values of 5, 6 and 8 m/s were also included to account for possible heavy
ship traffic scenarios.
3.2 Ship Type Selection
Possible ship types selected for the collision simulations were defined by the project partners
(Minute of Meeting 2, M. Gelebart, STX SOLUTIONS FRANCE, 18-09-2013). These included
a crude oil carrier and a monohull OSV with a 5000 ton displacement configuration.
From the literature review it was decided to omit the deformable ship from the simulations,
because of the added complexity and the results observed in (Haris and Amdahl, 2013) for semi
rigid and rigid bows, which presented very similar data for the collision force in the case of two
impacting ships. This means that there was no deformation occurring on the ship models and
all of the impact energy is absorbed by the jacket structure. This creates a conservative
Page 23
Collision Failure Study of Rigid Ship Models with a Deformable Offshore Wind Turbine
Jacket Structure
23
“EMSHIP” Erasmus Mundus Master Course, period of study September 2012 – February 2014
approximation when the case study is focused on the jacket structure, as significantly more
damage will occur to it (as suggested in (GL Renewables Certification, 2012)) .
3.1.2 Crude Oil Carrier
To reduce computational time only the bow section of the model ships were used. The crude oil
carrier bow model includes all the structural details, therefore to account for the total mass of
the ship the bow section had the material characteristics of the real ship, while the remaining
section was added as a part inertia with the remaining mass plus the added mass at the ship’s
C.G. with the respective components of the inertia tensor Ixx, Iyy and Izz (the components of
tensors of degree two, which include Ixy,Ixz Iyz were taken as 0) in the principal axes.
The following figure shows the overall properties of the crude oil carrier model, including the
geometry of the bow section.
Figure 8: Crude Oil Carrier (Tanker) Particulars
3.1.3 OSV (Offshore Supply Vessel)
For the OSV model, only the plating was modeled. This means that the remaining weight of the
ship, plus the added mass was included as a part inertia exactly as was done for the crude oil
carrier. The idealized OSV is similar in displacement and size to DAMEN’s PSV 4000 with an
approximate displacement of 5833 tons. The properties for the rigid ship model are illustrated
in the following figure.
Page 24
P 24 Andrés Barrera
Master Thesis developed at ICAM, Nantes
Figure 9: OSV Particulars
This model is representative of a typical OSV used for installation and maintenance of OWF.
3.3 Jacket Model
The mesh used for the jacket was provided by STX SOLUTIONS FRANCE according to their
design. The same model was used in all simulations Two models were supplied, an initial model
without the transition piece or the boat landing and the final CAD model with the transition
piece and boat landing unit (besides these changes, the models are the same). The initial model
(without the transition piece or the boat landing unit) was only used for the first two simulations.
To represent the deformation constraints of the mast on the transition piece, rigid element beams
were set up at junction between the two, which can be seen in the top view of Figure 10. The
numbering of the legs and braces was maintained according to the LS DYNA model.
Page 25
Collision Failure Study of Rigid Ship Models with a Deformable Offshore Wind Turbine
Jacket Structure
25
“EMSHIP” Erasmus Mundus Master Course, period of study September 2012 – February 2014
Figure 10: Jacket Particulars
The following table illustrates the geometrical characteristics of the OWT, including the forces
and moments on the top of the tower used for the simulation presented in section 3.6.5.
Page 26
P 26 Andrés Barrera
Master Thesis developed at ICAM, Nantes
Table 1: Detailed Properties of OWT
3.4 Simulations Setup
All simulations have an endtime of 2 seconds with the time step determined automatically by
LS DYNA (2 seconds were sufficient to simulate the entire crushing process of the jacket).
Only the simulation with the OSV model and the jacket with the full tower had an increased
end time of 6 seconds to observe the oscillatory effects of the tower. According to the defined
element size, the time step is approximately 8.29 e-6 seconds.
3.4.1 Boundary Conditions and Contact
The boundary conditions on the mudline (legs of the jacket) were modeled as single point
constraints (SPC), clamped condition, restricting translational and rotational constraints in all 3
axes. No soil structure interaction was considered. (Dalhoff, 2005) states that a very rigid soil
may lead to conservative results, since the foundation is taking more of the impact. A lack of
soil structure interaction therefore will also lead to conservative results.
The contact between the rigid ship model and the jacket was defined as a
*CONTACT_AUTOMATIC_SURFACE_TO_SURFACE in LS DYNA, defining the
impacted leg as the Master and the rigid ship as the Slave. The dynamic and static friction
coefficients used for the collision were both 0.3 (Alsos et al., 2009; Haris and Amdahl, 2013).
Belytschko-Tsay shell elements with three integration points through the thickness were used
for the jacket structure, as these are the most economical and are more efficient than Hughes-
Liu shell elements by a factor of three (Schweizerhof et al., 1992).
Page 27
Collision Failure Study of Rigid Ship Models with a Deformable Offshore Wind Turbine
Jacket Structure
27
“EMSHIP” Erasmus Mundus Master Course, period of study September 2012 – February 2014
3.4.2 Hydrodynamic Forces
The hydrodynamic forces that drive the ship’s motion before and during the collision were not
considered, nor where the sea conditions taken into account. Because the ship in the simulation
only experiences surge motion (in the y axis) a 5% added mass was included in the total mass
of the model (Bhatta, 2003).
3.4.3 Materials
The steel used in the jacket was modeled with Material number 024
(MAT_PIECEWISE_LINEAR_PLASTICITY). The first part of the curve presented in Figure
11 represents the elastic phase, followed by the plastic phase after the yield stress is reached
(σ0 = 255 MPa). A 25% elongation to failure was defined for the structural steel used in the
jacket, which represents the AFNOR E26.4 steel for welded circular tubes (Key to Metals AG,
2014).
Strain hardening was not used for the jacket structure because the simulations were validated
using the results from (Amdahl and Johansen, 2001), which will be detailed in the following
section. These did not account for strain hardening to produce the energy and resultant force
curves to be implemented in the NORSOK N-004 Standard for the Design of Steel Structures.
Figure 11: E26.4 Steel used for Jacket
The striking ship was given a MAT_RIGID material from the LS DYNA material list. The
material properties, which are useful to simulate the contact penalties between the ship and the
jacket are presented in the following table.
Page 28
P 28 Andrés Barrera
Master Thesis developed at ICAM, Nantes
Table 2: Rigid Material Properties for Hulls
3.5 Model Validation
(Amdahl and Johansen, 2001) presented a series of curves for a 2-5000 ton OSV collision study
with an impact velocity of 2 m/s against a deformable offshore jacket with leg dimensions 1.8
m diameter and 0.07 m thickness. A center leg at an elevation of 122 m was collided in the
scenario used as comparison. The publication suggests that these curves should be
representative of 2000-5000 tons OSV collisions with legs with diameters between 1.5-2.2 m.
Also, these curves were suggested for implementation into the NORSOK N-004 Standard for
the Design of Steel Structures. Therefore these will be used for the validation of the models
presented.
The jacket model used in this thesis has a diameter of 1.3 m and a thickness of 0.05 m. Even
though it is out of the range curves presented by (Amdahl and Johansen, 2001), the tendency
should be observed. The original curves are presented in the following figure, where the
maximum internal energy of the platform, and the crushing force of the leg can be observed.
Figure 12: Reference Force and Internal Energy Curves. Source: (Amdahl and Johansen, 2001)
For the comparison, the 5000 ton OSV was impacted against leg 529 at a 2 m/s velocity, at
34.58 m from the mudline (bow impact location) without considering the effects of gravity nor
Page 29
Collision Failure Study of Rigid Ship Models with a Deformable Offshore Wind Turbine
Jacket Structure
29
“EMSHIP” Erasmus Mundus Master Course, period of study September 2012 – February 2014
the loads of the OWT. The details of this simulation are presented in section 3.6.4.1. As
expected, there is a discrepancy between the results in (Amdahl and Johansen, 2001) and the
LS-DYNA simulation. The maximum crushing force obtained was 19% higher than the
reference, while the internal energy at a maximum penetration of 0.6 m was about 50% that of
the reference.
Comparison of the curves reveals an ideal tendency between both the reference and the
numerical simulation in LS-DYNA, which means that the results obtained from the simulations
are in accordance with the literature, and with the magnitudes of the values obtained for
energies, forces and penetration.
Figure 13: Validation of the Numerical Model
0,000
5,000
10,000
15,000
20,000
25,000
-0,20 0,00 0,20 0,40 0,60 0,80 1,00
Cru
shin
g Fo
rce
(MN
)
Penetration (m)
Force-LSDYNA
Force-Amdahl
Energy-Amdahl
Energy-LSDYNA
Page 30
P 30 Andrés Barrera
Master Thesis developed at ICAM, Nantes
3.6 Collision Simulations
3.6.1 Crude Oil Carrier Simulations
To better understand the failure process of the structure for the super-element validation, the
most critical scenario was chosen for the initial simulations. Therefore the 144000 displacement
crude oil carrier was used at 8 and 2 m/s at different impact angles for both a leg and brace
collision, which represent extremely high energy collision scenarios (the 8 m/s case is not
realistic, but an understanding on the failure behavior at high velocities is required).
The objective of this section was to identify whether the jacket members deform in a global
(complete member deformation), local (cross section deformation of the tube) manner, or a
combination of both in high energy collisions.
The cases analyzed with for a brace joint impact include:
1. Brace Joint Collision, 90°, 8m/s
2. Brace Joint Collision, 90°, 2m/s
3. Brace Joint Collision, 30°, 2m/s
Comparisons were carried between cases 1-2 and 2-3 to determine the sensitivity to variation
in velocity and angle.
Additionally, the cases analyzed for a leg impact were:
4. Leg Collision, 90°, 8 m/s
5. Leg Collision, 90°, 2 m/s
6. Leg Collision, 30°, 2 m/s
Comparisons were carried between cases 4-5, 5-6 and 2-5 to determine the sensitivity to
variation in velocity, angle and impact location.
3.6.1.1 Brace Joint Collision, 90°, 8m/s
Because of the geometry of the hull of the crude oil carrier, the bulbous bow collides with the
jacket before the stem, as pictured in Figure 14. The bulbous bow was positioned 44 m from
the mudline, as during this stage the reference waterline had not been defined. The simulation
time was 2 seconds, however it was stopped at 0.78 seconds, when total joint rupture had
occurred. As this simulation is characterized by an extremely high energy for the jacket total
destruction of the component is expected for larger simulation time. Initially, the local failure
behavior must be characterized so the end time was adequate for the purpose.
Page 31
Collision Failure Study of Rigid Ship Models with a Deformable Offshore Wind Turbine
Jacket Structure
31
“EMSHIP” Erasmus Mundus Master Course, period of study September 2012 – February 2014
One of the impacted braces was sectioned in two equal components (parts 588 and 525, pictured
below) to determine their deformation and internal energies.
Figure 14: Brace Joint Collision, 90°, 8m/s Configuration
It is expected that when running this simulation with a larger end time (approximately 6
seconds), the entire jacket components that come in contact with the rigid ship will be sheared
off, because the total energy available for the collision was 4462 MJ, which represents a high
energy value when compared to the values proposed by (Amdahl and Johansen, 2001).
The internal energy of the two brace sections (525 and 588) and the leg directly in contact with
part 588 were plotted versus penetration, as it was established that the leg also suffered elastic
deformation due to the collision. From the post processing it was established that the rupture
occurred with a penetration depth of 1.43 m and a total energy of 0.8 MJ. In the case of the
brace section, up to the point of rupture both absorb approximately the same energy, after which
part 525 does not dissipate any more energy, while the value of 588 increases almost linearly.
The maximum internal energy for part 525, 0.47 MJ occurred at rupture while the maximum
value for section 588 was 0.77 MJ with a penetration depth of 3.37 m. The maximum
penetration recorded was 6.04 m.
The total internal energy dissipated by the structure was 1.67 MJ at a penetration depth of 3.37
m. It occurred after joint rupture, since the bow is still in contact with the parts and continues
to deform them until it is free of obstruction. Even though the total energy value is three orders
of magnitude larger than the design impact energy required by (GL Renewables Certification,
Page 32
P 32 Andrés Barrera
Master Thesis developed at ICAM, Nantes
2012), which is 10.5 MJ with a 5000 ton dedicated supply vessel, the information gathered
serves to better understand the jacket’s behavior under extremely high energy collisions.
Figure 15: Internal Energy of Assessed Parts
To measure cross sectional reduction (d) in the impacted zone, two nodes of part number 525,
(pictured in red in Figure 16 before and after joint rupture) were selected. The cross section
experienced a reduction of 50% (0.346m) of its diameter.
Figure 16: Impacted Joint Geometry Before and After Collision
Moreover, to corroborate that localized deformation occurred prior to global deformation in the
form of brace bending, the velocities of the selected nodes were plotted together. It can be seen
in Figure 17 that the impacted node was imparted with a higher velocity up to about 0.19
seconds, when the fracture of the joint occurred. This is indicative of local deformation in the
Page 33
Collision Failure Study of Rigid Ship Models with a Deformable Offshore Wind Turbine
Jacket Structure
33
“EMSHIP” Erasmus Mundus Master Course, period of study September 2012 – February 2014
form of cross sectional deformation. After this time step both nodes present approximately the
same velocity, which indicates that global deformation was occurring.
Figure 17: Impacted Section Node Velocities
Figure 18 shows the crushing for the cross brace joint composed of all the braces, where a 5.87
MN crushing force causes the rupture. The rupture occurs in the time interval from 0.18 to 0.22
seconds. This data is consistent with the comparison of the internal energies of the two parts
that compose the brace. The energy of part 588 becomes constant after a deformation of 1.4 m,
when a combination of global bending deformation and localized crushing at the joint between
parts 588 and the leg becomes the primary mechanism for energy absorption.
Figure 18: Crushing Force, Cross Brace Joint
Page 34
P 34 Andrés Barrera
Master Thesis developed at ICAM, Nantes
The following image illustrates the point at which the joint fails, at 0.19 seconds. The contours
of plastic strain above 0.01 are present in the central joint where the impact occurs, and on the
nodes between the braces and the legs. The rupture of the structure is clearly visible in the
center. Most of the impact energy is absorbed by the cross brace in question, however the upper
and lower brace joints also present plastic strain due to the separation of the joint until rupture
(not pictured).
Figure 19: Plastic Strain Distribution at Impacted Section
Because the jacket is a complex structure composed of a series of elements, the influence of
adjacent elements in a collision must be assessed. For a brace joint collision for example, the
legs to which these are attached are non-rigid supports and also deform, as was also defined by
(Cho et al., 2013) for H-brace structures. This reduces the membrane (crushing) force on the
impacted section and therefore the final cross section reduction (local tube crushing). This
phenomenon needs to be considered in the development of the simplified tool. The selected
nodes from which to measure the decrease in distance between legs for the collided joint are
illustrated in Figure 20. Before impact, the distance between nodes 566577 and 581261 was
7.821 m and after impact it was 7.777 m. Thus there was a reduction in length of 0.56 %. The
value is almost negligible, as the legs are much more rigid than the braces and the collision
velocity is considerably high.
Page 35
Collision Failure Study of Rigid Ship Models with a Deformable Offshore Wind Turbine
Jacket Structure
35
“EMSHIP” Erasmus Mundus Master Course, period of study September 2012 – February 2014
Figure 20: Selected Nodes for Measuring Decrease in Distance between the Legs
To verify the influence of the impact on a brace on the OWT, the displacement of the central
node of the transition piece shown in Figure 21 was plotted versus penetration (Figure 22). The
maximum displacement of 0.048 m occurred at 0.2 seconds, or after 1.4 m penetration. It can
be determined that for high kinetic energy brace impacts, up to the point of brace joint rupture,
the dispalcement of the OWT is very low.
Figure 21: Transition Piece Central Node
Figure 22: Displacement at the Center of the Transition Piece
Page 36
P 36 Andrés Barrera
Master Thesis developed at ICAM, Nantes
The three side views, front, side and top were produced at the final time step to better illustrate
the failure of the brace joint section. Plastic strain is only visible in the upper and lower cross
brace joints (from the collided joint). The legs did not suffer any plastic strain at the mudline as
can be determined form the following figure.
Figure 23: Front, Side and Top View of Plastic Strain Distribution
A high energy, high velocity collision with a jacket brace joint causes a combination of global
(bending force) and local (membrane force) focused on the impacted section, with little to no
impact on the remainder of the structure. A high energy, low velocity collision was studied
afterwards to assess the sensitivity of the structure to a variation in velocity.
3.6.1.2 Brace Joint Collision, 90°, 2m/s
The 2 m/s perpendicular collision on the brace joint was carried out with an updated version of
the jacket, which has the boat landing structure included. For this reason, the part numbers are
different; however the remaining geometry is similar to that of the jacket used for the previous
simulation.
As the collision velocity is considerably lower, higher relative energy compared to the impacted
brace energy is expected on the legs to which the cross braces are connected. For this reason,
these were included in the post processing (legs 528 and 529) and are pictured in Figure 24.
Page 37
Collision Failure Study of Rigid Ship Models with a Deformable Offshore Wind Turbine
Jacket Structure
37
“EMSHIP” Erasmus Mundus Master Course, period of study September 2012 – February 2014
Figure 24: Selected Parts for Analysis
As was hypothesized at the beginning of this section, the lower collision velocity permitted a
higher energy transfer from the impacting ship to the structure. This simulation was run for the
entire 2 seconds and even though the brace joint did not rupture higher plastic strain occurred
throughout the jacket. The total energy available for the simulation was 279 MJ. The total
internal energy dissipated by the structure up to the maximum penetration of 3.3 m was 58 MJ.
The following figure illustrates the internal energy distribution for the selected parts. As
compared to the previous simulation, legs 528 and 529 absorbed relatively higher internal
energy compared to the collided braces, which is due to the reduced velocity that does not allow
the development of the plastic field. This allows for higher structural deformation prior to brace
joint rupture, which did not occur within the defined runtime of 2 seconds.
Leg 529 absorbed the highest internal energy, approximately 16 MJ at the end the simulation,
followed by leg 528 which absorbed 15 MJ. Brace 534 absorbed 10 MJ. This value is higher
than the other two (541 and 533) because brace 534 is composed of the two sections exactly the
same as 541 and 543 as can be seen in Figure 24. 541 absorbed 6 MJ and 533 absorbed 2.5 MJ.
It is very interesting to note that even for a high kinetic energy collision of a brace joint, the
behavior of the jacket is susceptible to the collision velocity.
Page 38
P 38 Andrés Barrera
Master Thesis developed at ICAM, Nantes
Figure 25: Internal Energy of Assessed Parts
The plastic strain distribution throughout the structure can be observed in a front, side and top
view in the next figure. If compared to Figure 23, considerable plastic straining on legs 528 and
529 was obtained.
Figure 26: Front, Side and Top View of Plastic Strain Distribution
As before, the reduction in distance between the legs at the level of impact was measured to
assess the dependence to a decreased velocity. The measured distance between d before the
collision was 9.593 m and 8.203 m after the collision, for a 14.5 % (1.39 m) decrease in the
length between the legs, as compared to the 0.0056% change in distance with an 8 m/s collision.
The difference can be attributed to the plastic field that develops in the 2 m/s collision, which
does not occur in the 8 m/s case since the kinetic energy is considerably higher.
Page 39
Collision Failure Study of Rigid Ship Models with a Deformable Offshore Wind Turbine
Jacket Structure
39
“EMSHIP” Erasmus Mundus Master Course, period of study September 2012 – February 2014
Figure 27: Selected Nodes for Measuring Decrease in Distance between the Legs
From the results of the high energy collisions at 8 m/s and 2 m/s, it can be determined that up
to the point of brace joint rupture, a reduced velocity is more detrimental to the entire structure
as it allows for higher deformation throughout, including a decrease in the distance between the
legs at the level of impact which directly affects the amount of local (membrane) and global
(bending) deformation occurring.
This can be attributed to the better development of the plastic field in the 2 m/s collision. The 8
m/s collision does not allow the plastic field to develop, but rather causes a total rupture of the
brace.
3.6.1.3 Brace Joint Collision 30°, 2 m/s
The 30°, 2 m/s brace joint collision is characterized by a reduction in the collision angle from
90 degrees (perpendicular) to 30 degrees, as can be observed in the next figure. The collision
was set up to occur approximately at the same location as the previous simulations to permit
comparison of the results.
The maximum penetration occurring in this case was 3.1 m, occurring at the final time step of
the simulation.
Page 40
P 40 Andrés Barrera
Master Thesis developed at ICAM, Nantes
Figure 28: Simulation Layout
The internal energy transferred of the selected parts is illustrated in the following figure. These
were identified in Figure 24 of the previous section. The highest internal energy was absorbed
by brace number 534 (5.2 MJ), followed by leg 529 (3.2 MJ) and leg 528 (2.3 MJ), as compared
to the 2 m/s perpendicular simulation, where the two legs absorbed the highest energy. As
before, part 534 is composed of two sections equal to 533 and 541, which dissipated 1.78 MJ
each. It seems therefore that the reduction in angle focuses the energy transfer on the brace joint
parts itself, rather than on the legs as occurred in the previous case.
Figure 29: Internal Energy of Assessed Parts
The decrease in distance between the legs that support the analyzed cross brace was measured
before and after collision to determine its dependency on the collision angle. The distance
between nodes 616537 and 727741 shown in Figure 27 was measured as 9.594 before impact
and 9.364 after impact, for a 2.4% reduction in length between legs. The perpendicular collision
presented a 14.5% reduction in length, which reflects how the reduction in angle reduces the
deformation of the legs. Even though the brace joint did not rupture with a 30 degree collision
angle, the values for maximum penetration are almost the same (6% difference), therefore the
Page 41
Collision Failure Study of Rigid Ship Models with a Deformable Offshore Wind Turbine
Jacket Structure
41
“EMSHIP” Erasmus Mundus Master Course, period of study September 2012 – February 2014
values for decrease in distance between the legs can be compared to determine which collision
angle has a higher influence on the jacket structure.
The plastic strain distribution can be observed for the entire jacket in the front, side and top
views of the next figure. Here, a reduction of the plastic strain on the legs is clearly visible when
compared to the perpendicular collision. Plastic strain at the mudline is almost negligible for all
four legs and is concentrated in the area directly surrounding the impacted cross braces.
Figure 30: Front, Side and Top View of Plastic Strain Distribution
The variation in collision angle, from a perpendicular case to 30° reflected a reduction of the
internal energies of the legs directly in contact with the impacted joint brace. Also, one of the
impacted braces dissipated the highest internal energy, which is attributed to the variation of
the components of the crushing force.
3.6.1.4 Leg Collision, 90°, 8m/s
The remaining collision simulations with the crude oil carrier focus on leg impacts, which were
also modeled with a 44 m height from the mudline to maintain the contact height and permit
comparison to the brace joint impact cases, as shown in the next figure.
Page 42
P 42 Andrés Barrera
Master Thesis developed at ICAM, Nantes
Figure 31: Layout of Assessed Parts
Just as the 8 m/s brace joint collision simulation, this simulation was stopped after 0.78 seconds
since total jacket failure was observed after this time step, as most of the brace joints either
ruptured or experienced considerable plastic straining. Also it was desired to perform the
analysis within the same penetration range as the other 8 m/s collision for comparison purposes.
The total energy dissipated by the structure was 50 MJ with a maximum penetration of 5.6 m.
The 8 m/s brace joint collision simulation presented a penetration depth of 6.04 m with 1.67 MJ
dissipated by the jacket.
As before however, the energy transfer to the structure is insignificant compared to the total
energy available (4460 MJ). Further time steps would reflect the complete shearing of the
structure from the mudline but for the required comparison, it was determined that the 0.78
second end time is sufficient.
The internal energy of all 4 legs can be seen in Figure 32. Leg 529 (impacted leg) presents a
change in the slope at approximately 4 m of penetration, the same time at which the structure
reaches its limit strength (identified through post processing when all the cross brace nodes
failed). It is interesting to notice that leg 513 which is directly behind the impacted leg dissipates
the most internal energy, after 529. The internal energy after 5.6 m of penetration in leg 513 is
approximately 37% higher than legs 514 and 528.
Page 43
Collision Failure Study of Rigid Ship Models with a Deformable Offshore Wind Turbine
Jacket Structure
43
“EMSHIP” Erasmus Mundus Master Course, period of study September 2012 – February 2014
Figure 32: Internal Energy of Assessed Parts
Figure 33 shows the crushing force of the impacted leg and a maximum value of 12 MN is
reached with 4.8 m of penetration. It is observed that for the same 8 m/s leg and joint brace
simulations with the same end time (0.78 seconds), the same ship and jacket models with the
same conditions, the leg collision is more detrimental to the structure as reflected by the internal
energy and crushing force values. The difference in penetration of both simulations is 7.8%,
with the brace joint collision achieving a higher penetration.
Figure 33: Crushing Force of Impacted Leg
Figure 34 illustrates the plastic strain distribution in a front, side and top view. It can be observed
that all the joints between the cross braces have buckled by compression and failed, as some
have ruptured completely while the remaining joints have experienced considerable plastic
strain. All the joints connecting the cross braces between legs 529 and 513 fail after
Page 44
P 44 Andrés Barrera
Master Thesis developed at ICAM, Nantes
approximately 0.35 seconds and only the lower brace reinforcing the section near the mudline
remains fully connected, even though plastic strain is visible.
Figure 34: Front, Side and Top View of Plastic Strain Distribution
The localized and global deformation of the leg are illustrated in the following figure. The leg
experiences an out of straightness of 5.6 m (equal to the maximum penetration) The reduction
in length was also measured for the impacted leg section, which was virtually unchanged, from
10 m at the beginning to 10.08 m at the end.
For the membrane force, the impacted section presented considerable deformation. The shortest
side reduced to 25% of the original 1.3 m diameter, while the elongated side presented increased
in length 35%.
Figure 35: Detail of Deformation at Leg
To determine the deformation behavior of the leg the velocities of two opposing nodes in the
impacted section were plotted, as shown in Figure 36. The impacted node has a higher velocity
throughout the simulation, indicative that there is always local deformation in the form of cross
Page 45
Collision Failure Study of Rigid Ship Models with a Deformable Offshore Wind Turbine
Jacket Structure
45
“EMSHIP” Erasmus Mundus Master Course, period of study September 2012 – February 2014
sectional crushing in this section of the leg. It is observed however that most of the localized
deformation occurs up to 0.18 seconds, where the velocities of both nodes become very similar
and global deformation becomes the primary energy absorption mechanism for the impacted
leg.
Figure 36: Impacted Section Node Velocities
3.6.1.5 Leg Collision 90° 2 m/s
A simulation with crude oil carrier impacting the leg at 2 m/s was also carried out, where 60
MJ of internal energy were absorbed by the jacket structure at the final time step. This value
represents 21% of the total energy available for the collision, as compared to the 1.1% (50 MJ
of the 4460 MJ available) absorbed by the jacket structure in the 8 m/s leg collision. As with all
the other high energy cases (simulations with the crude oil carrier as the impacting ship), the
selected end time is not enough to see the stabilization of the collision, which is characterized
by a complete transfer of the ship’s kinetic energy to internal deformation energy of the
structure. Ideally this is the result that is sought, however as focus is required on more realistic
collisions with lower total energy and repeating all high energy simulations with a longer end
time (approximately 6-7 seconds) would require allotting about 300 hours of computational
time to each of the 6 simulations carried out. The results obtained presented nonetheless, very
useful information as to the failure procedure of the jacket in high energy collisions. The layout
for this simulation is represented in Figure 31.
Therefore the lower collision velocity permitted a higher deformation on the impacted leg as
compared to the 8 m/s collision, which as explained previously occurred because the plastic
field did not develop in the 8 m/s case.
Page 46
P 46 Andrés Barrera
Master Thesis developed at ICAM, Nantes
Figure 37: Internal Energy of Assessed Parts
The maximum crushing force obtained by leg 529 at the final time step of the current simulation
was 13.8 MN, as compared to the 12 MN of the 8 m/s simulation. For a high energy collision
the simulation with the lower velocity has produced a higher crushing (membrane) force and
internal energy for the impacted leg even though the penetration is 30% higher for the 8 m/s
scenario, which reflects the initial hypothesis that with a given penetration, the lower velocity
would be more detrimental as allows for more damage in the structure.
Figure 38: Crushing Force of Impacted Leg
Figure 39 shows the plastic strain coefficients for the impacted jacket. It is observed that with
a lower collision velocity the deformation on the impacted leg section is considerably high as
reflected by the concentration of plastic strain above 0.1 at this point.
Page 47
Collision Failure Study of Rigid Ship Models with a Deformable Offshore Wind Turbine
Jacket Structure
47
“EMSHIP” Erasmus Mundus Master Course, period of study September 2012 – February 2014
The length reduction between the brace joints to the leg section were measured before and after
impact to determine the influence of the braces on the leg section. The measured section had a
length of 12.28 m prior to collision, and was reduced to 11.83 m at the end of the simulation,
for a reduction of 4%. The most crushed side of the impacted tube section on the other hand
presented a length reduction of 90% from the original 1.3 diameter, while the most elongated
side increased 30% in length. The equivalent configuration used for both measurements is
illustrated in Figure 35 for the 8 m/s case.
Figure 39: Front, Side and Top View of Plastic Strain Distribution
3.6.1.6 Leg Collision 30° 2 m/s
The sensitivity of a high energy leg collision to a variation in angle was also assessed. The total
energy for this scenario was the same (279 MJ) with a 2 second runtime. However, the
maximum penetration depth was 3.41 m. Figure 40 illustrates the setup of the impacting ship
with respect to the jacket.
Figure 40: Simulation Layout
Page 48
P 48 Andrés Barrera
Master Thesis developed at ICAM, Nantes
The internal energy dissipated by the structure at the final time step (2 seconds) was 56 MJ,
19% of the total energy available. This value is 2% lower than the 60 MJ absorbed by the jacket
in a perpendicular 2 m/s collision.
The impact energies for all legs were plotted in the following figure. It is observed that leg 529
absorbs the highest internal energy, which accounts for 66% (37.16 MJ) of the total internal
energy dissipated by the structure, 4% higher than the energy absorbed by the same leg in the
perpendicular case. This can be attributed to the collision angle, because of which there is no
structural support directly behind the impacted section to transfer the load, so the energy
absorbed by the leg increases. Leg 528 absorbed the second highest internal energy, 7% (4.16
MJ), followed by leg 513 with 5% (3.16 MJ) and 514 with 2% (0.97 MJ). The results show that
the variation in angle changes the energy consumed by the remaining legs as was initially
supposed, when the collision angle points in the direction of a leg directly behind the impacted
one, its internal energy increases, which reflects a high sensitivity to collision angle.
Figure 41: Internal Energy of Assessed Parts
The maximum crushing force for the impacted leg was 14.49 MN with a 4.11 m penetration.
Figure 42 shows the crushing (membrane) force vs the penetration of the ship. The variation in
collision angle increases the magnitude of the crushing force on the collided leg when compared
to Figure 38 for a perpendicular collision, where the maximum crushing force attained was 13.8
MN. Again, since there is no structural support directly behind (in the direction of the ship’s
motion) the impacted, its crushing force tends to increase (5% increase was determined).
Page 49
Collision Failure Study of Rigid Ship Models with a Deformable Offshore Wind Turbine
Jacket Structure
49
“EMSHIP” Erasmus Mundus Master Course, period of study September 2012 – February 2014
Figure 42: Crushing Force of Impacted Leg
The velocities of two opposing nodes in the impacted section of the leg were also plotted in this
scenario to determine the deformation behavior. Figure 43 shows how throughout the
simulation and up to a time step of about 1.5 seconds the velocity of the impacted node is
considerably higher than the opposing node, which is indicative that localized deformation in
the form of cross sectional area reduction is occurring.
Figure 43: Impacted Section Node Velocities
Page 50
P 50 Andrés Barrera
Master Thesis developed at ICAM, Nantes
The plastic strain distribution throughout the jacket for a front, side and top view can be seen
in Figure 44, where the higher influence of the collision angle on leg 528 can be determined.
When compared to Figure 39, the plastic strain on Leg 513 is almost negligible.
Figure 44: Front, Side and Top View of Plastic Strain Distribution
After comparing the 30°, 2 m/s leg collision to the 90 °, 2 m/s leg collision the following
conclusions were made:
The variation in angle increased the percentage of internal energy absorbed by the
impacted leg from 62% to 66%, as well as reducing the amount of internal energy
dissipated by leg 513, from 18% to 5%. The increase of the internal energy on the
impacted leg is critical, as this is a primary supporting member. This behavior must also
be evaluated for the lower kinetic energy scenarios to identify if the trend is maintained
throughout the simulations performed, which would dictate that a collision at an angle
becomes more detrimental to the safety of the primary supporting members.
Page 51
Collision Failure Study of Rigid Ship Models with a Deformable Offshore Wind Turbine
Jacket Structure
51
“EMSHIP” Erasmus Mundus Master Course, period of study September 2012 – February 2014
3.6.2 OSV Simulations: Determination of Critical Impact Location
From the results obtained with the energy collision simulations, it was defined that a critical
impact location had to be determined to focus all further work. Therefore, two simulations were
carried out with the 5000 ton OSV:
Brace Joint Collision, 90° 6 m/s
Leg Collision, 90° 6 m/s
A 6 m/s velocity was defined since higher damage was expected at this velocity to have clearer
trends of the failure mechanics of the jacket.
The following image shows the setup for the both cases, the brace joint collision (Figure 45(a))
and the leg collision (Figure 45(b)). In Figure 45(a), the colliding ship was translated back in
the Y axis to show the impacted braces.
Figure 45: Brace Joint Collision (a) and Leg Collision Layouts (b)
The total energy available in both cases was 94.5 MJ. For the brace joint collision (Figure
45(a)), the jacket structure dissipated 93.9% of the total energy (88.7 MJ), with an additional
0.02 MJ dissipated as elastic energy. For this case the sliding energy accounted for 2.4% of the
total energy, which is within the acceptable limits when considering friction. The following
figure illustrates the energy exchange throughout the simulation, where it is seen that there is
almost no elastic energy, as the maximum and final values of the internal energy curve are the
same.
Page 52
P 52 Andrés Barrera
Master Thesis developed at ICAM, Nantes
Figure 46: Energy for the Brace Joint Collision
The leg collision case (Figure 45(b)) had very similar results as the brace joint, where the jacket
absorbed 95.3% (90.11 MJ) as elastic energy with an additional 0.09 MJ of elastic energy. The
sliding energy accounted for 4.6% of the total energy, which is also within acceptable limits.
To identify the most critical damage configuration, the internal energies, crushing forces and
displacement at the transition piece was compared for both simulations. Additionally, the
internal energies and crushing forces of the impacted braces were plotted in the case of the brace
joint collision Figure 45(a).
The following figure shows the internal energies of the four legs for the brace joint collision
(Figure 45(a)). Additionally, the percentages of energy (with respect to the total) dissipated by
each leg are included. Due to the geometry of the hull of the OSV, the contact occurred on legs
528 and 529 and on braces 532, 535, 536, 537, 540 and 542.
Figure 47: Internal Energy of Legs for Brace Joint Collision
Page 53
Collision Failure Study of Rigid Ship Models with a Deformable Offshore Wind Turbine
Jacket Structure
53
“EMSHIP” Erasmus Mundus Master Course, period of study September 2012 – February 2014
Moreover, the stem impacts the jacket before the hull in the brace joint collision (Figure 45(a)),
so it was expected for the braces in this section to present the highest internal energy. Figure 48
illustrates the internal energy of the impacted braces in the brace joint collision, with their
percentages with respect to the total energy.
The geometry of the OSV does not permit rupture of the braces because contact occurred with
the legs after 0.5 m of penetration. However, considerable plastic strain developed in the
impacted sections, with several elements deleted in both legs and the brace joint at the height
of the stem.
Figure 48: Internal Energy of Braces for Brace Joint Collision
The results of internal energy for the leg collision (Figure 45(b)) are illustrated in the next figure
including the percentages dissipated by each with respect to the total energy. Because the legs
dissipated 82% of the total internal energy for this case, no braces were considered in the
analysis.
Page 54
P 54 Andrés Barrera
Master Thesis developed at ICAM, Nantes
Figure 49: Internal Energy of Legs for Leg Impact
The crushing force of the impacted legs for the brace joint collision (Figure 45(a)) are presented
in the following figure, where it is shown that brace 535 (located in the stem impact section)
presented the highest crushing force, 6.14 MN at 2.45 m of penetration. Leg 529 was subjected
to a crushing force of 5.16 MN at 1.4 m of penetration, while leg 528 was subjected to 4.9 MN
at 2.6 m.
Figure 50: Crushing Force of Legs for Brace Joint Impact
Page 55
Collision Failure Study of Rigid Ship Models with a Deformable Offshore Wind Turbine
Jacket Structure
55
“EMSHIP” Erasmus Mundus Master Course, period of study September 2012 – February 2014
On the other hand, in the impacted leg scenario (Figure 45(b)) the crushing force for leg 529
was about 6 times higher than that of the previous case, with 33.3 MN as illustrated in Figure
51. Here, the leg suffered complete rupture at the stem section at approximately 3.2 m of out of
straightness deformation at the bow section.
Figure 51: Crushing Force of Impacted Leg
The overall jacket movement was assessed with a node created at the center of the transition
piece, which is illustrated in Figure 21. These curves were not plotted against penetration to
preserve the oscillatory motion after maximum penetration occurs.
The following figure illustrates the overall jacket motion for the both the brace joint impact and
leg impact cases.
For the brace joint impact, a maximum translation of 1.27 m was obtained at 1.3 seconds.
The leg impact scenario produced a maximum overall jacket motion of 1.1 m at 1.5 seconds.
The 0.17 m reduction can be attributed to the fact that the impacted leg shears absorbing most
of the available energy, compared to the brace joint case where the two impacted legs account
for approximately the same energy dissipated.
Page 56
P 56 Andrés Barrera
Master Thesis developed at ICAM, Nantes
Figure 52: Transition Piece Displacement for Leg Impact
Finally, the contours of plastic straining were compared for both cases. Figure 53 illustrates the
contours of plastic strain for the brace joint impact, where it is observed that most of the plastic
straining is concentrated in the stem impact section. Considerable plastic straining also occurred
at the mudline level of all 4 legs, and the side view reveals the deformed brace joint where the
bow collided.
Figure 54 shows the contours of plastic strain for the leg impact case. In comparison to Figure
53, most of the plastic straining is concentrated on the impacted leg, as evidenced by the front
and side views. The stem section has been sheared off, while considerable deformation is
observed on the section impacted by the bow. Upon visual inspection, the plastic straining at
the mudline level appears similar for both cases. However the present case shows higher plastic
straining on leg 513.
Page 57
Collision Failure Study of Rigid Ship Models with a Deformable Offshore Wind Turbine
Jacket Structure
57
“EMSHIP” Erasmus Mundus Master Course, period of study September 2012 – February 2014
Figure 53: Contours of Plastic Strain for the Brace Joint Impact
Figure 54: Contours of Plastic Strain for the Leg Impact
From the results the following conclusions can be made:
The leg impact case is more detrimental to the structural integrity of the structure, as
one of the legs (a primary support structure) is completely sheared off, and the
penetration depth was 20% higher with the same plastic straining at the mudline level.
Because the simulations will be compared against the results obtained from the
simplified calculation tool, initial numerical results will more than likely be needed for
individual members accounting for the contribution of the remaining structure. The
results of the leg collision show that most of the collision impact is absorbed by the
impacted leg, and presented a crushing force almost 6 times higher than that of the
Page 58
P 58 Andrés Barrera
Master Thesis developed at ICAM, Nantes
highest member for a brace joint collision. Therefore, at least in this stage of the project,
it was identified that the leg collision presents more relevant results.
Page 59
Collision Failure Study of Rigid Ship Models with a Deformable Offshore Wind Turbine
Jacket Structure
59
“EMSHIP” Erasmus Mundus Master Course, period of study September 2012 – February 2014
3.6.3 OSV Simulations: Sensitivity to collision angle, collision velocity and collision height
Having completed a basic characterization of the deformation procedure of the jacket in a high
energy collision and determining that the most critical collision scenario is based on a leg
impact, a case closely matching the requirements established in (GL Renewables Certification,
2012) was defined using the 5000 ton OSV. This section focuses on the sensitivity of the jacket
structure to a leg impact varying the collision angle, the collision velocity, and the collision
height with a dedicated supply vessel. The following simulations were performed in this section:
1. Leg Collision, 90°, 2 m/s, 34.58 m impact height
2. Leg Collision, 60°, 2 m/s, 34.58 m impact height
3. Leg Collision, 90°, 5 m/s, 34.58 m impact height
4. Leg Collision, 90°, 5 m/s, 39 m impact height
Comparisons were made between cases 1-2, 1-3 and 3-4 to characterize the jacket’s sensitivity
to the aforementioned variations.
During this phase of the project the average waterline of the jacket was defined as 34 m from
the mudline. The impact point for the OSV was set up at 34.58 m approximately. Since a tidal
variation of 11 m is expected as the working environment of the jacket structure, additional
impact simulations at 39 m from the waterline were carried out. All the scenarios in this section
were run with a 2 second end time as it was determined to be sufficient to characterize the
crushing process of the jacket.
The following figure shows the layout, leg numbering and variations for all 4 simulations which
include (b) the 34.58 m collision height, (c) the 60° collision angle and (d) the 39m collision
height.
Figure 55: OSV Layouts: (a) Leg Numeration, (b) 34.58 m, (c) 60°, (d) 39 m
Page 60
P 60 Andrés Barrera
Master Thesis developed at ICAM, Nantes
3.6.3.1 Leg Collision 90° 2 m/s, 34.58 m Height
The present configuration produced a total energy for the collision of 10.5 MJ. Figure 56
illustrates a complete energy transfer procedure, as compared to the results for the simulations
with the oil tanker where due to the high energy, the kinetic energy would not be dissipated
even after total destruction of the jacket. The kinetic energy should ideally reduce to zero;
however the internal energy of the structure increases to a maximum value of 9.78 MJ and
decreases to 8.21 MJ. This 16% difference between the maximum and final magnitudes of
internal energy represents the elastic energy of the jacket structure which forces the ship to
move backwards. The maximum internal energy is not equal to the total energy because of the
sliding energy, which includes the contact energy as a result of including static and dynamic
friction with coefficients of 0.3 has a maximum value of 0.5 MJ, representing 4.7% of the total
energy of the simulation, an acceptable value.
Figure 56: Energy Distribution throughout the Simulation
With the present configuration, the jacket did not experience rupture as shown in the next figure;
however there is considerable plastic strain on the two impact points, with a maximum
penetration of 0.61 m occurring at 1.17 seconds. After this time step, the elastic energy stored
by the structure dissipates by forcing the impacting ship to move back in the negative y-
direction which can be visually determined in Figure 65(a) with the increase in kinetic energy
after 1.17 seconds.
The following figure presents the internal energy dissipated by each leg and its percentage with
respect to the total energy available for the simulation. As expected, the impacted leg dissipated
Page 61
Collision Failure Study of Rigid Ship Models with a Deformable Offshore Wind Turbine
Jacket Structure
61
“EMSHIP” Erasmus Mundus Master Course, period of study September 2012 – February 2014
the highest internal energy. Overall, the legs absorbed 81.3% of the total energy of the
simulation. For this reason, the braces were not analyzed.
Figure 57: Internal Energy of Assessed Parts
The maximum crushing force for leg 529 was 2.8 MN which occurred at 0.76 seconds into the
simulation. As was expected of an adequate collision simulation, the crushing force reduces to
zero at the final time step, when there is no more contact between the ship and the jacket.
Figure 58: Crushing Force of Impacted Leg
Page 62
P 62 Andrés Barrera
Master Thesis developed at ICAM, Nantes
The wind turbine displacement at the transition piece was calculated in X and Y directions to
assess overall structural motion. The maximum displacement was 0.19 m at about 1.24 seconds
in the Y direction, slightly after maximum penetration of 0.61 m which occurs at 1.17 seconds,
as shown in Figure 59.
Figure 59: Displacement at the Center of the Transition Piece in X (a) and Y (b)
3.6.3.2 Leg Collision 60° 2 m/s, 34.58 m Height
The 60° oblique collision was carried out to assess the response of the structure to a variation
in impact angle. The layout and numbering were shown in Figure 55 (a) and (c) respectively.
Here, 7% (0.74 MJ) of the total impact energy was absorbed as elastic energy. As before, the
kinetic and internal energies are reflections of each other, with the addition of the sliding energy,
which accounts for 5.8% to equal the total energy in the simulation, as shown in Figure 60. The
maximum penetration achieved by the impacting ship was 0.56 m at 1.05 seconds.
Figure 60: Energy Distribution throughout the Simulation
Page 63
Collision Failure Study of Rigid Ship Models with a Deformable Offshore Wind Turbine
Jacket Structure
63
“EMSHIP” Erasmus Mundus Master Course, period of study September 2012 – February 2014
Figure 61 presents the internal energy of the legs and the percentages with respect to the total
energy available for the collision. The legs account for 84% of the total energy.
Figure 61: Internal Energy of Assessed Parts
The maximum value attained for the crushing force for the impacted leg was 1.94 MN, at 1.04
seconds, considerably lower than the 2.8 MN for the perpendicular collision. As before, the
crushing force goes down to zero at the end of the simulation, when there is no more contact
with the ship.
Figure 62: Crushing Force of Impacted Leg
Page 64
P 64 Andrés Barrera
Master Thesis developed at ICAM, Nantes
The 60° oblique collision is characterized by the beginning of leg rupture on the contact point
with the stem, as compared to the perpendicular collision at 2 m/s where no rupture occurs. This
is illustrated in the next figure, where some of the elements at the point of contact have been
eliminated by the solver. This can be attributed to the lack of structure directly behind the
impacted member in the direction of the crash to provide support for the load transfer.
Figure 63: Detail of Plastic Strain Distribution at Impact Point
The displacement at the transition piece is illustrated in Figure 64 in the X direction (a) and Y
direction (b), where a maximum of 0.11 m occurs at 0.98 seconds in the X direction. When
comparing to the perpendicular collision, there is a reduction to about half the resultant
displacement of the transition piece, which can be attributed to the fact that the impacted leg
absorbs a higher amount of the total energy of the collision. A longer simulation time would
have to be established to observe the oscillations dissipate.
Figure 64: Displacement at the Center of the Transition Piece
Page 65
Collision Failure Study of Rigid Ship Models with a Deformable Offshore Wind Turbine
Jacket Structure
65
“EMSHIP” Erasmus Mundus Master Course, period of study September 2012 – February 2014
After comparing the 60° 2 m/s, 34.58 m Height Leg Collision to the 90° 2 m/s, 34.58 m Height
Leg Collision the following conclusions were made:
The 60° collision angle increases both the internal energy of the impacted leg from 7.19
MJ to 7.68 MJ, while the crushing force is reduced from 2.8 MN to 1.97 MN. However,
the variation in angle causes initial rupture of the impacted section at the height of the
stem, as some elements were deleted at the end of the simulation (Figure 63).
Detailed comparison of the plastic strain coefficients of both cases Figure 65 and the
internal energy dissipated by the entire structure, the most detrimental case is the 90°
impact, as considerable plastic strain can be observed for both impact points and since
the internal energy for this case is higher.
Figure 65: Plastic Strain Coefficients for 90° (a) and 60° (b) Impacts
3.6.3.3 Leg Collision 90° 5 m/s, 34.58 m Height
For this case the collision velocity was increased to 5 m/s, maintaining the perpendicular 90°
degree configuration. This increases the total energy to 65.62 MJ as compared to the 10.5 MJ
of the previous two cases. The leg numeration and layout are shown in Figure 55(a) and (d).
With 5 m/s, there is a total rupture of the contact point with the ship’s stem and a maximum
penetration of 2.8 m. 98.5% of the energy imparted on the structure is absorbed as plastic
Page 66
P 66 Andrés Barrera
Master Thesis developed at ICAM, Nantes
straining (only 1.5% as elastic energy) and the sliding energy due to the friction accounted for
4.2% of the total.
The reduction in elastic energy is clearly identifiable in Figure 66, as there is a reduction in the
difference between the maximum and final internal energies.
Figure 66: Energy Distribution throughout the Simulation
The internal energy distribution on all 4 legs is presented in the following figure, including the
percentage dissipated by each leg with respect to the total energy. The legs account for 82% of
the total energy.
Page 67
Collision Failure Study of Rigid Ship Models with a Deformable Offshore Wind Turbine
Jacket Structure
67
“EMSHIP” Erasmus Mundus Master Course, period of study September 2012 – February 2014
Figure 67: Internal Energy of Assessed Parts
The impacted leg had a maximum crushing force of 5.52 MN at 0.65 seconds, as observed in
Figure 68. This value is 49% larger than that of the 2 m/s collision in account of the higher
impact velocity.
Figure 68: Crushing Force of Impacted Leg
Page 68
P 68 Andrés Barrera
Master Thesis developed at ICAM, Nantes
The displacement of the transition piece is illustrated in Figure 69 in the X and Y directions.
The maximum displacement of 0.5 m occurs at 1.23 seconds in the Y direction. This value is
more than twice that of the same simulation with a 2 m/s velocity (0.2 m).
Figure 69: Displacement at the Center of the Transition Piece in X (a) and Y (b) Directions
The plastic strain contours with a 5 m/s velocity are presented versus the 2 m/s collision plastic
strains in Figure 70, where the rupture at the stem contact point is clearly visible (b).
Figure 70: Detail of Plastic Strain, 2 m/s (a) and 5 m/s (b)
Page 69
Collision Failure Study of Rigid Ship Models with a Deformable Offshore Wind Turbine
Jacket Structure
69
“EMSHIP” Erasmus Mundus Master Course, period of study September 2012 – February 2014
After comparison of the 2 m/s and 5 m/s collision scenarios with a 34.58 m impact height the
following conclusions were made:
It is interesting to note that increasing the collision velocity decreases the percentage of
the total energy absorbed by the impacted leg, but increases percentage dissipated by
the non-impacted legs (Figure 57 and Figure 67). A possible cause for this behavior is
that with the leg has the capacity of dissipating this magnitude of kinetic energy and
because of the lower velocity the plastic field develops more effectively.
The variation in velocity does not affect the trend in which the internal energy is
dissipated, as for both scenarios most of it is dissipated by the legs, in the same order.
Plastic strain was observed for both scenarios in the mudline. It is expected that if the
soil-structure interaction is taken into account this behavior will change; thus a
sensitivity study to the soil structure is recommended as further work.
3.6.3.4 Leg Collision 90° 5 m/s, 39 m Height
To assess the simulation’s sensitivity to a change in collision height (the jacket was designed
accounting for a change of 11 m in the waterline) the bow impact point was varied from 34.58
m to 39 m. It is also interesting to note that in this scenario the bow impacts directly a joint
between the leg and 4 cross braces. The numbering and layout are presented in Figure 55(a) and
(d).
Changing the collision height did not vary the amount of plastic strain in the structure with 94%
of the total energy absorbed (with 98% as deformation energy and 2% as elastic energy) as
shown in the next figure. The sliding energy increased to 6% of the total, but is still within the
acceptable figures as the simulation accounts for the friction.
Page 70
P 70 Andrés Barrera
Master Thesis developed at ICAM, Nantes
Figure 71: Energy Distribution throughout the Simulation
Figure 72 shows the internal energy absorbed by the legs and the percentages with respect to
the total. In this simulation the legs absorbed 77% of the total energy, with the braces absorbing
23%, meaning that the braces dissipated more energy with the 39 m collision height when
compared to the 34.58 m case. This variation can be attributed to the bow collision point, as it
is directly colliding with one of the leg joints to the cross braces, pictured in Figure 75.
Figure 72: Internal Energy of Assessed Parts
Page 71
Collision Failure Study of Rigid Ship Models with a Deformable Offshore Wind Turbine
Jacket Structure
71
“EMSHIP” Erasmus Mundus Master Course, period of study September 2012 – February 2014
The impacted leg presented a maximum crushing force of 6.3 MN at 0.8 seconds, an increase
from the 5.52 MN with the lower contact point. As before, the crushing force becomes zero
towards the end of the simulation.
Figure 73: Crushing Force of Impacted Leg
The displacement of the OWT is illustrated by the displacement of the central node at the
transition piece, which is presented in the following figure in the X (a) and Y (b) directions. A
maximum displacement of 0.92 m occurs at 1.38 seconds in the Y direction, more than twice
than the 0.5 m achieved with the original height. This can be attributed to the closer distance to
the transition piece itself.
Figure 74: Displacement at the Center of the Transition Piece in X (a) and Y (b) directions
Page 72
P 72 Andrés Barrera
Master Thesis developed at ICAM, Nantes
The next figure illustrates the plastic strain contours for the 34.58 m scenario (a) and the current,
39 m impact height. The most notable differences between both are the increase in the plastic
strain of leg leg 514 at the level of the mudline and the higher amount of plastic straining present
at the bow impact point for (a). These are attributed to the actual impact location of the ship’s
bow, which collides directly at a node between the leg and the cross braces, reducing the
deformation on the leg by transmitting more energy to the other members, as evidenced on
Figure 67 and Figure 72.
Further analysis on the effects of the waterline variation (including lower collision heights)
should be assessed, however this extends out of the scope of this thesis.
Figure 75: Plastic Strain Distribution, 5 m/s 34.58 m (a) and 39 m (b)
The conclusions for this section are as follows:
A direct trend reflecting the failure behavior of the jacket could not be identified directly
by varying the collision height, as it was detected that this variation also defined
different contact points on the leg (such as a leg section and a leg node with the cross
braces) with different load transmission characteristics, thus further simulations are
Page 73
Collision Failure Study of Rigid Ship Models with a Deformable Offshore Wind Turbine
Jacket Structure
73
“EMSHIP” Erasmus Mundus Master Course, period of study September 2012 – February 2014
suggested to determine the influence of the collision height on the energy dissipation
process of the jacket.
A change in the geometry of the impacting ship would influence the energy transmission
process in the same way as was identified for a change in collision height. An interesting
scenario that could be analyzed would include bow and stem impact on two different
leg nodes with cross braces to assess how much energy is dissipated by the braces, and
what is the ratio between local tube crushing and global leg deformation that arises when
impacting two nodes. This however extends out of the scope of this thesis.
Page 74
P 74 Andrés Barrera
Master Thesis developed at ICAM, Nantes
3.6.4 OSV Simulations: Sensitivity to wind turbine and gravity loads
The second phase of the OSV simulations was designed to assess the sensitivity of the failure
behavior of the jacket to the added loads of the wind turbine when considering gravity in the
simulation. To do this, two part simulations were carried out. Initially, an implicit “pre-load”
phase was run using LS DYNA’s *CONTROL_DYNAMIC_RELAXATION card to apply the
gravity loads on the structure.
3.6.4.1 Quasi Static Behavior due to Gravity
The equivalent distribution of stresses at the end of the pre-load phase and at the beginning of
the collision was verified for all simulations. Additionally, the values of the loading exerted by
the wind turbine and the transition piece with the gravity were calculated analytically for one
leg and compared to the cross sectional force at the top of the impacted leg, as shown in Figure
77.
Figure 76: Flowchart of Procedure for Simulation with Gravity Effects
Figure 77: Selected Cross Section for Force Distribution Analysis
The analytical value was obtained from the definition of a stress (σ):
𝜎 =𝐹
𝑎
(12)
Page 75
Collision Failure Study of Rigid Ship Models with a Deformable Offshore Wind Turbine
Jacket Structure
75
“EMSHIP” Erasmus Mundus Master Course, period of study September 2012 – February 2014
Where F represents the ¼ of the weight of the transition piece and all the components of the
OWT including the tower (it was assumed that the weight is evenly distributed on all 4 legs),
and a is the cross sectional area of the section of interest (0.166 m2)
A 1.568 MN compression load was obtained analytically for one of the legs, while the numerical
calculation produced a cross sectional resultant force of 1.627 MN, for a 3.6% difference. To
better visualize the results, the stress was calculated analytically (9.44 MPa) and compared to
the fringe levels of equivalent stress on the upper section (s) of the impacted leg, which can be
observed in the next figure along with the analytical calculation results. Here, the average value
of equivalent stress is approximately 8.9 MPa, which is very similar to the 9.44 MPa calculated
analytically.
Figure 78: Results of Force Analysis
3.6.4.2 Impact Response
The second part in the two-step simulation consisted in an explicit collision scenario as
described in section 2.4. The collision velocities included 2 m/s and 6 m/s, a 90° collision angle
and a 34.58 m collision height. The sensitivity to gravity loading was only assessed for leg
impacts, since analysis of the results of section 3.5.1 revealed that for the simulation running
Page 76
P 76 Andrés Barrera
Master Thesis developed at ICAM, Nantes
time (2 seconds) a leg impact produced the most damage, as it immediately affects the entire
structure.
The effects of gravity loading were evaluated on all 4 legs, labeled according to the numbering
given in the jacket mesh. The location of these members with respect to the impacting ship is
presented in the next figure. Leg 529 (red) was the impacted leg for all cases, while the
remaining legs include 513 (yellow), 514 (green) and 528 (blue). The braces evaluated are
numbers 556 and568 which are both aquamarine.
Figure 79: Simulation Layout and Numbering of Analyzed Members
3.6.4.3 Sensitivity to Gravity for a 2 m/s Initial Impact Velocity
Figure 80 shows the energy transfer for the simulation without gravity effects. It must be noted
that this is the same simulation presented in Section 3.5.2.1. However some of the results are
presented again to provide a clear comparison between the two simulations.
As mentioned earlier, the elastic energy of the structure was 16%.
The energy transfer with the effects of gravity is shown in Figure 81. The maximum and final
values for the elastic energy absorbed by the structure are the same, for an elastic energy of
16%. However, it can be determined that the gravity effects damp the oscillation that occurs
during the release of elastic energy, as the secondary crest visible in Figure 80 is not present in
Figure 81. The sliding energy in both cases is 4.7% of the total.
Page 77
Collision Failure Study of Rigid Ship Models with a Deformable Offshore Wind Turbine
Jacket Structure
77
“EMSHIP” Erasmus Mundus Master Course, period of study September 2012 – February 2014
Figure 80: Energy Distribution throughout the Simulation without Gravity Effects
Figure 81: Energy Distribution throughout the Simulation with Gravity Effects
The variation in penetration depth, in m versus the simulation time is presented for both
scenarios, with the effects of gravity (WT Pt Inertia in the legend, blue curve) and without the
effects of gravity (No Gravity in the legend, red curve) in the next figure. The maximum
penetration without the effects of gravity was 0.6 m, while the case with gravity effects
presented a maximum penetration of 0.623 m at approximately 1 second. At the end of the
simulation both present a decrease in penetration which can be attributed to the elastic energy
absorption of the structure, with a 1.8% difference.
Page 78
P 78 Andrés Barrera
Master Thesis developed at ICAM, Nantes
Figure 82: Comparison of Penetration Values
The crushing distribution force for both cases was approximately the same throughout the
running time, except for the different peaks that can be identified in Figure 83. The maximum
difference between both curves was of 15% (4.141 MN) with a penetration depth of 0.6 m.
Figure 83: Crushing Force of Impacted Leg (529)
The values for the internal energy of the impacted leg were also very similar for both cases, as
presented in the next figure. The highest difference between both curves, 12% (0.732 MJ)
occurred at a penetration depth of approximately 0.46 m.
Page 79
Collision Failure Study of Rigid Ship Models with a Deformable Offshore Wind Turbine
Jacket Structure
79
“EMSHIP” Erasmus Mundus Master Course, period of study September 2012 – February 2014
Figure 84: Internal Energy of Impacted Leg (529)
It was thought initially that the 12% difference in internal energy was due to a different plastic
strain distribution throughout the impacted leg, so the contours of plastic strain were plotted for
both cases (OWT Pt Inertia accounting for the effects of gravity, while No OWT omits the
effects of gravity). It can clearly be seen in Figure 85 that the distribution is almost exactly the
same, with some minor variations in the bottom section of the leg, which are barely perceptible.
Figure 85: Plastic Strain Comparison on Impacted Leg
Leg 513 presents a higher discrepancy between the values of internal energy, with a maximum
difference of 40% with a penetration depth of 0.491 m. It must be noted however that leg 513
Page 80
P 80 Andrés Barrera
Master Thesis developed at ICAM, Nantes
only absorbs 10% of the total energy (the maximum value is roughly the same for both cases
with and without gravity).
Figure 86: Internal Energy of Leg 513
The plastic strain of leg 513 was plotted for both cases to see the variation in internal energy.
However, as was expected, since the final value at the end of the simulation is almost the same
(after elastic energy was dissipated) the contours in both cases are almost the same.
Figure 87: Plastic Strain on Leg 513
The internal energy curves for leg 514 are shown in Figure 88, where the discrepancy with
maximum penetration was determined as 33% (0.14 MJ). This leg absorbed 4.5% of the total
energy for the case without gravity effects, and 3.1% with gravity, a considerably low value
when compared for example, to the impacted leg.
Page 81
Collision Failure Study of Rigid Ship Models with a Deformable Offshore Wind Turbine
Jacket Structure
81
“EMSHIP” Erasmus Mundus Master Course, period of study September 2012 – February 2014
Figure 88: Internal Energy of Leg 514
The contours of plastic strain are almost exactly the same for both cases, as can be evidenced
in the following figure, where plastic strain only occurs at the height of the mudline.
Figure 89: Plastic Strain Comparison on Leg 514
Leg 528 presents a variation in internal energy of 61% (0.316 MJ), the highest of the four legs.
Its contribution to the total internal energy absorption is very low, 5% for the case without
gravity effects and 2% with gravity effects and therefore does not play a critical role in the
energy transfer mechanism of the collision.
Page 82
P 82 Andrés Barrera
Master Thesis developed at ICAM, Nantes
Figure 90: Internal Energy of Leg 528
The contours of plastic strain for leg 528 are the same and no visual variation can be determined.
Finally, two braces were selected to compare their internal energies throughout the simulation,
part numbers 556 and 568. Their location in the structure was presented in Figure 79. For the
case of brace 556, the highest difference between both cases with and without gravity effects is
11.4%. However the contribution of this part to the energy transfer of the structure is less than
1%. This variation therefore can be neglected.
Figure 91: Internal Energy of Brace 556
Brace 558 presents a discrepancy of 60% with respect to the internal energy with and without
the effects of gravity. However, as its contribution to the total internal energy of the structure is
even lower than that of brace 556, (0.08%) the variation can also be neglected.
Page 83
Collision Failure Study of Rigid Ship Models with a Deformable Offshore Wind Turbine
Jacket Structure
83
“EMSHIP” Erasmus Mundus Master Course, period of study September 2012 – February 2014
Figure 92: Internal Energy of Brace 558
The effects of accounting for the gravity effects were also evaluated on the displacement of the
OWT, comparing the resultant translation of the transition piece. For the case considering the
gravity effects, the plot versus simulation time is illustrated in Figure 93, where a maximum
displacement of 0.15 m was identified.
Figure 93: Displacement at the Center of the Transition Piece with Gravity Effects
Figure 94 presents the results without considering gravity effects, where the the maximum
displacement of 0.2 m occurs at 1.2 seconds. The difference in maximum displacement between
both cases is thus 25% (0.05 m)
Page 84
P 84 Andrés Barrera
Master Thesis developed at ICAM, Nantes
Figure 94: Displacement at the Center of the Transition Piece without Gravity Effects
Finally, the front, side and top views of the contours of plastic strain is presented in the
following two figures, where it can be established that both cases maintain approximately the
same plastic strain at the final time step.
Figure 95: Front, Side and Top View of Plastic Strain Distribution without Gravity Effects
Figure 96: Front, Side and Top View of Plastic Strain Distribution with Gravity Effects
Page 85
Collision Failure Study of Rigid Ship Models with a Deformable Offshore Wind Turbine
Jacket Structure
85
“EMSHIP” Erasmus Mundus Master Course, period of study September 2012 – February 2014
To summarize, the results for internal energy of the selected parts, the crushing force of the
impacted leg and the displacement of the transition piece are presented in the following table.
From the analysis of all components it can be concluded that for the present scenario (a 2 m/s
collision with the defined impacting ship) the effects of gravity are not considerable enough on
the jacket structure to suggest that they be accounted for in the initial development of the
simplified calculation tool.
Table 3: Results of 2 m/s Comparison with and without Effects of Gravity
3.6.4.4 Sensitivity to gravity for a 6 m/s Initial Impact Velocity
The effects of gravity with the OSV configuration were also assessed for a 6 m/s collision. The
ship penetration into the jacket structure is illustrated in the next figure, where it can be
determined that both curves are very similar The resulting penetration is the same up to 1.3
seconds of run time, after which the model with the gravity loads experiences higher
penetration, with a difference of 4.2% (0.166 m).
Figure 97: Comparison of Penetration Values
Page 86
P 86 Andrés Barrera
Master Thesis developed at ICAM, Nantes
To verify the validity of the simulations, the energy exchange throughout the runtime was
plotted for both cases. Figure 98 and Figure 99 illustrate the similarity of both cases, including
the starting total energy (94.5 MJ). The final total energy is not the same for Figure 99 however
because of the external work of the added weight of the wind turbine. Compared to Figure 80
and Figure 81 these present almost no elastic energy absorption, due to the rupture of the
impacted leg.
Figure 98: Energy Distribution throughout the Simulation without Gravity Effects
Figure 99: Energy Distribution throughout the Simulation with Gravity Effects
Since the focus of this work is to validate the super-element method for ship collisions with
jacket structures, the simulations and required results analysis were performed as the needs
arose. The variation in crushing force with and without gravity loads was also assessed for the
impacted leg. The highest value (34.3 MN) was achieved in the case with the gravity loads and
the maximum difference between both simulations in the entire runtime was 3% (1.12 MN),
which as the penetration is very low.
Page 87
Collision Failure Study of Rigid Ship Models with a Deformable Offshore Wind Turbine
Jacket Structure
87
“EMSHIP” Erasmus Mundus Master Course, period of study September 2012 – February 2014
Figure 100: Crushing Force of Impacted Leg (529)
The same procedure was performed for the internal energy of the impacted leg. The results
showed that as for the crushing force, the case with the gravity effects produced more internal
energy on leg 529. The maximum difference throughout the runtime between both cases was
7% (3.07 MJ).
Figure 101: Internal Energy of Impacted Leg (529)
The plastic strain coefficients of leg 529 are presented in the following figure at the final time
step. It is observed that plastic straining is almost the same for both cases, with minor variations
in the top section where the leg connects to the transition piece. Here, the simulation with
gravity seems to have higher plastic strain.
Page 88
P 88 Andrés Barrera
Master Thesis developed at ICAM, Nantes
Figure 102: Comparison of Plastic Strain of Impacted Leg (529)
The same procedure was followed for leg 513. The internal energy of both scenarios reveals a
maximum discrepancy of 36% at a penetration depth of 2.32 m. However the difference with
maximum penetration reveals a difference of 1% (0.2 MJ). The difference with highest
penetration is more important, as it reveals the final state of the structure.
Figure 103: Internal Energy of Leg 513
A comparison of plastic strain contours reveals that the final deformed state of leg 513 for both
cases is indeed very similar, with minor variations at the top where the leg connects to the
transition piece, similar behavior to that of leg 529.
Page 89
Collision Failure Study of Rigid Ship Models with a Deformable Offshore Wind Turbine
Jacket Structure
89
“EMSHIP” Erasmus Mundus Master Course, period of study September 2012 – February 2014
Figure 104: Plastic Strain Comparison of Leg 513
Leg 514 presented a maximum difference of internal energies of 60% (1.67 MJ) at 2.5 seconds,
while the difference with maximum penetration was of 37% (1.474 MJ).
Figure 105: Internal Energy of Leg 514
The plastic strain contours at the final time step were plotted for leg 514 and are shown in the
following figure. The contours of plastic strain, as all of the previous cases are the same.
Page 90
P 90 Andrés Barrera
Master Thesis developed at ICAM, Nantes
Figure 106: Plastic Strain and Von Mises Distribution Comparison of Leg 514
Leg 528 had a maximum difference of 57% with respect to the internal energy at 2.3 m of
penetration. The difference with maximum penetration was lower, 23% (1.04 MJ). As
previously established, this final value is the one of concern to be able to determine the
sensitivity of the simulation to the effects of gravity
Figure 107: Internal Energy of Leg 528
A comparison of plastic strain contours for leg 528 reveals minor differences at the mudline
level, with a higher plastic strain in the simulation without the effects of gravity (No OWT Pt
Inertia). This is the only when compared to the other legs, where the plastic strain is slightly
higher for the simulation with the effects of gravity.
Page 91
Collision Failure Study of Rigid Ship Models with a Deformable Offshore Wind Turbine
Jacket Structure
91
“EMSHIP” Erasmus Mundus Master Course, period of study September 2012 – February 2014
Figure 108: Plastic Strain Comparison of Leg 528
The effects of gravity loads were also assessed for braces 556 and 568, as for the 2 m/s
simulations. The next figure illustrates their location on the jacket with respect to the colliding
hull.
Figure 109: Location of Brace 556 (left) and 568 (right)
The internal energy curves for brace 556 reveal that its behavior is almost equivalent, with the
maximum magnitude of internal energy being the same for both curves. There seems to be a
slight delay in the simulation without the effects of gravity, where the peak (3.4 MJ) occurs
with a higher penetration (0.002 m higher) than that of the curve with gravity.
Page 92
P 92 Andrés Barrera
Master Thesis developed at ICAM, Nantes
Figure 110: Internal Energy of Brace 556
Brace 568 presented a difference in internal energy of 18% (0.02 MJ) with highest penetration.
Even though for the brace this difference is considerable, its total contribution to the energy
absorption process of the structure is minimal, and therefore not critical to assess the sensitivity
of the structure to the loading effects of gravity.
Figure 111: Internal Energy of Brace 568
The displacement of the transition piece throughout the simulation run time is plotted in the
next figure for the case with the gravity effects. The maximum displacement was 1.2 m at 1.55
seconds. An almost linear increase in the displacement can be observed for both curves, with
and without gravity effects, which is due to the relatively high kinetic energy of the collision.
Page 93
Collision Failure Study of Rigid Ship Models with a Deformable Offshore Wind Turbine
Jacket Structure
93
“EMSHIP” Erasmus Mundus Master Course, period of study September 2012 – February 2014
Figure 112: Displacement at the Center of the Transition Piece with Gravity Effects
The maximum displacement for the simulation without gravity effects was of 1.1 m, at 1.5
seconds, which coincides with the maximum penetration of the ship into the jacket structure.
The reduction in displacement of the transition piece after the peak for both curves is due to the
exhaustion of all the kinetic energy of the impacting ship.
Figure 113: Displacement at the Center of the Transition Piece without Gravity Effects
The change change in length between two nodes on the impacted section of the leg by the ship’s
stem was also measured for the 6 m/s collision to assess the dependency on the gravity loading.
Figure 114 displays the selected nodes for analysis.
Figure 114: Selected Nodes for Variation of Section Length
Page 94
P 94 Andrés Barrera
Master Thesis developed at ICAM, Nantes
The variation in distance d was plotted versus simulation runtime for the case with gravity
effects and is presented in the following figure. The rupture of the leg occurred at 0.62 seconds,
where it can be seen in the graph that the distance between the nodes increases. This is attributed
to the geometry of the stem, and its further interaction with the jacket geometry. For this reason
the behavior will be omitted after this time step. The maximum length reduction in the leg (at
0.62 seconds) is 1% (0.088 m).
Figure 115: Variation in Length of Section with Gravity Effects
The same procedure was followed for the case without gravity loads, where the reduction length
up to rupture represented 2% (0.16 m) of the original length of the section. Comparing both
scenarios, a 1% and 2% change in length is almost negligible for a 6 m/s collision on a leg with
two impact points.
Figure 116: Variation in Length of Section without Gravity Effects
Page 95
Collision Failure Study of Rigid Ship Models with a Deformable Offshore Wind Turbine
Jacket Structure
95
“EMSHIP” Erasmus Mundus Master Course, period of study September 2012 – February 2014
The contours of plastic strain in front, side and top views for the cases without and with the
gravity loads are presented in Figure 117 and Figure 118. Overall, it can be observed that the
final state of the jacket structure for both simulations is the same, except for the minor variations
identified in the detail analysis of the legs.
Figure 117: Front, Side and Top View of Plastic Strain Distribution without Gravity Effects
Figure 118: Front, Side and Top View of Plastic Strain Distribution with Gravity Effects
Page 96
P 96 Andrés Barrera
Master Thesis developed at ICAM, Nantes
Table 4: Results of 6 m/s Comparison with and without Effects of Gravity
Table 4 presents the values of internal energy for all the analyzed parts, the crushing force for
the impacted leg and the displacement of the central node for both simulations carried out with
a 6 m/s collision velocity. Overall it can be observed that the behavior of the structure is very
similar with and without the effects of gravity loads, so for the current jacket structure and
simulation configuration it can be concluded that the loads exerted by gravity do not have to be
accounted for in the preliminary design of the simplified calculation tool.
Page 97
Collision Failure Study of Rigid Ship Models with a Deformable Offshore Wind Turbine
Jacket Structure
97
“EMSHIP” Erasmus Mundus Master Course, period of study September 2012 – February 2014
3.6.5 OSV SIMULATIONS: Effects of OWT Tower
Knowing that gravity does not affect the results of the failure behavior of the defined jacket for
the with the OSV impacting ship and the boundary conditions defined, the effects of adding the
wind tower geometry, the forces and moments exerted by the wind turbine on the jacket were
studied without setting up the implicit preload simulation to account for the gravity loads. The
tower was modeled according to the specifications given by STX SOLUTIONS in the LS PRE
POST software for LS DYNA to guarantee node connectivity. The following figure illustrates
the jacket with the tower. As for the jacket, 4 node Belytschko-Tsay elements were used with
three integration points. The same material used for the jacket was implemented in the tower,
presented in Figure 11.
Figure 119: Simulation Layout
The simulation was run with a 6 m/s velocity and a 6 second end time to better observe the
results of the added tower and the forces and moments exerted by the wind turbine. The results
were compared to the simulation presented in section 3.5.3.2 for a 6 m/s collision without
gravity effects of the jacket structure. The maximum penetration was 3.98 m at 1.6 seconds.
Figure 120 presents the energy exchange for the simulation. As in section 3.5.3.2 the total
energy is not constant, however in this case it is because of the external work of the wind turbine
mass.
Page 98
P 98 Andrés Barrera
Master Thesis developed at ICAM, Nantes
Figure 120: Energy Distribution throughout the Simulation
The maximum crushing force for the present simulation was 30.9 MN versus the 33.3 MN
crushing force without the tower, for a difference of 7%. In the case of the simulation without
the effects of gravity, the curve reaches a lower value of 24.3 MN and increases again at about
0.6 seconds up to a secondary peak of 32.1 MN, when the leg ruptures. Figure 121 displays a
different behavior. After the leg begins to rupture at about 0.6 seconds, it reaches its maximum
value and decreases continuously until the final time step. It must be noted that for the present
simulation, with the tower, the impacted leg does not fully rupture, but rather some of the
elements in the point of impact remain intact.
Figure 121: Crushing Force of Impacted Leg
Page 99
Collision Failure Study of Rigid Ship Models with a Deformable Offshore Wind Turbine
Jacket Structure
99
“EMSHIP” Erasmus Mundus Master Course, period of study September 2012 – February 2014
Comparison of the curves for internal energy of the legs also reveals an interesting behavior.
The maximum energy on the impacted leg for the case without the tower is 53.2 MJ as can be
seen in Figure 123, illustrated here for a better comparison), while for the present case it reached
41.9 MJ. It also seems as if for the present case the legs 513, 514, and 528 are loaded before the
legs for the reference case. At the point of rupture for the reference (0.6 seconds), leg 514 has
an internal energy of 4.6 MJ, while for the present case the internal energy for 513 at 0.6 seconds
is 10.3 MJ. The maximum internal energy of legs 514 and 528 is 3.68 MJ and 5.06 MJ
respectively for the reference, while for the present case these are 9.93 MJ and 7.10 MJ. The
large difference is attributed to the fact that the leg does not rupture in the present simulation.
Further analysis revealed that this was due to the interaction of the tower and the transition
piece, as the lack of rigid elements in the transition piece permitted its deformation and energy
dissipation.
Figure 122: Internal Energy of Legs
Figure 123: Internal Energy of Legs without Tower or Gravity Loads
Page 100
P 100 Andrés Barrera
Master Thesis developed at ICAM, Nantes
The tower dissipates 4.22 MJ at the final time step, and the value seems to continue to increment
if the end time is increased, because of the additional mass and forces of the wind turbine
components. The transition piece dissipates 2.3 MJ as deformation, which is shown in Figure
128 that compares its state before and after the collision (the initial diameter is 6 m and the final
lengths are 6.9 m in the most elongated direction and 4.69 in the shortest direction). The 27%
difference in the internal energy dissipated by the leg is therefore attributed to the deformation
of the tower and the transition piece due to the lack of the rigid beams used to idealize the
connection between the transition piece and the tower. The next figure illustrates the internal
energies of the tower and the transition piece. The ordinate is time since if transformed to
penetration the maximum value would be omitted.
Figure 124: Internal Energy of Tower and Transition Piece Parts
Figure 125: Transition Piece
Page 101
Collision Failure Study of Rigid Ship Models with a Deformable Offshore Wind Turbine
Jacket Structure
101
“EMSHIP” Erasmus Mundus Master Course, period of study September 2012 – February 2014
The maximum resultant displacement at the center of the tower top was 5.4 m at 2.74 seconds,
while the reference simulation had a resultant displacement of 1.1 m at 1.5 seconds at the
transition piece height. This reflects the fact that simplifying the tower in a simulation conceals
potentially catastrophic behavior, as such a high displacement is not acceptable for the OWT.
On the other hand the behavior of the jacket during the collision cannot be simplified by
including rigid elements on the transition piece. Further simulations that account for the
interaction of the jacket and the tower, considering the connections between both are required
to better characterize the collision behavior. However as the CAD model for the jacket was not
available and the final dimensions and configuration of the platform and the connections
between the tower, the platform and the jacket were not defined these extend out of the scope
of this thesis.
Figure 126: Displacement at the Center of the Tower Top
The following figure presenting the front, side and top views of the contours of plastic strain at
the final time step illustrates the highly deformed tower at the root. Tilting of the tower is also
observed in the front and side views, due to the high plastic strain at the section of the transition
piece.
Page 102
P 102 Andrés Barrera
Master Thesis developed at ICAM, Nantes
Figure 127: Front and Top View of Plastic Strain Distribution
Figure 128: Transition Piece Deformation
To summarize, the following conclusions were identified for this section:
The definition of the couplings between the jacket, the transition piece, the platform and
the tower must be defined according to the real geometries and cannot be simplified if
an accurate model of the behavior of the entire system is required, as discrepancies of
up to 26% were identified in the impacted leg when considering the effects of the OWT
tower. This discrepancy could be reduced with accurate couplings, as the platform itself
should add rigidity to the transition piece.
Page 103
Collision Failure Study of Rigid Ship Models with a Deformable Offshore Wind Turbine
Jacket Structure
103
“EMSHIP” Erasmus Mundus Master Course, period of study September 2012 – February 2014
3.6.6 OSV Simulations: Force Transmission with Single Impact Location
To better understand the force transmission and failure procedure of the jacket, it was required
to determine the cross section forces on the braces with a single contact point and to establish
the internal energy of the non-impacted braces around a collided sector. The bulbous bow of
the OSV was defined as the impacting section, and a new part consisting of the elements
between two cross brace joints was created to calculate its crushing force. The following figure
illustrates the selected nodes for analysis, which are all connected to the impacted section of the
leg. In total, 9 analysis points were selected.
The collision velocity was defined as 6 m/s to produce considerable deformations with a
maximum penetration of 4.815 m at 1.97 seconds.
Figure 129: Selected Points for Force Transmission Analysis
A single collision point was defined to have higher magnitudes at the analysis points and to
better determine the transmission of forces.
It was expected however that the energy curves would be different from those of section 3.5.3.2,
as there is a single contact point with a different geometry than that of the primary contact point
for the simulation of section 3.5.3.2 (stem). However, penetration within the range of 4.82 m
was expected.
Since the same OSV model was used for the present simulation, the total energy did not change
(94.5 MJ). The internal energy however presented a 3% increase with the single impact point,
Page 104
P 104 Andrés Barrera
Master Thesis developed at ICAM, Nantes
from 87.7 MJ for the simulation of section 3.5.3.2 (Figure 98) to 90.4 MJ (the energy transfer
curves presented in the following picture).
Detailed analysis reveals that the internal energy of the reference simulation (Figure 98)
presents an elastic component of 1%, while the current case has no elastic energy, which can be
attributed to the blunt geometry of the bulbous bow, which slowly deforms the impacted leg
section, preventing rupture.
Figure 130: Energy Distribution throughout the Simulation
Figure 131 shows the leg numbering and the impacted leg section defined for analysis:
Figure 131: Leg Numbering and Defined Leg Section
The internal energies of the 4 legs (parts 513, 514, 528 and 529) and the impacted section of
leg 529 (part 593) are shown in the following figure. In the reference simulation, with 2 contact
Page 105
Collision Failure Study of Rigid Ship Models with a Deformable Offshore Wind Turbine
Jacket Structure
105
“EMSHIP” Erasmus Mundus Master Course, period of study September 2012 – February 2014
points (stem and bow) the impacted leg (part 529) absorbs 54.2 MJ, or 57% of the total energy.
In the current case, with a single contact point (the bulbous bow) the leg dissipated 50.2 MJ, or
53% of the total, with the impacted leg section (part 593 in Figure 132) dissipating 32.8 MJ
(35%).
It is also interesting to note that the single contact point also changes the internal energy
distribution in the remaining legs. For the reference case, with two contact points, leg 513
dissipates 15% (14 MJ), leg 528 dissipates 5% (5.08 MJ) and leg 514 absorbs 3.9% (3.69 MJ).
In the current simulation however, leg 513 dissipates 20% (18.9 MJ) of the total energy, 528
absorbs 3.7% (3.54 MJ) and leg 514 dissipates 1.8% (1.71 MJ) of the total energy.
In both scenarios, the legs dissipated most of the energy of the collision. In the reference case
the legs absorbed 81% of the total energy and in the current scenario these dissipated 78.5% of
the total energy.
Figure 132: Internal Energy of Impacted Section and Legs
The following figure presents the internal energy of the braces joined to the impacted section
of leg 529 (part 593). Brace 566 dissipates 2.7% (2.6 MJ) of the total energy, the highest of the
non-impacted braces directly in contact with part 593, which is the closest to the point of impact
from the bow. Brace 536 absorbs 1.8% of the total energy (1.75 MJ). Interestingly this brace is
located on the face perpendicular to the collision. However, analysis of Figure 136 shows the
high amount of plastic strain on this member as compared to the other parts in contact with the
leg section (part 593). Brace 558 dissipates 1.2% of the total energy (1.2 MJ), followed by brace
532 which absorbs 0.84% (0.8 MJ), brace 562 (0.36%), brace 530 (0.26%) and 564 and 565
which dissipate less than 0.1%.
Page 106
P 106 Andrés Barrera
Master Thesis developed at ICAM, Nantes
Figure 133: Internal Energy of Non-Impacted Braces
The crushing force for the impacted leg section is presented in the next figure. The peak, of 27.8
MN occurs at 0.85 seconds. For the reference simulation the crushing force is measured for the
entire impacted leg with two collision points, at the stem and bow. In this case, the peak of 33.3
MJ occurs at 0.51 seconds, point at which most of the elements of the contact point with the
stem have been deleted (total rupture occurs at exactly 0.57 seconds). Even though the crushing
force for two points is approximately the same as that for the single impact point in the present
simulation (16% difference), the leg does not rupture at the end time because of the curvature
of the bow that deforms the leg section up to a penetration of 4.82 m (28% more than that of
the reference simulation).
Figure 134: Crushing Force of Impacted Leg Section
Page 107
Collision Failure Study of Rigid Ship Models with a Deformable Offshore Wind Turbine
Jacket Structure
107
“EMSHIP” Erasmus Mundus Master Course, period of study September 2012 – February 2014
Figure 135 shows the cross section forces at the defined locations in Figure 122. It must be
noted that the defined cross sections of a same brace (E-H, A-I, G-B) the cross sectional force
is almost the same. This means that, at least for the braces analyzed, the force is transmitted
linearly through the brace joints. For the brace made up of parts 556 and 562 (cross sections E
and H respectively) the maximum difference in both curves is 2.5%, for brace 558 (cross
sections B and G) the maximum difference in both curves is 14% and for the brace composed
of parts 565 and 564 (cross sections A and I respectively) the difference between both curves is
14%. Cross sections C, D and F are all located on a side perpendicular to the direction of the
collision and as it was hypothesized that the loading in this area would be considerably lower
than on the impacted side of the brace their end nodes were not defined.
Figure 135 shows however that in cross section D there is a maximum resultant force of 8.94
MN, in C there is a maximum resultant force of 7.85 MN and in F there is a maximum cross
sectional force of 5.45 MN.
Figure 135: Resultant Force of Analyzed Parts
The following figure shows the contours of plastic strain (a) and an approximate distribution of
the transmitted resultant force from the points of impact. It is interesting to note that brace 566
which withstood the highest plastic strain also transmitted the highest resultant force. The
analysis was only carried out for 1 side of the jacket as cross sections were not fully defined for
the side in the X-Z plane (Figure 131).
Page 108
P 108 Andrés Barrera
Master Thesis developed at ICAM, Nantes
Because of the complexities associated to the definition of the cross sections, only one
simulation was carried out. However to better define the force transmission process all the cross
sections of the nodes that compose the jacket should be defined.
Figure 136: Plastic Strain Distribution (a) Approximate Force Transmission (b)
Comparison of the results shown in Figure 133, Figure 135 and Figure 136 reveals how braces
562, 630, 564 and 565 dissipate a low percentage of energy, however the nodes on the other leg
to which these are connected presents plastic strain, meaning that they effectively prevent any
damaging bending and transfer the energy in the form of membrane force which deforms legs
513 and 528. This is not the case for braces 566 and 536 which experience considerable plastic
strain. It can be observed that therefore even though the legs have a higher diameter and
thickness than the braces, these are more susceptible to local deformation (due to membrane
force) than the braces are to bending.
Further work includes the definition of the cross sections for all the nodes of the jacket to fully
understand the force transmission process and have detailed data for the development of the
simplified calculation tool.
Page 109
Collision Failure Study of Rigid Ship Models with a Deformable Offshore Wind Turbine
Jacket Structure
109
“EMSHIP” Erasmus Mundus Master Course, period of study September 2012 – February 2014
3.6.7 OSV Simulations: Superelement Code Comparison for Full Jacket Collision
The simplified calculation tool that will be delivered to the CHARGEOL project partners will
be derived from the super-element discretization scheme to model the internal mechanics of
struck and striking vessels, based on the extensions of this scheme to the analysis of inclined
ship sides, oblique collisions and lock gate impacts (Buldgen et al., 2013a, 2013b, 2012).
A new super-element has already been developed to simulate the collision between the stem of
the striking vessel and a leg or brace of the jacket of an offshore wind turbine, which has been
assumed as being cylindrical (Buldgen, Loïc. “Description of Excel Spreadsheet to Calculate
the Resistance in Local Mode”, 29/10/2013 and Le Sourne, Herve, “Impact on Cylinders,
Analytical Approach”, presented to the CHARGEOL project partners on 13/12/2013).
The basic theory behind the super-element formulation was illustrated in section 2.5. The initial
approximation to compare the validity of the cylindrical member calculation software to a full
jacket collision required the formulation of a collision scenario with the full scale jacket and the
OSV model.
It must be noted however, that the first version of the deliverable only calculates the local mode
(local tube crushing) and that validation with numerical calculations of the local mode produced
significant differences for both the X and Y component of the crushing force. This is due to the
fact that analytically, the X and Y components of the crushing force are evaluated from the
energy (through the virtual work), and the angle of the resultant force being applied by the stem
is assumed, due to the difficulty calculating its orientation. (Buldgen, Loïc. “Description of
Excel Spreadsheet to Calculate the Resistance in Local Mode”, 29/10/2013).
The main objective of this section is therefore to attempt and characterize the differences
between the simplified calculation tool for the local mode, and the results of a full collision
simulation with the entire jacket.
A 2 m/s collision simulation with contact only on the stem of the OSV was set up. A section of
the leg 7.655 m long was isolated to create a new part and obtain the crushing force and internal
energy only for this section to compare against the output of the tool for cylinders.
The following figure illustrates the required input for the simplified calculation tool. The
cylinder with radius R, length L and thickness tp has an inclination ζ about the Y-Z plane. The
material for the cylinder is considered as perfectly plastic with a yielding stress σo.
The cylinder is impacted by a hull (stem) whose cross section is described by an Ellpise centered
in S with semi-major and semi-minor axes of legnth q and p respectively. The bow and chine
angles are Φb and Ψb and the total height of the hull is hb. The hull is located so that its plane of
Page 110
P 110 Andrés Barrera
Master Thesis developed at ICAM, Nantes
symmetry is at an angle α from the X axis, parallel to the Y-Z plane, offset a distance of Yp.
The tip of the stem is located at a height Zs. At the point of impact, the stem is tangent to the
cylinder (Buldgen, Loïc. “Description of Excel Spreadsheet to Calculate the Resistance in Local
Mode”, 29/10/2013)
ζ
ψbϕb
α
hb
q p
X
Y
Z
S
ZS
YP
π
Figure 137: Input Parameters for the Cylinder Assessment Calculation Tool. Source: (Buldgen, Loïc.
“Description of Excel Spreadsheet to Calculate the Resistance in Local Mode”, 29/10/2013)
The input used in the simplified tool was obtained from the setup of the collision scenario in
LS-DYNA and is presented in the next table.
Table 5: Required Input for Calculation Tool
The output produced by the calculation tool includes the internal energy of the cylindrical part,
the resulting force (membrane force) and its components in X and Y. The following figure
shows the contours of plastic strain for the entire jacket structure for a front, side and top view.
The front view shows that some plastic straining occurs in the cross brace directly in contact
with the analyzed leg section. Plastic straining also occurs at the level of the mudline for the
impacted leg (529) and the one directly behind it in the direction of the collision (513). The
plastic straining is these sections, along with the overall elastic energy absorption of the entire
jacket structure accounts for the discrepancies in the results that were compared.
Page 111
Collision Failure Study of Rigid Ship Models with a Deformable Offshore Wind Turbine
Jacket Structure
111
“EMSHIP” Erasmus Mundus Master Course, period of study September 2012 – February 2014
Figure 138: Front, Side and Top View of Plastic Strain Distribution
Figure 139 reveals that the elastic energy of the structure accounts for 16% (1.65 MN) of the
total energy of the collision, while the sliding energy due to the contact friction accounts for
2.8% (0.3 MJ).
Figure 139: Energy Distribution throughout the Simulation
The maximum penetration attained with the simplified tool was for a penetration of 1 m, while
the simulation run in LS-DYNA produced a maximum penetration of 0.89 m. The internal
energy obtained in the simplified tool was 11.139 MJ, while the LS-DYNA results presented
an internal energy of 7.118 MJ. This accounts for a 36% difference between both and the fact
that the LS-DYNA results are lower is reasonable, as it is accounting for the interaction of the
entire structure.
The curves present an error below 10% up to 0.58 m penetration, which means that up to this
point, the setup of the simplified tool which only calculates the local mode deformation of the
Page 112
P 112 Andrés Barrera
Master Thesis developed at ICAM, Nantes
section of the leg provides a good approximation as to the internal energy dissipated by the
same section for a simulation of the entire jacket.
Figure 140: Crushed Leg Section Internal Energy Results
The same procedure was followed for the resultant force, which was also an output of the
simplified calculation tool. The maximum difference (20%) between both curves occurs at a
penetration of 0.38 m, where the simplified tool presents a value for resultant force of 9799 kN
while the value obtained with LS-DYNA was 12107 kN.
Figure 141: Comparison of Crushing Force Values
The values for the component of the x force show a good correlation between both the simplified
tool and the LS-DYNA results. This was expected, as it is the principal direction of the collision.
On the other hand, the values for the Y component of the crushing force are not in accordance,
even though the tendency is observed up to a penetration of 0.6 m. The discrepancy can be
Page 113
Collision Failure Study of Rigid Ship Models with a Deformable Offshore Wind Turbine
Jacket Structure
113
“EMSHIP” Erasmus Mundus Master Course, period of study September 2012 – February 2014
attributed to the analytical procedure followed to calculate the components from the application
of virtual work in the simplified software, where the angle of the resultant force is assumed and
to the effect of the remainder of the jacket structure for the case of the LS-DYNA simulation.
It is observed that the resultant force and its components are higher in the case of the numerical
simulations, which is also reasonable, as the simplified tool currently only calculates the local
mode (membrane force).
Figure 142: X Component of Resultant Force
Figure 143: Y Component of Resultant Force
The following figure shows the reduction in length of the studied section of the leg throughout
the simulation. At the maximum penetration of 0.89 m, the member decreased 65 mm in length,
which represents 0.84% of the total length (7.655 m). It can be concluded that the length
Page 114
P 114 Andrés Barrera
Master Thesis developed at ICAM, Nantes
reduction, for this case is negligible, meaning that the end conditions for this leg section (brace
joints) can be considered as clamped and do not affect the membrane and bending force results.
Figure 144: Leg Section Length Reduction
The following figure shows the cross section of the impacted leg member at the end of the
simulation. The highly crushed side (a) measures 0.699 m (54% of the original), while the
lengthened side (b) measures 1.66 m (a 27% increase).
Figure 145: Deformed Cross Section
This section presented the initial comparison of the simplified tool based on the super-element
method extended for cylindrical components impacted by rigid stems to a rigid ship collision
simulation with a deformable jacket simulated in LS-DYNA. Currently the simplified tool only
accounts for the local deformation of the cylindrical member. Up to a penetration depth of 0.58
m the results of internal energies present good correlation, while the resultant force presented a
more or less constant discrepancy of 20%. As this thesis was part of a project that is still under
development, further work regarding the development of the simplified tool includes
performing the same comparison for brace members, and once the tool has been extended to
consider global modes as well, a detailed study against the results of a numerical study must be
carried out.
Page 115
Collision Failure Study of Rigid Ship Models with a Deformable Offshore Wind Turbine
Jacket Structure
115
“EMSHIP” Erasmus Mundus Master Course, period of study September 2012 – February 2014
4 ANALYSIS/CONCLUSIONS
The following figures present a comparison of the internal energies vs penetration of the
simulations that were compared to assess the sensitivity of the jacket to different impact
configurations. For the case of the high energy collisions, the comparison was made for the
lowest value between the maximum penetration of both curves.
The 8 m/s high energy collisions show that to a penetration depth of 6 m (the maximum reached
by the brace joint case) the leg collision is more critical, as there is a better transfer of the loads,
since the leg is a primary support member. The joint on the other hand ruptures without
transferring any considerable loads to the structure.
Figure 146: Crude Oil Carrier 8m/s Velocity Internal Energy Comparison
For the 2 m/s high energy scenarios with the crude oil carrier the leg case is also more critical,
as the total internal energy dissipated by the structure is 3% higher. Here however, as the brace
joint successfully transfers a higher amount of loading to the rest of the structure without
rupturing, up to the maximum penetration of 3.4 m. The crushing force for the most affected
member and the resultant displacement at the transition piece are also higher for the leg impact.
Varying the collision angle for the high energy cases, for both the leg and brace scenarios also
showed that the perpendicular collision was more detrimental for the structure, as the total
internal energies, the internal energy of the most affected member and the displacement at the
transition piece were higher with a 90° angle.
The variation in angle for the impacts reflected a 3% difference as seen in the following figure.
0,00
5,00
10,00
15,00
20,00
25,00
30,00
35,00
40,00
45,00
0,000 1,000 2,000 3,000 4,000 5,000 6,000 7,000
Inte
rnal
En
erg
y (M
J)
Penetration (m)
Leg Impact
Joint Impact
Page 116
P 116 Andrés Barrera
Master Thesis developed at ICAM, Nantes
The joint impact study however reflected a higher discrepancy between the internal energies,
as the perpendicular collision has dissipated 3.2 times more energy for the maximum
penetration of the 30° collision.
Figure 147: Crude Oil Carrier 2m/s Velocity Internal Energy Comparison
The most detrimental impact location identified with the OSV at 6 m/s was the leg, as the total
internal energy, the internal energy of the most affected component and its crushing force were
higher. The penetration was lower with the consumption of all the kinetic energy; however this
is indicative that here a more critical section was impacted.
Figure 148: OSV 6 m/s Velocity Internal Energy Comparison
0,000
10,000
20,000
30,000
40,000
50,000
60,000
0,000 1,000 2,000 3,000 4,000
Inte
rnal
En
erg
y (M
J)
Penetration (m)
Joint Impact 90 degrees
Joint Impact 30 degrees
Leg Impact 30 degrees
Leg Impact 90 degrees
0,000
10,000
20,000
30,000
40,000
50,000
60,000
70,000
80,000
90,000
100,000
0,000 1,000 2,000 3,000 4,000
Ene
rgy
(MJ)
Penetration (m)
Joint Impact
Leg Impact
Page 117
Collision Failure Study of Rigid Ship Models with a Deformable Offshore Wind Turbine
Jacket Structure
117
“EMSHIP” Erasmus Mundus Master Course, period of study September 2012 – February 2014
For the OSV collision simulations with energies similar to those required for design by
regulation (2 m/s collision velocity), a variation in the collision angle varied the maximum
penetration 6%, the total internal energy dissipated by the structure 2%, the crushing force 30%
and the resultant displacement of the transition piece 50%.
Figure 149: OSV Comparison to Variation in Collision Angles
A variation in the collision height from 34.58 to 39 m for the OSV varied the maximum internal
energy absorbed by the impacted leg 26%, the crushing force by 12% and the resultant
displacement on the transition piece 45%. It was observed that the results were different with a
variation in height because the contact points were different, including a leg section and a leg
joint with the braces, which ideally is a stronger component than the leg section.
Therefore, both high energy and standard (by regulation) energy simulations are both sensitive
to a variation in collision angle and height.
Also, it was determined for 2 and 6 m/s perpendicular OSV collision simulations the effects of
gravity loads do not affect the primary results enough as for it to be considered for an initial
approximation to the simplified calculation tool.
A preliminary comparison of an LS-DYNA collision simulation to the simplified calculation
tool which only considers localized deformation due to membrane force provided good
agreement in terms of internal energy up to a penetration depth of 0.6 m (10% discrepancy),
and a 20% discrepancy throughout for the resultant force.
Overall, the primary and specific objectives defined were met, as the sensitivity of the jacket to
the different configurations was established.
0,000
1,000
2,000
3,000
4,000
5,000
6,000
7,000
8,000
9,000
10,000
0,000 0,200 0,400 0,600 0,800 1,000 1,200
Ene
rgy
(MJ)
Penetration (m)
90 degrees
60 degrees
Page 118
118
Sim #
Sim. Type
Time (s)
Impact Location
Angle
(°)
Vel. (m/s)
H. (m)
Energy (MJ)
Max. P. (m)
Internal Energy Structure (MJ)
Part # Max. Int E. of Part
(MJ) Part #
Crushing Force (MN)
Disp. Transition Piece (m)
1 Tanker 0.78 Leg 2 pts 90 8 44 4462 5.6 50 L529 14.41 L529 12 2.4
2 Tanker 2 Leg 2 pts 90 2 44 279 3.41 60 L529 37.5 L529 13.8 0.78
3 Tanker 2 Leg 2 pts 30 2 44 279 4.11 56 L529 37.16 L529 14.49 0.14
4 Tanker 0.78 Brace Joint 90 8 44 4462 6.04 1.67 B588 0.77 B525 5.87 0.048
5 Tanker 2 Brace Joint 90 2 44 279 3.4 58 L529 16 B541 9 0.25
6 Tanker 2 Brace Joint 30 2 44 279 3.1 20 B534 5.2 B534 5.9 0.075
7 OSV 2 Leg 2 pts 90 2 34.58 10.5 0.6 9.78 L529 7.19 L529 2.8 0.2
8 OSV 2 Leg 2 pts 60 2 34.58 10.5 0.56 9.57 L529 7.68 L529 1.94 0.1
9 OSV 2 Leg 2 pts 90 5 34.58 65.63 2.8 61.18 L529 41.48 L529 5.52 0.5
10 OSV 2 Leg 2 pts 90 5 39 65.63 2.43 61.77 L529 30.32 L529 6.3 0.92
11 OSV-
Gravity 2 Leg 2 pts 90 6 34.58 94.5 3.7 90.23 L529 53.7 L529 34.3 1.2
12 OSV 2 Leg 2 pts 90 6 34.58 94.5 3.5 90.11 L529 53.3 L529 33.3 1.1
13 OSV-
Gravity 2 Leg 2 pts 90 2 34.58 10.5 0.623 9.8 L529 7.38 L529 23.1 0.15
14 OSV 2 Leg 2 pts 90 2 34.58 10.5 0.6 9.78 L529 7.15 L529 22.32 0.2
15 OSV-
Tower 2 Leg 2 pts 90 6 34.58 94.5 3.98 90.6 L529 42 L529 30.9 2.11
16 OSV 2 Leg 1 pt 90 6 34.58 94.5 4.82 90.4 LS593 32.8 LS529 27.8 2.05
17 OSV 2 Leg 1 pt 90 2 34.58 10.5 0.89 9.8 LS529 7.11 LS529 16.62 -
18 OSV 2 Brace/Legs 90 6 34.58 94.5 3.11 88.7 L529 27.8 B535 6.14 1.27
Table 6: Summary of Results
Page 119
119
5 FURTHER WORK
Further work required includes a better definition of the connectivity between the OWT tower
and the transition piece, since for the simulation carried out the platform was neglected. This
caused considerable deformations on the root of the tower and on the transition piece which are
not realistic.
New simulations defining the cross sections for all of the nodes of the jacket are also required
to determine the resultant force transmission for the entire jacket and produce a detailed map of
force transmission for the definition of the simplified calculation tool.
Also, additional simulations are also required to better characterize the force transmission
process throughout the jacket in different collision configurations, which will serve as basis for
the development of the simplified calculation tool that accounts for the effect of the entire jacket
on the resultant force and internal energies dissipated by a single member.
Page 120
P 120 Andrés Barrera
Master Thesis developed at ICAM, Nantes
6 ACKNOWLEDGEMENTS
The author would like to thank Professor Hervé LE SOURNE for all the mentoring provided,
Jose BABU MALIAKEL, Michael O’CONNOR for the assistance provided and Professor
Phillipe RIGO for the excellent management of the EMSHIP program.
This thesis was developed in the frame of the European Master Course in “Integrated Advanced
Ship Design” named “EMSHIP” for “European Education in Advanced Ship Design”, Ref.:
159652-1-2009-1-BE-ERA MUNDUS-EMMC.
Page 121
Collision Failure Study of Rigid Ship Models with a Deformable Offshore Wind Turbine
Jacket Structure
121
“EMSHIP” Erasmus Mundus Master Course, period of study September 2012 – February 2014
7 REFERENCES
Alsos, H.S., Amdahl, J., Hopperstad, O.S., 2009. On the resistance to penetration of stiffened
plates, Part II: Numerical analysis. Int. J. Impact Eng. 36, 875–887.
Amdahl, J., Johansen, A., 2001. High Energy Ship Collision with Jacket Legs, in: Proceedings
of the Eleventh (2001) International Offshore and Polar Engineering Conference.
Presented at the Eleventh International Offshore and Polar Engineering Conference, The
International Society of Offshore and Polar Engineers, Stavanger, Norway.
Beatrice Wind Farm, 2007. Beatrice Wind Farm Demonstrator Project. Scotland.
Bhatta, D.D., 2003. Surge motion on a floating cylinder in water of finite depth. Int. J. Math.
Math. Sci. 2003, 3643–3656.
Biehl, F., 2005. Collision Safety Analysis of Offshore Wind Turbines. Presented at the LS-
DYNA Anwenderforum, Bramberg.
Buldgen, L., Le Sourne, H., Besnard, N., Rigo, P., 2012. Extension of the super-elements
method to the analysis of oblique collision between two ships. Mar. Struct. 29, 22–57.
Buldgen, L., Le Sourne, H., Rigo, P., 2013a. A simplified analytical method for estimating the
crushing resistance of an inclined ship side. Mar. Struct. 33, 265–296.
Buldgen, L., Le Sourne, H., Rigo, P., 2013b. Fast strength assessment of mitre gates to ship
impact. Int. J. Crashworthiness 18, 423–443.
Cho, S.R., Seo, B.S., Cerik, B.C., Shin, H.K., 2013. Experimental and Numerical Investigations
on the Collision Between Offshore Wind Turbine Support Structures and Service
Vessels. Collis. Grounding Ships Offshore Struct.
Dalhoff, P., 2005. Ship Collision- Risk Analysis- Emergency Systems- Collision Dynamics.
DNV, 2010. Design of Offshore Wind Turbine Structures.
Gerwick, Ben, 2007. Construction of Marine and Offshore Structures, CRC Press. ed. CRC
Press, San Francisco, California, U.S.A.
GL Renewables Certification, 2012. Guideline for the Certification of Offshore Wind Turbines.
Grewal, G., Lee, M., 2004. Strength of Minimum Structure Platforms Under Ship Impact. J.
Offshore Mech. Arct. Eng. 126.
Hallquist, J.O., 2006. LS-DYNA THEORY MANUAL, First Edition. ed. Livermore Software
Technology Corporation, Livermore, California.
Haris, S., Amdahl, J., 2013. Analysis of ship–ship collision damage accounting for bow and
side deformation interaction. Mar. Struct. 32, 18–48.
Hong, L., Amdahl, J., 2008. Crushing resistance of web girders in ship collision and grounding.
Mar. Struct. 21, 374–401.
Key to Metals AG, 2014. AFNOR E26.4 Steel Properties.
Le Sourne, H., Besnard, N., Cheylan, C., Buannic, N., 2012. A Ship Collision Analysis Program
Based on Upper Bound Solutions and Coupled with a Large Rotational Ship Movement
Analysis Tool. J. Appl. Math. 2012.
LORC, 2012. The Jacket - A Path to Deeper Waters.
Lutzen, M., Simonsen, B.C., Pedersen, P.T., 2000. Rapid Prediction of Damage to Struck and
Striking Vessels in a Collision Event. Proc. Int. Conf. Ship Struct. New Millenium
Support. Qual. Shipbuild.
Minorsky, V., 1959. An Analysis of Ship Collisions with Reference to Protection of Nuclear
Power Plants. J. Ship Res.
Ohtsubo, H., Wang, G., 1995. An upper-bound solution to the problem of plate tearing. J. Mar.
Sci. Technol. 1, 46–51.
Schweizerhof, K., Nilsson, L., Hallquist, J.O., 1992. Crashworthiness Analysis in the
Automotive Industry. Int. J. Comput. Appl. Technol. 5, 134–156.
Page 122
P 122 Andrés Barrera
Master Thesis developed at ICAM, Nantes
Smith, C., 2007. Extreme Waves and Ship Design. Presented at the 10th International
Symposium on Practical Design of Ships and Other Floating Structures, American
Bureau of Shipping, Houston, Texas, United States.
Talisman Energy, 2005. Beatrice Wind Farm Demonstrator Project Scoping Report (Scope).
Talisman Energy, Aberdeen, Scotland.
Visser, P., 2004. Ship Collision and Capacity of Brace Members of Fixed Steel Offshore
Platforms. Health and Safety Executive, U.K.
Vredeveldt, A.W., Schipperen, J.H.A., 2013. Safe Jacket Configurations to Resist Boat Impact.
Collis. Grounding Ships Offshore Struct.
Wierzbicki, T., 1995. Concertina tearing of metal plates. Int. J. Solids Struct. 32, 2923–2943.
Yukio, U., Rashed, S.M.H., 1984. The idealized structural unit method and its application to
deep girder structures. Comput. Struct. 18, 277–293.
Zhang, S., 2002. Plate tearing and bottom damage in ship grounding. Mar. Struct. 15, 101–117.


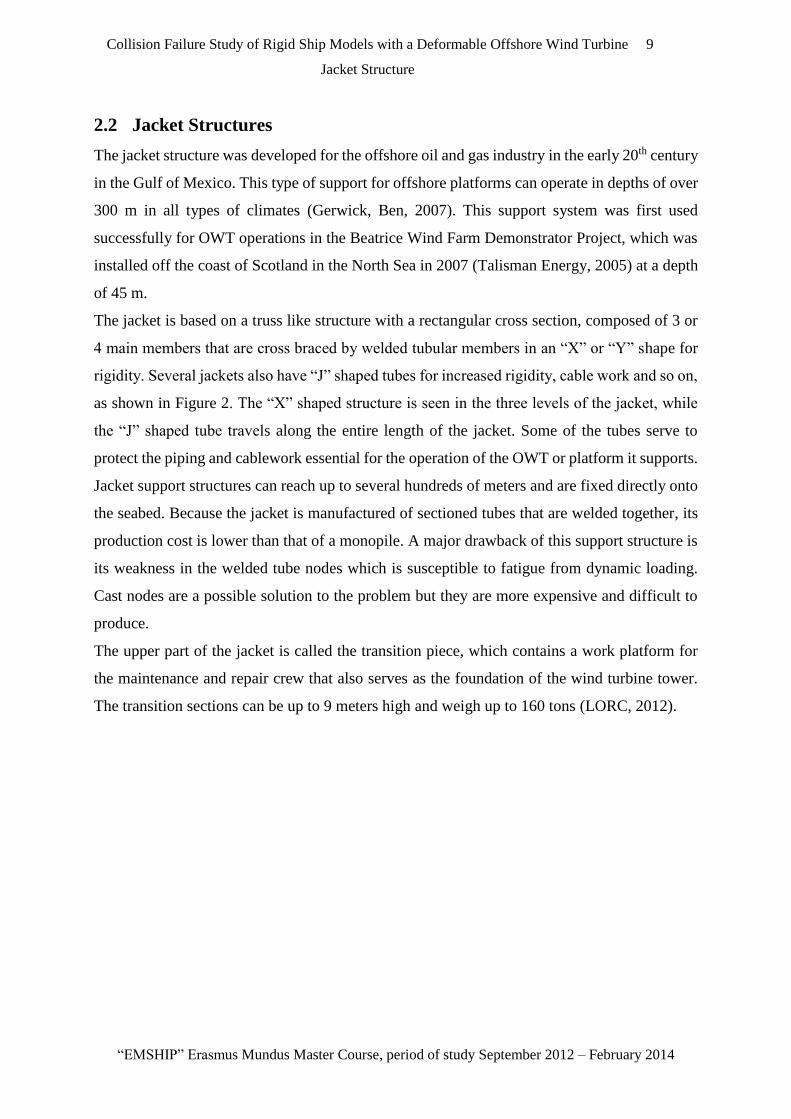


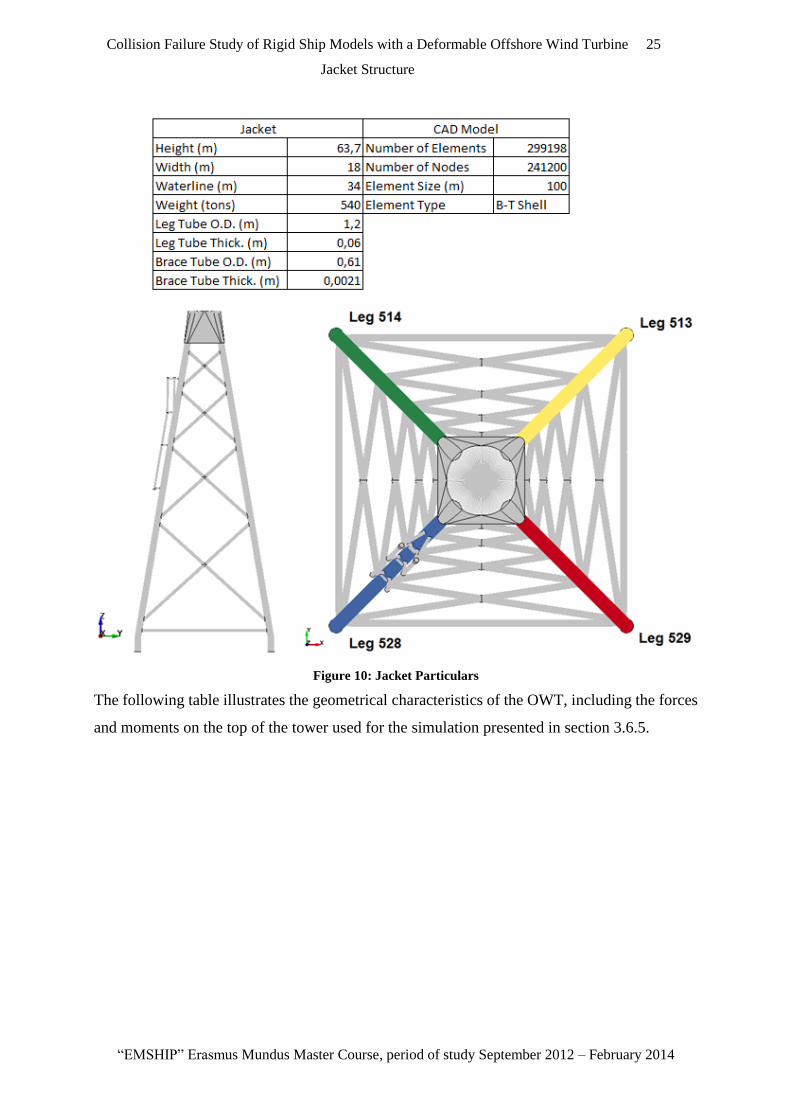


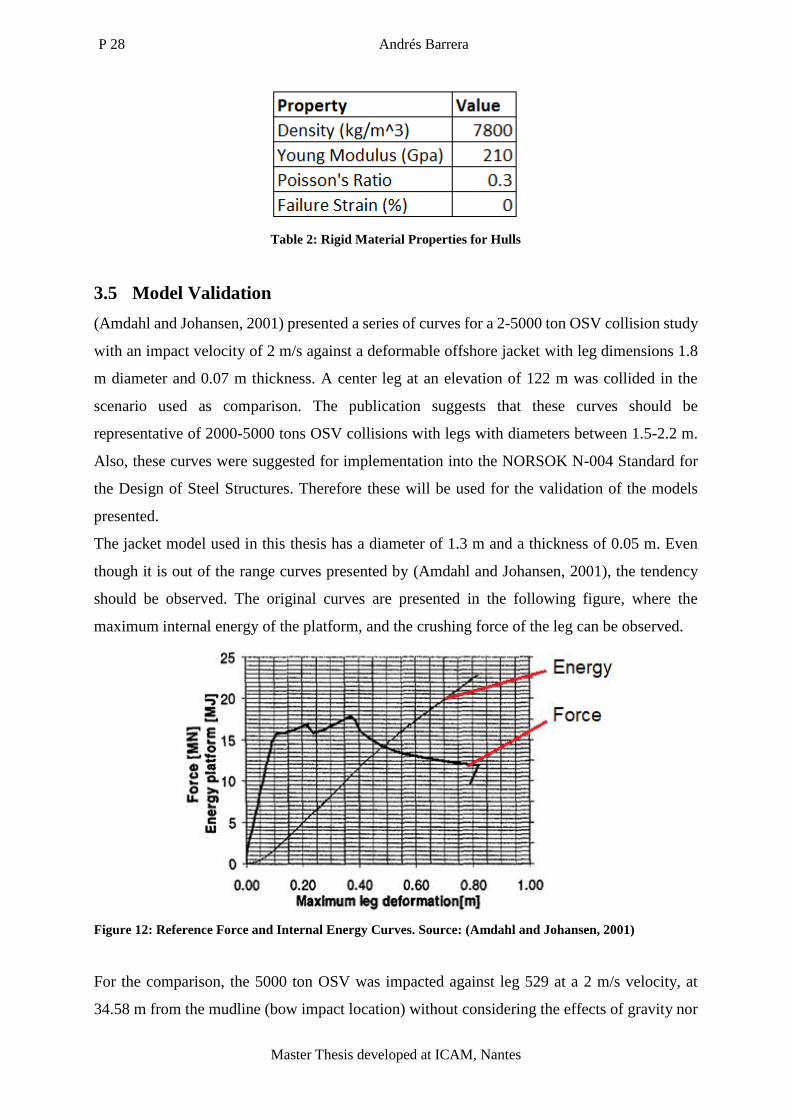


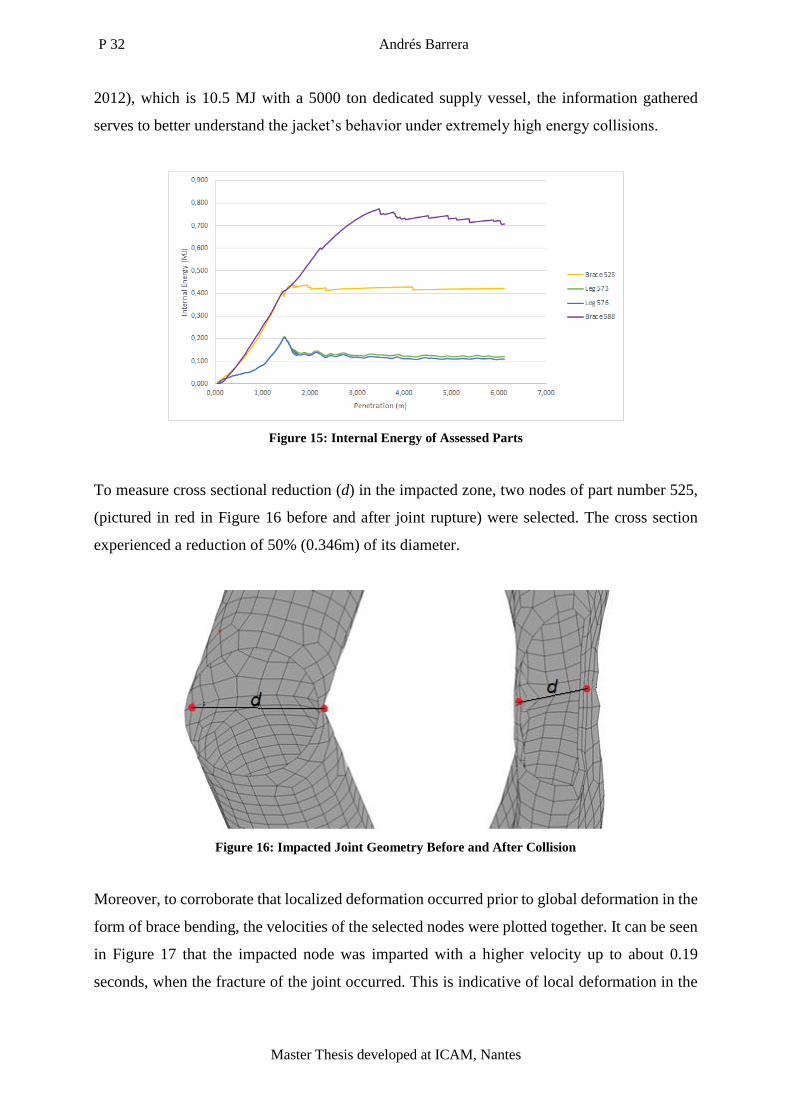


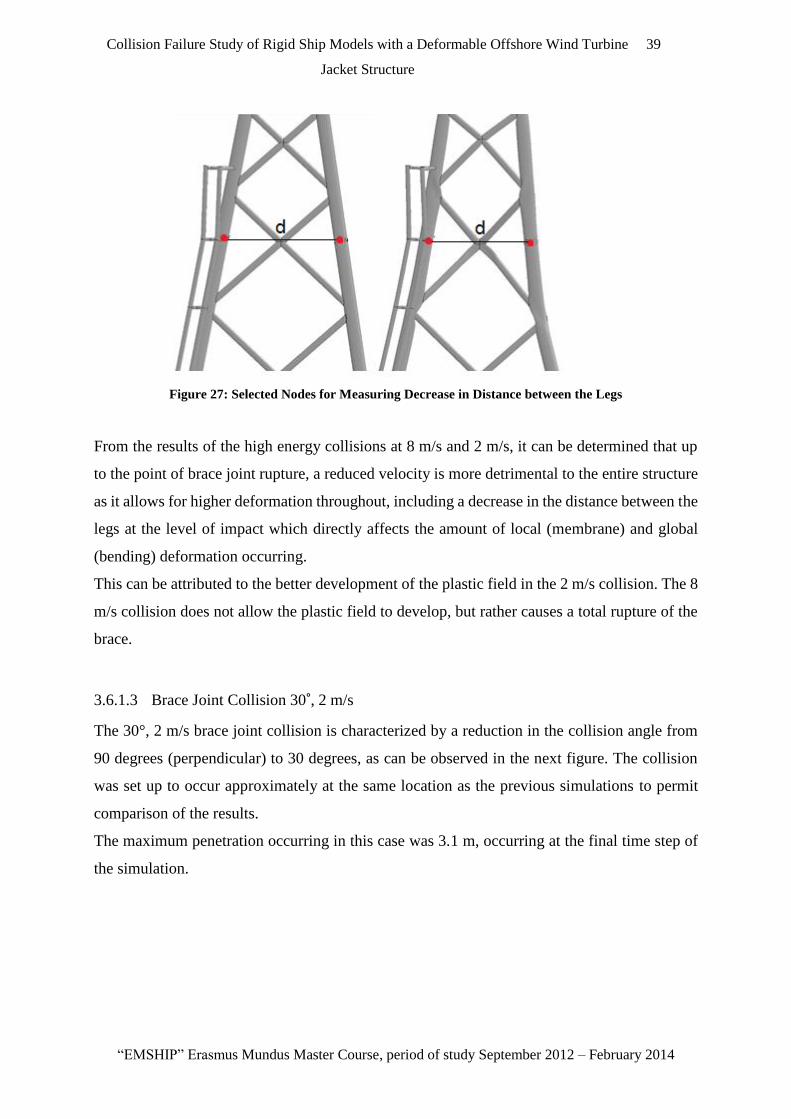


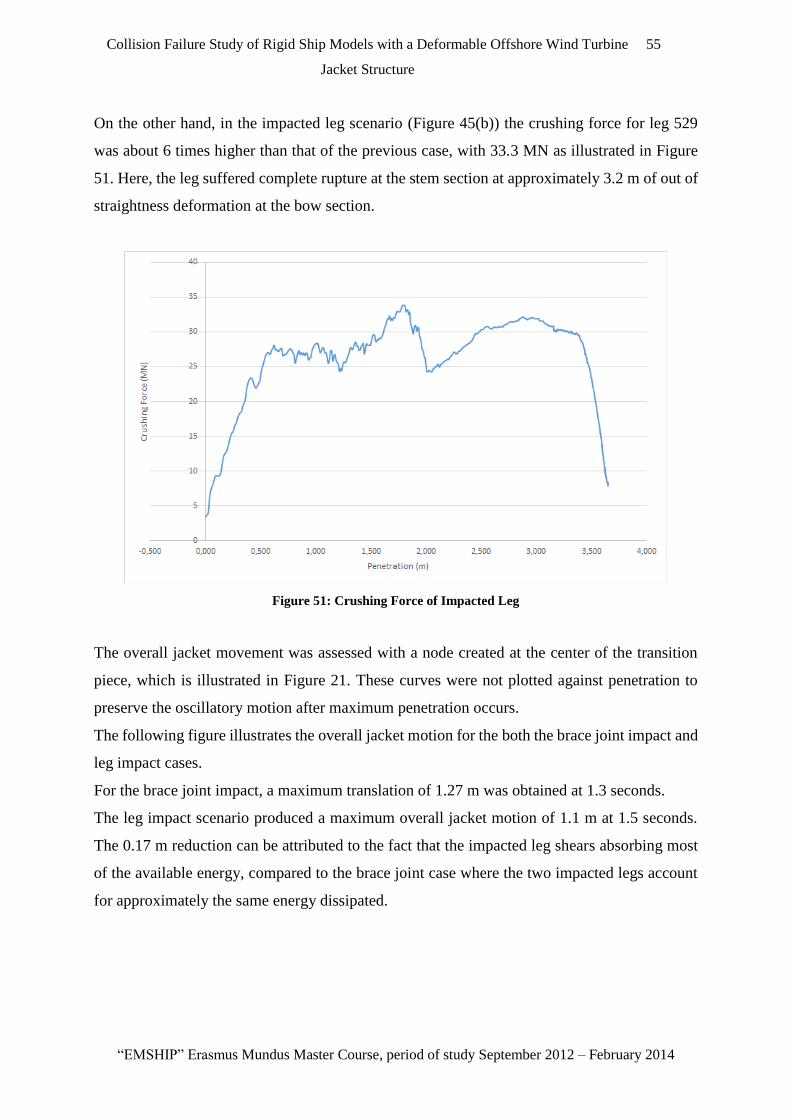


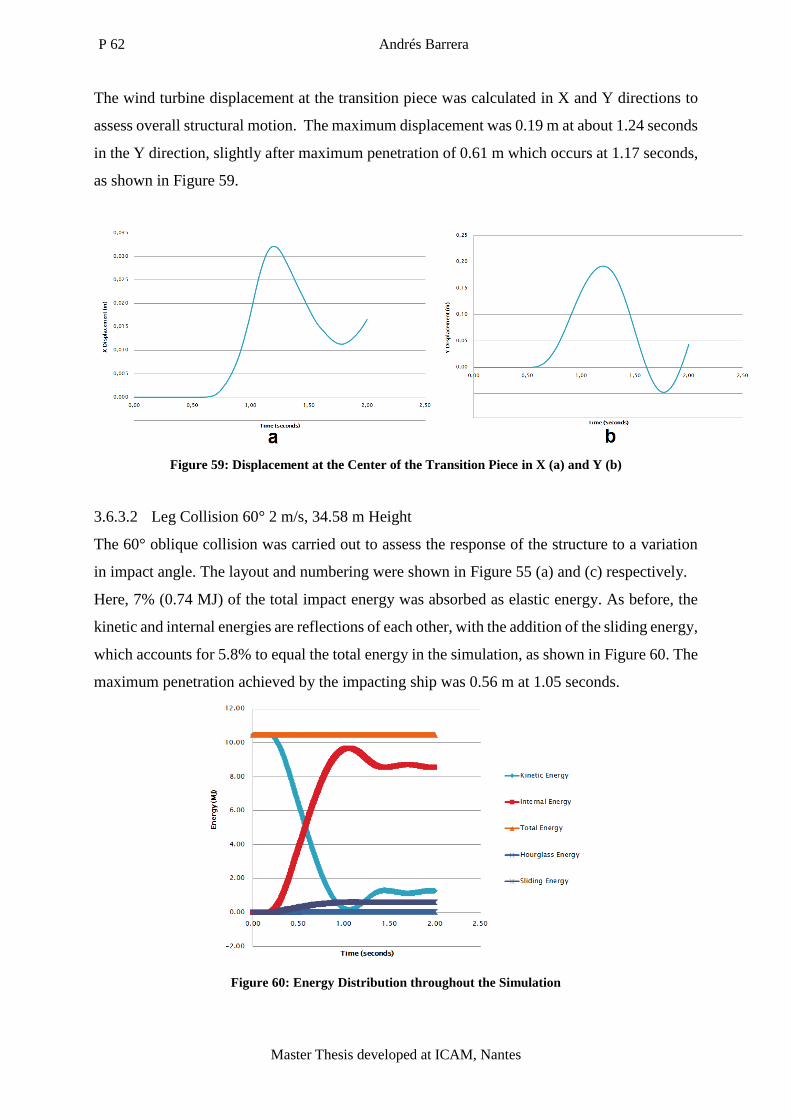


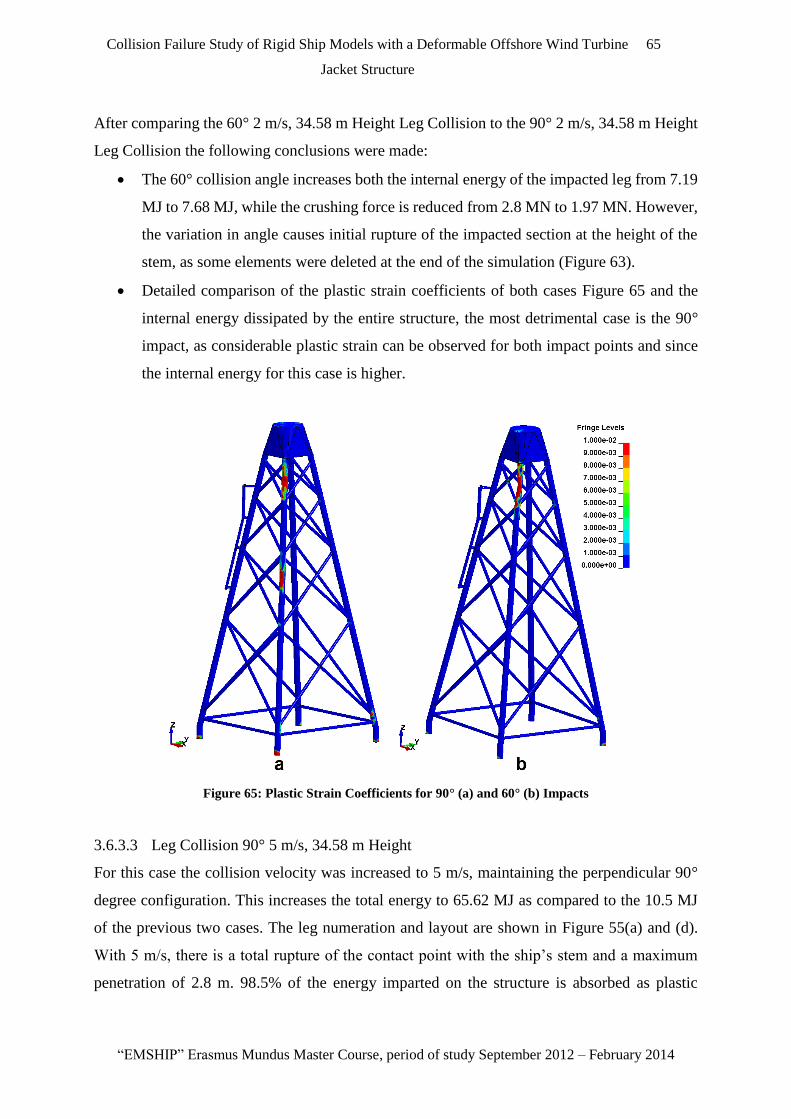


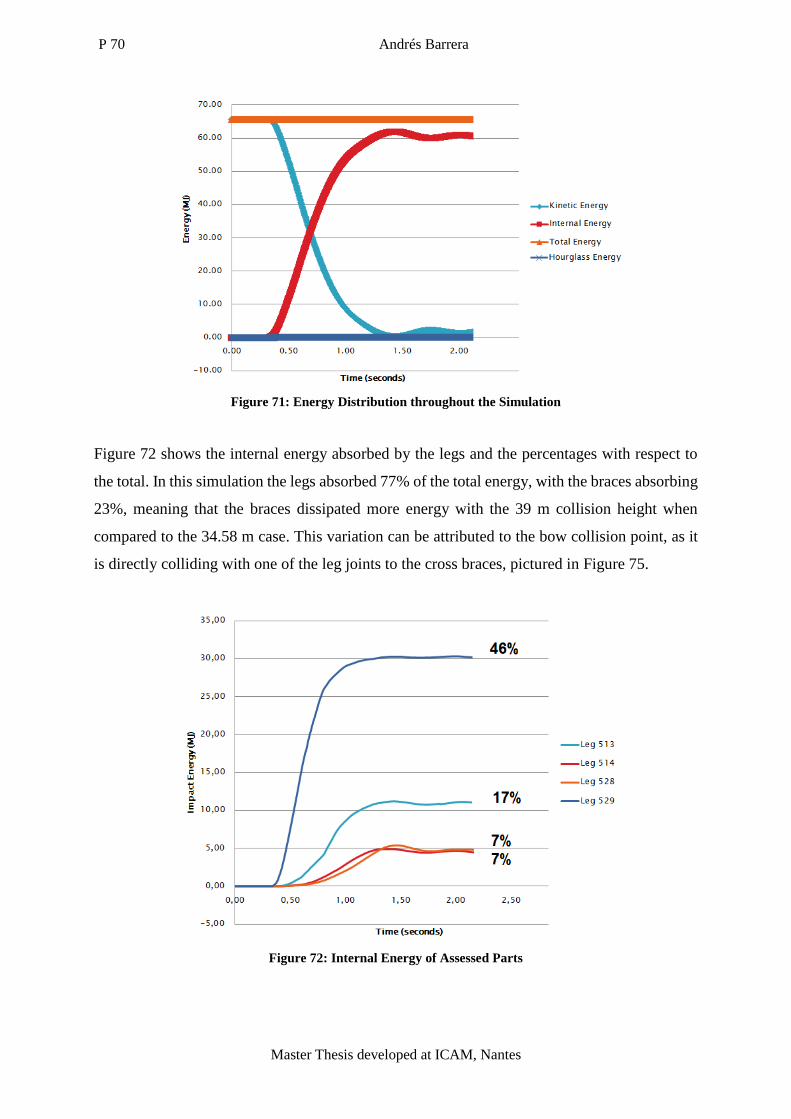


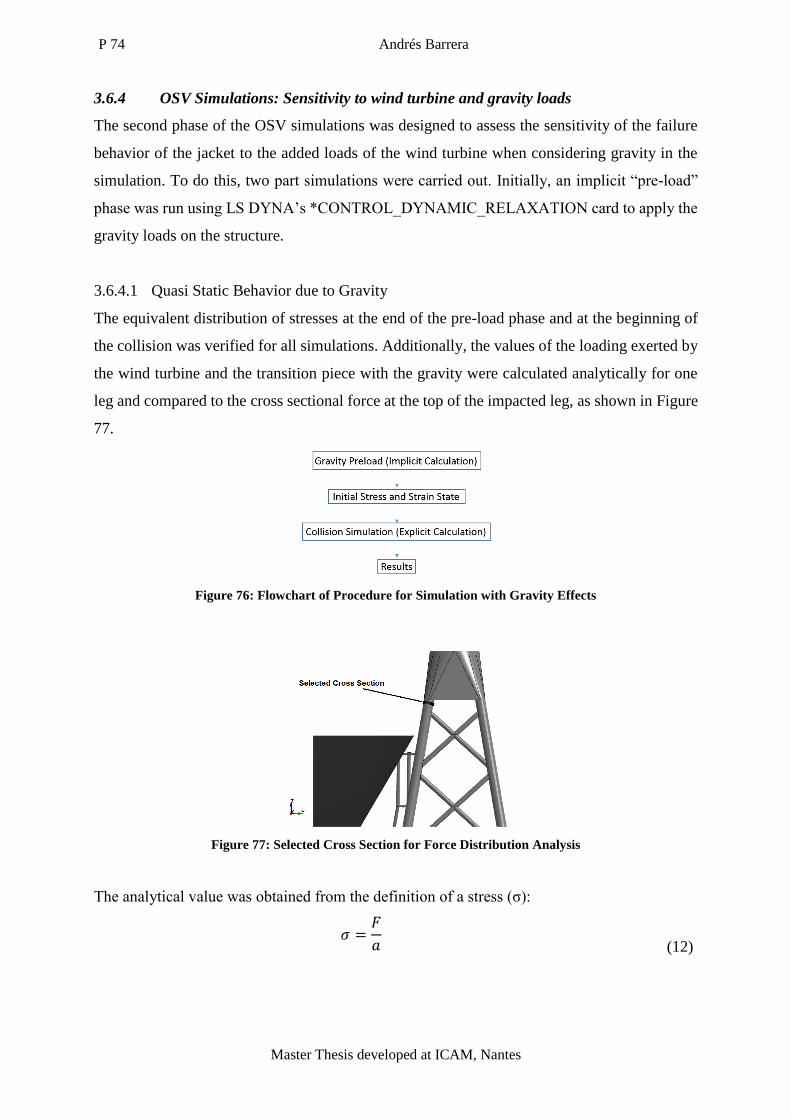


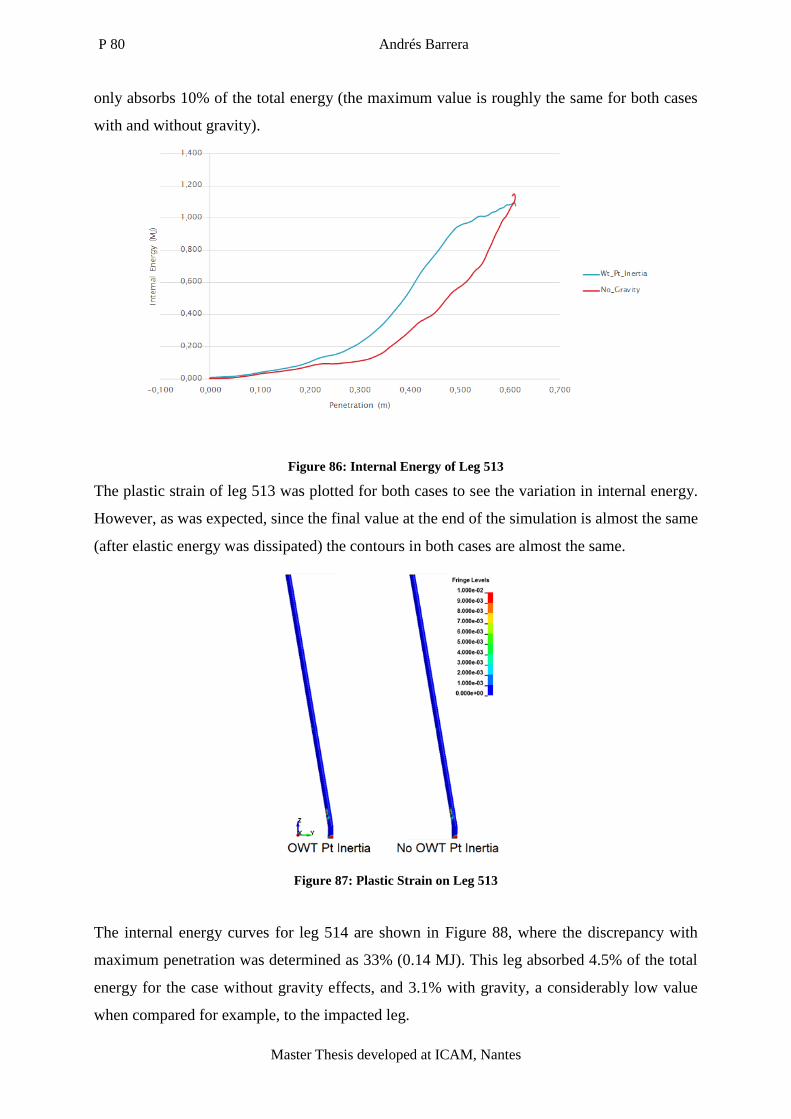


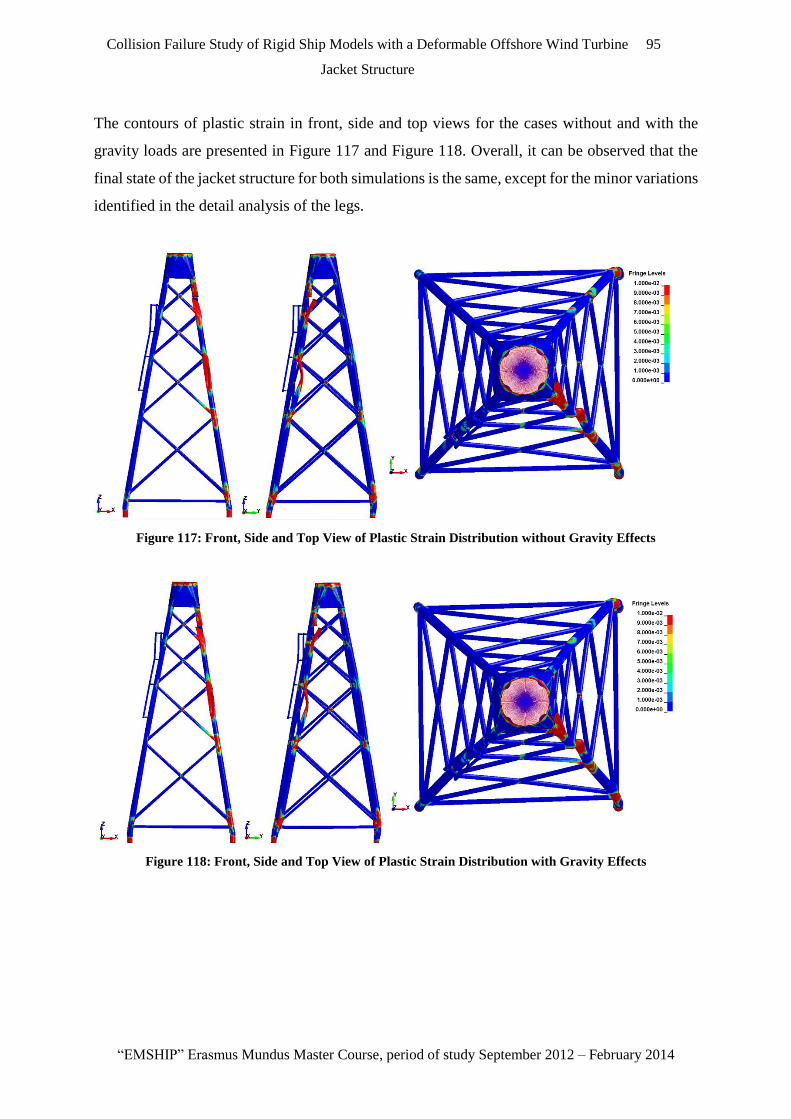


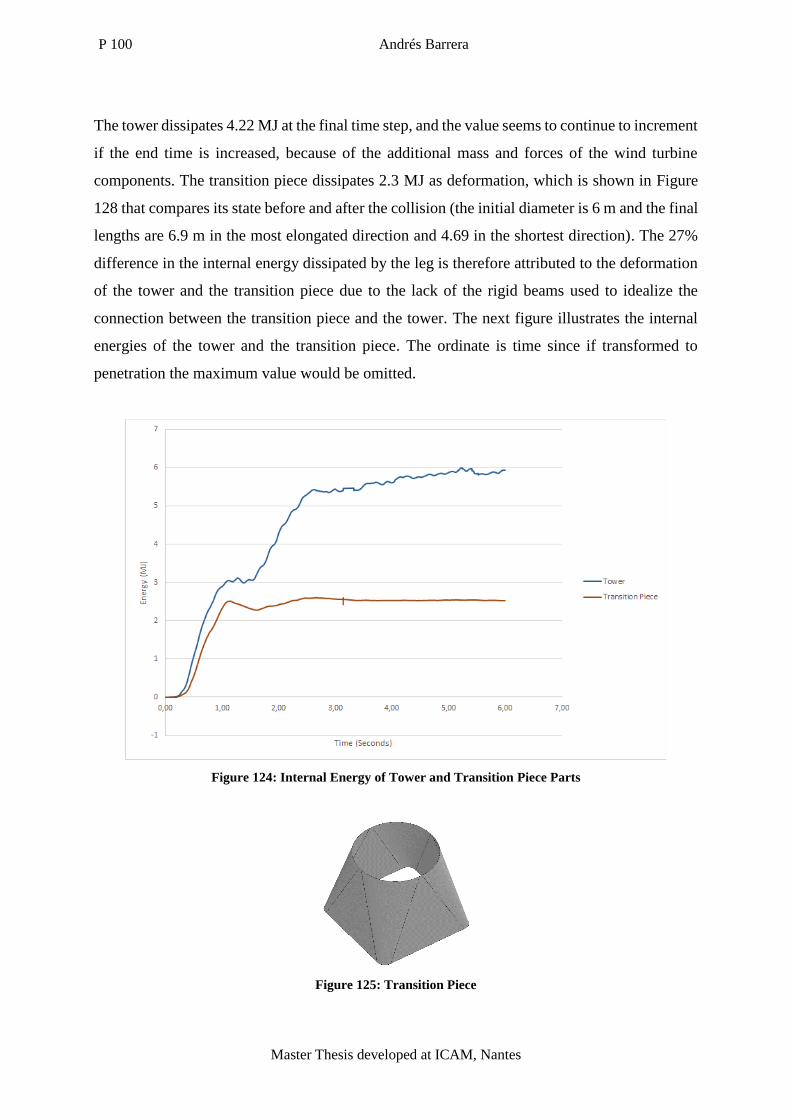


![Variational Context-Deformable ConvNets for Indoor Scene ... Variational Context-Deformable... · Deformable ConvNets v2 [56] reformulated DCN with mask weights, which alleviated](https://static.documents.pub/doc/80x56/5f26bf72421c4b2b0840bb0e/variational-context-deformable-convnets-for-indoor-scene-variational-context-deformable.jpg)


