Proceedings of the International School of Physics “Enrico Fermi” Course CLXXXIV “Physics of Complex Colloids”, edited by C. Bechinger, F. Sciortino and P. Ziherl (IOS, Amsterdam; SIF, Bologna) DOI 10.3254/978-1-61499-278-3-447 Colloidal shape effects in evaporating drops P. J. Yunker and A. G. Yodh Department of Physics and Astronomy, University of Pennsylvania Philadelphia PA 19104, USA T. Still Department of Physics and Astronomy, University of Pennsylvania Philadelphia PA 19104, USA Complex Assemblies of Soft Matter, CNRS-Rhodia-University of Pennsylvania UMI 3254 Bristol, PA 19007, USA Summary. — We explore the influence of particle shape on the behavior of evapo- rating drops. A first set of experiments discovered that particle shape modifies par- ticle deposition after drying. For sessile drops, spheres are deposited in a ring-like stain, while ellipsoids are deposited uniformly. Experiments elucidate the kinetics of ellipsoids and spheres at the drop’s edge. A second set of experiments examined evaporating drops confined between glass plates. In this case, colloidal particles coat the ribbon-like air-water interface, forming colloidal monolayer membranes (CMMs). As particle anisotropy increases, CMM bending rigidity was found to increase, which in turn introduces a new mechanism that produces a uniform deposition of ellipsoids and a heterogeneous deposition of spheres after drying. A final set of experiments investigates the effect of surfactants in evaporating drops. The radially outward flow that pushes particles to the drop’s edge also pushes surfactants to the drop’s edge, which leads to a radially inward flow on the drop surface. The presence of radially outward flows in the bulk fluid and radially inward flows at the drop surface creates a Marangoni eddy, among other effects, which also modifies deposition after drying. c Societ` a Italiana di Fisica 447
Transcript
Proceedings of the International School of Physics “Enrico Fermi”Course CLXXXIV “Physics of Complex Colloids”, edited by C. Bechinger, F. Sciortino and P. Ziherl(IOS, Amsterdam; SIF, Bologna)DOI 10.3254/978-1-61499-278-3-447
Colloidal shape effects in evaporating drops
P. J. Yunker and A. G. Yodh
Department of Physics and Astronomy, University of Pennsylvania
Philadelphia PA 19104, USA
T. Still
Department of Physics and Astronomy, University of Pennsylvania
Philadelphia PA 19104, USA
Complex Assemblies of Soft Matter, CNRS-Rhodia-University of Pennsylvania UMI 3254
Bristol, PA 19007, USA
Summary. — We explore the influence of particle shape on the behavior of evapo-rating drops. A first set of experiments discovered that particle shape modifies par-ticle deposition after drying. For sessile drops, spheres are deposited in a ring-likestain, while ellipsoids are deposited uniformly. Experiments elucidate the kineticsof ellipsoids and spheres at the drop’s edge. A second set of experiments examinedevaporating drops confined between glass plates. In this case, colloidal particles coatthe ribbon-like air-water interface, forming colloidal monolayer membranes (CMMs).As particle anisotropy increases, CMM bending rigidity was found to increase, whichin turn introduces a new mechanism that produces a uniform deposition of ellipsoidsand a heterogeneous deposition of spheres after drying. A final set of experimentsinvestigates the effect of surfactants in evaporating drops. The radially outward flowthat pushes particles to the drop’s edge also pushes surfactants to the drop’s edge,which leads to a radially inward flow on the drop surface. The presence of radiallyoutward flows in the bulk fluid and radially inward flows at the drop surface createsa Marangoni eddy, among other effects, which also modifies deposition after drying.
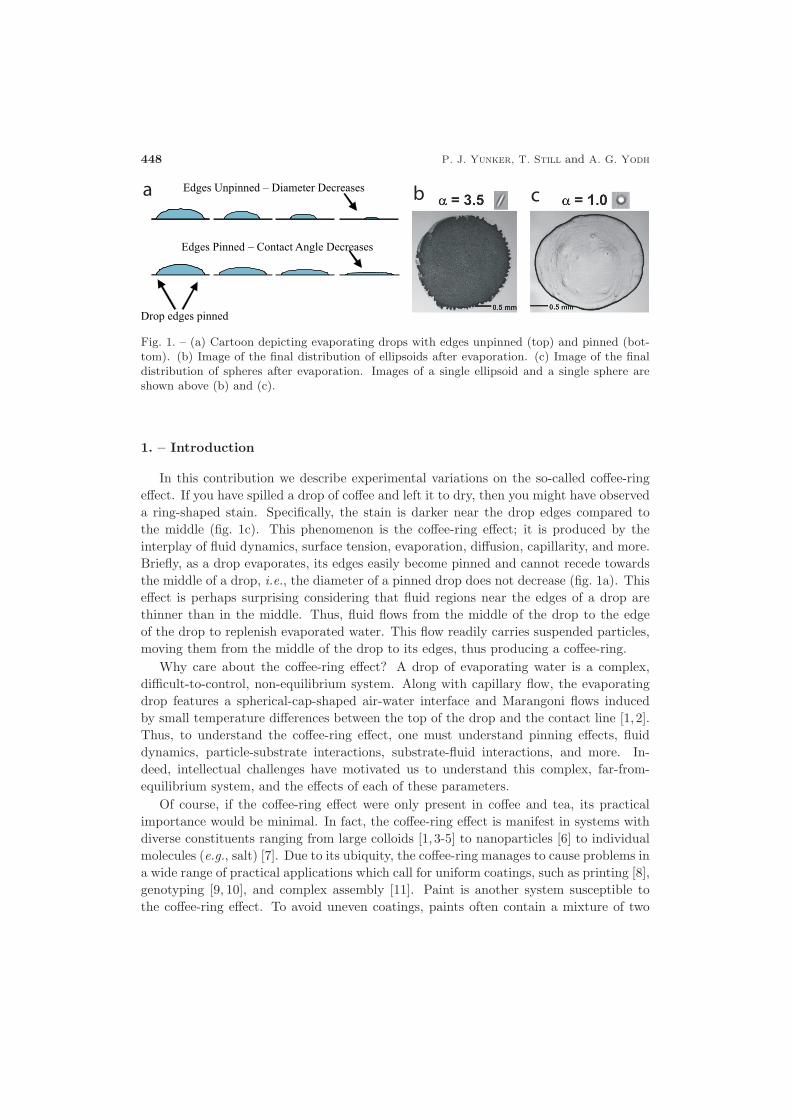
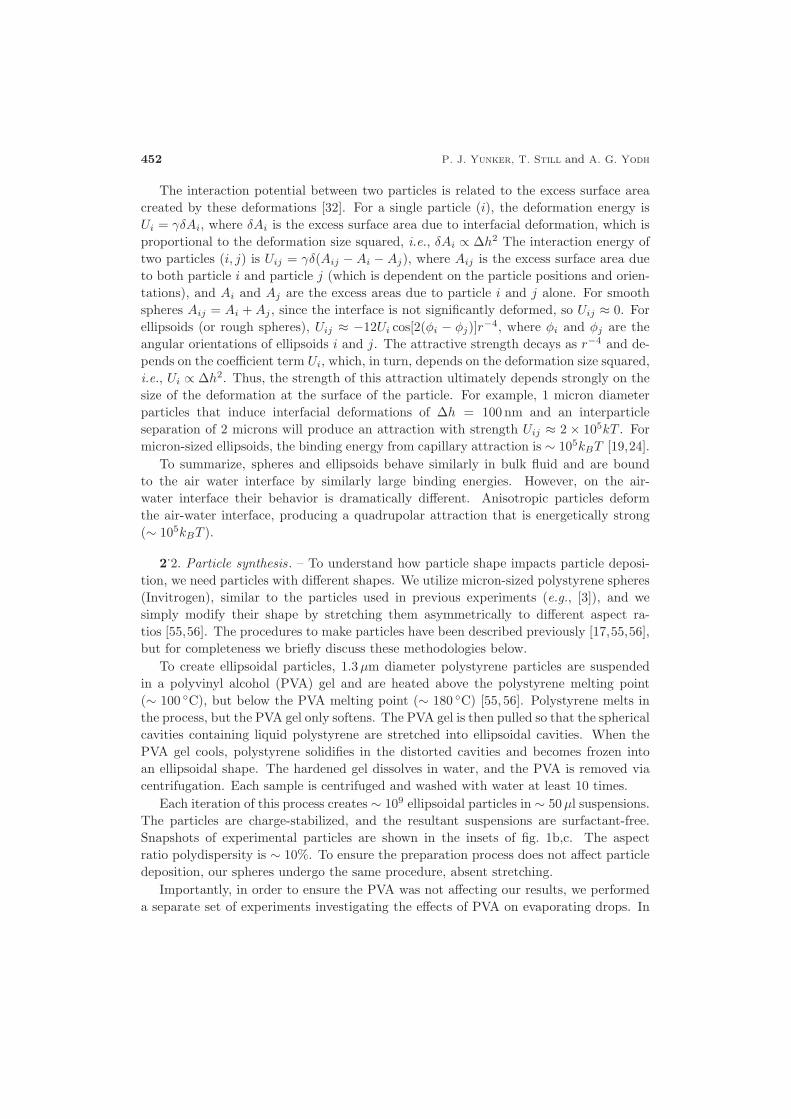
Fig. 1. – (a) Cartoon depicting evaporating drops with edges unpinned (top) and pinned (bot-tom). (b) Image of the final distribution of ellipsoids after evaporation. (c) Image of the finaldistribution of spheres after evaporation. Images of a single ellipsoid and a single sphere areshown above (b) and (c).
1. – Introduction
In this contribution we describe experimental variations on the so-called coffee-ringeffect. If you have spilled a drop of coffee and left it to dry, then you might have observeda ring-shaped stain. Specifically, the stain is darker near the drop edges compared tothe middle (fig. 1c). This phenomenon is the coffee-ring effect; it is produced by theinterplay of fluid dynamics, surface tension, evaporation, diffusion, capillarity, and more.Briefly, as a drop evaporates, its edges easily become pinned and cannot recede towardsthe middle of a drop, i.e., the diameter of a pinned drop does not decrease (fig. 1a). Thiseffect is perhaps surprising considering that fluid regions near the edges of a drop arethinner than in the middle. Thus, fluid flows from the middle of the drop to the edgeof the drop to replenish evaporated water. This flow readily carries suspended particles,moving them from the middle of the drop to its edges, thus producing a coffee-ring.
Why care about the coffee-ring effect? A drop of evaporating water is a complex,difficult-to-control, non-equilibrium system. Along with capillary flow, the evaporatingdrop features a spherical-cap-shaped air-water interface and Marangoni flows inducedby small temperature differences between the top of the drop and the contact line [1, 2].Thus, to understand the coffee-ring effect, one must understand pinning effects, fluiddynamics, particle-substrate interactions, substrate-fluid interactions, and more. In-deed, intellectual challenges have motivated us to understand this complex, far-from-equilibrium system, and the effects of each of these parameters.
Of course, if the coffee-ring effect were only present in coffee and tea, its practicalimportance would be minimal. In fact, the coffee-ring effect is manifest in systems withdiverse constituents ranging from large colloids [1, 3-5] to nanoparticles [6] to individualmolecules (e.g., salt) [7]. Due to its ubiquity, the coffee-ring manages to cause problems ina wide range of practical applications which call for uniform coatings, such as printing [8],genotyping [9, 10], and complex assembly [11]. Paint is another system susceptible tothe coffee-ring effect. To avoid uneven coatings, paints often contain a mixture of two
Colloidal shape effects in evaporating drops 449
different solvents. One is water, which evaporates quickly and leaves the pigment carryingparticles in a second, thicker solvent. The particles are unable to rearrange in thisviscous solvent and are then deposited uniformly. Unfortunately, this second solvent alsoevaporates relatively slowly (one reason why it might be boring to watch paint dry).While a number of schemes to avoid the coffee-ring effect have been discovered [6,12-16],these approaches typically involve significant modifications of the system. Thus, thediscovery of relatively simple ways to avoid the coffee-ring effect and control particledeposition during evaporation could greatly benefit a wide range of applications.
To this end, we asked (and answered) a question: does particle shape affect particledeposition [17]? At first glance, it may appear that shape should not matter. Colloidalparticles of any shape are susceptible to the radially outward flow of fluid that drives thecoffee-ring effect. However, changing particle shape dramatically changes the behavior ofparticles on the air-water interface. In fact, smooth anisotropic ellipsoids deform the air-water interface while smooth isotropic spheres do not [18-24]. Deforming the air-waterinterface, in turn, induces a strong interparticle capillary attraction between ellipsoids.This capillary attraction causes ellipsoids to form a loosely packed network that cancover the entire air-water interface, leaving ellipsoids much more uniformly distributedwhen evaporation finishes (fig. 1b). Conversely, spheres pack densely at the drop’s edge,producing a coffee-ring when evaporation has finished (fig. 1c). Thus, particle shape canproduce uniform coatings.
The remainder of this review is organized as follows. First, we discuss the differentinterfacial properties of spheres and ellipsoids, as well as the methods to make anisotropicparticles. Then, we discuss our investigation of particle behavior in evaporating sessiledrops and the coffee-ring effect. Much of this work is described in a recent publica-tion [17]. In particular, we demonstrate that particle shape strongly affects the depo-sition of particles during evaporation. Next, we investigate the role of particle shapein evaporating drops in confined geometries, and we show how to extract the bendingrigidity of the membranes formed by particles adsorbed on the air-water interface. Muchof this work is described in another publication [25]. Finally, we shift focus to discuss theeffects of surfactants on evaporating colloidal drops. We show that surfactants lead to aradially inward flow on the drop surface, which creates a Marangoni eddy, among othereffects, which leads to differences in drying dynamics. Some of this work was publishedrecently [26]. As a whole, this review attempts to present these experiments in a unifiedfashion.
2. – Anisotropic particles
2.1. Capillary interactions — the young-Laplace equation. – At small packing frac-tions, i.e., outside the range which would lead to formation of crystalline or liquid crys-talline phases, the diffusion and hydrodynamics of spheres and ellipsoids are only mod-estly different [27]. Further, both spheres and ellipsoids will adsorb onto the air-waterinterface; the binding energy of micron-sized particles to the air-water interface dependsprimarily on the interfacial area covered by the particle and the contact angle, quantities
450 P. J. Yunker, T. Still and A. G. Yodh
which are similar for spheres and ellipsoids. The binding energy for a micron-sized par-ticle is ∼ 107kBT , where kB is the Boltzmann constant and T is temperature [28]. Onceadsorbed onto the air-water interface, however, the behaviors of spheres and ellipsoids aredramatically different [29,30]. Anisotropic particles deform interfaces significantly, whichin turn produces very strong interparticle capillary interactions [18-24,31]. These defor-mations have been predicted [20, 29, 30, 32-44] and have been experimentally observedvia techniques such as ellipsometry and video microscopy [18,45-47]. Two particles thatdeform the air-water surface will move along the interface to overlap their deformationsand thus minimize total system (particles plus interface) energy. This preference at theinterface effectively produces a strong interparticle attraction, which has been measuredto be hundreds of thousands times greater than thermal energy for micron size parti-cles [19,24].
The interfacial deformations can be understood from expanded solutions of the Young-Laplace equation [20, 29, 30, 32-44, 48, 49]. The Young-Laplace equation minimizes theenergy associated with a surface, and thus relates the pressure difference across thesurface to the curvature of the surface. Specifically, the Young-Laplace equation is aforce balance statement: γH = pair − pwater, where γ is surface tension, H is meancurvature of the interface, pair is the pressure in the air, and pwater is the pressure in thewater [32]. For length scales smaller than the capillary length (i.e., the length scale atwhich the Laplace pressure from surface tension is equal to the hydrostatic pressure dueto gravity, 2 mm for water), gravitational effects can be ignored, and the pressure dropacross the surface is zero, implying that the mean curvature everywhere is zero. Themean curvature can be expressed as H = Δh, where Δ is the Laplacian and h is theheight of the surface. Thus, Δh = 0.
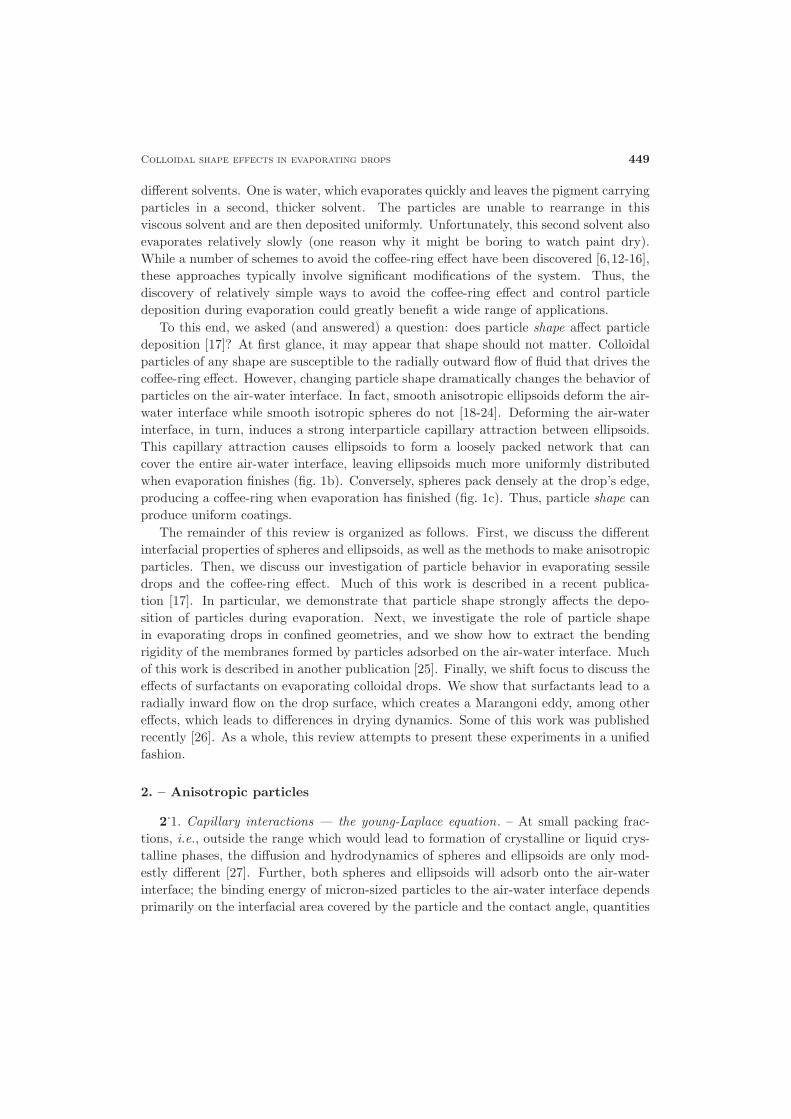
When a particle attaches to the air-water interface, boundary conditions are createdfor the air-water interface. Theoretically, one seeks to solve the Young-Laplace equationwith these boundary conditions. In this case, it is useful to first rewrite the Young-Laplaceequation in polar coordinates, Δh(r, φ) = (r−1∂rr∂r + r−2∂2
φ)h(r, φ) = 0 (see fig. 2a-c).This problem is similar to potential problems in electrostatics and can be solved byseparation of variables, i.e., with the ansatz h(r, φ) = R(r)Φ(φ). Substitution for h(r, φ)leads to ((r−1∂rr∂rR(r))Φ(φ)+(r−2∂2
φΦ(φ))R(r)) = 0. Since this equation must hold as r
and φ are varied independently, each term in the equation must equal the same constant,which is leadingly termed m2. Thus, ∂2
φΦ(φ) = m2Φ(φ) and r∂rr∂rR(r) = m2R(r),with solutions Φ = Am cos(m(φ − Bm)) and R = Cmr−m, where Am, Bm, and Cm aredetermined by boundary conditions.
The monopole term m = 0 is only non-zero when the height of the interface near theparticle is uniformly lowered (or raised) (fig. 2c). The monopole term is only stable forthe particle in an external field (e.g., gravity); however, for typical colloidal particles thegravitational buoyancy forces are not significant and this term is zero. The dipole termm = 1 corresponds to a situation wherein the height of the interface is lower on one sideof the particle compared to the opposite side (fig. 2d). Thus, this situation can be quicklyrelaxed by rotating the particle, i.e., lowering the interface on the high side and raising iton the low side. The dipole term is only stable when an external torque is applied; since
no external torques act on the particles, this term also is zero. Therefore, the lowestallowed term is the quadrupole term (m = 2), i.e., h(r, φ) ≈ A2 cos(2(φ − B2))C2r
−2
(fig. 2e).Notice that this derivation has not mentioned anisotropic boundary conditions. In
fact, the quadruploar form for h(r, φ) is applicable in general to any deformation of theair-water interface (absent external forces and torques) that arises at the particle surface.The air-water interface can be deformed on a sphere, if the three-phase contact line isheterogeneously pinned (see fig. 2f) [32,50-54]. This effect produces a quadrupolar profileof the interfacial height. However, the linear size of deformation, i.e., Δh, the maximumvalue of h minus the minimum value of h, from contact-line-roughness is typically muchsmaller than the linear size of the deformation from shape-based-roughness (for example,see ref. [24]). Of course, if one applies Young’s conditions for the three-phase contactline on the solid particle, one “ideally” obtains a circle contact line on the sphere anda much more complicated shape on an anisotropic particle such as an ellipsoid. On theellipsoid, this leads to height variations of h(r, φ) that are of order the particle size.
452 P. J. Yunker, T. Still and A. G. Yodh
The interaction potential between two particles is related to the excess surface areacreated by these deformations [32]. For a single particle (i), the deformation energy isUi = γδAi, where δAi is the excess surface area due to interfacial deformation, which isproportional to the deformation size squared, i.e., δAi ∝ Δh2 The interaction energy oftwo particles (i, j) is Uij = γδ(Aij − Ai − Aj), where Aij is the excess surface area dueto both particle i and particle j (which is dependent on the particle positions and orien-tations), and Ai and Aj are the excess areas due to particle i and j alone. For smoothspheres Aij = Ai + Aj , since the interface is not significantly deformed, so Uij ≈ 0. Forellipsoids (or rough spheres), Uij ≈ −12Ui cos[2(φi − φj)]r−4, where φi and φj are theangular orientations of ellipsoids i and j. The attractive strength decays as r−4 and de-pends on the coefficient term Ui, which, in turn, depends on the deformation size squared,i.e., Ui ∝ Δh2. Thus, the strength of this attraction ultimately depends strongly on thesize of the deformation at the surface of the particle. For example, 1 micron diameterparticles that induce interfacial deformations of Δh = 100 nm and an interparticleseparation of 2 microns will produce an attraction with strength Uij ≈ 2 × 10⁵kT . Formicron-sized ellipsoids, the binding energy from capillary attraction is ∼ 105kBT [19,24].
To summarize, spheres and ellipsoids behave similarly in bulk fluid and are boundto the air water interface by similarly large binding energies. However, on the air-water interface their behavior is dramatically different. Anisotropic particles deformthe air-water interface, producing a quadrupolar attraction that is energetically strong(∼ 105kBT ).
2.2. Particle synthesis. – To understand how particle shape impacts particle deposi-tion, we need particles with different shapes. We utilize micron-sized polystyrene spheres(Invitrogen), similar to the particles used in previous experiments (e.g., [3]), and wesimply modify their shape by stretching them asymmetrically to different aspect ra-tios [55,56]. The procedures to make particles have been described previously [17,55,56],but for completeness we briefly discuss these methodologies below.
To create ellipsoidal particles, 1.3 μm diameter polystyrene particles are suspendedin a polyvinyl alcohol (PVA) gel and are heated above the polystyrene melting point(∼ 100 ◦C), but below the PVA melting point (∼ 180 ◦C) [55, 56]. Polystyrene melts inthe process, but the PVA gel only softens. The PVA gel is then pulled so that the sphericalcavities containing liquid polystyrene are stretched into ellipsoidal cavities. When thePVA gel cools, polystyrene solidifies in the distorted cavities and becomes frozen intoan ellipsoidal shape. The hardened gel dissolves in water, and the PVA is removed viacentrifugation. Each sample is centrifuged and washed with water at least 10 times.
Each iteration of this process creates ∼ 109 ellipsoidal particles in ∼ 50 μl suspensions.The particles are charge-stabilized, and the resultant suspensions are surfactant-free.Snapshots of experimental particles are shown in the insets of fig. 1b,c. The aspectratio polydispersity is ∼ 10%. To ensure the preparation process does not affect particledeposition, our spheres undergo the same procedure, absent stretching.
Importantly, in order to ensure the PVA was not affecting our results, we performeda separate set of experiments investigating the effects of PVA on evaporating drops. In
Colloidal shape effects in evaporating drops 453
a b
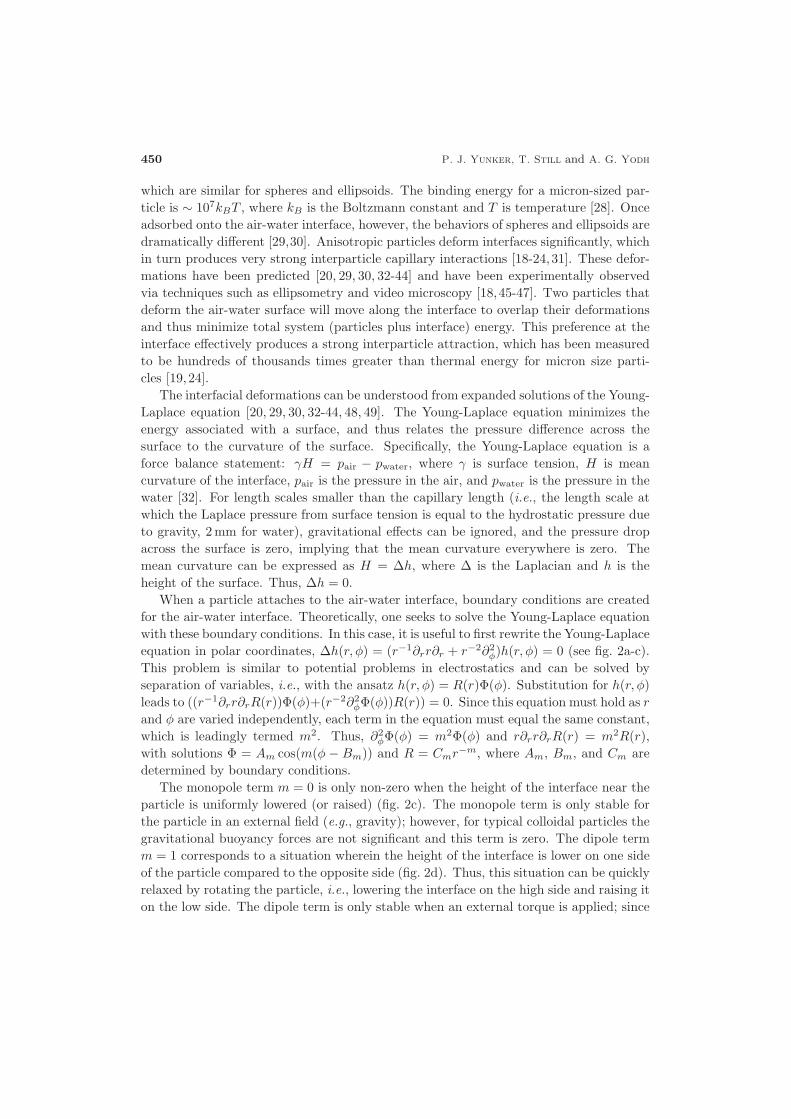
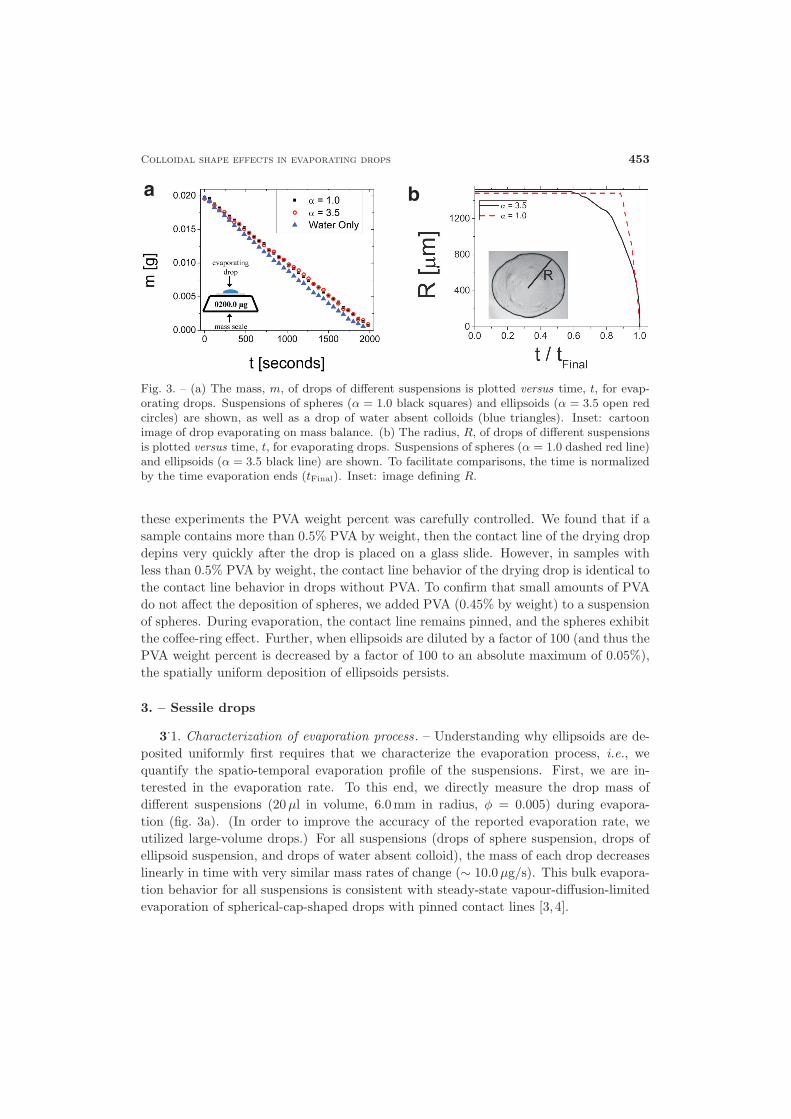
Fig. 3. – (a) The mass, m, of drops of different suspensions is plotted versus time, t, for evap-orating drops. Suspensions of spheres (α = 1.0 black squares) and ellipsoids (α = 3.5 open redcircles) are shown, as well as a drop of water absent colloids (blue triangles). Inset: cartoonimage of drop evaporating on mass balance. (b) The radius, R, of drops of different suspensionsis plotted versus time, t, for evaporating drops. Suspensions of spheres (α = 1.0 dashed red line)and ellipsoids (α = 3.5 black line) are shown. To facilitate comparisons, the time is normalizedby the time evaporation ends (tFinal). Inset: image defining R.
these experiments the PVA weight percent was carefully controlled. We found that if asample contains more than 0.5% PVA by weight, then the contact line of the drying dropdepins very quickly after the drop is placed on a glass slide. However, in samples withless than 0.5% PVA by weight, the contact line behavior of the drying drop is identical tothe contact line behavior in drops without PVA. To confirm that small amounts of PVAdo not affect the deposition of spheres, we added PVA (0.45% by weight) to a suspensionof spheres. During evaporation, the contact line remains pinned, and the spheres exhibitthe coffee-ring effect. Further, when ellipsoids are diluted by a factor of 100 (and thus thePVA weight percent is decreased by a factor of 100 to an absolute maximum of 0.05%),the spatially uniform deposition of ellipsoids persists.
3. – Sessile drops
3.1. Characterization of evaporation process. – Understanding why ellipsoids are de-posited uniformly first requires that we characterize the evaporation process, i.e., wequantify the spatio-temporal evaporation profile of the suspensions. First, we are in-terested in the evaporation rate. To this end, we directly measure the drop mass ofdifferent suspensions (20 μl in volume, 6.0 mm in radius, φ = 0.005) during evapora-tion (fig. 3a). (In order to improve the accuracy of the reported evaporation rate, weutilized large-volume drops.) For all suspensions (drops of sphere suspension, drops ofellipsoid suspension, and drops of water absent colloid), the mass of each drop decreaseslinearly in time with very similar mass rates of change (∼ 10.0 μg/s). This bulk evapora-tion behavior for all suspensions is consistent with steady-state vapour-diffusion-limitedevaporation of spherical-cap-shaped drops with pinned contact lines [3, 4].
454 P. J. Yunker, T. Still and A. G. Yodh
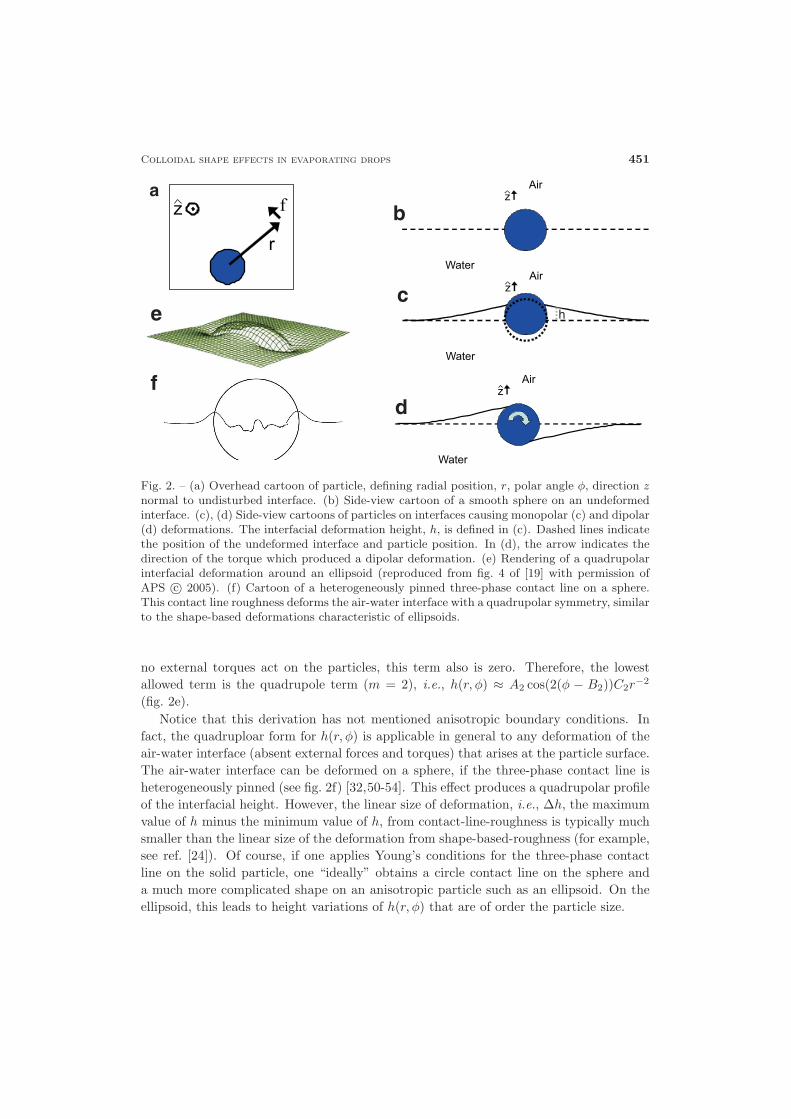
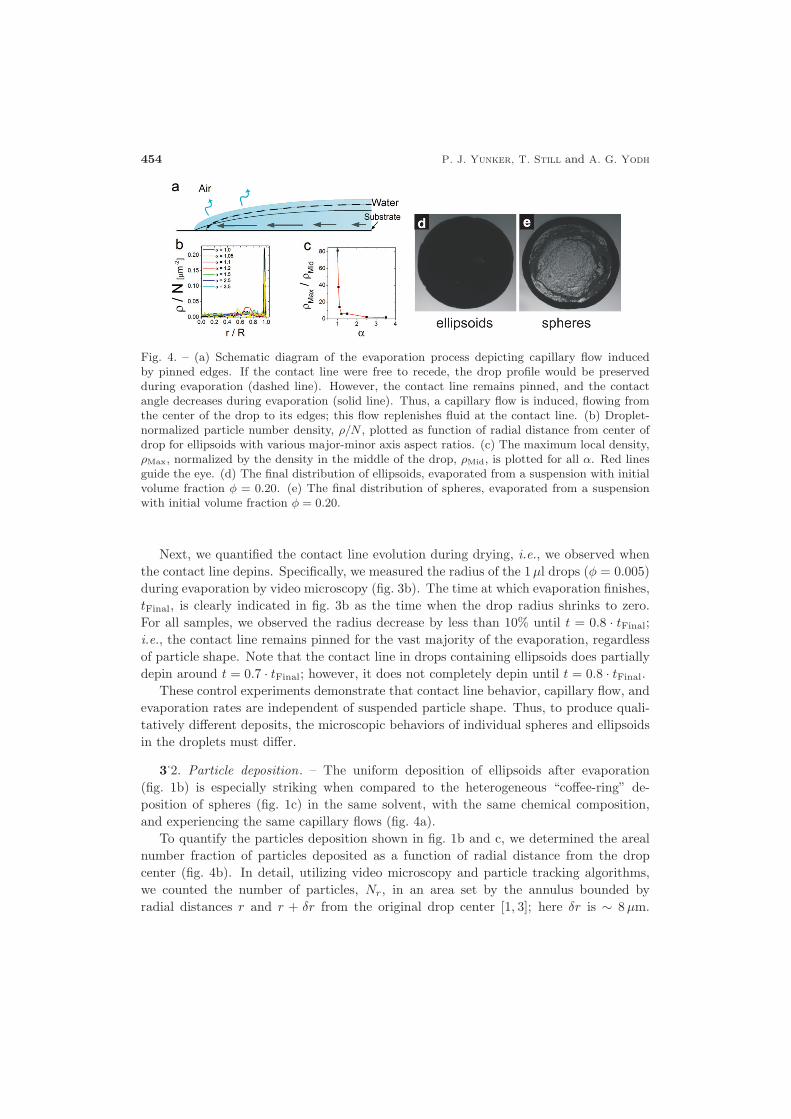
Fig. 4. – (a) Schematic diagram of the evaporation process depicting capillary flow inducedby pinned edges. If the contact line were free to recede, the drop profile would be preservedduring evaporation (dashed line). However, the contact line remains pinned, and the contactangle decreases during evaporation (solid line). Thus, a capillary flow is induced, flowing fromthe center of the drop to its edges; this flow replenishes fluid at the contact line. (b) Droplet-normalized particle number density, ρ/N , plotted as function of radial distance from center ofdrop for ellipsoids with various major-minor axis aspect ratios. (c) The maximum local density,ρMax, normalized by the density in the middle of the drop, ρMid, is plotted for all α. Red linesguide the eye. (d) The final distribution of ellipsoids, evaporated from a suspension with initialvolume fraction φ = 0.20. (e) The final distribution of spheres, evaporated from a suspensionwith initial volume fraction φ = 0.20.
Next, we quantified the contact line evolution during drying, i.e., we observed whenthe contact line depins. Specifically, we measured the radius of the 1μl drops (φ = 0.005)during evaporation by video microscopy (fig. 3b). The time at which evaporation finishes,tFinal, is clearly indicated in fig. 3b as the time when the drop radius shrinks to zero.For all samples, we observed the radius decrease by less than 10% until t = 0.8 · tFinal;i.e., the contact line remains pinned for the vast majority of the evaporation, regardlessof particle shape. Note that the contact line in drops containing ellipsoids does partiallydepin around t = 0.7 · tFinal; however, it does not completely depin until t = 0.8 · tFinal.
These control experiments demonstrate that contact line behavior, capillary flow, andevaporation rates are independent of suspended particle shape. Thus, to produce quali-tatively different deposits, the microscopic behaviors of individual spheres and ellipsoidsin the droplets must differ.
3.2. Particle deposition. – The uniform deposition of ellipsoids after evaporation(fig. 1b) is especially striking when compared to the heterogeneous “coffee-ring” de-position of spheres (fig. 1c) in the same solvent, with the same chemical composition,and experiencing the same capillary flows (fig. 4a).
To quantify the particles deposition shown in fig. 1b and c, we determined the arealnumber fraction of particles deposited as a function of radial distance from the dropcenter (fig. 4b). In detail, utilizing video microscopy and particle tracking algorithms,we counted the number of particles, Nr, in an area set by the annulus bounded byradial distances r and r + δr from the original drop center [1, 3]; here δr is ∼ 8 μm.
Colloidal shape effects in evaporating drops 455
The areal particle density ρ(r) = Nr/A, with A = π((r + δr)2 − r2). To facilitatecomparisons between different samples, and eliminate small sample-to-sample particledensity differences, we normalized ρ by the total number of particles in the drop, N .Further, to we report ρ(r)/N as a function of r/R, where R is the drop radius, to eliminatesmall sample-to-sample differences in drop radii. Dilute suspensions (φ = 0.005) areutilized to improve image quantification. For spheres (α = 1.0), ρ/N is ∼ 70 timeslarger at r/R ≈ 1 than in the middle of the drop. Conversely, the density profile ofellipsoidal particles is fairly uniform as a function of r/R (there is a slight increase atlarge r/R). As particle shape anisotropy is increased from α = 1.0 to 3.5, the peak inρ(r)/N at large r/R decreases. The coffee-ring effect persists for particles marginallydistorted from their original spherical shape (α = 1.05 and 1.1), but particles that areslightly more anisotropic (α = 1.2) are deposited more uniformly.
To further quantify the sharply peaked coffee-ring effect of spheres and the muchmore uniform deposition of the ellipsoids, we calculate and plot ρMax/ρMid (fig. 4c),where ρMax is the maximum value of ρ (typically located at r/R ≈ 1) and ρMid is theaverage value of ρ in the middle of the drop (r/R < 0.25). For spheres, ρMax/ρMid ≈ 70.As aspect ratio increases slightly (α = 1.05 and 1.1) ρMax/ρMid decreases to ∼ 38 and13, respectively. For ellipsoids, ρMax/ρMid is more than ten times smaller than spheres.As α continues to increase above 1.2, ρMax/ρMid continues to decrease, albeit at a muchlower rate. Note that ρMax/ρMid was observed to be largely independent of initial volumefraction, i.e., ρMax/ρMid fluctuated by approximately ±10% as volume fraction changedbetween φ = 10−4 and 0.2.
When drops with very large packing fractions evaporate, the drop surface becomessaturated with ellipsoids. However, deposition in this limit is difficult to quantify, as athigh volume fractions it is difficult to measure the local particle density. Thus, whilethe particles that cannot attach to the interface are likely transported to the drop edge,it is difficult to demonstrate that this effect occurs. An experimental snapshot afterevaporation of a drop of ellipsoids (α = 3.5) initially suspended at volume fractionφ = 0.20 shows that overall the coffee-ring effect is avoided, but the local density cannotbe extracted (fig. 4d and e). An image of the final distribution of spheres evaporatedfrom a suspension with initial packing fraction φ = 0.20 is included for comparison.
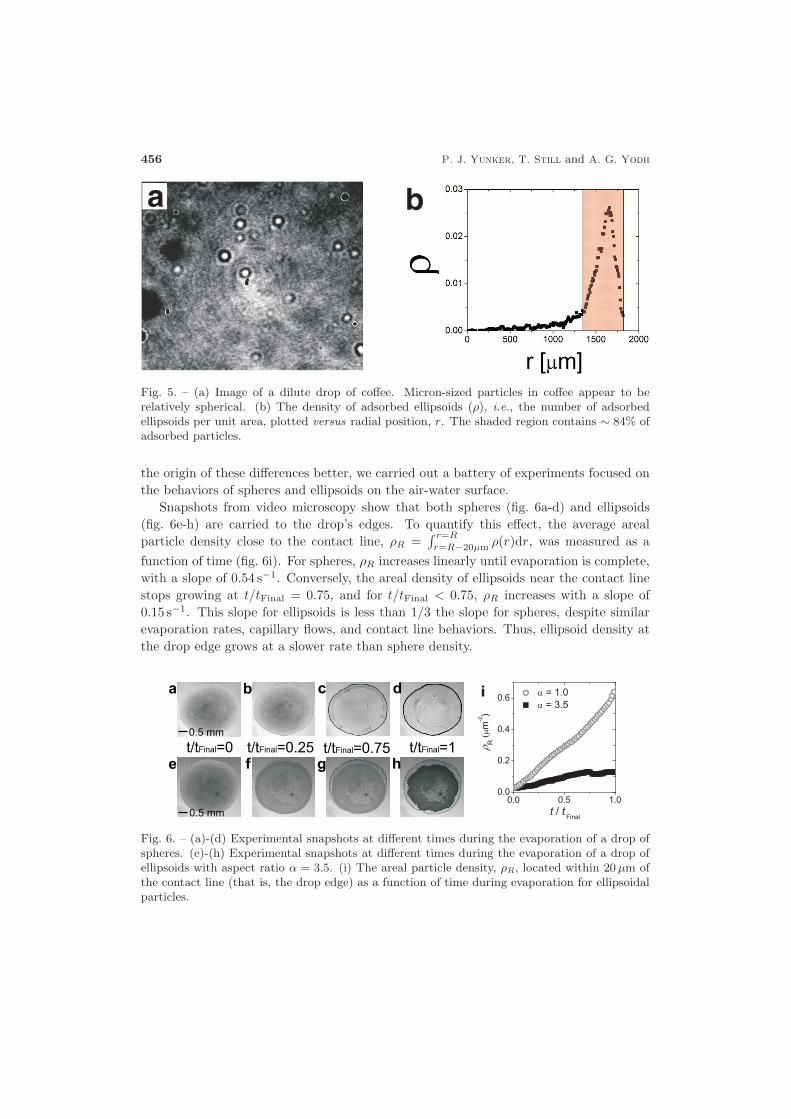
3.3. Real coffee. – Our observations thus far imply that micron-sized grains in a cupof coffee are relatively spherical. To confirm or refute this hypothesis, we prepared amicroscope slide full of diluted coffee. This coffee came from the lab-building coffee ma-chine (FilterFresh), which passes through a paper filter after a relatively short brew time(∼ 30 seconds). While we did not “fully” characterize the shape of the grains we ob-served, qualitatively, they appeared spherical on the micron-size scale (see fig. 5a). Thus,a suspension of polystyrene spheres really is an especially good model of a cup of coffee.
3.4. Interface adsorption profiles. – The evidence suggests that the same radiallyoutward flows are present in drops containing either spheres or ellipsoids. The depositionof spheres and ellipsoids after drying, however, is very different. In order to understand
456 P. J. Yunker, T. Still and A. G. Yodh
a b
Fig. 5. – (a) Image of a dilute drop of coffee. Micron-sized particles in coffee appear to berelatively spherical. (b) The density of adsorbed ellipsoids (ρ), i.e., the number of adsorbedellipsoids per unit area, plotted versus radial position, r. The shaded region contains ∼ 84% ofadsorbed particles.
the origin of these differences better, we carried out a battery of experiments focused onthe behaviors of spheres and ellipsoids on the air-water surface.
Snapshots from video microscopy show that both spheres (fig. 6a-d) and ellipsoids(fig. 6e-h) are carried to the drop’s edges. To quantify this effect, the average arealparticle density close to the contact line, ρR =
∫ r=R
r=R−20μmρ(r)dr, was measured as a
function of time (fig. 6i). For spheres, ρR increases linearly until evaporation is complete,with a slope of 0.54 s−1. Conversely, the areal density of ellipsoids near the contact linestops growing at t/tFinal = 0.75, and for t/tFinal < 0.75, ρR increases with a slope of0.15 s−1. This slope for ellipsoids is less than 1/3 the slope for spheres, despite similarevaporation rates, capillary flows, and contact line behaviors. Thus, ellipsoid density atthe drop edge grows at a slower rate than sphere density.
Fig. 6. – (a)-(d) Experimental snapshots at different times during the evaporation of a drop ofspheres. (e)-(h) Experimental snapshots at different times during the evaporation of a drop ofellipsoids with aspect ratio α = 3.5. (i) The areal particle density, ρR, located within 20 μm ofthe contact line (that is, the drop edge) as a function of time during evaporation for ellipsoidalparticles.
Colloidal shape effects in evaporating drops 457
a bα = 1.0 = 3.5α
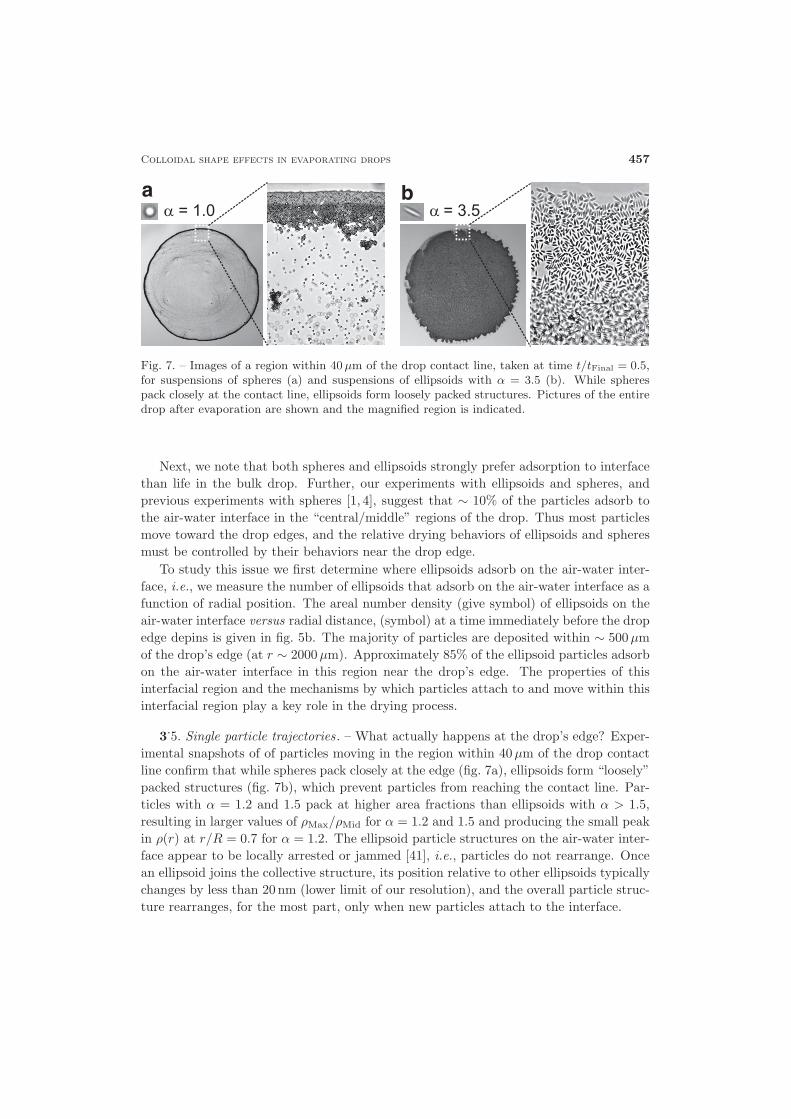
Fig. 7. – Images of a region within 40 μm of the drop contact line, taken at time t/tFinal = 0.5,for suspensions of spheres (a) and suspensions of ellipsoids with α = 3.5 (b). While spherespack closely at the contact line, ellipsoids form loosely packed structures. Pictures of the entiredrop after evaporation are shown and the magnified region is indicated.
Next, we note that both spheres and ellipsoids strongly prefer adsorption to interfacethan life in the bulk drop. Further, our experiments with ellipsoids and spheres, andprevious experiments with spheres [1, 4], suggest that ∼ 10% of the particles adsorb tothe air-water interface in the “central/middle” regions of the drop. Thus most particlesmove toward the drop edges, and the relative drying behaviors of ellipsoids and spheresmust be controlled by their behaviors near the drop edge.
To study this issue we first determine where ellipsoids adsorb on the air-water inter-face, i.e., we measure the number of ellipsoids that adsorb on the air-water interface as afunction of radial position. The areal number density (give symbol) of ellipsoids on theair-water interface versus radial distance, (symbol) at a time immediately before the dropedge depins is given in fig. 5b. The majority of particles are deposited within ∼ 500 μmof the drop’s edge (at r ∼ 2000 μm). Approximately 85% of the ellipsoid particles adsorbon the air-water interface in this region near the drop’s edge. The properties of thisinterfacial region and the mechanisms by which particles attach to and move within thisinterfacial region play a key role in the drying process.
3.5. Single particle trajectories. – What actually happens at the drop’s edge? Exper-imental snapshots of of particles moving in the region within 40μm of the drop contactline confirm that while spheres pack closely at the edge (fig. 7a), ellipsoids form “loosely”packed structures (fig. 7b), which prevent particles from reaching the contact line. Par-ticles with α = 1.2 and 1.5 pack at higher area fractions than ellipsoids with α > 1.5,resulting in larger values of ρMax/ρMid for α = 1.2 and 1.5 and producing the small peakin ρ(r) at r/R = 0.7 for α = 1.2. The ellipsoid particle structures on the air-water inter-face appear to be locally arrested or jammed [41], i.e., particles do not rearrange. Oncean ellipsoid joins the collective structure, its position relative to other ellipsoids typicallychanges by less than 20 nm (lower limit of our resolution), and the overall particle struc-ture rearranges, for the most part, only when new particles attach to the interface.
458 P. J. Yunker, T. Still and A. G. Yodh
a b
c d
e
f
h I
j
g
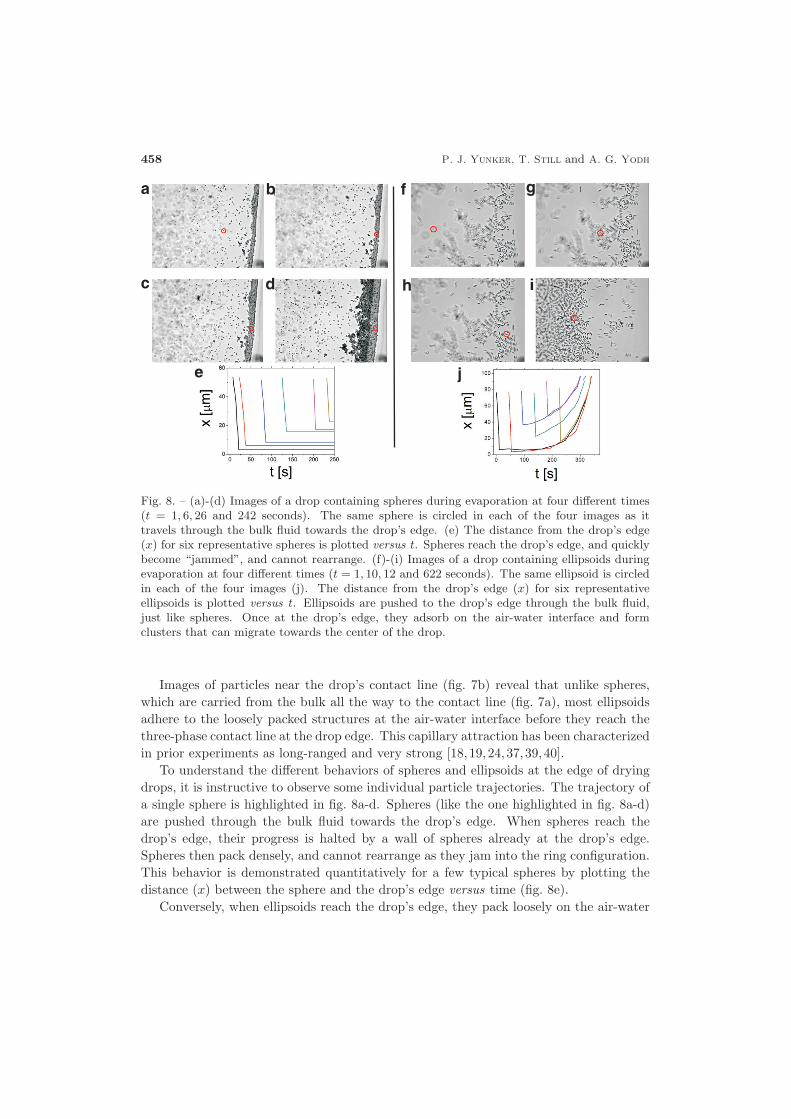
Fig. 8. – (a)-(d) Images of a drop containing spheres during evaporation at four different times(t = 1, 6, 26 and 242 seconds). The same sphere is circled in each of the four images as ittravels through the bulk fluid towards the drop’s edge. (e) The distance from the drop’s edge(x) for six representative spheres is plotted versus t. Spheres reach the drop’s edge, and quicklybecome “jammed”, and cannot rearrange. (f)-(i) Images of a drop containing ellipsoids duringevaporation at four different times (t = 1, 10, 12 and 622 seconds). The same ellipsoid is circledin each of the four images (j). The distance from the drop’s edge (x) for six representativeellipsoids is plotted versus t. Ellipsoids are pushed to the drop’s edge through the bulk fluid,just like spheres. Once at the drop’s edge, they adsorb on the air-water interface and formclusters that can migrate towards the center of the drop.
Images of particles near the drop’s contact line (fig. 7b) reveal that unlike spheres,which are carried from the bulk all the way to the contact line (fig. 7a), most ellipsoidsadhere to the loosely packed structures at the air-water interface before they reach thethree-phase contact line at the drop edge. This capillary attraction has been characterizedin prior experiments as long-ranged and very strong [18,19,24,37,39,40].
To understand the different behaviors of spheres and ellipsoids at the edge of dryingdrops, it is instructive to observe some individual particle trajectories. The trajectory ofa single sphere is highlighted in fig. 8a-d. Spheres (like the one highlighted in fig. 8a-d)are pushed through the bulk fluid towards the drop’s edge. When spheres reach thedrop’s edge, their progress is halted by a wall of spheres already at the drop’s edge.Spheres then pack densely, and cannot rearrange as they jam into the ring configuration.This behavior is demonstrated quantitatively for a few typical spheres by plotting thedistance (x) between the sphere and the drop’s edge versus time (fig. 8e).
Conversely, when ellipsoids reach the drop’s edge, they pack loosely on the air-water
Colloidal shape effects in evaporating drops 459
interface (fig. 8f-i). Notice, ellipsoids at the drop’s edge do not necessarily halt theprogress of other migrating ellipsoids that arrive at later times. This can be seen infig. 8f-h, as an ellipsoid approaches the drop’s edge (fig. 8f), passes underneath a clusterof ellipsoids on the air-water interface (fig. 8g), and eventually adsorbs on the air-waterinterface near the drop’s edge (fig. 8h). As evaporation continues, ellipsoids can movealong the surface of the drop towards the drop’s center (fig. 8i). This behavior is demon-strated quantitatively for a few typical ellipsoids by plotting x versus time (fig. 8j). Ifthe air-water interface is not saturated with ellipsoids when the drop’s edge depins, thenthe networks of ellipsoids are compressed as they are pushed towards the drop’s center.
3.6. Interface resistance to shear . – The loosely packed configurations formed byellipsoids on the interface are structurally similar to those seen in previous experimentsof ellipsoids at flat air-water and water-oil interfaces [18,19,22]. They produce a surfaceviscosity that is much larger than the suspension bulk viscosity, facilitating ellipsoidresistance to radially outward flows in the bulk. Note that spheres also adsorb onto theinterface during evaporation. However, spheres do not strongly deform the interface [18],and they experience a much weaker interparticle attraction than ellipsoids [24]; therefore,the radially outward fluid flows in the bulk and interface easily push spheres to the drop’sedge [1].
In order to quantify the ability of interfacial aggregates of ellipsoids to resist bulkflow, we calculated the Boussinesq number, B0, for ellipsoids with α = 3.5. Specifically,B0 is the ratio of the surface drag to the bulk drag: B0 = G′
τL where τ is shear stressfrom bulk flow, G′ is the elastic modulus of the interfacial layer, and L is the probedlengthscale [57]. B0 varies spatially with the average areal particle density on the air-water interface. Here, we calculate B0 in a region within 40μm of the pinned contactline.
We first calculated B0 at an early time (t = 0.1tF ). The shear stress can be calculatedfrom the particle velocity and drop height via τ ≈ μv/L, where τ is shear stress, μ isviscosity, and L is the drop height. At an early time (t = 0.1tF ) τ ≈ 3 · 10−4 Pa. About40% of the surface is covered with ellipsoids. Previous experimental studies measuredthe shear modulus, G′, of the interfacial monolayer as a function of surface coveragearea fraction [22]. We measured the surface coverage area fraction in our system as afunction of time. This measurement enabled us to utilize the values of G′ reported in [22](G′ ≈ 10−3 N/m). The probed lengthscale, L, is at most 0.01 m (i.e., the drop diameter).Thus, at t = 0.1tF , B0 ∼ 300. This calculation is performed at different times duringevaporation, until the final stage of evaporation when the aggregate of ellipsoids beginsflowing towards the drop center (fig. 9a). We found that τ grows linearly with particlevelocity, which we observe to increase by a factor of ∼ 2 during evaporation. However,G′ grows exponentially with the ellipsoidal area fraction [22], and area fraction increasesby a factor of ∼ 3. Thus, the exponential growth of G′ dominates this calculation,and B0 grows exponentially with time: B0 ∝ exp( t
0.12tF). Finally, note that for spheres,
B0 < 1. Thus, the measured dimensionless Boussinesq number clearly demonstrates thatclusters of ellipsoids on the air-water interface can resist shear from radially outward fluid
460 P. J. Yunker, T. Still and A. G. Yodh
a b
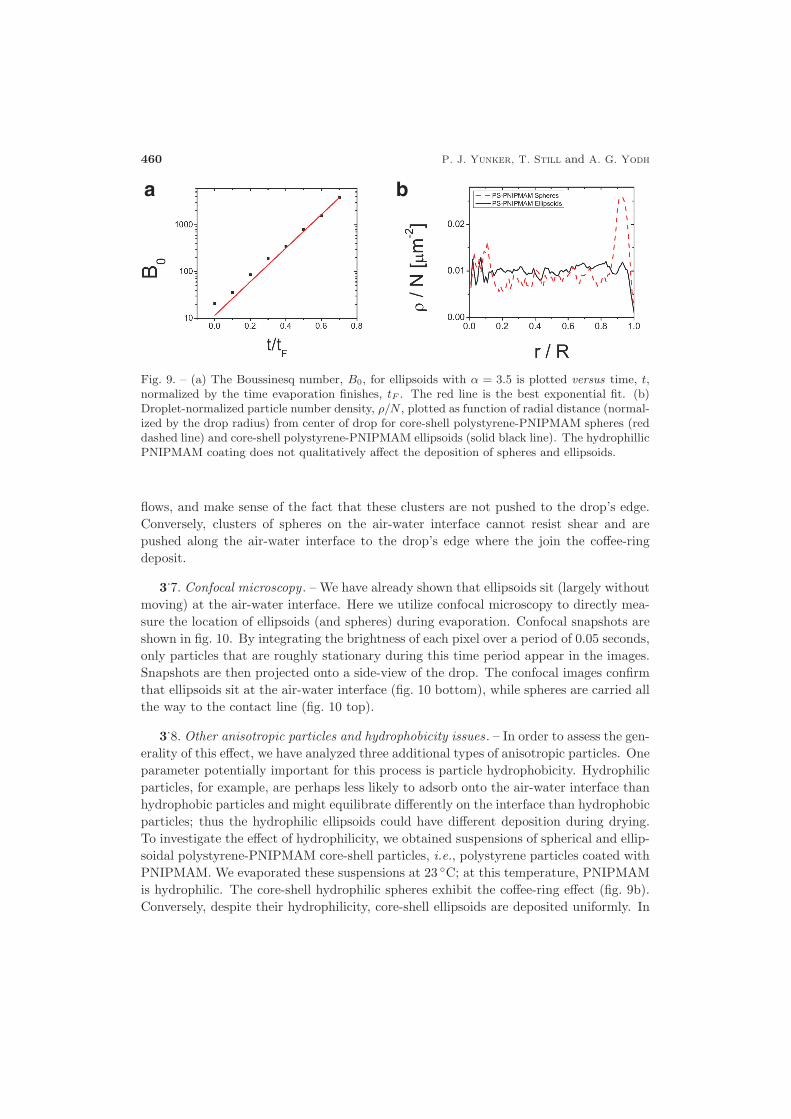
Fig. 9. – (a) The Boussinesq number, B0, for ellipsoids with α = 3.5 is plotted versus time, t,normalized by the time evaporation finishes, tF . The red line is the best exponential fit. (b)Droplet-normalized particle number density, ρ/N , plotted as function of radial distance (normal-ized by the drop radius) from center of drop for core-shell polystyrene-PNIPMAM spheres (reddashed line) and core-shell polystyrene-PNIPMAM ellipsoids (solid black line). The hydrophillicPNIPMAM coating does not qualitatively affect the deposition of spheres and ellipsoids.
flows, and make sense of the fact that these clusters are not pushed to the drop’s edge.Conversely, clusters of spheres on the air-water interface cannot resist shear and arepushed along the air-water interface to the drop’s edge where the join the coffee-ringdeposit.
3.7. Confocal microscopy . – We have already shown that ellipsoids sit (largely withoutmoving) at the air-water interface. Here we utilize confocal microscopy to directly mea-sure the location of ellipsoids (and spheres) during evaporation. Confocal snapshots areshown in fig. 10. By integrating the brightness of each pixel over a period of 0.05 seconds,only particles that are roughly stationary during this time period appear in the images.Snapshots are then projected onto a side-view of the drop. The confocal images confirmthat ellipsoids sit at the air-water interface (fig. 10 bottom), while spheres are carried allthe way to the contact line (fig. 10 top).
3.8. Other anisotropic particles and hydrophobicity issues. – In order to assess the gen-erality of this effect, we have analyzed three additional types of anisotropic particles. Oneparameter potentially important for this process is particle hydrophobicity. Hydrophilicparticles, for example, are perhaps less likely to adsorb onto the air-water interface thanhydrophobic particles and might equilibrate differently on the interface than hydrophobicparticles; thus the hydrophilic ellipsoids could have different deposition during drying.To investigate the effect of hydrophilicity, we obtained suspensions of spherical and ellip-soidal polystyrene-PNIPMAM core-shell particles, i.e., polystyrene particles coated withPNIPMAM. We evaporated these suspensions at 23 ◦C; at this temperature, PNIPMAMis hydrophilic. The core-shell hydrophilic spheres exhibit the coffee-ring effect (fig. 9b).Conversely, despite their hydrophilicity, core-shell ellipsoids are deposited uniformly. In
Colloidal shape effects in evaporating drops 461
spheres
ellipsoids
Fig. 10. – Confocal projections of suspension of spheres (top) and ellipsoids with α = 2.5(bottom) onto the z-r plane in cylindrical coordinates. While spheres are efficiently transportedto the contact line, ellipsoids sit at the air-water interface.
fact, these core-shell ellipsoids form the same type of loosely packed ellipsoid networkson the drop surface as polystyrene ellipsoids absent PNIPMAM (fig. 9b).
Further, we have evaporated suspensions of actin filaments and Pf1 viruses. In eachof these suspensions, the contact line depins at very early times. To prevent this earlydepinning, we add a small amount of 50 nm diameter fluorescent polystyrene spheres(∼ 1% by weight); these spheres help to pin the contact line until the final stage ofevaporation (t > 0.8tF ) via self-pinning [4]. The spheres in each suspension exhibit thecoffee-ring effect. Both the actin filaments and Pf1 viruses in suspension, however, aredeposited relatively uniformly. (Note that the mean major axis length for Pf1 virusesis ∼ 2 μm; the mean minor axis length for Pf1 viruses is ∼ 6 nm. The mean major axislength for actin filaments is ∼ 20 μm; the mean minor axis length for actin filaments is∼ 20 nm).
3.9. Mixtures of spheres and ellipsoids. – Lastly, we investigate the effects of mixingellipsoids and spheres. A small number of ellipsoids were added to suspensions of differentsized spheres. We then evaporate drops of suspensions containing both ellipsoids andspheres. Our initial hope was that a small number of ellipsoids could dramatically changethe deposition behavior of spheres in suspension.
To simplify this study, we concentrated on two different aspect ratios: spheres (α =1.0) and ellipsoids (α = 3.5). The ellipsoids were stretched from particles of diameterd = 1.3 μm; each suspension contains spheres suspended at a volume fraction φ = 0.02.
462 P. J. Yunker, T. Still and A. G. Yodh
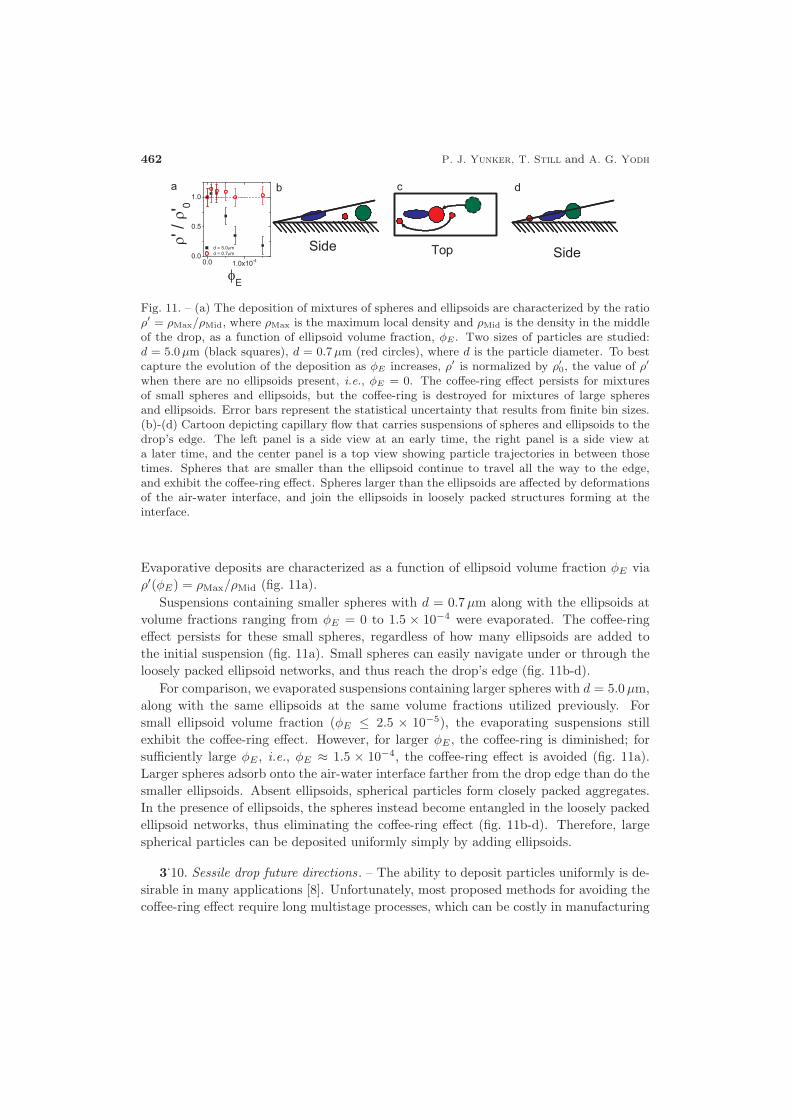
Fig. 11. – (a) The deposition of mixtures of spheres and ellipsoids are characterized by the ratioρ′ = ρMax/ρMid, where ρMax is the maximum local density and ρMid is the density in the middleof the drop, as a function of ellipsoid volume fraction, φE . Two sizes of particles are studied:d = 5.0 μm (black squares), d = 0.7 μm (red circles), where d is the particle diameter. To bestcapture the evolution of the deposition as φE increases, ρ′ is normalized by ρ′
0, the value of ρ′
when there are no ellipsoids present, i.e., φE = 0. The coffee-ring effect persists for mixturesof small spheres and ellipsoids, but the coffee-ring is destroyed for mixtures of large spheresand ellipsoids. Error bars represent the statistical uncertainty that results from finite bin sizes.(b)-(d) Cartoon depicting capillary flow that carries suspensions of spheres and ellipsoids to thedrop’s edge. The left panel is a side view at an early time, the right panel is a side view ata later time, and the center panel is a top view showing particle trajectories in between thosetimes. Spheres that are smaller than the ellipsoid continue to travel all the way to the edge,and exhibit the coffee-ring effect. Spheres larger than the ellipsoids are affected by deformationsof the air-water interface, and join the ellipsoids in loosely packed structures forming at theinterface.
Evaporative deposits are characterized as a function of ellipsoid volume fraction φE viaρ′(φE) = ρMax/ρMid (fig. 11a).
Suspensions containing smaller spheres with d = 0.7 μm along with the ellipsoids atvolume fractions ranging from φE = 0 to 1.5 × 10⁻⁴ were evaporated. The coffee-ringeffect persists for these small spheres, regardless of how many ellipsoids are added tothe initial suspension (fig. 11a). Small spheres can easily navigate under or through theloosely packed ellipsoid networks, and thus reach the drop’s edge (fig. 11b-d).
For comparison, we evaporated suspensions containing larger spheres with d = 5.0 μm,along with the same ellipsoids at the same volume fractions utilized previously. Forsmall ellipsoid volume fraction (φE ≤ 2.5 × 10⁻⁵), the evaporating suspensions stillexhibit the coffee-ring effect. However, for larger φE , the coffee-ring is diminished; forsufficiently large φE , i.e., φE ≈ 1.5 × 10⁻⁴, the coffee-ring effect is avoided (fig. 11a).Larger spheres adsorb onto the air-water interface farther from the drop edge than do thesmaller ellipsoids. Absent ellipsoids, spherical particles form closely packed aggregates.In the presence of ellipsoids, the spheres instead become entangled in the loosely packedellipsoid networks, thus eliminating the coffee-ring effect (fig. 11b-d). Therefore, largespherical particles can be deposited uniformly simply by adding ellipsoids.
3.10. Sessile drop future directions. – The ability to deposit particles uniformly is de-sirable in many applications [8]. Unfortunately, most proposed methods for avoiding thecoffee-ring effect require long multistage processes, which can be costly in manufacturing
Colloidal shape effects in evaporating drops 463
or require use of organic solvents which are sometimes flammable and toxic (e.g. [6,12]).Here we have shown that by exploiting a particle’s shape, a uniform deposit can be easilyderived from an evaporating aqueous solution. The results presented here further suggestthat other methods of inducing strong capillary interactions, e.g., surface roughness [32],may also produce uniform deposits.
Additionally, open questions about the behavior of ellipsoids in drying drops persist.Specifically, one may have thought the drop’s edge would quickly saturate with ellipsoidsduring evaporation, and ellipsoids subsequently arriving would then be deposited in acoffee-ring stain. However, ellipsoids (and their collective structures) clearly migratetowards the drop’s center during evaporation, in the process creating room for moreellipsoids to adsorb on the air-water interface near the drop’s edge. It is unclear whyellipsoids move towards the drop’s center. Inward fluid flows along the drop’s surface pushnetworks of ellipsoids towards the drop’s center, thus making room for more ellipsoids toadsorb on the air-water interface. Alternatively, the energetic interactions of the ellipsoidson the air-water interface may play an important role in this inward migration. However,a complete understanding of this inward motion has been elusive and will require moreexperimental and theoretical investigation.
4. – Evaporation and deposition from confined colloidal drops
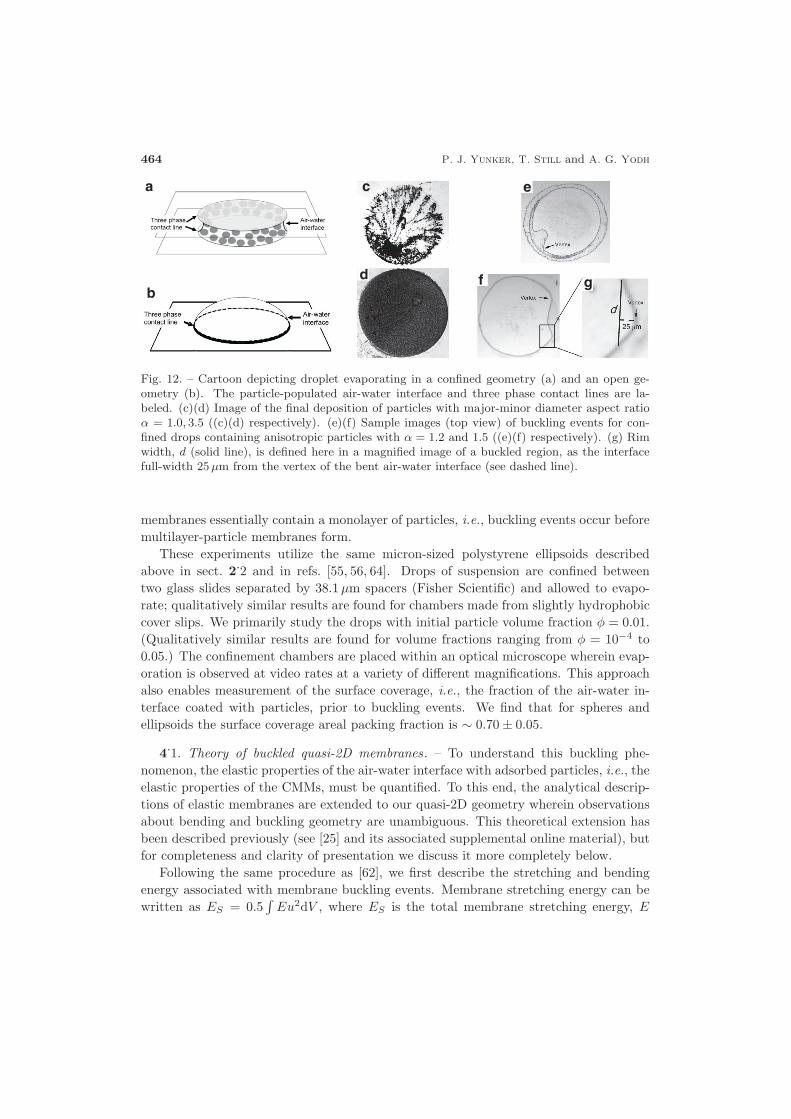
The mechanism that produces a uniform coating from particles suspended in dryingsessile drops requires the presence of an air-water interface that spans the entire area cov-ered by the drop. A drop confined between two glass plates is a completely different beast.In this case, the air-water interface is only present at the drop edges fig. 12a and fig. 13c(a sessile drop is shown for comparison in fig. 12b). Thus, the mechanisms that produceuniform coatings in “open” or sessile drops are unlikely to be present in confined drops.To illustrate these spectacular differences, in fig. 12c,d, we again see that suspended par-ticle shape produces dramatically different depositions. The confined drops do not evenexhibit the conventional coffee-ring effect. Rather, spheres and slightly stretched spheresare deposited heterogeneously, and anisotropic ellipsoids are distributed relatively moreuniformly. In this section, we show how one can understand these deposition effects.Important clues are revealed through consideration of the mechanical properties of theair-water interfaces, and changes thereof as a result of adsorbed particles.
Recent experiments have explored evaporation of confined drops containingspheres [58-61], and their behaviors differ dramatically from sessile drops containingspheres. In the confined case, particles are pushed to the ribbon-like air-fluid interface,and, as evaporation proceeds, the particle-covered air-water interface often deforms andcrumples (fig. 12e and f). The buckling behaviors exhibited by these ribbon-like colloidalmonolayer membranes (CMMs) in confined geometries are strongly dependent on thegeometric shape of the adsorbed particles, and the buckling events appear similar tothose observed in spherical-shell elastic membranes [62, 63]. Before buckling events oc-cur, particles are densely packed near the three-phase contact line, regardless of particleshape. Further, because the particle volume fraction in the drop is relatively low, these
464 P. J. Yunker, T. Still and A. G. Yodh
a
b
c
gd
e
f
Fig. 12. – Cartoon depicting droplet evaporating in a confined geometry (a) and an open ge-ometry (b). The particle-populated air-water interface and three phase contact lines are la-beled. (c)(d) Image of the final deposition of particles with major-minor diameter aspect ratioα = 1.0, 3.5 ((c)(d) respectively). (e)(f) Sample images (top view) of buckling events for con-fined drops containing anisotropic particles with α = 1.2 and 1.5 ((e)(f) respectively). (g) Rimwidth, d (solid line), is defined here in a magnified image of a buckled region, as the interfacefull-width 25 μm from the vertex of the bent air-water interface (see dashed line).
membranes essentially contain a monolayer of particles, i.e., buckling events occur beforemultilayer-particle membranes form.
These experiments utilize the same micron-sized polystyrene ellipsoids describedabove in sect. 2.2 and in refs. [55, 56, 64]. Drops of suspension are confined betweentwo glass slides separated by 38.1 μm spacers (Fisher Scientific) and allowed to evapo-rate; qualitatively similar results are found for chambers made from slightly hydrophobiccover slips. We primarily study the drops with initial particle volume fraction φ = 0.01.(Qualitatively similar results are found for volume fractions ranging from φ = 10−4 to0.05.) The confinement chambers are placed within an optical microscope wherein evap-oration is observed at video rates at a variety of different magnifications. This approachalso enables measurement of the surface coverage, i.e., the fraction of the air-water in-terface coated with particles, prior to buckling events. We find that for spheres andellipsoids the surface coverage areal packing fraction is ∼ 0.70 ± 0.05.
4.1. Theory of buckled quasi-2D membranes. – To understand this buckling phe-nomenon, the elastic properties of the air-water interface with adsorbed particles, i.e., theelastic properties of the CMMs, must be quantified. To this end, the analytical descrip-tions of elastic membranes are extended to our quasi-2D geometry wherein observationsabout bending and buckling geometry are unambiguous. This theoretical extension hasbeen described previously (see [25] and its associated supplemental online material), butfor completeness and clarity of presentation we discuss it more completely below.
Following the same procedure as [62], we first describe the stretching and bendingenergy associated with membrane buckling events. Membrane stretching energy can bewritten as ES = 0.5
∫Eu2dV , where ES is the total membrane stretching energy, E
Colloidal shape effects in evaporating drops 465
Fig. 13. – (a) Buckling event cartoon defining rim full-width, d, drop radius, r, interface dis-placement, ζ, membrane thickness, t, in-plane direction along membrane surface, x, angle, θ,and out-of-plane direction, z. The dotted line represents the initial membrane configuration (be-fore the buckling event). The regions containing all buckling and stretching energy are shaded.All un-shaded regions are unstretched and unbent. (b) Magnified buckling event cartoon defin-ing rim full-width, d, and interface displacement, ζ. The regions containing all buckling andstretching energy are shaded. (c) Side view cartoon defining chamber height, h. (d) Exampleof buckling event for a confined drop containing anisotropic particles with α = 1.5. The rimwidth, d (solid line), drop radius, r, interface displacement, ζ, and out-of-plane direction, z, aredefined here. Dashed line indicates initial position of membrane.
is the 2D Young’s modulus, u is the strain, and the integrand is integrated over themembrane volume. For a thin, linearly elastic material, u does not change much inthe direction perpendicular to the surface, so ES
∼= 0.5∫
Eu2dA, where the integral iscalculated over the membrane surface area. The unstretched region has u = 0. Further,even in the stretched/buckled membrane, most of the deflected region has u = 0, sinceits configuration is identical to the undeflected membrane except that its curvature isinverted (fig. 13a,b). Thus, the only region under strain is the “rim” of the deformation(fig. 13a,b). If the entire membrane had experienced a constant radial displacement of ζ,its radius would change from r to r+ ζ, and the circumference would change from 2πr to2π(r + ζ). Then the membrane strain would be u = 2πζ/2πr = ζ/r. On the other hand,if (as is the case for our samples) the displacement is confined to a small region subtendedby angle θ, then the in-plane length of this region changes from θr to θ(r + ζ), and thetotal strain in the membrane is u = θζ/θr = ζ/r. Again, this estimate assumes that theinterfacial deflection does not change in the z-direction (out-of-plane), i.e., ∂ζ/∂z ≈ 0.Within these approximations, ES
∼= 0.5∫
E(ζ/r)2dA. The integral is readily performedover an area normal to the glass plates described by A ≈ dh, where d is the in-planelength of the deflected region, and h is the chamber height. Thus, ES ≈ 0.5E(ζ/r)2dh.
The membrane bending energy can be written as EB = 0.5∫
κK2CdA, where EB is
the total bending energy, κ is the bending rigidity, and KC is the membrane curvature.Here, the curvature is KC ≈ ∂2r(θ)/∂x2, where x is the coordinate in-plane along themembrane (see fig. 13a,b). The first derivative can be written as ∂r(θ)/∂x ≈ ζ/d, asζ is the change in the membrane position over a distance of approximately d in the x
direction. The second derivative can then be estimated as ∂2r(θ)/∂x2 ≈ ζ/d2, as the
466 P. J. Yunker, T. Still and A. G. Yodh
first derivative changes from 0 in the undeflected region to ζ/d in the deflected region ofapproximate length d. Therefore, KC ≈ ζ/d2. (This approach again assumes that thesecond derivative of the deflection in the z-direction is small, i.e., ∂2ζ/∂z2 ≈ 0.) Theintegral is readily performed over an area described by A ≈ dh, and EB ≈ 0.5κhζ2/d3.
The total energy from the deflection is ETOT = ES+EB = 0.5E(ζ/r)2dh+0.5κhζ2/d3.This energy is concentrated within the deflected rim (i.e., with width d). Membranes willbuckle in the way that minimizes their energy. To derive this condition, we minimize thetotal deflection energy with respect to d, i.e., ∂ETOT/∂d = E(ζ/r)2h − 3κhζ2/d4 = 0.Minimizing the total bending and stretching energy gives the relation, κ/E = d4/(3r2).Thus, by measuring d and r in a series of drops with the same particles and membranecharacteristics, we can experimentally determine κ/E. (Interestingly, ζ drops out of thecalculation, i.e., a precise determination of ζ is not necessary for this calculation withinthe assumptions listed above. Also, note that this calculation is independent of the depthof the invagination; the only requirement is that the deflection minimizes total membraneenergy. Finally, note that this derivation assumes that the interfacial displacement varieslittle in the z-direction, i.e., the air-water interface deflects the same distance at the top,middle, and bottom of the chamber.)
In practice we measure d as the rim full-width located 25μm from the rim vertex (seefig. 12g and fig. 13a, b and d). The exact value of d, however, is not very sensitive tomeasurement protocol. For example, defining d as the full width at 20μm or 30 μm fromthe rim vertex changes d by approximately 20 percent.
This simple experimental approach enables us to extract the ratio of CMM bendingrigidity, κ, to its Young’s modulus, E, from measurements of d and r across a seriesof drops from the relation κ/E = d4/(3r2). With all other parameters constant, e.g.,particle anisotropy, particle surface coverage, etc., this formula predicts that d ∝ √
r.In fig. 14b we show results from evaporated drops of particles with anisotropy α = 1.2and with different initial values of r, plotting d versus
√r. A good linear relationship
is observed (coefficient of determination, R2 = 0.93), implying that our analysis is self-consistent. Similar high quality linear results were found for other values of α.
In principle, the air-water interface can be distorted in the z-direction as well as in-plane. The analysis thus far has assumed these distortions are small, and it is possibleto check that these corrections are small. Using bright field microscopy, we can identifythe inner and outer position of the air-water interface and thus estimate the radiusof curvature in the z-direction [59] (fig. 14a). We find that the radius of curvatureis approximately equal to the chamber thickness (∼ 38.3 μm ±1 μm) both before andafter buckling events. The relevant partial derivatives are then ∂ζ/∂z ≤ 1/38.3 and∂ζ/∂z ≤ 1/(38.32); therefore the corrections to theory are indeed small.
4.2. Dependence of bending rigidity on particle shape. – We extract and plot κ/E forevaporating drops of particles with different α (fig. 14c). Notice that, κ/E increases withincreasing α, implying that, as particle shape becomes more anisotropic, κ increases fasterthan E, i.e., κ/E is larger for ellipsoids (α = 2.5 and 3.5) than for spheres (α = 1.0).
Since we measure the ratio κ/E, in order to isolate the bending rigidity, we require
Colloidal shape effects in evaporating drops 467
20 30 40 50 60
150
200
250
d[μ
m]
r1/2 [μm1/2]
aa
b
d
c
e
Fig. 14. – (a) Experimental image of air-water interface demonstrating how the radius of cur-vature is measured. Red lines represent the inner and outer edges of the air-water interface,as shown in the cartoon below. (b) d is plotted versus the square root of the drop radius, r.(c) Ratio of the bending rigidity, κ, to the Young’s modulus, E, is plotted versus α. (d) κ versusE, where E comes from previously reported measurements and calculations. The line representsthe best power law fit. (e) κ versus α.
knowledge of the Young’s modulus of the membrane. Previous experiments have observedthat the CMM Young’s modulus increases with α [22,36,65-67]. For particles with α = 1.0and 2.5, we use previously reported values of the bulk modulus [65], B, the shear modu-lus [22], G′, and the relationship E = 4BG′/(B+G′) in order to extract the CMM Young’smodulus. We were unable to find data for α = 1.2, 1.5, or 3.5, so we linearly interpolatedfrom reported values of B and G′. Using these previously reported values, we obtainedE = 0.098, 0.14, 0.22, 0.39 and 0.39 N/m for α = 1.0, 1.2, 1.5, 2.5 and 3.5, respectively.
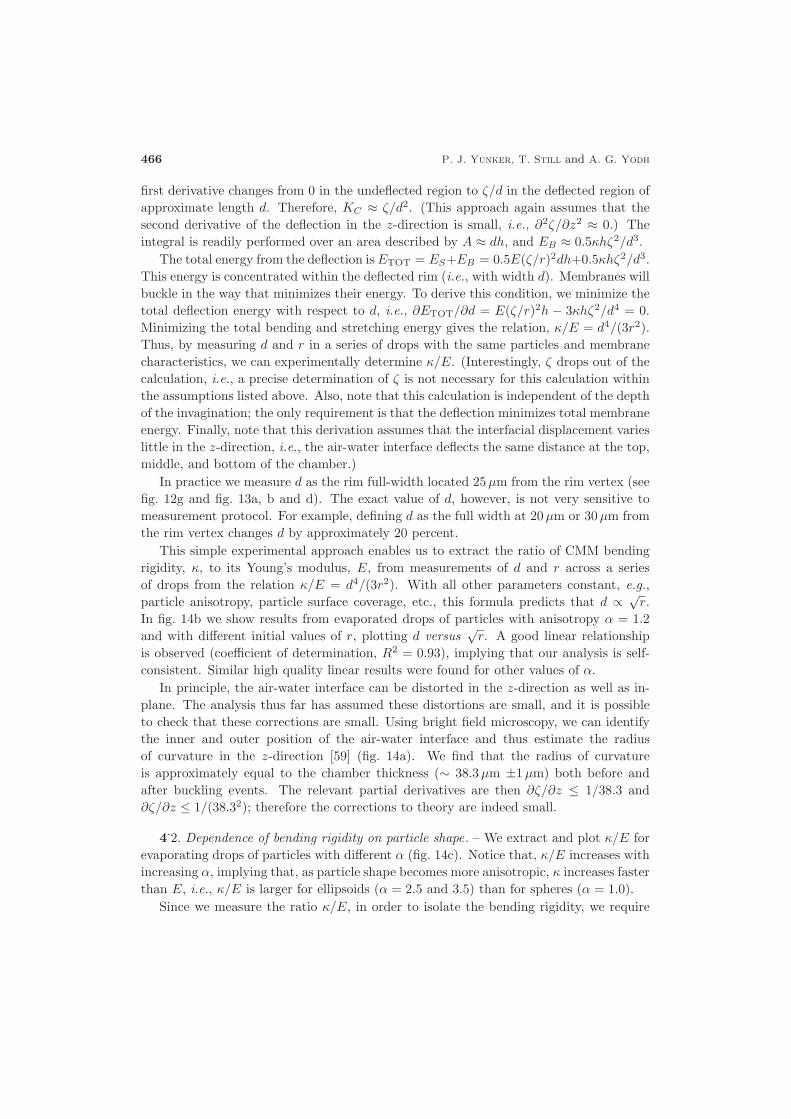
Utilizing these previously reported measurements and calculations of E we are able toplot κ versus E (fig. 14d). The best power law fit finds that κ ∝ E2.94(3). Interestingly,this observation is consistent with theoretical models which predict κ ∝ E3 [62]. However,the full physical origin of this connection is unclear. Further, while at first glance it mayseem contradictory to claim that κ/E = d4/(3r2) and κ ∝ E3, these formulae areconsistent. A simple elastic model assumes that E = Y t and κ = Y t3, where Y is the 3DYoung’s modulus and t is the membrane thickness [62]. Based on this model, κ = E3/Y 2,so κ/E = E2/Y 2. Thus, κ/E = E2/Y 2 = d4/(3r2). To test this prediction, we plotd4/(3r2) versus E (fig. 15). The best power law fit is d4/(3r2) ∝ E1.92(3), implying thatthese two seemingly contradictory equations are in fact consistent. Note, this simpleelastic model suggests that Y ≈ 19 kPa for all α, which is similar to stiff jello. Finally,our estimates of CMM bending rigidity are given in (fig. 14e). Clearly, membrane bendingbecomes much more energetically costly with increasing particle shape anisotropy.
468 P. J. Yunker, T. Still and A. G. Yodh
Fig. 15. – As a consistency check, d4/(3r2) is plotted versus E. The line represents the bestpower law fit.
4.3. Particle deposition in confined geometries . – Finally, we turn our attention tothe problem we initially hoped to understand: the consequences of increased bendingrigidity on particle deposition during evaporation processes in confined geometries. Asshould be evident from our discussion in sects. 1- 3, substantial effort has now yieldedunderstanding of the so-called coffee-ring effect and some ability to control particle depo-sition from sessile drops [3, 6, 12-17, 68-71]. Much less is known, however, about particledeposition in confined geometries, despite the fact that many real systems [72-74] andapplications [75, 76] feature evaporation in geometries wherein the air-water interfaceis present only at the system edges. Recent experiments have explored evaporation ofconfined drops containing spheres [58-61], and their behaviors differ dramatically fromsessile drops containing spheres. In the confined case, as noted previously, particles arepushed to the ribbon-like air-fluid interface, and, as evaporation proceeds, the particle-covered air-water interface often undergoes the buckling events which we have quantifiedin sects. 4.1 and 4.2.
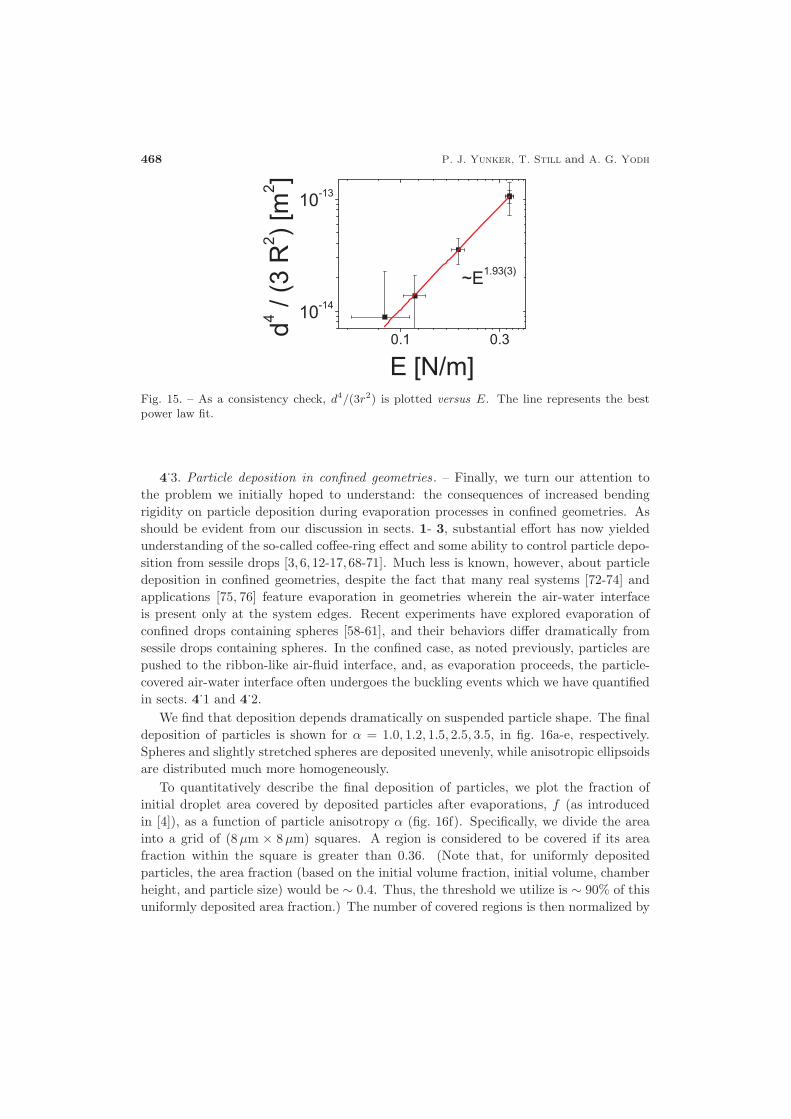
We find that deposition depends dramatically on suspended particle shape. The finaldeposition of particles is shown for α = 1.0, 1.2, 1.5, 2.5, 3.5, in fig. 16a-e, respectively.Spheres and slightly stretched spheres are deposited unevenly, while anisotropic ellipsoidsare distributed much more homogeneously.
To quantitatively describe the final deposition of particles, we plot the fraction ofinitial droplet area covered by deposited particles after evaporations, f (as introducedin [4]), as a function of particle anisotropy α (fig. 16f). Specifically, we divide the areainto a grid of (8μm × 8 μm) squares. A region is considered to be covered if its areafraction within the square is greater than 0.36. (Note that, for uniformly depositedparticles, the area fraction (based on the initial volume fraction, initial volume, chamberheight, and particle size) would be ∼ 0.4. Thus, the threshold we utilize is ∼ 90% of thisuniformly deposited area fraction.) The number of covered regions is then normalized by
Colloidal shape effects in evaporating drops 469
Fig. 16. – Image of the final deposition of particles with major-minor diameter aspect ratioα = 1.0, 1.2, 1.5, 2.5, 3.5 ((a)-(e), respectively). (f) The area fraction covered by particles afterevaporation is complete, f , for suspensions of particles as a function of their aspect ratio α.
the total number of squares in the grid, thus producing f . The fraction of area coveredwith particles is observed to increase with α. For α = 1.2 and 1.5, f increases modestly.For α = 2.5, the deposition is very uniform, and for α = 3.5, virtually the entire area iscovered uniformly.
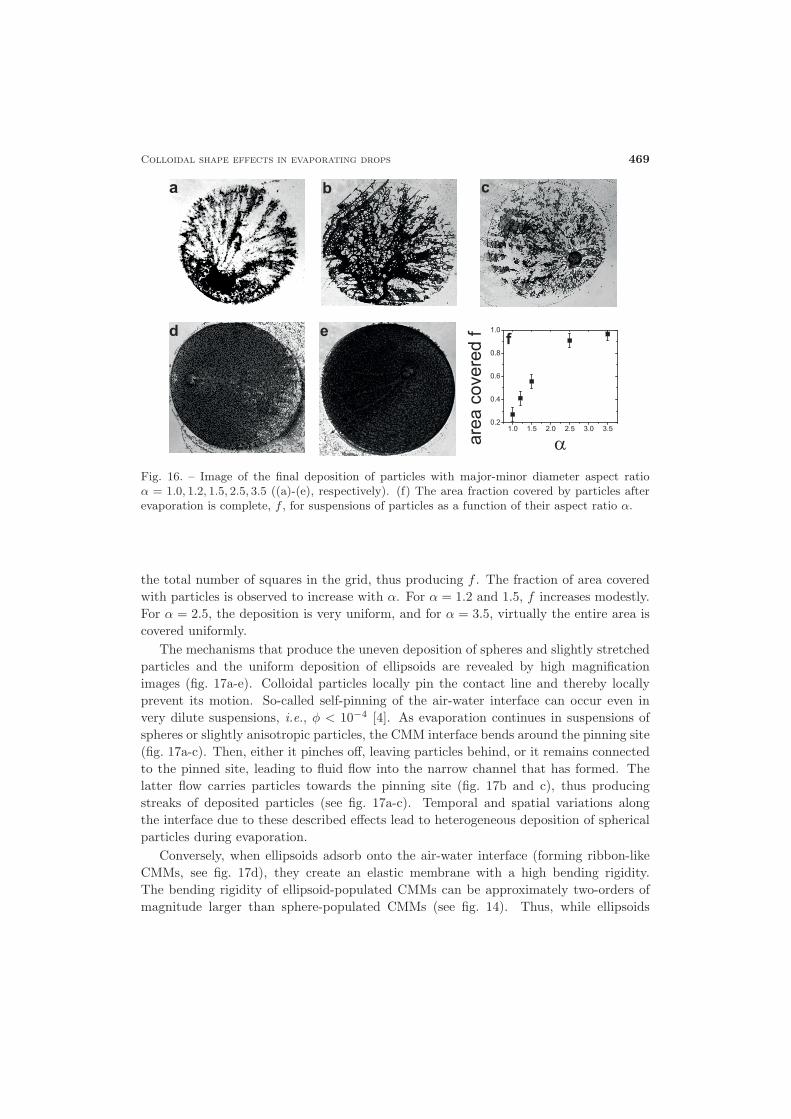
The mechanisms that produce the uneven deposition of spheres and slightly stretchedparticles and the uniform deposition of ellipsoids are revealed by high magnificationimages (fig. 17a-e). Colloidal particles locally pin the contact line and thereby locallyprevent its motion. So-called self-pinning of the air-water interface can occur even invery dilute suspensions, i.e., φ < 10−4 [4]. As evaporation continues in suspensions ofspheres or slightly anisotropic particles, the CMM interface bends around the pinning site(fig. 17a-c). Then, either it pinches off, leaving particles behind, or it remains connectedto the pinned site, leading to fluid flow into the narrow channel that has formed. Thelatter flow carries particles towards the pinning site (fig. 17b and c), thus producingstreaks of deposited particles (see fig. 17a-c). Temporal and spatial variations alongthe interface due to these described effects lead to heterogeneous deposition of sphericalparticles during evaporation.
Conversely, when ellipsoids adsorb onto the air-water interface (forming ribbon-likeCMMs, see fig. 17d), they create an elastic membrane with a high bending rigidity.The bending rigidity of ellipsoid-populated CMMs can be approximately two-orders ofmagnitude larger than sphere-populated CMMs (see fig. 14). Thus, while ellipsoids
470 P. J. Yunker, T. Still and A. G. Yodh
0 2x10⁻³ 4x10⁻³
0.2
0.4
0.6
0.8
1.0
area
cove
red
f
φE
a b c d
e
f
air
water
air water
Fig. 17. – (a) Image of the final deposition of particles with major-minor diameter aspect ratioα = 1.0. The box indicates the deposit left behind by the event depicted in (b) and (c). (b)Image of a pinned region of the air-water interface (α = 1.0). When the pinned section doesnot “snap” off, it leaves behind a channel. (c) At a later time (∼ 100 seconds after (c)), thechannel extends, and more particles flow into it, producing a very heterogeneous deposition. (d)Image of a colloidal monolayer near the three phase contact line in a drop containing ellipsoids(α = 3.5). The three phase contact line is labeled with a dashed line on the left side of theimage. Particles are adsorbed on the air-water interface, forming a monolayer, as evidenced bythe fact that particles become more out of focus, from left to right, as the air-water interfacecurves. A cartoon below shows a side view of the experimental image (e). (f) The fraction ofarea covered by particles, f , for suspensions of 200 nm diameter spheres doped with differentamounts of ellipsoids, represented by the ellipsoid volume fraction, φE .
may also pin the contact line, bending of the CMM interface around a pinned contactline is energetically costly. Microscopically, bending requires the energetically expensiverearrangement of ellipsoids aggregated on the CMM; attractive particle-particle capillaryinteractions on the air-water interface must be overcome for bending, even at very smallφ. Conversely, bending a sphere coated CMM costs relatively little energy, as sphere-sphere capillary interactions on the interface are relatively weak [18, 19, 24]. Thus, asthe confined drop continues to evaporate, the ellipsoid coated CMM does not bend. Itrecedes radially, depositing ellipsoids near the contact line during this drying process.
4.4. Mixtures of spheres and ellipsoids. – As we already demonstrated mixing spheresand ellipsoids in sessile drops presents qualitatively new scenarios. It is natural to in-vestigate the deposition of mixtures of spheres and ellipsoids in confined geometries. Tothis end suspensions of 200 nm spheres (α = 1.0) with φ = 0.02 were combined withsuspensions containing micron-sized ellipsoids (α = 3.5) at lower volume fractions, φ = 0to 4.0×10⁻³. The resulting colloidal drops were evaporated in the same confined geome-tries already utilized. The addition of a very small number of ellipsoids has no effect onthe deposition of spheres (φ ≤ 1.7 × 10⁻³). However, the addition of a larger, but stillsmall number of ellipsoids produces a uniform deposition of both ellipsoids and spheres,i.e., f ≈ 0.8, despite the fact that spheres significantly outnumber ellipsoids (103–104)(fig. 17e).
Again, the high bending modulus produced by ellipsoids on the CMM helps explainthe observations. Both spheres and ellipsoids attach to the air-water interface. Ellipsoidsdeform the air-water interface, creating an effective elastic membrane with a high bendingrigidity. When enough ellipsoids are present, pinning and bending the interface becomes
Colloidal shape effects in evaporating drops 471
energetically costly and the spheres (and ellipsoids) are deposited as the interface recedes.Further, this behavior in confined geometries is different than that of sessile drops
(see sect. 3.8 and [17]). From this perspective, it is somewhat surprising that smallspheres are deposited uniformly from droplets doped with small numbers of ellipsoidsand confined between glass plates.
Interestingly, this method of producing a uniform deposition is similar to convectiveassembly techniques wherein the substrate, or a blade over the substrate, is pulled awayfrom the contact line in a colloidal suspension; a thin film is thus formed that leadsto the creation of a monolayer of particles (e.g., [33, 68, 77-84]). Unlike many otherconvective assembly techniques, the present experimental system has neither moving normechanical parts. Uniform coatings are created essentially as a result of shape-inducedcapillary attractions which produce CMMs that are hard to bend.
4.5. Evaporation of drops in confined geometries: Summary . – Colloidal drops evap-orating in confined geometries behave quite differently the evaporating sessile drops.Ellipsoids adsorbed on the air-water interface create an effective elastic membrane, and,as particle anisotropy aspect ratio increases, the membrane’s bending rigidity increasesfaster than its Young modulus. As a result, when a drop of a colloidal suspension evap-orates in a confined geometry, the different interfacial elastic properties produce particledepositions that are highly dependent on particle shape. The ability to increase CMMbending rigidity by increasing particle shape anisotropy holds potentially important con-sequences for applications of CMMs. For example, increased bending rigidity may helpstabilize interfaces (e.g., Pickering emulsions [23]) and thus could be useful for manyindustrial applications, e.g., food processing [85,86]. In a different vein, the observationspresented here suggest the buckling behavior of CMMs in confined geometries may be aconvenient model system to investigate buckling processes relevant for other systems, e.g.,polymeric membranes [87], biological membranes [88], and nanoparticle membranes [89].
5. – Surfactant effects on particle deposition from drying colloidal drops
In the previous sections, we showed how particle shape influences the behaviors ofdrying drops containing colloidal particles. For sessile drops we found that particleanisotropy could be employed to overcome the coffee-ring effect; for drops in confinement,we found that particle anisotropy dramatically affected the bending rigidity of the air-water interfaces which in turn modified particle deposition during drying. Besides particleshape, many other ideas have been observed, developed, and utilized over the years tomanipulate the drying behaviors of colloidal drops [6, 12-16]. In the final section of thisreview paper, we describe our foray into the effects of added surfactants.
A surfactant is a surface-active molecule that consists of a hydrophobic and a hy-drophilic part. In water, surfactant molecules populate the air-water interface with theirhydrophobic parts “sticking out of the water”, thereby reducing the water’s surface ten-sion (which is paramount for the cleaning effects of soaps or dish washers). In an immis-cible mixture of water and oil, surfactants populate the interfaces between components,
472 P. J. Yunker, T. Still and A. G. Yodh
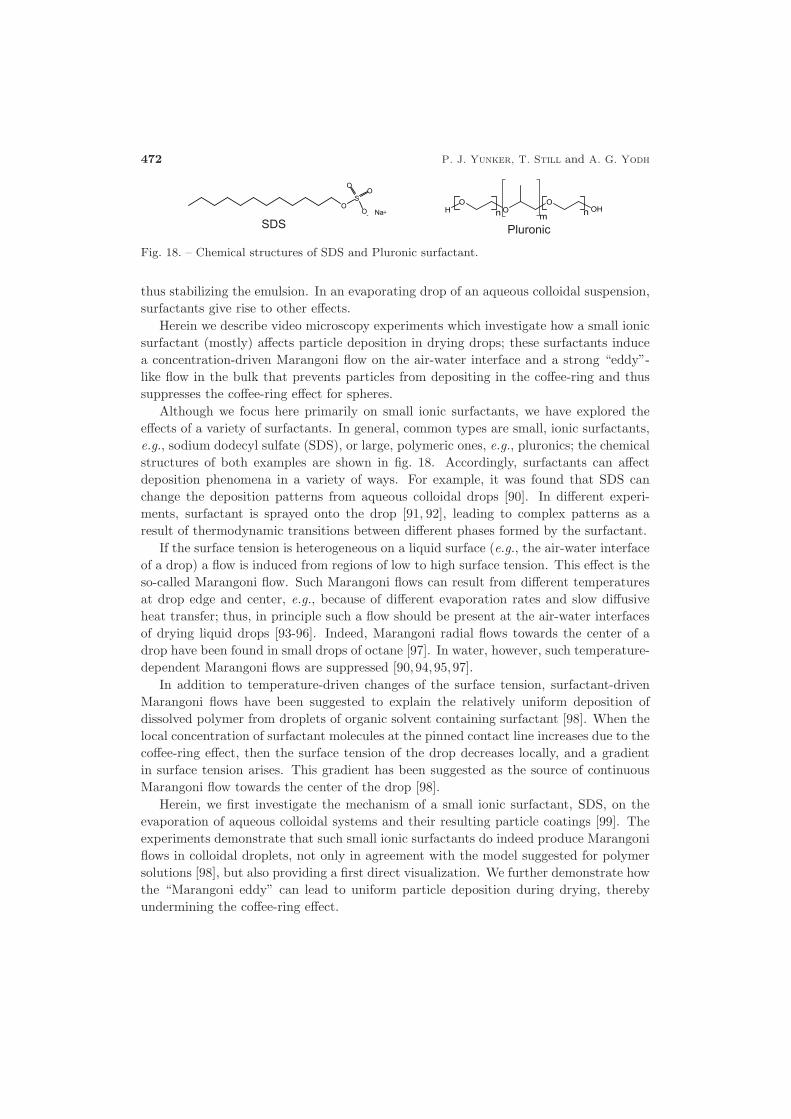
Fig. 18. – Chemical structures of SDS and Pluronic surfactant.
thus stabilizing the emulsion. In an evaporating drop of an aqueous colloidal suspension,surfactants give rise to other effects.
Herein we describe video microscopy experiments which investigate how a small ionicsurfactant (mostly) affects particle deposition in drying drops; these surfactants inducea concentration-driven Marangoni flow on the air-water interface and a strong “eddy”-like flow in the bulk that prevents particles from depositing in the coffee-ring and thussuppresses the coffee-ring effect for spheres.
Although we focus here primarily on small ionic surfactants, we have explored theeffects of a variety of surfactants. In general, common types are small, ionic surfactants,e.g., sodium dodecyl sulfate (SDS), or large, polymeric ones, e.g., pluronics; the chemicalstructures of both examples are shown in fig. 18. Accordingly, surfactants can affectdeposition phenomena in a variety of ways. For example, it was found that SDS canchange the deposition patterns from aqueous colloidal drops [90]. In different experi-ments, surfactant is sprayed onto the drop [91, 92], leading to complex patterns as aresult of thermodynamic transitions between different phases formed by the surfactant.
If the surface tension is heterogeneous on a liquid surface (e.g., the air-water interfaceof a drop) a flow is induced from regions of low to high surface tension. This effect is theso-called Marangoni flow. Such Marangoni flows can result from different temperaturesat drop edge and center, e.g., because of different evaporation rates and slow diffusiveheat transfer; thus, in principle such a flow should be present at the air-water interfacesof drying liquid drops [93-96]. Indeed, Marangoni radial flows towards the center of adrop have been found in small drops of octane [97]. In water, however, such temperature-dependent Marangoni flows are suppressed [90,94,95,97].
In addition to temperature-driven changes of the surface tension, surfactant-drivenMarangoni flows have been suggested to explain the relatively uniform deposition ofdissolved polymer from droplets of organic solvent containing surfactant [98]. When thelocal concentration of surfactant molecules at the pinned contact line increases due to thecoffee-ring effect, then the surface tension of the drop decreases locally, and a gradientin surface tension arises. This gradient has been suggested as the source of continuousMarangoni flow towards the center of the drop [98].
Herein, we first investigate the mechanism of a small ionic surfactant, SDS, on theevaporation of aqueous colloidal systems and their resulting particle coatings [99]. Theexperiments demonstrate that such small ionic surfactants do indeed produce Marangoniflows in colloidal droplets, not only in agreement with the model suggested for polymersolutions [98], but also providing a first direct visualization. We further demonstrate howthe “Marangoni eddy” can lead to uniform particle deposition during drying, therebyundermining the coffee-ring effect.
Colloidal shape effects in evaporating drops 473
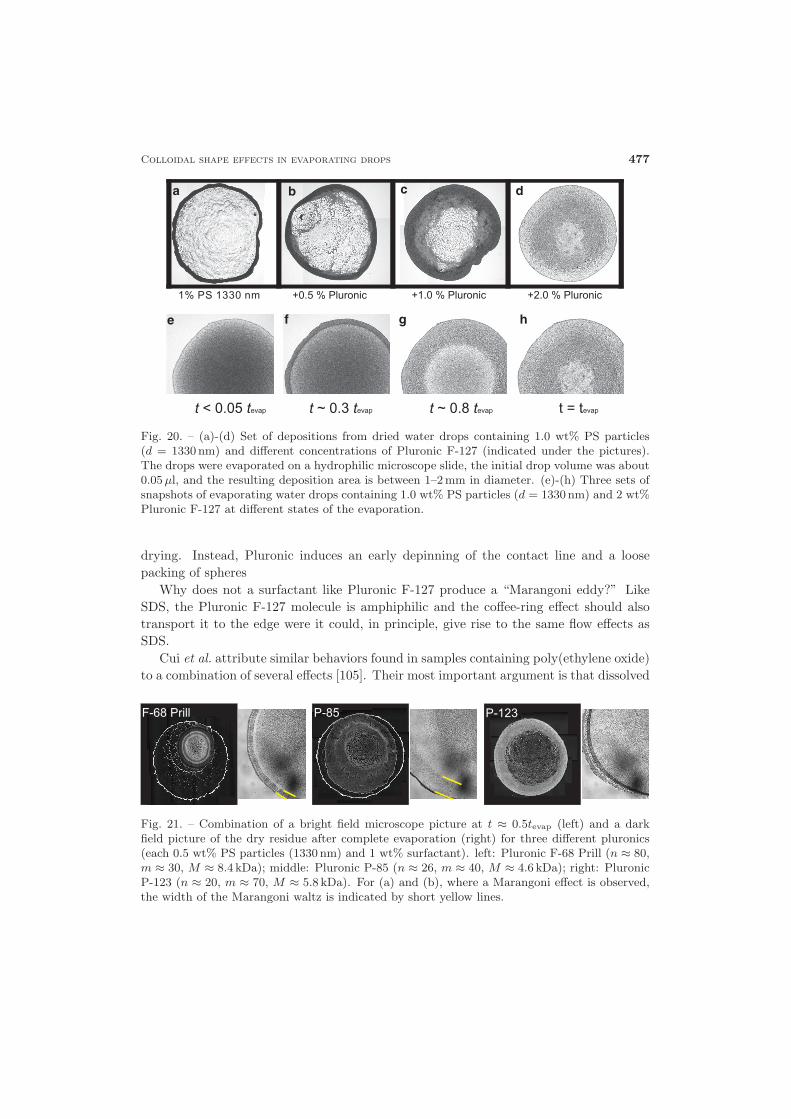
At the end of this section on surfactants we show preliminary experiments whichdemonstrate that large polymeric surfactants like Pluronic F-127 influence the evapo-ration of drops in a strikingly different way than small ionic surfactants. In this case,contact line pinning is prevented, leading to a uniform particle deposition. We suggestan explanation of this behavior as due mainly to an increase of viscosity near the contactline, which is a result of high polymer concentration because the dissolved polymericsurfactant is transported to the contact line by the coffee-ring flow.
5.1. Experimental methods. – The procedure for these experiments has been describedpreviously [26], but for completeness and presentation clarity we briefly discuss thesemethodologies below. We focus on a few representative systems of evaporating dropswith the small ionic surfactant SDS or the large polymeric surfactant Pluronic F-127,respectively, and we attempt to elucidate rules governing their behavior.
We employed aqueous suspensions of colloidal polystyrene (PS) particles (diameterd = 1330 nm, synthesized by surfactant free radical emulsion polymerization, and stabi-lized by sulfate groups [100]). Suspensions were prepared with deionized water, filtered bya millipore column, and then the suspensions of PS spheres and SDS (Sigma-Aldrich) orPluronic F-127 (BASF) (in different compositions) were thoroughly mixed by a vortexerand ultrasonicated for five minutes.
Evaporation experiments were observed using a brightfield microscope with air objec-tives (magnification 5× to 100×). Clean hydrophilic glass substrates (Fisher Scientific)were used as evaporation substrates. (Note: Qualitatively similar results were found onhydrophobic cover slips.) The drop volume was about 0.05μL, leading to depositioncoatings with diameters of 1 to 3 mm. The evaporation process was recorded by a videomicroscopy (camera resolution 658 × 494 pixel, 60 frames per second) with total evap-oration times between 2 and 4 minutes. All experiments were repeated several timesin order to identify a consistent concentration-dependent behavior. Photographs of theentire deposit, obtained after evaporation, were taken by combining up to four high-resolution photographs when the deposition area was larger than the microscope field ofview [99].
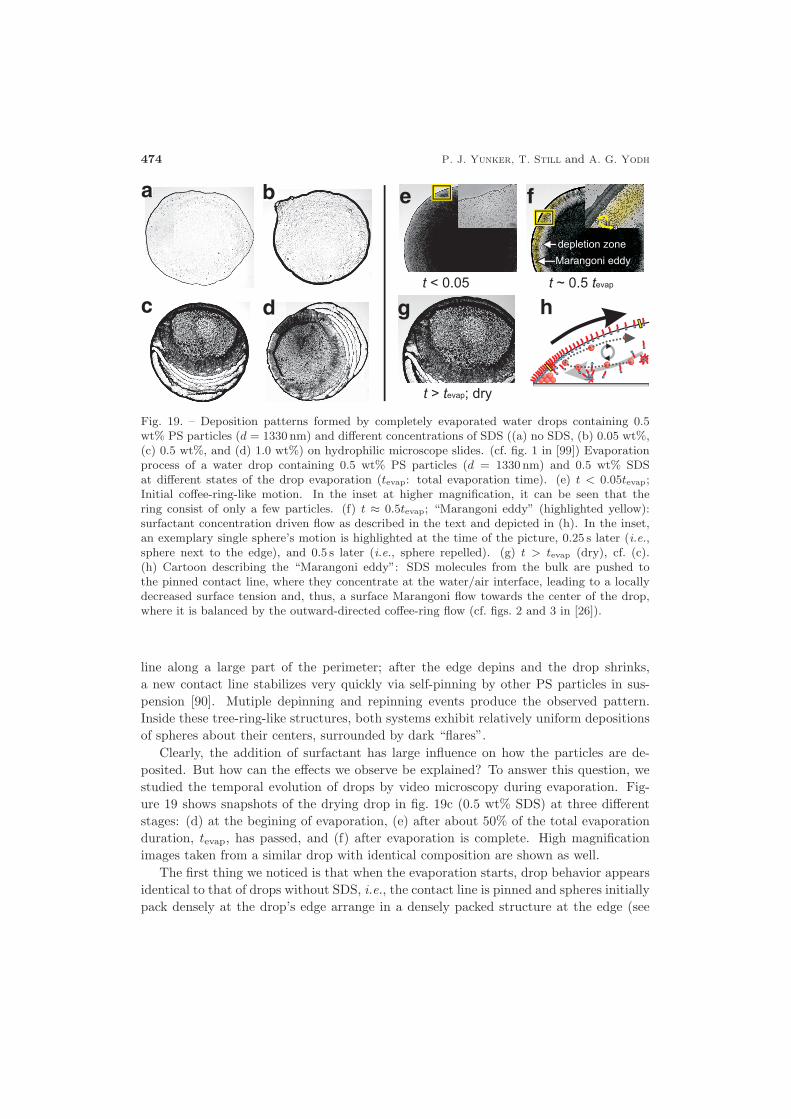
5.2. Surfactant driven particle deposition and Marangoni eddies . – Figure 19a-d showstop views of the deposition pattern of an aqueous suspension of PS spheres (0.5 wt%)(a) and similar suspensions but with different concentrations of SDS ranging from 0.05wt% to 1.0 wt% (b-d). The coffee-ring effect is observed in sample (a), i.e., the vastmajority of spheres are deposited in a thin ring located at the initial pinned contact line,and very few particles are deposited in the center of the drop. The deposition changesslightly upon adding a small amount of SDS (0.05 wt%, (b)). Specifically, the coffee-ringbroadens and more particles are deposited in the center of the drop.
At higher SDS concentrations (0.5 wt% (c) and 1.0 wt% (d)), however, the depositionpattern changes drastically. Instead of a single ring at the initial pinned contact line,tree-ring-like structures are observed with several distinct deposition lines. These tree-ring deposition structures can be explained by stick-slip dynamics of the drop’s contact
474 P. J. Yunker, T. Still and A. G. Yodh
a b
c dt < 0.05 t t~ 0.5 evap
t t> ; dryevap
e f
g
Marangoni eddydepletion zone
32
1
h
Fig. 19. – Deposition patterns formed by completely evaporated water drops containing 0.5wt% PS particles (d = 1330 nm) and different concentrations of SDS ((a) no SDS, (b) 0.05 wt%,(c) 0.5 wt%, and (d) 1.0 wt%) on hydrophilic microscope slides. (cf. fig. 1 in [99]) Evaporationprocess of a water drop containing 0.5 wt% PS particles (d = 1330 nm) and 0.5 wt% SDSat different states of the drop evaporation (tevap: total evaporation time). (e) t < 0.05tevap;Initial coffee-ring-like motion. In the inset at higher magnification, it can be seen that thering consist of only a few particles. (f) t ≈ 0.5tevap; “Marangoni eddy” (highlighted yellow):surfactant concentration driven flow as described in the text and depicted in (h). In the inset,an exemplary single sphere’s motion is highlighted at the time of the picture, 0.25 s later (i.e.,sphere next to the edge), and 0.5 s later (i.e., sphere repelled). (g) t > tevap (dry), cf. (c).(h) Cartoon describing the “Marangoni eddy”: SDS molecules from the bulk are pushed tothe pinned contact line, where they concentrate at the water/air interface, leading to a locallydecreased surface tension and, thus, a surface Marangoni flow towards the center of the drop,where it is balanced by the outward-directed coffee-ring flow (cf. figs. 2 and 3 in [26]).
line along a large part of the perimeter; after the edge depins and the drop shrinks,a new contact line stabilizes very quickly via self-pinning by other PS particles in sus-pension [90]. Mutiple depinning and repinning events produce the observed pattern.Inside these tree-ring-like structures, both systems exhibit relatively uniform depositionsof spheres about their centers, surrounded by dark “flares”.
Clearly, the addition of surfactant has large influence on how the particles are de-posited. But how can the effects we observe be explained? To answer this question, westudied the temporal evolution of drops by video microscopy during evaporation. Fig-ure 19 shows snapshots of the drying drop in fig. 19c (0.5 wt% SDS) at three differentstages: (d) at the begining of evaporation, (e) after about 50% of the total evaporationduration, tevap, has passed, and (f) after evaporation is complete. High magnificationimages taken from a similar drop with identical composition are shown as well.
The first thing we noticed is that when the evaporation starts, drop behavior appearsidentical to that of drops without SDS, i.e., the contact line is pinned and spheres initiallypack densely at the drop’s edge arrange in a densely packed structure at the edge (see
Colloidal shape effects in evaporating drops 475
fig. 19e inset). The image gets progressively darker towards the drop center where thedrop is thickest as particles in the bulk are evenly distributed.
However, even at this early stage of evaporation, some spheres flow towards the dropedge but do not reach it. Rather, as they approach the edge, they are repelled backtowards the drop center. As we know from the early studies of the coffee-ring effect [90],with advancing evaporation time, the flow towards the edge becomes stronger. In ourexperiment, more and more particles approach the edge but do not reach it. Theseparticles appear to be captured within a certain region of the drop, which is highlightedyellow in fig. 19f. They form a broad corona, i.e., an outer rim distinctly different andseparated from the inner part of the drop, located between the relatively uniform darkcenter and the coffee-ring.
We describe the dark part of the corona as a “Marangoni eddy” or circulating regionof PS spheres that are transported towards and away from the drop edge throughout thedrying process (see fig. 19f). PS spheres are pulled into the eddy (see fig. 19f), leading toa locally reduced number of particles in the depletion zone (that explains why this regionis less dark then the other regions). The trajectory of an individual sphere is markedby the three numbers (1, 2, 3) in fig. 19f. Initially, the sphere is approximately in themiddle of the eddy (1). After ∼ 0.25 seconds, the sphere is pushed radially outward,i.e., towards the coffee-ring (2). However, after another∼ 0.25 seconds, the sphere ispushed radially inward, i.e., towards the region between the eddy and the depletionzone (3). Video microscopy shows us that the same behavior is observed for virtuallyall of the particles at later times during the evaporation (see supporting online materialfor [26]).
5.3. Discussion of Marangoni eddies. – The experiments provide evidence that theobserved deposition behavior is dominated by a surfactant-driven Marangoni effect. Asnoted above, related surfactant-driven phenomena were recently observed in drying poly-mer solutions containing oligomeric fluorine-based surfactants [98]. However, the previ-ously studied polymer solutions differ qualitatively from the aqueous colloidal suspen-sions presented here. Drying polymer solutions can exhibit gelation [101]. Further, thelocal surface tension in drying drops of polymer solutions depends on the local soluteconcentration [102,103].
Observing particle motion in real-time facilitates a comprehensive understanding ofthis phenomenon. A cartoon of the mechanism is shown in 19g. The “eddy” forms inbetween the yellow bars in fig. 19g, which corresponds to the highlighted region in fig. 19fin (top view). Shortly after a drop is created, some surfactant molecules (pictured inthe cartoon as hydrophilic “heads” with hydrophobic “tails”) adsorb on the water/airinterface. Note, the air-water interface is the energetically preferred location for theamphiphilic SDS molecules. However, electrostatic repulsion of anionic heads preventsthem from forming maximally dense steric equilibrium packing. Additionally, at suffi-ciently high concentration SDS molecules are also dissolved in the bulk, either freely oras micelles (see fig. 19d).
476 P. J. Yunker, T. Still and A. G. Yodh
As was the case with no surfactant is added, the contact line is initially pinned.Thus, the outward convective flow that is responsible for the coffee-ring effect is presentand transports spheres and SDS molecules to the drop edge. As a result, the air-waterinterface near the contact line becomes more concentrated with SDS molecules whichlocally decrease the interfacial surface tension γ. This creates a surface tension gradientalong the air-water interface, ∇γ, which is resolved by a Marangoni flow from low to highγ. This strong surface flow penetrates into the bulk fluid, so that it can carry colloidalspheres near, but not on the interface, towards the drop center.
As spheres flow towards the drop center, the local SDS concentration decreases (andthe local γ increases), and the Marangoni flow weakens. Eventually, the radially out-ward bulk convective flow that drives the coffee-ring effect dominates the radially inwardMarangoni flow. Particles that travel to this point are carried towards the drop’s edgeonce again; the process then repeats. Although the SDS molecules are too small tobe observed optically, SDS molecules likely participate in the eddy as well. Otherwise,the surface would become saturated with SDS, which, in turn, would end or at leastweaken the Marangoni flow. Thus, particles are trapped in a circulating flow driven bythe local surfactant-concentration, which we call the “Marangoni eddy”. We find thatthe Marangoni flows become stronger at SDS concentrations above its critical micelleconcentration (cmc) in water (8.3 mM≈ 0.2 wt% [104]).
Again, as was the case for drops without SDS, at late times the contact line is observedto depin. However, due to the presence of the Marangoni eddy, when the final depinningoccurs, many particles are left in the more central regions of the bulk, because the eddyprevented them from attaching to the edge. After the contact line depins, the particlesthat remain in the bulk are deposited onto the substrate as the radially-inward-movingcontact line passes them. The radially inward contact line thus leaves behind a relativelyuniform particle deposition in the drop center. The formation of a “Marangoni eddy” isa prerequisite for the relatively uniform particle deposition in the drop center; it preventsmany particles from depositing at the drop’s edge, and thereby delays their depositionuntil times when the contact line has depinned.
6. – Other surfactants
Lastly, we describe preliminary experiments with non-ionic triblock polymer surfac-tants such as Pluronic F-127 is present (n ≈ 106, m ≈ 70, cf. fig. 18). Figure 20 isanalogous to fig. 19, but with 1 wt% PS particles and 0.5, 1.0, and 2.0 wt% Pluronic.Pluronic F-127 is a relatively large molecule (Mw ≈ 12600 g/mol); in the investigateddrops, the amount of Pluronic is about the same (by weight) as colloidal spheres.
The addition of Pluronic leads to a systematic change in the deposition pattern; asmore surfactant is added, the initial ring becomes broader, and eventually the entirearea is coated uniformly (on a macroscopic scale) with PS spheres. Additionally, atlower concentrations of Pluronic, complex deposition patterns appear in the center ofthe drop area. Video microscopy indicates that a Marangoni eddy is not present during
t t< 0.05 evap t t~ 0.3 evap t t~ 0.8 evap t = tevap
e f g h
Fig. 20. – (a)-(d) Set of depositions from dried water drops containing 1.0 wt% PS particles(d = 1330 nm) and different concentrations of Pluronic F-127 (indicated under the pictures).The drops were evaporated on a hydrophilic microscope slide, the initial drop volume was about0.05 μl, and the resulting deposition area is between 1–2mm in diameter. (e)-(h) Three sets ofsnapshots of evaporating water drops containing 1.0 wt% PS particles (d = 1330 nm) and 2 wt%Pluronic F-127 at different states of the evaporation.
drying. Instead, Pluronic induces an early depinning of the contact line and a loosepacking of spheres
Why does not a surfactant like Pluronic F-127 produce a “Marangoni eddy?” LikeSDS, the Pluronic F-127 molecule is amphiphilic and the coffee-ring effect should alsotransport it to the edge were it could, in principle, give rise to the same flow effects asSDS.
Cui et al. attribute similar behaviors found in samples containing poly(ethylene oxide)to a combination of several effects [105]. Their most important argument is that dissolved
Fig. 21. – Combination of a bright field microscope picture at t ≈ 0.5tevap (left) and a darkfield picture of the dry residue after complete evaporation (right) for three different pluronics(each 0.5 wt% PS particles (1330 nm) and 1 wt% surfactant). left: Pluronic F-68 Prill (n ≈ 80,m ≈ 30, M ≈ 8.4 kDa); middle: Pluronic P-85 (n ≈ 26, m ≈ 40, M ≈ 4.6 kDa); right: PluronicP-123 (n ≈ 20, m ≈ 70, M ≈ 5.8 kDa). For (a) and (b), where a Marangoni effect is observed,the width of the Marangoni waltz is indicated by short yellow lines.
478 P. J. Yunker, T. Still and A. G. Yodh
polymer is transported to the drop edge where it leads to a dramatic increase of viscositysuch that the suspended colloidal particles are immobilized before they reach the contactline. This argument does not provide insight about why the contact line should move, butwe speculate that the hydrophobicity of the deposited polymer (in our case, surfactant)may play a crucial role.
Interestingly, some other surfactants in the Pluronic family, principally the samestructure (cf. fig. 18) but with different block lengths n,m, show a strong Marangoni eddy.Specifically, different Pluronics (all BASF) were explored and their deposition patternsare shown in fig. 21; these surfactants include Pluronic F-68 Prill (n ≈ 80, m ≈ 30,M ≈ 8.4 kDa), P-85 (n ≈ 26, m ≈ 40, M ≈ 4.6 kDa), and P-123 (n ≈ 20, m ≈ 70,M ≈ 5.8 kDa). For all three Pluronics, fig. 21 shows a snapshot of the evaporating dropat t ≈ 0.5tevap on the left and a dark-field microscopy photograph of the deposition afterdrying is completed. Interestingly, for F-68 (a) and P-85 (b), a Marangoni eddy similarto that seen for SDS appears. Correspondingly, the deposition pattern of drops withthese surfactants is more similar to the case of SDS than to Pluronic F-127.
On the other hand, Pluronic P-123 (c) leads to the same phenomenon as F-127,revealing a mostly uniform, loose deposition with no evidence of a Marangoni eddy. Acomparison of the molecular properties of all poloxamer surfactants shows that neitherthe total molecular weight nor the ratio m/n is the parameter that governs the dropevaporation.
In total, the examples in this review illustrate the complexity of the coffee-ring prob-lem. In a few carefully controlled situations is the deposition of particles from a dryingdrop is dominated by a single effect. In most cases, several cooperative or antagonisticeffects act at the same time, preventing easy predictions and phenomenological under-standing of the underlying principles needed to open new pathways towards furthertechnological application of the coffee-ring effect or its circumvention [106].
∗ ∗ ∗
We thank M. Gratale, M. A. Lohr, K. Stebe and T. C. Lubensky for helpfuldiscussions. We also gratefully acknowledge financial support from the National Sci-ence Foundation through DMR-0804881, the PENN MRSEC DMR11-20901, and NASANNX08AO0G.
REFERENCES
[1] Deegan R. D., Bakajin O., Dupont T. F., Huber G., Nagel S. R. and Witten
T. A., Phys. Rev. E, 62 (2000) 756.
[2] Yoshitsugu K. and Ueno I., J. Visual., 14 (2011) 285.
[3] Deegan R. D., Bakajin O., Dupont T. F., Huber G., Nagel S. R. and Witten
T. A., Nature, 389 (1997) 827.
[4] Deegan R. D., Phys. Rev. E, 61 (2000) 475.
[5] Berteloot G., Hoang A., Daerr A., Kavehpour H. P., Lequeux F. and Limat L.,J. Colloid Interface Sci., 370 (2012) 155.
Colloidal shape effects in evaporating drops 479
[6] Bigioni T. P., Lin X.-M., Nguyen T. T., Corwin E. I., Witten T. A. and Jaeger
H. M., Nat. Mater., 5 (2006) 265.[7] Kaya D., Belyi V. A. and Muthukumar M., J. Chem. Phys., 133 (2010) 114905.[8] Park J. and Moon J., Langmuir, 22 (2006) 3506.[9] Dugas V., Sensors Actuators B: Chemical, 101 (2004) 112.
[10] Dugas V., Broutin J. and Souteyrand E., Langmuir, 21 (2005) 9130.[11] deGans B. J., Duineveld P. C. and Schubert U. S., Adv. Mater., 16 (2004) 203.[12] Hu H. and Larson R. G., J. Phys. Chem. B, 110 (2006) 7090.[13] Weon B. M. and Je J. H., Phys. Rev. E, 82 (2010) 015305.[14] Kajiya T., Kobayashi W., Okuzono T. and Doi M., J. Phys. Chem. B, 113 (2009)
15460.[15] Nguyen V. X. and Stebe K. J., Phys. Rev. Lett., 88 (2002) 164501.[16] Park B. J. and Furst E. M., Soft Matter, 6 (2010) 485.[17] Yunker P. J., Still T., Lohr M. A. and Yodh A. G., Nature, 476 (2011) 308.[18] Loudet J. C., Yodh A. G. and Pouligny B., Phys. Rev. Lett., 97 (2006) 018304.[19] Loudet J. C., Alsayed A. M., Zhang J. and Yodh A. G., Phys. Rev. Lett., 94 (2005)
018301.[20] Bowden N., Arias F., Deng T. and Whitesides G. M., Langmuir, 17 (2001) 1757.[21] Brown A. B. D., Smith C. G. and Rennie A. R., Phys. Rev. E, 62 (2000) 951.[22] Madivala B., Fransaer J. and Vermant J., Langmuir, 25 (2009) 2718.[23] Vandebril S., Fransaer J. and Vermant J., Soft Matter, 5 (2009) 1717.[24] Park B. J. and Furst E. M., Soft Matter, 7 (2011) 7676.[25] Yunker P. J., Gratale M., Lohr M. A., Still T., Lubensky T. C. and Yodh
A. G., Phys. Rev. Lett., 108 (2012) 228303.[26] Still T., Yunker P. J. and Yodh A. G., Langmuir, 28 (2012) 4984.[27] Han Y., Alsayed A. M., Nobili M., Zhang J., Lubensky T. C. and Yodh A. G.,
Science, 314 (2006) 626.[28] McGorty R., Fung J., Kaz D. and Manoharan V. N., Mater. Today, 13 (2010) 34.[29] Guzowski J., Tasinkevych M. and Dietrich S., Soft Matter, 7 (2011) 4189.[30] Guzowski J., Tasinkevych M. and Dietrich S., Phys. Rev. E, 84 (2011) 031401.[31] Cavallaro M., Botto L., Lewandowski E. P., Wang M. and Stebe K. J., Proc.
Natl. Acad. Sci. U.S.A., 108 (2011) 20923.[32] Stamou D., Duschl C. and Johannsmann D., Phys. Rev. E, 62 (2000) 5263.[33] Mittal M. and Furst E. M., Adv. Funct. Mater., 19 (2009) 3271.[34] Guzowski J., Tasinkevych M. and Dietrich S., arXiv:1103.5314 (2011).[35] Botto L., Yao L., Leheny R. L. and Stebe K. J., Soft Matter, 8 (2012) 4971.[36] Sagis L. M. C., Soft Matter, 7 (2011) 7727.[37] Lehle H., Noruzifar E. and Oettel M., Eur. Phys. J. E, 26 (2008) 151.[38] Pozrikidis C., J. Colloid Interface Sci., 364 (2011) 248.[39] Danov K. D. and Kralchevsky P. A., Adv. Colloid Interface Sci., 154 (2010) 91.[40] Lewandowski E. P., Bernate J. A., Tseng A., Searson P. C. and Stebe K. J.,
Soft Matter, 5 (2009) 886.[41] Fournier J. B. and Galatola P., Phys. Rev. E, 65 (2002) 031601.[42] Lucassen J., Colloids Surf., 65 (1992) 131.[43] Kralchevsky P., Adv. Colloid Interface Sci., 85 (2000) 145.[44] Danov K. D. and Kralchevsky P. A., Adv. Colloid Interface Sci., 154 (2010) 91.[45] Loudet J. C. and Pouligny B., EPL, 85 (2009) 28003.[46] Hinsch K., J. Colloid Interface Sci., 92 (1983) 243.[47] Lewandowski E. P., Cavallaro M., Botto L., Bernate J. C., Garbin V. and
Stebe K. J., Langmuir, 26 (2010) 15142.
480 P. J. Yunker, T. Still and A. G. Yodh
[48] Erbil H. Y., Adv. Colloid Interface Sci., 170 (2012) 67.[49] Botto L., Lewandowski E. P., Cavallaro M. and Stebe K. J., Soft Matter, 8 (2012)
9957 Advanced Article.[50] Park B. J. and Lee D., ACS Nano, 6 (2011) 782.[51] Park B. J., Brugarolas T. and Lee D., Soft Matter, 7 (2011) 6413.[52] Park B. J. and Lee D., Soft Matter, 8 (2012) 10419.[53] Brugarolas T., Park B. J., Lee M. H. and Lee D., Adv. Funct. Mater., 21 (2011)
3924.[54] Kaz D. M., McGorty R., Mani M., Brenner M. P. and Manoharan V. N., Nat.
Mater., 11 (2012) 138.[55] Champion J. A., Katare Y. K. and Mitragotri S., Proc. Natl. Acad. Sci. U.S.A.,
104 (2007) 11901.[56] Ho C. C., Keller A., Odell J. A. and Ottewill R. H., Colloid Polym. Sci., 271
(1993) 469.[57] Stone H. A., Phys. Fluids, 7 (1995) 2931.[58] Leng J., Phys. Rev. E, 82 (2010) 021405.[59] Pauchard L., Mermet-Guyennet M. and Giorgiutti-Dauphine F., Chem. Engin.
Proc. Proc. Intensif., 50 (2011) 483.[60] Daubersies L. and Salmon J. B., Phys. Rev. E, 84 (2011) 031406.[61] Kang S. H., Wu N., Grinthal A. and Aizenberg J., Phys. Rev. Lett., 107 (2011)
177802.[62] Landau L. D., Pitaevskii L. P., Lifshitz E. M. and Kosevich A. M., Theory
of Elasticity, Third Edition: Vol. 7 (Theoretical Physics), 3rd edition (Butterworth-Heinemann) 1986.
[63] Vliegenthart G. A. and Gompper G., New J. Phys., 13 (2011) 045020.[64] Felder B., Helv. Chim. Acta, 49 (1966) 440.[65] Basavaraj M. G., Fuller G. G., Fransaer J. and Vermant J., Langmuir, 22 (2006)
6605.[66] Vella D., Aussillous P. and Mahadevan L., EPL, (2004) 212.[67] Moldenaers P. and Vermant J., Phys. Chem. Chem. Phys., 9 (2007) 6463.[68] Denkov N. D., Velev O. D., Kralchevsky P. A., Ivanov I. B., Yoshimura H. and
Nagayama K., Nature, 361 (1993) 26.[69] Hu H. and Larson R. G., J. Phys. Chem. B, 106 (2002) 1334.[70] Eral H. B., Augustine D. M., Duits M. H. G. and Mugele F., Soft Matter, 7 (2011)
4954.[71] Sommer A. P. and Rozlosnik N., Crystal Growth Design, 5 (2005) 551.[72] Faure P. and Coussot P., Phys. Rev. E, 82 (2010) 036303.[73] Clement F. and Leng J., Langmuir, 20 (2004) 6538.[74] Scheel M., Seemann R., Brinkmann M., Di Michiel M., Sheppard A.,
Breidenbach B. and Herminghaus S., Nat. Mater., 7 (2008) 189.[75] Berthier E., Warrick J., Yu H. and Beebe D. J., Lab Chip, 8 (2008) 852.[76] Cottin C., Bodiguel H. and Colin A., Phys. Rev. E, 84 (2011) 026311.[77] Kumnorkaew P., Ee Y.-K., Tansu N. and Gilchrist J. F., Langmuir, 24 (2008)
12150.[78] Prevo B. G. and Velev O. D., Langmuir, 20 (2004) 2099.[79] Denkov N., Velev O., Kralchevski P., Ivanov I., Yoshimura H. and Nagayama
K., Langmuir, 8 (1992) 3183.[80] Gu Z.-Z., Fujishima A. and Sato O., Chem. Mater., 14 (2002) 760.[81] Park S. H., Qin D. and Xia Y., Adv. Mater., 10 (1998) 1028.[82] Han W. and Lin Z., Angew. Chem. Int. Ed., 51 (2012) 1534.
Colloidal shape effects in evaporating drops 481
[83] Malaquin L., Kraus T., Schmid H., Delamarche E. and Wolf H., Langmuir, 23(2007) 11513.
[84] Ding T., Song K., Clays K. and Tung C.-H., Adv. Mater., 21 (2009) 1936.[85] Dickinson E., Curr. Opin. Colloid Interface Sci., 15 (2010) 40.[86] Vermant J., Nature, 476 (2011) 286.[87] Ulbricht M., Polymer, 47 (2006) 2217.[88] Fletcher D. A. and Mullins R. D., Nature, 463 (2010) 485.[89] Mueggenburg K. E., Lin X.-M., Goldsmith R. H. and Jaeger H. M., Nat. Mater.,
6 (2007) 656.[90] Deegan R. D., Phys. Rev. E, 61 (2000) 475.[91] Nguyen V. X. and Stebe K. J., Phys. Rev. Lett., 88 (2002) 164501.[92] Truskett V. N. and Stebe K. J., Langmuir, 19 (2003) 8271.[93] Zhang N. and Yang W.-J., J. Heat Trans., 104 (1982) 656.[94] Savino R., Paterna D. and Favaloro N., J. Thermophys. Heat Trans., 16 (2002) 562.[95] Hu H. and Larson R. G., Langmuir, 21 (2005) 3972.[96] Ristenpart W. D., Kim P. G., Domingues C., Wan J. and Stone H. A., Phys. Rev.
Lett., 99 (2007) 234502.[97] Hu H. and Larson R. G., J. Phys. Chem. B, 110 (2006) 7090.[98] Kajiya T., Kobayashi W., Okuzono T. and doi M., J. Phys. Chem. B, 113 (2009)
15460, pMID: 19921951.[99] Still T., Yunker P. J. and Yodh A. G.,, Langmuir, 28 (2012) 4984.
[100] Goodwin J. W., Hearn J., Ho C. C. and Ottewill R. H., Colloid Polym. Sci., 252(1974) 464.
[101] Okuzono T., Kobayashi M. and doi M., Phys. Rev. E, 80 (2009) 021603.[102] Poulard C. and Damman P., EPL, 80 (2007) 64001.[103] Kajiya T., Monteux C., Narita T., Lequeux F. and doi M., Langmuir, 25 (2009)
6934, pMID: 19505163.[104] Cifuentes A., Bernal J. L. and Diez-Masa J. C., Anal. Chem., 69 (1997) 4271.[105] Cui L., Zhang J., Zhang X., Huang L., Wang Z., Li Y., Gao H., Zhu S., Wang T.
and Yang B., ACS Appl. Mater. Interfaces, 4 (2012) 2775.[106] Han W. and Lin Z., Angew. Chem. Int. Ed., 51 (2012) 1534.