Cologne Academy Mathematics Department Grade 6 Math (Aligned Text: Holt McDougal Mathematics: Course 2) Core Knowledge Curriculum – 100% Aligned Adopted: 08/2014 Board Approved: 08/28/2014 Updated: 08/20/2016
Transcript
Page | 0
Cologne Academy
Mathematics Department
Grade 6 Math (Aligned Text: Holt McDougal Mathematics: Course 2)
Core Knowledge Curriculum – 100% Aligned
Adopted: 08/2014
Board Approved: 08/28/2014
Updated: 08/20/2016
Page | 1
Table of Contents
Math Department Lesson Plan Essentials ....................................................................................................................................................................................................... 2
Units and Pacing Charts
Unit 1 Overview: Number Forms & Locations, Factors & Multiples ..................................................................................................................................................... 3
Unit 3 Overview: 2D, 3D, Angles & Time ...................................................................................................................................................................................................... 15
Unit 4 Overview: Data Analysis, Probability & Core Knowledge ........................................................................................................................................................ 21
Highlighted items indicate overlap of MN State Standards and the Core Knowledge Sequence.
Boxed items indicate content to be introduced post-MCAs.
Page | 2
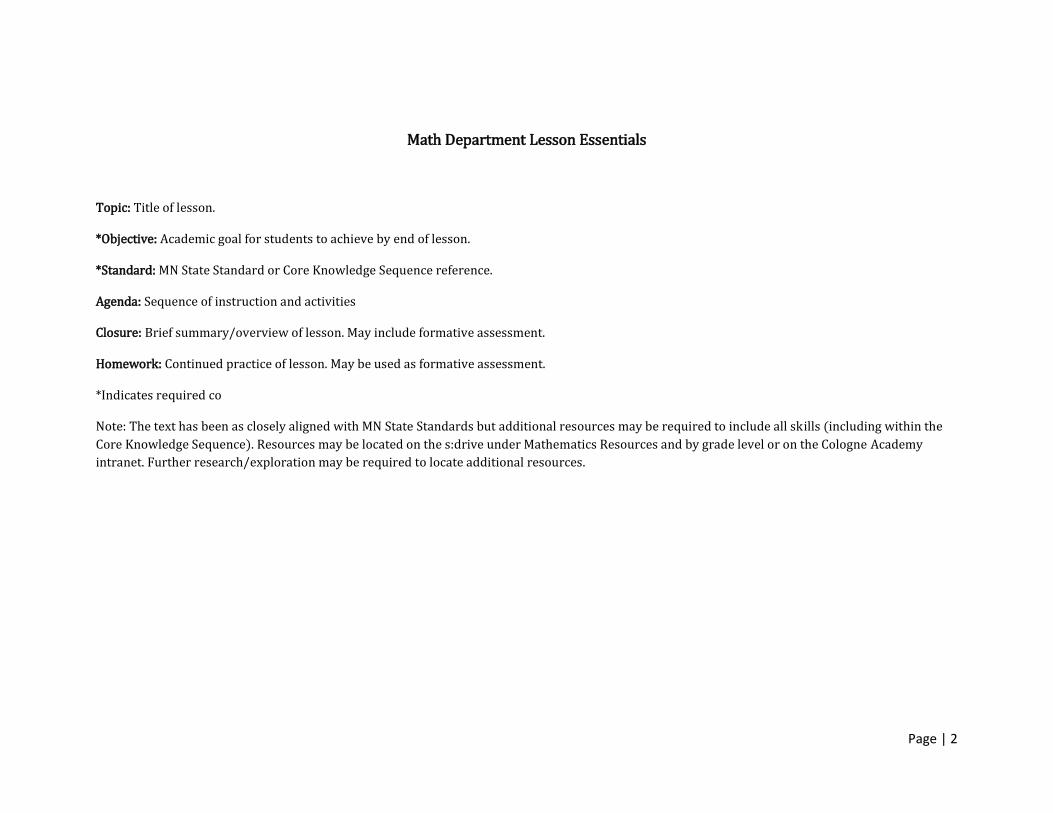
Math Department Lesson Essentials
Topic: Title of lesson.
*Objective: Academic goal for students to achieve by end of lesson.
*Standard: MN State Standard or Core Knowledge Sequence reference.
Agenda: Sequence of instruction and activities
Closure: Brief summary/overview of lesson. May include formative assessment.
Homework: Continued practice of lesson. May be used as formative assessment.
*Indicates required co
Note: The text has been as closely aligned with MN State Standards but additional resources may be required to include all skills (including within the
Core Knowledge Sequence). Resources may be located on the s:drive under Mathematics Resources and by grade level or on the Cologne Academy
intranet. Further research/exploration may be required to locate additional resources.
Page | 3
Overview
Strand(s): Number & Operation
Unit 1: Number Forms & Locations, Factors & Multiples
Approximate Duration of Study: 7 FULL Weeks of Instruction
MNSS Knowledge Skills
Review
Read and write numbers (in digits and words) up to the trillions. Recognize place value up to hundred-billions. Round to the nearest ten, hundred, thousand, hundred thousand, and million. Orders of Operations (PEMDAS), with and without a calculator. Exponents Powers of Ten Write numbers in expanded notation using exponents (include example)
Graphing
6.1.1.1 6.1.1.2
Students will know that: Every rational number can be expressed as the ratio of two
integers (where the denominator is not equal to 0). The sum of an integer and its opposite is 0. Every rational number can be expressed as a terminating decimal
or repeating decimal.
Coordinate Grid is made up of a horizontal number line, the x-axis, and a vertical number line, the y-axis that intersects at one point, the origin.
An Ordered Pair is a pair of numbers that can be used to locate a point on a coordinate plane.
o The positive x-coordinate is units to the right of 0, the positive y-coordinate is units up from 0.
Student will be able to: Classify numbers according the Real Number Set.
o Rational, Integer, Whole, Natural. Locate positive rational numbers on a number line. Compare integers using <, >, =. Add and subtract positive and negative integers. Multiply and divide positive and negative integers.
Plot pairs of positive rational numbers on a coordinate
grid. Identify ordered pairs on a coordinate plane. Plot points on a coordinate plane, using ordered pairs of
positive and negative whole numbers. Use the terms origin, x-axis, and y-axis.
LCM & GCF
6.1.1.6 6.1.1.5
Students will know that: The Greatest Common Factor (GCF) of two or more whole
numbers is the greatest whole number that divides evenly into each number.
The Least Common Multiple (LCM) of two or more whole numbers is the common multiple with the least value.
A power consists of a base and its exponent. The exponent tells
Student will be able to: Determine the GCF and LCM of given values. Find equivalent fractions. Add and subtract fraction with like and unlike
denominators. Read and evaluate numerical expressions with
Unit 1
Page | 4
how many times to use the base as a factor. o 53 = 5 ∙ 5 ∙ 5
A prime number is a whole number greater than 1 that has exactly two factors, one and itself.
A composite number is a whole number that has more than two factors.
Prime Factorization is written in ascending order according to the value of the base.
exponents. Find the square and square root of given values. Find the cube and cube root of given values.
Determine whether a number is prime or composite.
Show the prime factorization of given numbers. o 24 = 6 ∙ 4 = 2 ∙ 3 ∙ 2 ∙ 2 = 23 ∙ 3
Percents Decimals & Fractions
6.1.1.4
(Fractions & Decimals only)
6.1.1.3 6.1.1.4
(Percents)
6.1.3.2 6.1.3.1 6.1.3.3
Students will know that: Fractions can be written as decimals by dividing the numerator
of a given fraction by the denominator. Per Centum: out of 100. A percent represents a ratio to 100 or a part out of 100.
The multiplication is the inverse operation of division and vice
Student will be able to: Convert between fractions and decimals. Compare positive rational numbers represented in
various forms, using <, >, and =.
o 1
2 > 0.36
Compare and order whole numbers, mixed numbers,
fractions and decimals, using <, >, =. Select among appropriate representations to solve
problems. Add and subtract fractions and decimals, both positive
and negative.
Model percents. Write percents as equivalent fractions and decimals.
o 75% corresponds to the ratio 75 to 100, which is equivalent to the ratio 3 to 4.
Select among appropriate representations to solve problems.
Multiply and divide decimals and fractions, positive and
Unit 1
Page | 5
Equivalence
6.1.1.7 6.1.3.4 6.1.3.5
versa.
o Just as 12
4 = 3 means 12 = 3 ∙ 4,
2
3 ÷
4
5 =
5
6 means
5
6 ∙
4
5=
2
3 .
Decimals must be removed from the divisor by multiplying by the least power of ten that will make the divisor an integer. The dividend must also be multiplied by the same power of ten to keep the problem equivalent.
When multiplying fractions, the numerator of the first fraction must be multiplied by the numerator of the second fraction; similarly for the denominators.
To find the reciprocal of a fraction, switch the positions of the numerator and denominator.
When dividing fractions, keep the first fraction, change the operation to multiplication and find the reciprocal of the second fraction and follow rules for multiplying fractions.
Numbers (decimals/fractions) must be in the same form to perform multiplication and division.
o 0.75 ∙ 2
5 = 0.75 ∙ 0.4 = 0.3
o 0.75 ÷ 2
5 =
3
4 ÷
2
5 =
3
4 ∙
5
2 =
15
8 =1
7
8
Numbers can be represented in different, equivalent forms. Decimals, fractions and mixed numbers can be used to represent
situations in the real world. Non-exact values of given numbers can be used to make
predictions and check solutions when solving problems.
negative. Multiply multi-digit factors, with and without a
calculator. Divide multi-digit dividends by up to three-digit divisors,
with and without a calculator. Estimate a product and quotient. Multiply with integers, positive and negative.
Show different equivalent representations of a given
positive, rational number. Solve real world problems using decimals, fractions and
mixed numbers.
Estimate solutions to problems with whole number, fractions and decimals.
Use estimates to assess reasonableness of results.
Essential Vocabulary: Real Numbers: Rational, Integer, Whole, Natural, Terminating Decimal, Repeating Decimal, Ratio, Coordinate Grid (Plane), X-Axis, Y-Axis, Coordinate Pair, Ordered Pair, X-Coordinate, Y-Coordinate, Per Centum, Percent, Inverse Operation, Divisor, Dividend, Quotient, Reciprocal, Greatest Common Factor, Factor, Least Common Multiple, Multiple, Prime, Composite, Prime Factorization, Power, Base, Exponent, Ascending, Descending, Value, Equivalent. Prime Factorization.
Interim 1
Pacing Chart
Unit 1
Page | 6
Unit 1: Number Forms & Locations, Factors & Multiples
Time Frame Topic Suggested Activities/Assessments Resources & Text Alignment
Week 1 Pre-test & Review
Week 1 – Week 2
Graphing
6.1.1.1 6.1.1.2
Each chapter contains diagnostic quizzes, labs for further concept exploration, problem solving and real world connections. Chapters also include study guides, ideas for integrating reading and writing in math, games and projects. Use corresponding Know-It Notebooks, Lab Activities, Assessment Resources and Intervention & Enrichment for each chapter (provided to teachers).
HM Course 2 9-7 Extension: Identifying and Graphing Irrational Numbers (focus: classification of numbers) S:MathematicsResources:Grade6:RationalNumberWS 2-11: Comparing and Ordering Rational Numbers 2-2: Adding Integers 2-3: Subtracting Integers 2-4: Multiplying and Dividing Integers 5-1: The Coordinate Plane Extension (Optional) 5-2: Interpreting Graphs
Week 3 – Week 4
LCM & GCF
6.1.1.6 6.1.1.5
Each chapter contains diagnostic quizzes, labs for further concept exploration, problem solving and real world connections. Chapters also include study guides, ideas for integrating reading and writing in math, games and projects. Use corresponding Know-It Notebooks, Lab Activities, Assessment Resources and Intervention & Enrichment for each chapter (provided to teachers).
HM Course 2 2-7: Greatest Common Factor 2-8: Least Common Multiple 9-7: Squares and Square Roots 2-6: Prime Factorization
Week 5 – Week 8
Percents Decimals & Fractions
6.1.1.4
(Fractions & Decimals only)
6.1.1.3 6.1.1.4
(Percents)
6.1.3.2 6.1.3.1
Each chapter contains diagnostic quizzes, labs for further concept exploration, problem solving and real world connections. Chapters also include study guides, ideas for integrating reading and writing in math, games and projects. Use corresponding Know-It Notebooks, Lab Activities, Assessment Resources and Intervention & Enrichment
HM Course 2 2-9: Equivalent Fractions and Mixed Numbers 2-10: Equivalent Fractions and Decimals 2-11: Comparing and Ordering Rational Numbers 3-1: Estimating with Decimals 3-2: Adding and Subtracting Decimals 3-3: Multiplying Decimals 3-4: Dividing Decimals 3-6: Estimating with Fractions 3-7: Adding and Subtracting Fractions
Unit 1
Page | 7
Equivalence
6.1.1.7 6.1.3.4 6.1.3.5
for each chapter (provided to teachers). 3-8: Adding and Subtracting Mixed Numbers 3-9: Multiplying fractions and Mixed Numbers 3-10: Dividing Fractions and Mixed Numbers 6-1: Percents 6-2: Fractions, Decimals, and Percents 6-3: Estimating with Percents
Week 9 Review
Week 10 Interim 1
Unit 1
Page | 8
Overview
Strand(s): Number & Operation, Algebra
Unit 2: Ratio, Variables, Patterns & PEMDAS
Approximate Duration of Study: 8 FULL Weeks of Instruction
MNSS Knowledge Skills
Ratios & Rates
6.1.2.1 6.1.2.2 6.1.2.3 6.1.2.4
Students will know that: A ratio is the comparison of two quantities of the same unit. Ratios can be expressed as part-to-part, part-to-whole, or whole-
to-part relationships. Comparing quantities using ratios is not the same as comparing
quantities using subtraction. o In a classroom with 15 boys and 10 girls, compare the
numbers by subtracting (there are 5 more boys than girls) or dividing (there are 1.5 times as many boys as girls). The comparison using division may be expressed as a ratio of boys to girls (3 to 2 or 3:2 or 1.5 to 1).
A rate is ratio that compares to two quantities of different units. A unit rate is a rate whose denominator is 1.
Student will be able to: Identify and use ratios to compare quantities. Identify ratios in various contexts and represent them in
multiple ways; Use the relationships between ratios, equivalent
fractions, and percents to solve a variety of problems, including those involving mixtures and concentrations.
o If 5 cups of trail mix contains 2 cups of raisins, the ratio of raisins to trail mix is 2 to 5. This ratio
corresponds to the fact that the raisins are 2
5 of
the total, or 40% of the total. o If one trail mix consists of 2 parts peanuts to 3
parts raisins, and another consists of 4 parts peanuts to 8 parts raisins, then the first mixture has a higher concentration of peanuts.
Determine the rate for ratios of quantities with different
units. Determine unit rates.
o 60 miles for every 3 hours is equivalent to 20 miles for every one hour (20 mph)
Solve ratio and rate problems. o If 5 items cost $3.75, and all items are the same
price, then 1 item cost 75 cents, so 12 items cost $9.00.
Unit 2
Page | 9
Variables and Patterns
6.2.1.1 6.2.1.2
Students will know that: Understand that a variable can be used to represent a quantity
that can change, often in relationship to another changing quantity.
The relationship between two varying quantities can be
represented with function rules, graphs and tables.
Student will be able to: Evaluate algebraic expressions.
o Find the value for an expression, given replacement values for the variables. For
example: what is 7
𝑥−𝑦 when x = 2, y = 10?
Use variables to represent an unknown quantity o If a student earns $7 an hour in a job, the
amount of money earned can be represented by a variable and is related to the number of hours worked, which also can be represented by a variable.
Evaluate algebraic expressions at specified values of their variables.
o What is 7 – c if c is 3.5?
Translate between rules, graphs and tables. Derive formulas for given numerical and pictorial
patterns. o Describe the terms in the sequence of perfect
squares t = 1, 4, 9, 16, … by using the rule t = n2 for n = 1, 2, 3, 4, …
Coordinate Plane
Core
Knowledge
Students will know that: The Coordinate Plane is flat plane divided into four quadrants by
lines known as the x-axis and the y-axis. The x-axis runs horizontally, the y-axis runs vertically. Points, coordinate pairs, are plotted on the coordinate plane by a
using a unique value of x and y: (x, y). The origin is the point at the very center of the coordinate plane;
located at (0, 0).
Student will be able to: Graph simple functions (equations) and solve problems
involving the use of a coordinate plane.
Properties & PEMDAS
6.2.2.1 6.2.3.2 6.2.3.1
Students will know that: Properties of Algebra can be used to generate equivalent
expressions. o Commutative: a ∙ b = b ∙ a; a + b = b + a
o Associative: (a ∙ b) ∙ c = a ∙ (b ∙ c);
(a + b) + c = a + (b + c)
o Distributive: ab – ac = a(b – c);
ab + ac = a(b + c)
Student will be able to: Justify procedures used to simplify algebraic and
numerical expressions. Simplify expression with variables by combining like
terms. Use distributive property to multiply multi-digit factors. Understand the use of distributive property in variable
expressions such as: 2x(2y + 3).
Unit 2
Page | 10
The Order of Operations dictates the order in which basic
operations, including raising a positive rational number to whole-number exponents, should be performed.
Order of operations must be performed properly to simplify an expression when using a calculator or other technology.
Properties of Equality are used to solve for the value of a variable.
o Addition, Subtraction, Multiplication, and Division Properties of Equality.
o Additive Inverse: a + (-a) = 0
o Multiplicative Inverse: a ∙ 1
𝑎 = 1
Addition and subtractive are inverse operations. Number sense, properties of equality and the idea of maintaining
equality on both sides of an equal sign is used to solve equations. Key words in word problems determine whether an algebraic
equation or inequality must be constructed and solved. Real-world & mathematical situations can be represented using
equations and inequalities involving variables and positive rational numbers.
Apply the associative, commutative, and distributive properties to generate equivalent expressions and to solve problems involving positive rational numbers.
o 32
15 ∙
5
6=
32 ∙ 5
15 ∙6=
2 ∙16 ∙5
3 ∙5 ∙3 ∙2 =
16
9 ∙
2
2 ∙
5
5=
16
9
o 1
2+
1
3(
9
2−
15
8) =
1
2+
1
3 ∙
9
2−
1
3∙
15
8 =
1
2+
3
2−
5
8=
2 − 5
8= 1
3
8
Apply order of operations to generate equivalent
expressions and to solve problems involving positive rational numbers.
Add, subtract, multiply and divide positive and negative rational numbers that are integers, fractions, and terminating decimals.
Express powers as whole numbers solutions. Solve equations involving positive rational numbers. Recognize uses of variables and solve linear equations in
one variable. Interpret a solution in the original context. Assess reasonableness of results.
o A cellular phone company charges $0.12 per minute. If the bill was $11.40 in April, how many minutes were used?
Solve word problems with multiple steps. Solve word problems by assigning variables to unknown
quantities, writing appropriate equations and solving them.
Translate between words and mathematical sentences. Represent unknown quantities with a variable. Use given information to set up and solve an equation or
inequality. o The number of miles m in a k kilometer race is
represented by the equation m = 0.62k.
Unit 2
Page | 11
Ratio & Proportions
Core
Knowledge
Students will know that: A ratio is a comparison between two quantities. Proportions can be set up and used to solve problems involving
ratios. o A proportion is an equation stating that two ratios are
equivalent. A proportion can be used to solve percent problems.
o % (𝑃𝑎𝑟𝑡)
100 (𝑊ℎ𝑜𝑙𝑒) =
𝑃𝑎𝑟𝑡
𝑊ℎ𝑜𝑙𝑒
Similar Figures have the same shape but not necessarily the same
size. o Corresponding angles in similar figures have the same
measure. o Corresponding sides in similar figures are proportional.
Student will be able to: Use ratios and proportions to interpret map scales. Use ratios and proportions to interpret scale drawings. Solve proportions with one unknown. Solve word problems using proportions. Justify the use of cross-products to solve proportions.
Set up and solve proportions from similar triangles.
Percent Problems
6.1.3.3
Understand that a percent must be converted to a fraction or a decimal in order to multiply or divide;
An equation can be created, to solve a percent problem, depending on the unknown value.
The percent equation is p ∙ q = r. o If the percent is unknown, solve p ∙ q = r for p. o If the whole (quantity) is unknown, solve p ∙ q = r for q. o If the part (result) is unknown, solve p ∙ q = r.
Calculate the percent of a number. Determine what percent one number is of another
number. Solve problems involving percent increase and decrease. Find an unknown number when a percent of the number
is known. Use expressions with a percent greater than 100% and
less than 1% Solve percent problems in various contexts.
Essential Vocabulary: Ratio, Rate, Unit Rate, Variable, Quantity, Evaluate, Algebraic Expression, Properties of Algebra, Expression, Commutative, Associative, Distributive, Order of Operations, Equivalent Expression, Terminating Decimal, Properties of Equality, Additive Inverse, Multiplicative Inverse.
Interim 2
Unit 2
Page | 12
Pacing Chart Unit 2: Ratio, Variables, Patterns & PEMDAS
Time Frame Topic Suggested Activities/Assessments Resources & Text Alignment
Week 11 – Week 12
Ratios & Rates
6.1.2.1 6.1.2.2 6.1.2.3 6.1.2.4
Each chapter contains diagnostic quizzes, labs for further concept exploration, problem solving and real world connections. Chapters also include study guides, ideas for integrating reading and writing in math, games and projects. Use corresponding Know-It Notebooks, Lab Activities, Assessment Resources and Intervention & Enrichment for each chapter (provided to teachers).
Each chapter contains diagnostic quizzes, labs for further concept exploration, problem solving and real world connections. Chapters also include study guides, ideas for integrating reading and writing in math, games and projects. Use corresponding Know-It Notebooks, Lab Activities, Assessment Resources and Intervention & Enrichment for each chapter (provided to teachers).
HM Course 2 1-6: Variables and Algebraic Expressions 5-3: Functions, Tables and Graphs 5-4: Sequences
Coordinate Plane Core Knowledge
HM Course 2 5-5: Graphing Linear Functions Optional extension to: 5-6: Slope and Rates of Change 5-7: Slope-Intercept Form
Week 15 – Week 16
Properties & PEMDAS
6.2.2.1 6.2.3.2 6.2.3.1
Each chapter contains diagnostic quizzes, labs for further concept exploration, problem solving and real world connections. Chapters also include study guides, ideas for integrating reading and writing in math, games and projects. Use corresponding Know-It Notebooks, Lab Activities,
HM Course 2 1-4: Order of Operations 1-5: Properties of Numbers 1-8: Simplifying Algebraic Equations 1-9: Equations and Their Solutions 1-10: Solving Equations by Adding or Subtracting 1-11: Solving Equations by Multiplying or Dividing 2-5: Solving Equations Containing Integers 3-5: Solving Equations Containing Decimals
Unit 2
Page | 13
Assessment Resources and Intervention & Enrichment for each chapter (provided to teachers).
3-11: Solving Equations Containing Fractions 12-1: Solving Two-Step Equations 12-2: Solving Multi-Step Equations 12-3: Solving Equations with Variables on Both Sides 1-7: Translating Words into Math
Week 17 Winter Break 2016 - 2017
Week 18 – Week 19
Ratios & Proportions
Core Knowledge
4-8: Similar Figures and Proportions 4-9: Using Similar Figures 4-10: Scale Drawings and Scale Models
Week 19 – Week 20 Percent Problems
6.1.3.3 6-4: Percent of a Number
6-5: Solving Percent Problems 6-6: Percent of Change
Week 21 Review
Week 22 Interim 2
Unit 2
Page | 14
Overview
Strand(s): Geometry & Measurement
Unit 3: 2D, 3D, Angles & Time
Approximate Duration of Study: 7 FULL Weeks of Instruction
MNSS Knowledge Skills
Dimensional Analysis
Core Knowledge
Students will know that: The U.S. Customary System, and the Metric System are the
two must commonly used measurement systems. Equivalents lengths are found within each measurement
system. U.S. Customary System o 1 mile = 5,280 feet o 1 yard = 3 feet o 1 foot = 12 inches
Metric System o 1 kilometer = 1,000 meters o 1 meter = 100 centimeters o 1 meter = 1,000 millimeters
Converting from one unit to an equivalent unit using a
conversion factor is Dimensional Analysis.
Student will be able to: Solve problems requiring conversion of units within the U.S.
Customary System, and within the metric system. Associate prefixes used in the metric system with quantities.
o kilo = one thousand units o hecto = one hundred units o deka = ten units o deci = tenth of a unit o centi = hundredth of a unit o milli = thousandth of a unit
Weight/Capacity
6.3.3.1 6.3.3.2
Students will know that: Conversion factors can be used to move from one unit of
measure to an equivalent measure of a different unit.
Student will be able to: Use ratios to convert between measurement systems.
o Weight, volume, time or measurement. Express measurements using appropriate units. Identify equivalent ratios within a measurement system. Solve real-world and mathematical problems involving
conversion of units.
Estimate weights, capacities and geometric measurements. o Estimate the height of a house by comparing to a 6-foot
man standing nearby.
Unit 3
Page | 15
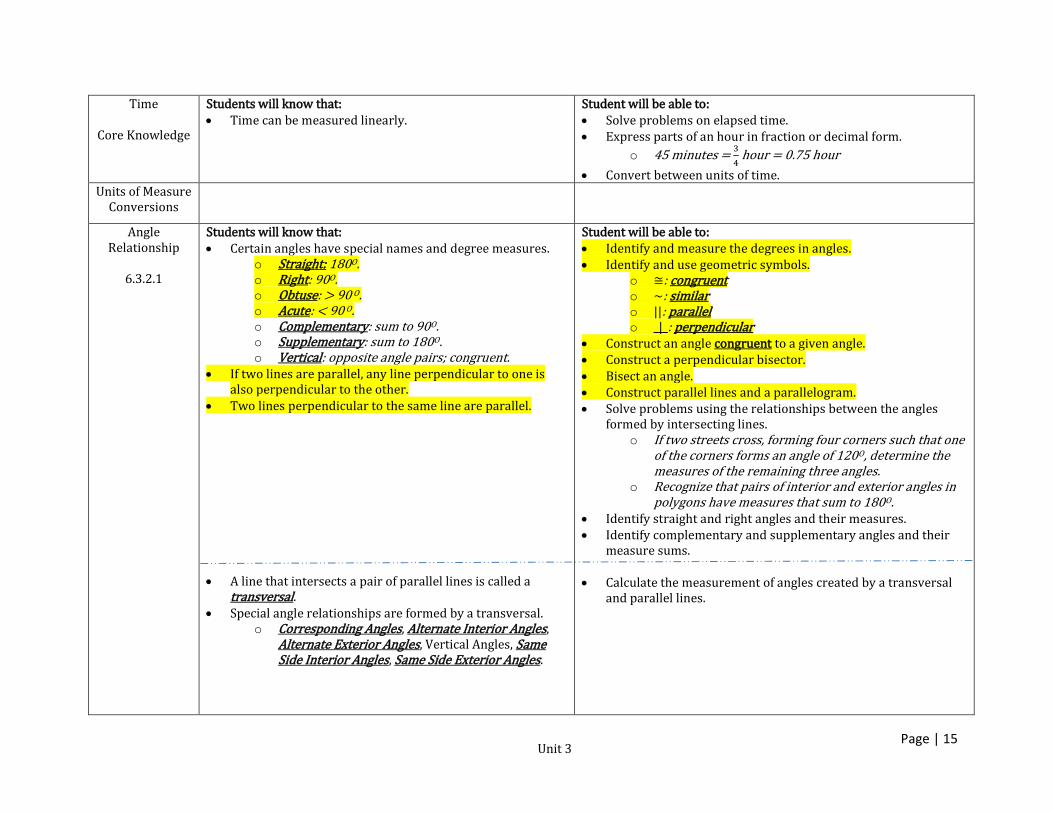
Time
Core Knowledge
Students will know that: Time can be measured linearly.
Student will be able to: Solve problems on elapsed time. Express parts of an hour in fraction or decimal form.
o 45 minutes = 3
4 hour = 0.75 hour
Convert between units of time. Units of Measure
Conversions
Angle Relationship
6.3.2.1
Students will know that: Certain angles have special names and degree measures.
o Straight: 180O. o Right: 90O. o Obtuse: > 90 O. o Acute: < 90 O. o Complementary: sum to 90O. o Supplementary: sum to 180O. o Vertical: opposite angle pairs; congruent.
If two lines are parallel, any line perpendicular to one is also perpendicular to the other.
Two lines perpendicular to the same line are parallel.
A line that intersects a pair of parallel lines is called a transversal.
Special angle relationships are formed by a transversal. o Corresponding Angles, Alternate Interior Angles,
Alternate Exterior Angles, Vertical Angles, Same Side Interior Angles, Same Side Exterior Angles.
Student will be able to: Identify and measure the degrees in angles. Identify and use geometric symbols.
o ≅: congruent o ~: similar o ||: parallel o _|_: perpendicular
Construct an angle congruent to a given angle. Construct a perpendicular bisector. Bisect an angle. Construct parallel lines and a parallelogram. Solve problems using the relationships between the angles
formed by intersecting lines. o If two streets cross, forming four corners such that one
of the corners forms an angle of 120O, determine the measures of the remaining three angles.
o Recognize that pairs of interior and exterior angles in polygons have measures that sum to 180O.
Identify straight and right angles and their measures. Identify complementary and supplementary angles and their
measure sums.
Calculate the measurement of angles created by a transversal and parallel lines.
Unit 3
Page | 16
Vertical angles are formed by a pair of intersecting lines, which cross at one point.
Identify intersecting lines and their vertical angles and their measures.
Determine the measure of all angles in a pair of intersecting lines when given the measure of one angle.
Triangles & Angles
6.3.2.2 6.3.2.3
Students will know that: Triangles are polygons with three sides and three interior
angles. The interior angles of a triangle sum to 1800. Know terms by which triangles are classified.
o By side length: equilateral, isosceles, scalene. o By angles: right, acute, obtuse.
There is a relationship between angles in geometric
figures. The sum of the interior angles of any triangles is 180O. Polygons can be decomposed into triangles. Interior angle sum for an n-sided, regular polygon:
180(n – 2) where n is the number of sides.
Student will be able to: Construct different types of triangles. Determine missing angle measures in a triangle. Use models of triangles to show the interior angle sum of
triangles is 1800. o Cut a triangle out of paper, tear of the corners and
rearrange these corners to form a straight line. o Recognize that the measures of the two acute angles in
a right triangle sum to 900. Decompose polygons into triangles. Develop the formula for the interior angle sum of regular
polygons. Use formulas to find the sums of the interior angles of any n-
sided polygon.
Area
6.3.1.2 6.3.1.3
Students will know that: A quadrilateral is any four-sided polygon.
o Squares, rectangles, rhombuses, parallelograms, trapezoids and kites.
Area applies to two-dimensional figures. Area is measured in square units. Area represents the number of square units needed to
cover a given surface. Specific two-dimensional figures have formulas for
calculating area. Area formulas can be derived by composing/decomposing
two-dimensional figures. Perimeter represents the number of units measured
around a figure.
Student will be able to: Calculate the area of quadrilaterals. Find the area and perimeter of plane figures. Given the area/perimeter find the missing dimension using
formulas. o Rectangle: A = lw; P = 2(l + w) o Square: A = s2; P = 4s
o Triangle: A = 1
2bh; P = s1 + s2 + s3
o Parallelogram: A = bh; P = 2(b + s)
Unit 3
Page | 17
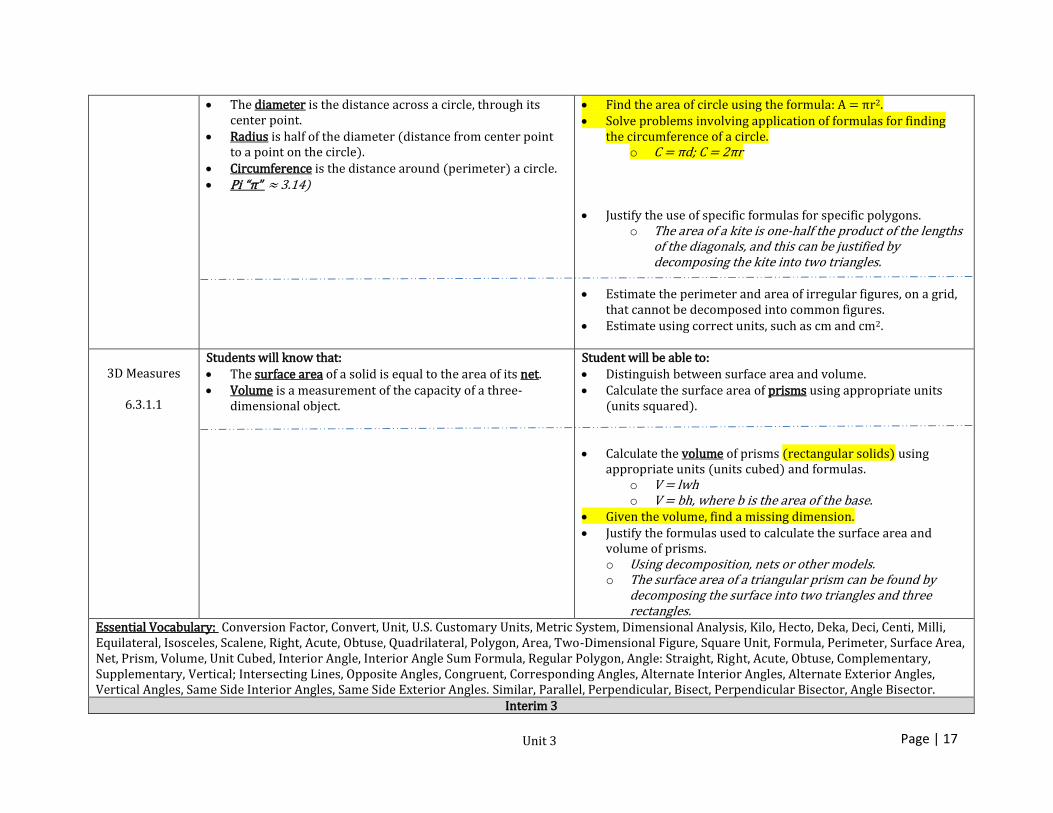
The diameter is the distance across a circle, through its center point.
Radius is half of the diameter (distance from center point to a point on the circle).
Circumference is the distance around (perimeter) a circle. Pi “π” ≈ 3.14)
Find the area of circle using the formula: A = πr2. Solve problems involving application of formulas for finding
the circumference of a circle. o C = πd; C = 2πr
Justify the use of specific formulas for specific polygons. o The area of a kite is one-half the product of the lengths
of the diagonals, and this can be justified by decomposing the kite into two triangles.
Estimate the perimeter and area of irregular figures, on a grid,
that cannot be decomposed into common figures. Estimate using correct units, such as cm and cm2.
3D Measures
6.3.1.1
Students will know that: The surface area of a solid is equal to the area of its net. Volume is a measurement of the capacity of a three-
dimensional object.
Student will be able to: Distinguish between surface area and volume. Calculate the surface area of prisms using appropriate units
(units squared). Calculate the volume of prisms (rectangular solids) using
appropriate units (units cubed) and formulas. o V = lwh o V = bh, where b is the area of the base.
Given the volume, find a missing dimension. Justify the formulas used to calculate the surface area and
volume of prisms. o Using decomposition, nets or other models. o The surface area of a triangular prism can be found by
decomposing the surface into two triangles and three rectangles.
Essential Vocabulary: Conversion Factor, Convert, Unit, U.S. Customary Units, Metric System, Dimensional Analysis, Kilo, Hecto, Deka, Deci, Centi, Milli, Equilateral, Isosceles, Scalene, Right, Acute, Obtuse, Quadrilateral, Polygon, Area, Two-Dimensional Figure, Square Unit, Formula, Perimeter, Surface Area, Net, Prism, Volume, Unit Cubed, Interior Angle, Interior Angle Sum Formula, Regular Polygon, Angle: Straight, Right, Acute, Obtuse, Complementary, Supplementary, Vertical; Intersecting Lines, Opposite Angles, Congruent, Corresponding Angles, Alternate Interior Angles, Alternate Exterior Angles, Vertical Angles, Same Side Interior Angles, Same Side Exterior Angles. Similar, Parallel, Perpendicular, Bisect, Perpendicular Bisector, Angle Bisector.
Interim 3
Unit 3
Page | 18
Pacing Chart Unit 3: 2D, 3D, Angles & Time
Time Frame Topic Suggested Activities/Assessments Resources & Text Alignment
Week 23
Dimensional Analysis
Core Knowledge
Each chapter contains diagnostic quizzes, labs for further concept exploration, problem solving and real world connections. Chapters also include study guides, ideas for integrating reading and writing in math, games and projects. Use corresponding Know-It Notebooks, Lab Activities, Assessment Resources and Intervention & Enrichment for each chapter (provided to teachers).
HM Course 2 4-7: Dimensional Analysis Supplement with additional resources to meet Core Knowledge Sequence Requirements.
Week 23
Weight/Capacity
6.3.3.1 6.3.3.2
Each chapter contains diagnostic quizzes, labs for further concept exploration, problem solving and real world connections. Chapters also include study guides, ideas for integrating reading and writing in math, games and projects. Use corresponding Know-It Notebooks, Lab Activities, Assessment Resources and Intervention & Enrichment for each chapter (provided to teachers).
Supplement with resources to meet Core Knowledge Sequence Requirements.
Week 24 Units of Measure
Conversions
Week 25
Angle Relationship
6.3.2.1
Each chapter contains diagnostic quizzes, labs for further concept exploration, problem solving and real world connections. Chapters also include study guides, ideas for integrating reading and writing in math, games and projects.
HM Course 2 8-2: Classifying Angles 8-3: Line and Angle Relationships
Unit 3
Page | 19
Use corresponding Know-It Notebooks, Lab Activities, Assessment Resources and Intervention & Enrichment for each chapter (provided to teachers).
Week 25
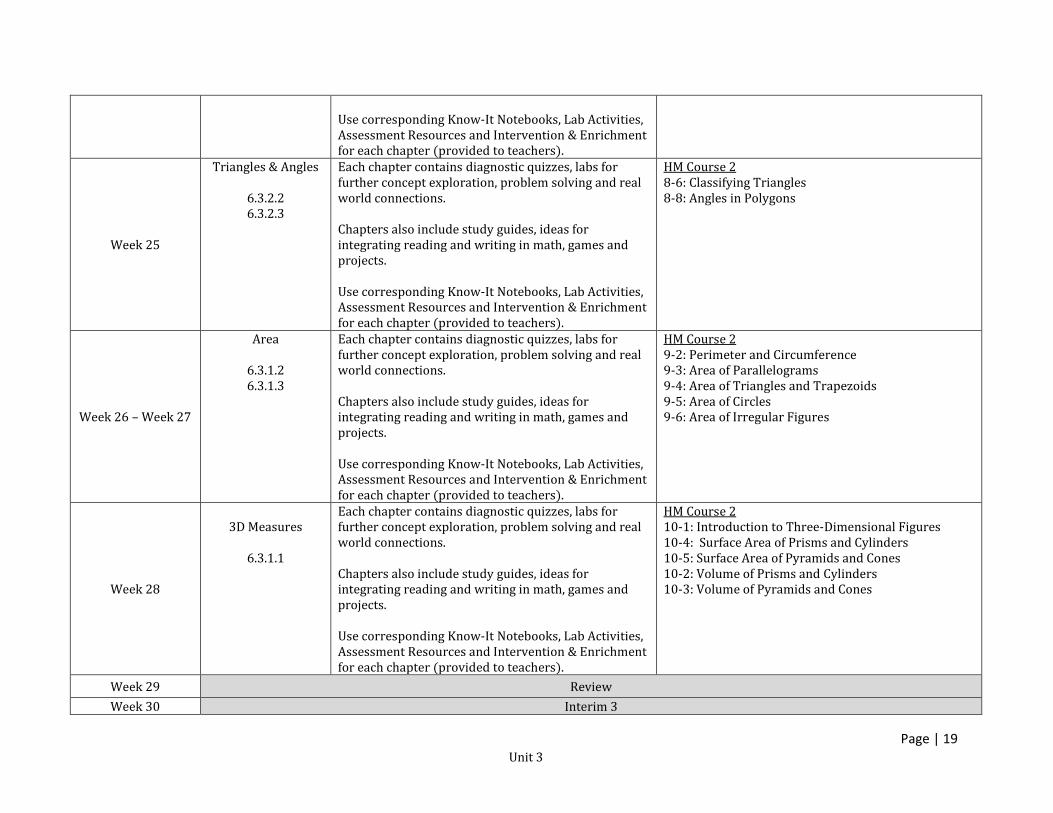
Triangles & Angles
6.3.2.2 6.3.2.3
Each chapter contains diagnostic quizzes, labs for further concept exploration, problem solving and real world connections. Chapters also include study guides, ideas for integrating reading and writing in math, games and projects. Use corresponding Know-It Notebooks, Lab Activities, Assessment Resources and Intervention & Enrichment for each chapter (provided to teachers).
HM Course 2 8-6: Classifying Triangles 8-8: Angles in Polygons
Week 26 – Week 27
Area
6.3.1.2 6.3.1.3
Each chapter contains diagnostic quizzes, labs for further concept exploration, problem solving and real world connections. Chapters also include study guides, ideas for integrating reading and writing in math, games and projects. Use corresponding Know-It Notebooks, Lab Activities, Assessment Resources and Intervention & Enrichment for each chapter (provided to teachers).
HM Course 2 9-2: Perimeter and Circumference 9-3: Area of Parallelograms 9-4: Area of Triangles and Trapezoids 9-5: Area of Circles 9-6: Area of Irregular Figures
Week 28
3D Measures
6.3.1.1
Each chapter contains diagnostic quizzes, labs for further concept exploration, problem solving and real world connections. Chapters also include study guides, ideas for integrating reading and writing in math, games and projects. Use corresponding Know-It Notebooks, Lab Activities, Assessment Resources and Intervention & Enrichment for each chapter (provided to teachers).
HM Course 2 10-1: Introduction to Three-Dimensional Figures 10-4: Surface Area of Prisms and Cylinders 10-5: Surface Area of Pyramids and Cones 10-2: Volume of Prisms and Cylinders 10-3: Volume of Pyramids and Cones
Week 29 Review
Week 30 Interim 3
Unit 3
Page | 20
Overview
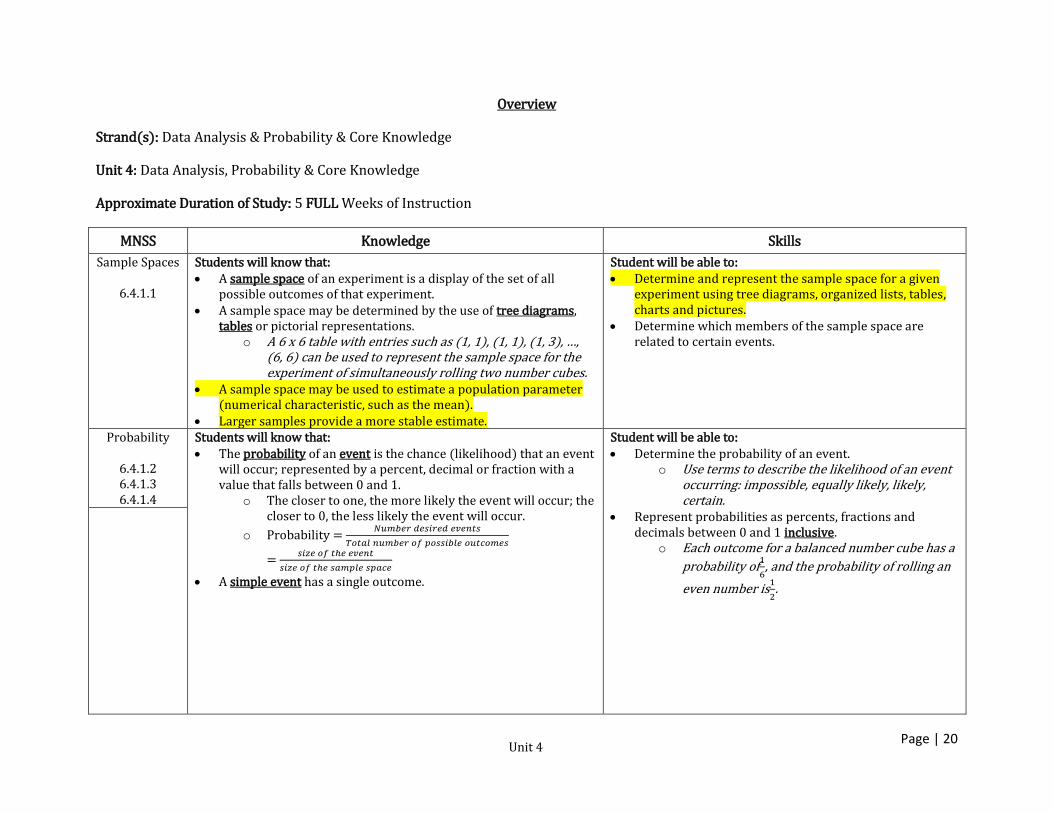
Strand(s): Data Analysis & Probability & Core Knowledge
Unit 4: Data Analysis, Probability & Core Knowledge
Approximate Duration of Study: 5 FULL Weeks of Instruction
MNSS Knowledge Skills
Sample Spaces
6.4.1.1
Students will know that: A sample space of an experiment is a display of the set of all
possible outcomes of that experiment. A sample space may be determined by the use of tree diagrams,
tables or pictorial representations. o A 6 x 6 table with entries such as (1, 1), (1, 1), (1, 3), …,
(6, 6) can be used to represent the sample space for the experiment of simultaneously rolling two number cubes.
A sample space may be used to estimate a population parameter (numerical characteristic, such as the mean).
Larger samples provide a more stable estimate.
Student will be able to: Determine and represent the sample space for a given
experiment using tree diagrams, organized lists, tables, charts and pictures.
Determine which members of the sample space are related to certain events.
Probability
6.4.1.2 6.4.1.3 6.4.1.4
Students will know that: The probability of an event is the chance (likelihood) that an event
will occur; represented by a percent, decimal or fraction with a value that falls between 0 and 1.
o The closer to one, the more likely the event will occur; the closer to 0, the less likely the event will occur.
o Probability = 𝑁𝑢𝑚𝑏𝑒𝑟 𝑑𝑒𝑠𝑖𝑟𝑒𝑑 𝑒𝑣𝑒𝑛𝑡𝑠
𝑇𝑜𝑡𝑎𝑙 𝑛𝑢𝑚𝑏𝑒𝑟 𝑜𝑓 𝑝𝑜𝑠𝑠𝑖𝑏𝑙𝑒 𝑜𝑢𝑡𝑐𝑜𝑚𝑒𝑠
= 𝑠𝑖𝑧𝑒 𝑜𝑓 𝑡ℎ𝑒 𝑒𝑣𝑒𝑛𝑡
𝑠𝑖𝑧𝑒 𝑜𝑓 𝑡ℎ𝑒 𝑠𝑎𝑚𝑝𝑙𝑒 𝑠𝑝𝑎𝑐𝑒
A simple event has a single outcome.
Student will be able to: Determine the probability of an event.
o Use terms to describe the likelihood of an event occurring: impossible, equally likely, likely, certain.
Represent probabilities as percents, fractions and decimals between 0 and 1 inclusive.
o Each outcome for a balanced number cube has a
probability of1
6, and the probability of rolling an
even number is1
2.
Unit 4
Page | 21
Relative Frequency of an event is the ratio of the actual occurrences of the event to the total number of trials.
o Relative Frequency = 𝑁𝑢𝑚𝑏𝑒𝑟 𝑜𝑓 𝑜𝑐𝑐𝑢𝑟𝑟𝑒𝑛𝑐𝑒𝑠
𝑇𝑜𝑡𝑎𝑙 𝑛𝑢𝑚𝑏𝑒𝑟 𝑜𝑓 𝑡𝑟𝑖𝑎𝑙𝑠
Probability may not always match relative frequency of a data set. o The more trials, the closer relative frequency will be to
probability. Disjoint events are events that cannot occur simultaneously. They
are mutually exclusive. o Turning left and right are disjoint events.
The probability of disjoint events is the sum of their individual probabilities.
Theoretical Probability represents what is expected occur. Experimental Probability represents what actually occurs during
an experiment. Data can be collected and represented in a variety of displays.
o A histogram is used to display data in intervals. o A frequency chart is used to keep track of often a piece of
data occurs.
Perform experiments for which probabilities are known and collect data.
Compare probability to relative frequency. o Heads and tails are equally likely when flipping
a fair coin, but if several different students flipped fair coins 10 times, it is likely that they will find a variety of relative frequencies of heads and tails.
Compute the probability of any one of a set of disjoint
events. Calculate experimental probabilities from experiments. Represent experimental probability as a fraction,
decimal and percent between 0 and 1 inclusive. Calculate theoretical probability. Compare experimental and theoretical probability. Use experimental probability to make predictions when
theoretical probabilities are unknown. o Repeatedly draw colored chips with
replacement from a bag with an unknown mixture of chips, record relative frequencies, and use the results to make predictions about the contents of the bag.
Use probabilities to make decisions. Use probabilities to solve real world and mathematical
problems.
Construct a histogram using frequency chart. Solve problems requiring the interpretation and
application of graphically displayed data.
Page | 22
Dispersion and Central Tendency
Core
Knowledge
Students will know that: Mean, median and mode are Measures of Central Tendency.
o Mean: the average of a set of data. o Median: the middle number in a set of data. o Mode: the most frequent number in a set of data.
Range is a Measure of Dispersion. o Range: In a set of data, the lowest value subtracted from
the greatest value. The mean is used to describe the middle of a set that does not
include an outlier. Also used to compare data but affected by outliers.
The median describes the middle of a set that does have an outlier. Used to compare data and not affected by outliers.
The mode is used to describe the most popular item. There may be more than one mode or, if not value repeats, all data in the set is considered the mode. Outliers do not affect this measure.
Student will be able to: Find the range and measures of central tendency given a
set of data. Describe the differences among the measures of central
tendency and when each might be used.
Corresponding Parts
Core
Knowledge
Students will know that: Transformations may alter the size, position, or location of a figure
on the coordinate plane. o Translation: slide o Reflection: flip o Rotation: turn
Transformations result in congruent or similar figures. The line of symmetry is an imaginary line where an image can be
folded and both resulting halves are exactly the same.
Student will be able to: Construct a figure congruent to a given figure by
reflecting over a line of symmetry. Identify corresponding parts. Show how congruent plane figures can be made to
correspond through reflection, rotation and translations. Identify congruent angles, sides and axes (lines) of
symmetry in parallelograms, rhombuses, rectangles and squares.
Circles
Core Knowledge
Students will know that: A circle is a line forming a closed loop; every point on the line is of
equal distance from the center point. An arc is a small portion of the circumference of a circle. A chord is any line that connects two points on a circle. A compass is used to draw circles.
Student will be able to: Identify arc, chord, radius (radii), and diameter. Use a compass to draw circles with a given diameter or
radius.
Essential Vocabulary: Sample Space, Tree Diagram, Histogram, Frequency Chart, Table, Probability, Event, Simple Event, Relative Frequency, Theoretical Probability, Experimental Probability, Inclusive, Disjoint Event, Mutually Exclusive, Measure of Central Tendency, Mean, Median, Mode, Measure of Dispersion, Range, Coordinate Plane, Quadrants, X-Axis, Y-Axis, Coordinate Pair, Ordered Pair, Plot, Origin, Function, Transformation, Translation, Reflection, Rotation, Line of Symmetry, Circle, Arc, Chord, Compass.
Interim 4
Unit 4
Page | 23
Pacing Chart Unit 4: Data Analysis, Probability & Core Knowledge
Time Frame Topic Suggested Activities/Assessments Resources & Text Alignment
Week 31
Sample Spaces
6.4.1.1
Each chapter contains diagnostic quizzes, labs for further concept exploration, problem solving and real world connections. Chapters also include study guides, ideas for integrating reading and writing in math, games and projects. Use corresponding Know-It Notebooks, Lab Activities, Assessment Resources and Intervention & Enrichment for each chapter (provided to teachers).
HM Course 2 11-3: Sample Spaces 7-3: Bar Graphs and Histograms
Week 32
Probability
6.4.1.2 6.4.1.3 6.4.1.4
Each chapter contains diagnostic quizzes, labs for further concept exploration, problem solving and real world connections. Chapters also include study guides, ideas for integrating reading and writing in math, games and projects. Use corresponding Know-It Notebooks, Lab Activities, Assessment Resources and Intervention & Enrichment for each chapter (provided to teachers).
HM Course 2 11-1: Probability 11-2: Experimental Probability 11-4: Theoretical Probability 11-5: Making Predictions 11-6: Probability of Independent and Dependent Events Extend to Disjoint/Mutually Exclusive events.
Week 32
Dispersion and Central
Tendency
Core Knowledge
Each chapter contains diagnostic quizzes, labs for further concept exploration, problem solving and real world connections. Chapters also include study guides, ideas for integrating reading and writing in math, games and projects.
HM Course 2 7-2: Mean, Median, Mode and Range
Week 33 Spring Break 2016 – 2017
Week 34 Mathematics MCAs
Unit 4
Page | 24
Week 35
Corresponding Parts
Core Knowledge
Each chapter contains diagnostic quizzes, labs for further concept exploration, problem solving and real world connections. Chapters also include study guides, ideas for integrating reading and writing in math, games and projects. Use corresponding Know-It Notebooks, Lab Activities, Assessment Resources and Intervention & Enrichment for each chapter (provided to teachers).
Each chapter contains diagnostic quizzes, labs for further concept exploration, problem solving and real world connections. Chapters also include study guides, ideas for integrating reading and writing in math, games and projects. Use corresponding Know-It Notebooks, Lab Activities, Assessment Resources and Intervention & Enrichment for each chapter (provided to teachers).