Springer is collaborating with JSTOR to digitize, preserve and extend access to Behavioral Ecology and Sociobiology. http://www.jstor.org Colony Founding by Pleometrosis in the Fire Ant, Solenopsis invicta Author(s): Walter R. Tschinkel and Dennis F. Howard Source: Behavioral Ecology and Sociobiology, Vol. 12, No. 2 (1983), pp. 103-113 Published by: Springer Stable URL: http://www.jstor.org/stable/4599566 Accessed: 03-11-2015 17:52 UTC REFERENCES Linked references are available on JSTOR for this article: http://www.jstor.org/stable/4599566?seq=1&cid=pdf-reference#references_tab_contents You may need to log in to JSTOR to access the linked references. Your use of the JSTOR archive indicates your acceptance of the Terms & Conditions of Use, available at http://www.jstor.org/page/ info/about/policies/terms.jsp JSTOR is a not-for-profit service that helps scholars, researchers, and students discover, use, and build upon a wide range of content in a trusted digital archive. We use information technology and tools to increase productivity and facilitate new forms of scholarship. For more information about JSTOR, please contact [email protected]. This content downloaded from 128.186.14.5 on Tue, 03 Nov 2015 17:52:41 UTC All use subject to JSTOR Terms and Conditions
Transcript
Springer is collaborating with JSTOR to digitize, preserve and extend access to Behavioral Ecology and Sociobiology.
http://www.jstor.org
Colony Founding by Pleometrosis in the Fire Ant, Solenopsis invicta Author(s): Walter R. Tschinkel and Dennis F. Howard Source: Behavioral Ecology and Sociobiology, Vol. 12, No. 2 (1983), pp. 103-113Published by: SpringerStable URL: http://www.jstor.org/stable/4599566Accessed: 03-11-2015 17:52 UTC
REFERENCESLinked references are available on JSTOR for this article:
You may need to log in to JSTOR to access the linked references.
Your use of the JSTOR archive indicates your acceptance of the Terms & Conditions of Use, available at http://www.jstor.org/page/ info/about/policies/terms.jsp
JSTOR is a not-for-profit service that helps scholars, researchers, and students discover, use, and build upon a wide range of content in a trusted digital archive. We use information technology and tools to increase productivity and facilitate new forms of scholarship. For more information about JSTOR, please contact [email protected].
This content downloaded from 128.186.14.5 on Tue, 03 Nov 2015 17:52:41 UTCAll use subject to JSTOR Terms and Conditions
Colony Founding by Pleometrosis in the Fire Ant, Solenopsis invicta*
Walter R. Tschinkel and Dennis F. Howard** Department of Biological Science, Florida State University, Tallahassee, Florida 32306, USA
Received July 1, 1982 / Accepted November 29, 1982
Summary. Newly mated queens of the fire ant, So- lenopsis invicta, found colonies either alone (haplo- metrosis) or by joining with other newly mated queens (pleometrosis). Surveys after mating flights showed that nests and queens were usually aggre- gated in space, that queens were aggregated among occupied nest chambers, and that the occurrence and degree of pleometrosis was related to the mean queen density. Queens and nests were strongly as- sociated with slightly higher ground, away from rainwash areas and puddles.
The effects of queen density and microtopogra- phy (small hills) on pleometrosis were tested in a two-factor factorial experiment. A 64-fold in- crease in applied queen density resulted in a 2.19-fold increase in mean queens/nest (pleometro- sis). Variation in queen density accounted for 70% of the variation in the mean queens per nest, as well as 78% of the aggregation of queens among the available nest chambers. Queen density also accounted for 86% of the aggregation of queens in area. Thus, at all densities, queens are moving into areas and nests of higher density, increasing both the local mean densities and the level of ag- gregation. Microtopography had no significant effect. Lab experiments suggest that the interac- tions leading to association take place on the sur- face.
A mechanism is proposed in which the central causal factor regulating pleometrosis is local queen density, local being one to a few square meters, and a variety of factors affect pleometrosis by their action upon the local queen density.
In the laboratory, groups of 5 foundresses pro- duce more workers than do groups of 10 or 15,
* This is publication No. 10 of the Fire Ant Research Team ** Present address: Department of Entomology, University of
Georgia, Athens, Georgia 30602, USA
or single queens. Nests founded by groups begin the growth period with about 3 times as many workers as do those founded by single queens, and the former remain about three times as large for at least the first 100 days of growth and probably more. Higher worker production rate probably confers an advantage in survival and competition throughout colony growth. These differences be- tween haplo- and pleometrotically founded nests may be among the factors favoring foundress asso- ciations.
Introduction
Social insects start new colonies in one of two basic ways (Wilson 1971). In swarming, as in honeybees and army ants, some fraction of the worker force accompanies the queen to found the new colony. This mode is uncommon among ants. In most ant species, queens found new colonies independently without the aid of workers. Usually, founding is claustral, meaning that the queen seals herself in a chamber and rears the first brood on reserves stored in her body. In some independently found- ing, claustral species queens have the option of joining other founding queens (pleometrosis), rath- er than founding alone (haplometrosis). While a number of ant species have been reported to indulge in pleometrosis facultatively (see Bartz and Holldobler (1982), for species list and references), very little is known about the factors which effect the occurrence and degree of pleometrosis. Foun- dress associations show higher survival of the claustral period and produce a larger number of workers initially, possibly conferring selective ad- vantage to pleometrosis (Mintzer 1979; Stumper 1962; Waloff 1957; Wilson 1966; Bartz and H6ll-
This content downloaded from 128.186.14.5 on Tue, 03 Nov 2015 17:52:41 UTCAll use subject to JSTOR Terms and Conditions
dobler 1982; Thorne 1982). Bartz and Holldobler have modeled the natural selection of unrelated queens founding in associations.
The fire ant, Solenopsis invicta Buren, intro- duced to the United States from Brazil, shows con- siderable complexity with respect to queen number during its life cycle. Mature colonies may be mono- gynous, polygynous or functionally monogynyous (Glancey et al. 1972; Tschinkel and Howard 1978; Fletcher et al. 1980). Colonies can be founded in haplometrosis, but pleometrosis is also common. Markin et al. (1972) reported that somewhat fewer than half the newly founded colonies were pleome- trotic and contained from 2 to 5 queens. At the end of the claustral period, all colonies contained only a single queen. Wilson (1966, 1971) also indi- cated that when several queens were introduced into queenless colony fragments the workers even- tually killed all but one. It is thus presumed that pleometrotically founded fire ant colonies are reduced to monogyny before colony growth begins in earnest.
It is the purpose of this paper to determine some of the factors which control the number of queens during colony foundation, and to gain some insight into the possible selective advantages of the observed patterns.
Materials and Methods All study sites were recently cleared, mostly flat, unvegetated construction sites within 5 miles of Tallahassee, Florida and were in the initial stages of colonization by fire ants. These sites contained no or very few active fire ant colonies. Our data are thus uncomplicated by the effects of workers killing newly mated queens which land in their colony territory (Wilson et al. 1971). Temperatures at mid-day were seldom less than 455 'C.
Location of Nest Chambers. Mating flights in S. invicta usually take place on warm mornings the day after a heavy rain (Morrill 1974). Most of the mated females are back on the ground and de-alated by mid-afternoon. Nest chamber excavation begins from a few minutes to hours after de-alation, and is usually well underway by nightfall. Once a substantial portion of the nest tunnel and chamber had been dug, the nest entrance is closed.
Founding nest chambers were easily recognized by the small crater of dirt pellets which surround the nest entrance. Because further rain could wash away these pellets, a small circle of colored paper was pinned near each nest entrance. The locations of all nests in each study site were mapped for analysis.
Nest Excavation. Nests were excavated by following the tunnel downward until the nest chamber at the bottom was reached. Queens rarely leave the nest once they are shut within the founding chamber. The dispersion of queens from a mating flight could thus be determined at some leisure by digging up nests over a period of up to about 25 days, the approximate
time when the first workers begin execution of supernumerary queens.
Nests in which no queens were found were excluded from most analyses. Queens regularly dig 'trial nests' up to 4 or 5 cm deep which they subsequently abandon.
Surveys, 1979, 1980. Rectangular plots from 52 to 168 m2 were laid out after large mating flights on May 27, June 22 and July 13 and 15, 1979 and June 10, 21, and July 7, 1980. Found- ing nests were marked, mapped and dug as described above. Soils were all sandy with varying amounts of clay.
Experiment on the Effects of Queen Density and Soil Topography 1981. A completely flat, vegetationless building site with fairly homogeneous soil (sand with some clay) was divided into 5-by- 5 meter plots. These 26 plots were used to test the effects of the density of newly mated queens and small rises in topography on pleometrosis. For topography, four small oval hills were symmetrically located in each of 13 randomly chosen plots by transporting in dirt from outside the plots.
On the afternoon of a very large mating flight on June 10, 1981, over 2,000 newly mated queens were collected at a site distant from the experimental plot. These queens were then randomly divided into four groups each of 5, 20, 80 and 320 queens, a total of almost 1,800 queens. A thin line of a mixture of equal parts of Louisiana Light, Bunker C and Kuwait Crude oil was poured along all the plot boundaries and the queens of each group were then sprinkled randomly into a plot chosen at random such that each number of queens was replicated twice with flat plots and twice with hill plots. Queens rarely if ever crossed the oil lines.
The 10 plots to which we did not add newly mated queens were used to determine the background queen density resulting from the natural mating flight. This varied from zero to 8 and averaged about 2 queens per 25 m2 plot.
The newly founded nests were marked and all plots were mapped as noted above. Digging the 770 marked nests began on June 13 and was completed June 25, well before the first minim workers were produced. The treatment groups were dug in random order.
Results
Surveys
The survey maps of 1979 and 1980 suggested that the likelihood and degree of pleometrosis is related to the local density of newly mated queens and to 'microtopography' such as small rises, dirt clods, low wet areas and so on. Figure 1 shows these associations especially clearly. In this and all subsequent analyses, three variables are derived from the maps for analyses: (1) queen density in queens/m2; (2) nest density in occupied nest/M2 (unoccupied nests or nests in which queens were not found were excluded in most analyses); (3) queen density in the nest chambers, expressed as queens/occupied nest. This is the meaningful measure of pleometrosis and is referred to hereaf- ter simply as queens/nest.
In Fig. 1, there is a very strong association be- tween the higher areas and the location of newly
This content downloaded from 128.186.14.5 on Tue, 03 Nov 2015 17:52:41 UTCAll use subject to JSTOR Terms and Conditions
HmH Fig. 1. Nest locations and queen number after the mating flight of June 10, 1980. This map of a recently cleared construction site was chosen to show the apparent effects of microtopography. Contours indicate small rises, dashed lines and arrows the path of runoff during rains, hatched areas puddles. The general slope is approximately 5% and mostly toward the southeast. Ticks represent I m. Open triangles indicate nests which were marked but a queen was not found. Nests and queens are significantly associated with higher features (P< IO 6), and queens are significantly clumped among the available nest chambers
founded nests (P<0.000001). These features are no more than a few inches higher than the sur- rounding surface, but they are high enough so that storm runoff does not inundate them. They also consist of more compacted soil, while the lower surfaces and watercourses (dashed arrows) are often soft sand and alluvium. Nest site preference could thus be for either soil characteristics or mi- crotopography or both.
A second trend seen in Fig. 1 is that the number of queens per nest is higher (up to 18) in areas containing higher concentrations of queens. It thus appears that queens may be associating in some positive relation to local queen density.
This relationship of queen density, nest density, and queens per nest is depicted on Fig. 2 where the number of queens in a square meter is plotted against the number of nests in the same square meter. Increasing queen density seldom results in more than about 5 occupied nests per square
meter, even at very high queen densities. Clearly, increasing queen density must be accomodated by an increase in the mean number of queens per nest. Figure 3 shows the frequency distribution of queens in chambers for all surveys. Mean queens/ m2 and queens/chambers are correlated.
Experiment, 1981
We tested experimentally the relationship between the density of queens and the degree of pleometro- sis. We also added a test of microtopography (sma,Kthills) to create a two by four factorial experi- ment in which two levels of topography (hills, no hills) were crossed with four levels of queen density (5, 20, 80, 320 queens per 25 m2 plot).
Analysis of variance (ANOVA) showed that the number of queens per nest was strongly related (P <0.005) to the applied density of queens (Fig. 4). Variation in the queen density accounted
This content downloaded from 128.186.14.5 on Tue, 03 Nov 2015 17:52:41 UTCAll use subject to JSTOR Terms and Conditions
Fig. 2. The number of nests found in each m2 of the surveys in relation to the number of queens in that M2. Dotted line indicates relationship if each queen had founded haplometrotically. Size of circle indicates the number of grid-units with that pair of values, the largest representing more than 50 grids, the smallest, a single grid. Shaded area simply encompasses the data points. As queen density increases, the number of queens founding pleometrotically increases, causing the number of nests to level off
Date of Flight,
50 5-27-79 5-27-79 6-22-79 7-15-79
Xa= 1.46 Xa= 0.84 Xa= 3.03 Xa= 0.19
40 5 5. 5 1
30 2.74
20-
1.95
E
o 6-10-80 7-7-80 6-21-80 oi 50, z X0=2.46 Xa= 1.01 X= 0.56
40O
3.36
20 1 3.08 1.71
10 1
5 10 15 5 10 15 5
No. Queens in Chamber
Fig. 3. Frequency distribution of queens in chambers following natural mating flights. Xa= mean queens/m2; vertical arrows indicate mean queens/chamber
for 70%0 of the variation in the queens/nest. A 64-fold increase in the number of released queens resulted in a 2.19-fold increase in the mean number of queens/nest. The average degree of pleometrosis is thus causally related to the density of queens.
4
w z
w a.
Ld
z w * w 0Y One Queen per Nest? z w
520 80 320
QUEENS RELEASED
Fig. 4. Relation of the density of queens applied to the treat- ment plots and the mean number of queens per founding nest chamber. Circles indicate the four replicates of each density. Stars and line indicate mean values. The relationship of mean queens per nest to queen density is highly significant (ANOVA; P<0.005). Microtopography has no significant effect. Dotted line indicates relationship if all queens had founded haplome- trotically
The nest density rises more slowly than the queen density, so queens must be joining with one another for colony foundation.
The second important question is, how are the queens assorting themselves among the available
This content downloaded from 128.186.14.5 on Tue, 03 Nov 2015 17:52:41 UTCAll use subject to JSTOR Terms and Conditions
Fig. 5. The aggregation (variance/mean) of queens within avail- able area and among available nest chambers, in relation to the queen density applied to experimental plots. Circles repre- sent replicates; open circles queens per nest; closed circles queens per square meter; stars and lines mean values. Clumping of queens in area and among nest chambers is significantly related to applied queen density (ANOVA; P<0.001). Dotted lines indicate significance levels for the variance-to-mean ratio for individual replicates
MACRO-SCALE: RSetion of means
4
Queens/nest
surey V \ experiment surveys S) Slope= 0.22
Siope=06 3
. ESLope=032 periment
I_-
i 21.~~~~~~~~~~~~~~~
0 5
QUEENS/Mn2
Fig. 6. Comparison of the means for nest density and queens per nest between surveys and experiment, both in relation to recovered queen density (queenS/in2). Shaded areas include all points in each group. The relationship of nest density to queen density is the same for surveys and experiments, but queens per nest responds more strongly to queen density in the surveys
nests? When the variance-to-mean ratios for the variables queens/m2 and queens/nest are plotted against the applied queen density (Fig. 5), it becomes apparent that increased queen density causes an increase in the clumping of queens, both within the available space in each plot, and among the available nest chambers. In other words, queens are aggregating in certain parts of the ex- perimental plots, and within certain nest chambers, and this aggregation is driven by increasing queen density. Analysis of variance of these two variance- to-mean ratios shows that both are significantly related to applied queen density (P<0.001), and that queen density accounts for 86 and 78% of the variation in clumping, respectively.
Variance-to-mean ratios for individual treat- ment plots indicate that clumping in area (queens/ m2) is present even in two of the plots receiving only 5 queens and in all other plots. With respect to dispersion among nests, queens in plots receiv- ing 5 and 20 queens showed uniform dispersion, perhaps as a result of the low probability of finding one another. In plots receiving 80 queens, two showed significant clumping, one was random and one uniform. This appears to be a transitional density, for in all plots receiving 320 queens, queens were significantly clumped with respect to available nest chambers.
Figure 5 also shows that the clumping of queens in area rises much more rapidly with queen density than does clumping among nests. It seems likely that clumping in area drives the aggregation among available nests. This is discussed below.
Microtopography had no significant effect on any of the primary variables (ANOVA) and was therefore dropped as a factor in further analysis.
Comparison of Surveys and Experiment
In order to make the data for surveys and experi- ments comparable, we used the density of queens recovered rather than applied. Applied density is unknown for the surveys. In the experiment, the proportion recovered ranged from 38 to 68% but was not significantly related to the applied queen density (ANOVA). It seems likely that the recovery rate and relation to density were similar in the surveys.
When the mean nest density for the experimen- tal and survey plots are seen in relation to their recovered queen density, it is apparent that they fall on the same regression line (Fig. 6). The slopes of nest density vs queen density (0.30 and 0.32) are not significantly different (t-test for equality of slopes). Maximum queen density and therefore
This content downloaded from 128.186.14.5 on Tue, 03 Nov 2015 17:52:41 UTCAll use subject to JSTOR Terms and Conditions
Fig. 7. Observed queens per square meter in relation to Poisson Distributions of increasing mean queen density. Surface indicates the expected values for the Poisson distribution, the planar sections allow comparison of an observed distribution with the Poisson of the same mean value. The intersection of each z-y plane with the surface describes the expected values. As the mean density increases, the observed distribution deviates increasingly from the random Poisson, and this trend is stronger for the surveys. Deviations are characterized by higher than expected proportions of grid units with very low and very high numbers of queens, and lower than expected proportions with intermediate numbers
nest density in the surveys were much lower than those applied in the experiment, but the relation- ship between the two variables was similar.
On the other hand, the slope of the relationship of queens/nest (pleometrosis) to recovered queen density is significantly different for the surveys and experiment (P<0.01; t-test for equality of slope) (Fig. 6). In other words, pleometrosis increased more rapidly in response to queen density follow- ing natural mating flights and settling than it did in our experiment (slopes=0.66, 0.22, respective- ly). Perhaps this is because queens from natural mating flights have already undergone one level of aggregation as a result of site selection before alighting.
Comparison of clumping (variance-to-mean ratios) for surveys and experiment yields parallel results. The degree of clumping of queens in area (queens/M2) is significantly more sensitive to queen density (slope 3.60 vs 1.42; P<0.001; t-test) in the surveys than it is in the experiment, and the same is true for clumping of nests in area although the difference is smaller in this case (slope 1.32 vs 0.79; P<0.02; t-test). Thus, the aggregation of queens and nests within the available area increases more rapidly with queen density in surveys.
On the other hand, the effect of density
(queens/nest) on the clumping of queens among nest chambers is similar for surveys and the experi- ments (slopes 1.26 vs 1.17; N.S; t-test). Thus, the final assortment of queens into chambers reacts similarly to its mean queen density in both.
All these differences in rates of clumping were confirmed by a nearest neighbor distance analysis (Southwood 1978) of the mapped data.
The Nature of the Deviation from Random Distribution
For each mean value of queen density, nest density, or queens/nest from the experimental or survey plots, it is possible to compare the observed and expected proportion [P(x)] of grid units with x queens or nests, or nests with x queens (x =
1, 2 ... n). The X2 goodness-of-fit test confirmed that the deviation from the random Poisson distri- bution increased with the mean value of the vari- able, as in the previous analyses. For example, as the mean queen density increases, there appears an increasingly larger-than-expected number of grid units with low numbers of queens (0, 1, 2) and with very high numbers of queens (3 to 5 times the mean) (Fig. 7). On the other hand, there is an increasing deficit of grids with intermediate
This content downloaded from 128.186.14.5 on Tue, 03 Nov 2015 17:52:41 UTCAll use subject to JSTOR Terms and Conditions
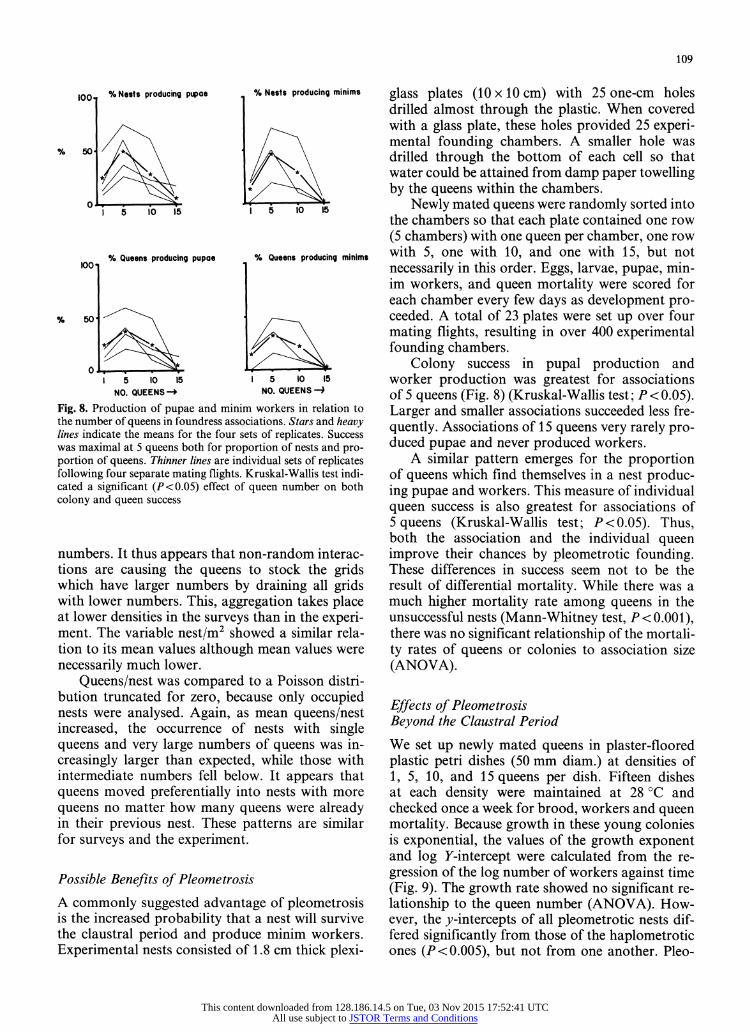
Fig. 8. Production of pupae and minim workers in relation to the number of queens in foundress associations. Stars and heavy lines indicate the means for the four sets of replicates. Success was maximal at 5 queens both for proportion of nests and pro- portion of queens. Thinner lines are individual sets of replicates following four separate mating flights. Kruskal-Wallis test indi- cated a significant (P<0.05) effect of queen number on both colony and queen success
numbers. It thus appears that non-random interac- tions are causing the queens to stock the grids which have larger numbers by draining all grids with lower numbers. This, aggregation takes place at lower densities in the surveys than in the experi- ment. The variable nest/m2 showed a similar rela- tion to its mean values although mean values were necessarily much lower.
Queens/nest was compared to a Poisson distri- bution truncated for zero, because only occupied nests were analysed. Again, as mean queens/nest increased, the occurrence of nests with single queens and very large numbers of queens was in- creasingly larger than expected, while those with intermediate numbers fell below. It appears that queens moved preferentially into nests with more queens no matter how many queens were already in their previous nest. These patterns are similar for surveys and the experiment.
Possible Benefits of Pleometrosis
A commonly suggested advantage of pleometrosis is the increased probability that a nest will survive the claustral period and produce minim workers. Experimental nests consisted of 1.8 cm thick plexi-
glass plates (10 x 10 cm) with 25 one-cm holes drilled almost through the plastic. When covered with a glass plate, these holes provided 25 experi- mental founding chambers. A smaller hole was drilled through the bottom of each cell so that water could be attained from damp paper towelling by the queens within the chambers.
Newly mated queens were randomly sorted into the chambers so that each plate contained one row (5 chambers) with one queen per chamber, one row with 5, one with 10, and one with 15, but not necessarily in this order. Eggs, larvae, pupae, min- im workers, and queen mortality were scored for each chamber every few days as development pro- ceeded. A total of 23 plates were set up over four mating flights, resulting in over 400 experimental founding chambers.
Colony success in pupal production and worker production was greatest for associations of 5 queens (Fig. 8) (Kruskal-Wallis test; P < 0.05). Larger and smaller associations succeeded less fre- quently. Associations of 15 queens very rarely pro- duced pupae and never produced workers.
A similar pattern emerges for the proportion of queens which find themselves in a nest produc- ing pupae and workers. This measure of individual queen success is also greatest for associations of 5 queens (Kruskal-Wallis test; P<0.05). Thus, both the association and the individual queen improve their chances by pleometrotic founding. These differences in success seem not to be the result of differential mortality. While there was a much higher mortality rate among queens in the unsuccessful nests (Mann-Whitney test, P <0.001), there was no significant relationship of the mortali- ty rates of queens or colonies to association size (ANOVA).
Effects of Pleometrosis Beyond the Claustral Period
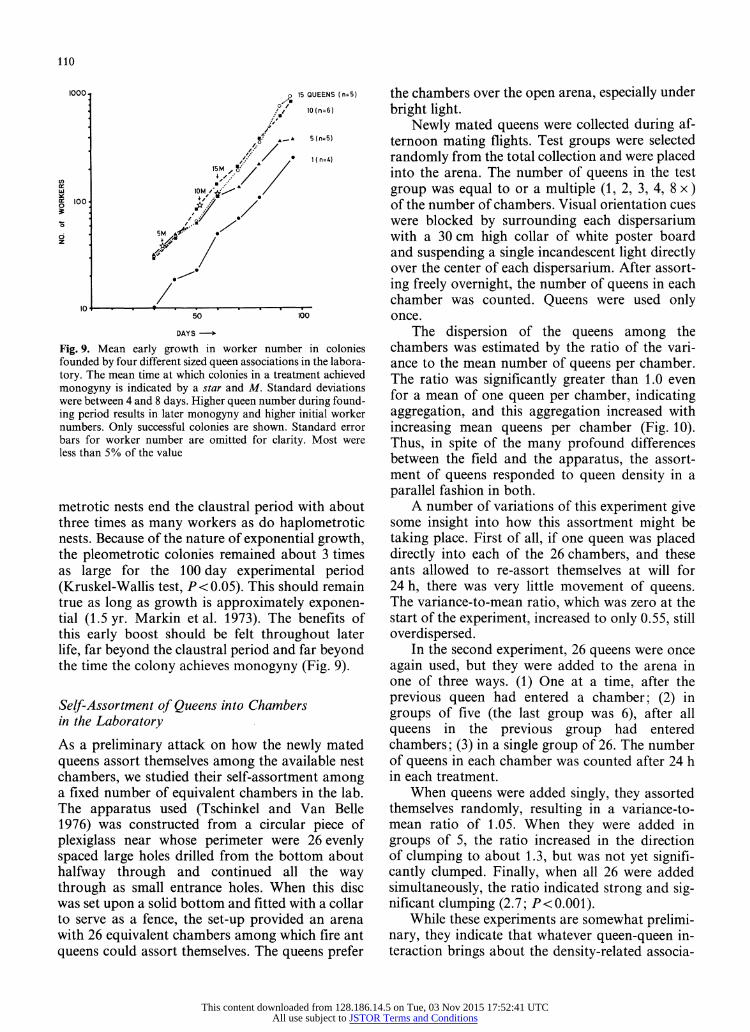
We set up newly mated queens in plaster-floored plastic petri dishes (50 mm diam.) at densities of 1, 5, 10, and 15 queens per dish. Fifteen dishes at each density were maintained at 28 ?C and checked once a week for brood, workers and queen mortality. Because growth in these young colonies is exponential, the values of the growth exponent and log Y-intercept were calculated from the re- gression of the log number of workers against time (Fig. 9). The growth rate showed no significant re- lationship to the queen number (ANOVA). How- ever, the y-intercepts of all pleometrotic nests dif- fered significantly from those of the haplometrotic ones (P<0.005), but not from one another. Pleo-
This content downloaded from 128.186.14.5 on Tue, 03 Nov 2015 17:52:41 UTCAll use subject to JSTOR Terms and Conditions
Fig. 9. Mean early growth in worker number in colonies founded by four different sized queen associations in the labora- tory. The mean time at which colonies in a treatment achieved monogyny is indicated by a star and M. Standard deviations were between 4 and 8 days. Higher queen number during found- ing period results in later monogyny and higher initial worker numbers. Only successful colonies are shown. Standard error bars for worker number are omitted for clarity. Most were less than 5% of the value
metrotic nests end the claustral period with about three times as many workers as do haplometrotic nests. Because of the nature of exponential growth, the pleometrotic colonies remained about 3 times as large for the 100 day experimental period (Kruskel-Wallis test, P <0.05). This should remain true as long as growth is approximately exponen- tial (1.5 yr. Markin et al. 1973). The benefits of this early boost should be felt throughout later life, far beyond the claustral period and far beyond the time the colony achieves monogyny (Fig. 9).
Self-Assortment of Queens into Chambers in the Laboratory
As a preliminary attack on how the newly mated queens assort themselves among the available nest chambers, we studied their self-assortment among a fixed number of equivalent chambers in the lab. The apparatus used (Tschinkel and Van Belle 1976) was constructed from a circular piece of plexiglass near whose perimeter were 26 evenly spaced large holes drilled from the bottom about halfway through and continued all the way through as small entrance holes. When this disc was set upon a solid bottom and fitted with a collar to serve as a fence, the set-up provided an arena with 26 equivalent chambers among which fire ant queens could assort themselves. The queens prefer
the chambers over the open arena, especially under bright light.
Newly mated queens were collected during af- ternoon mating flights. Test groups were selected randomly from the total collection and were placed into the arena. The number of queens in the test group was equal to or a multiple (1, 2, 3, 4, 8 x ) of the number of chambers. Visual orientation cues were blocked by surrounding each dispersarium with a 30 cm high collar of white poster board and suspending a single incandescent light directly over the center of each dispersarium. After assort- ing freely overnight, the number of queens in each chamber was counted. Queens were used only once.
The dispersion of the queens among the chambers was estimated by the ratio of the vari- ance to the mean number of queens per chamber. The ratio was significantly greater than 1.0 even for a mean of one queen per chamber, indicating aggregation, and this aggregation increased with increasing mean queens per chamber (Fig. 10). Thus, in spite of the many profound differences between the field and the apparatus, the assort- ment of queens responded to queen density in a parallel fashion in both.
A number of variations of this experiment give some insight into how this assortment might be taking place. First of all, if one queen was placed directly into each of the 26 chambers, and these ants allowed to re-assort themselves at will for 24 h, there was very little movement of queens. The variance-to-mean ratio, which was zero at the start of the experiment, increased to only 0.55, still overdispersed.
In the second experiment, 26 queens were once again used, but they were added to the arena in one of three ways. (1) One at a time, after the previous queen had entered a chamber; (2) in groups of five (the last group was 6), after all queens in the previous group had entered chambers; (3) in a single group of 26. The number of queens in each chamber was counted after 24 h in each treatment.
When queens were added singly, they assorted themselves randomly, resulting in a variance-to- mean ratio of 1.05. When they were added in groups of 5, the ratio increased in the direction of clumping to about 1.3, but was not yet signifi- cantly clumped. Finally, when all 26 were added simultaneously, the ratio indicated strong and sig- nificant clumping (2.7; P<0.001).
While these experiments are somewhat prelimi- nary, they indicate that whatever queen-queen in- teraction brings about the density-related associa-
This content downloaded from 128.186.14.5 on Tue, 03 Nov 2015 17:52:41 UTCAll use subject to JSTOR Terms and Conditions
Fig. 10. Aggregation of queens in the dispersarium chambers in relation to queen density. The variance-to-mean ratio indi- cates that queens are clumped with respect to available chambers, and that the intensity of clumping increases with queen density. The dotted lines indicate random dispersion, and significant clumping at the 0.01 level
tion, it takes place on the surface before queens enter the chambers. Once the queen enters a chamber, there is only a small chance she will leave it again. Experiments to check these results in the field are underway.
Discussion
We propose the following general mechanism regu- lating pleometrosis. All factors affecting pleome- trosis do so by acting upon the local queen density, local being one to several square meters. Local queen density increases with overall queen density, of course, but it also increases above this in spots through aggregation. Aggregation is itself in- creased by increasing queen density, probably be- cause it is affected by the likelihood of contact between queens. Higher local queen density in- creases nest density and frequency of contacts. In- creased queen-queen. contact leads ultimately to in- creased frequency and size of pleometrotic associa- tion. Any factor which increases the overall or local queen density thus increases pleometrosis.
This scheme is supported by the decreasing rel- ative sensitivity of clumping of queens, nests and queens/nest, respectively, to their mean densities. This is consistent with a mechanism in which ag-
gregation of queens in area drives aggregation of nests, and these both drive aggregation among chambers. This is also physically reasonable in light of the sequence of events during mating flights and post-flight behavior of queens.
Many other factors undoubtedly influence the occurrence and mean size of foundress groups as well as the dispersion of queens among groups, but we propose that these act primarily through their effect upon local queen density. Examples of such factors are: (1) the size of the mating flight (number of sexuals released from the mounds); (2) site selection before alighting. Queens seem to prefer partly vegetated areas, higher ground and absence of large shade areas; (3) After de-alation, queens contact other queens, probably react to soil moisture, soil texture, microtopography, presence of vegetation and shade. All these factors probably cause each queen to elect either to spend more time in that area or to move on. Favorable condi- tions thus must tend to increase the local queen density and the occurrence and size of foundress associations. The link between the input, queen density, and the output, the occurrence and size of foundress associations, remains to be clarified.
Associations normally seem not to be formed upon first contact between queens. Queens joining an association all seem to share in the excavation, hence, they are all likely to return regularly to the surface and possibly to leave the association. Prob- ably, the association is stabilized only once the nest is closed.
Considering the strength of association be- tween queens and higher ground in the surveys, the failure of microtopography to show a signifi- cant effect in the experiment requires some comment. Our hills differed from natural high spots in that they were composed of less compacted soil transported by us to the site. In this, they more closely resembled the soft-alluvium areas in the washes which the queens seemed to avoid. If the queens are responding to soil texture, rather than elevation, our 'hills' would be ineffective.
S. invicta colony founding is similar to that of Myrmecocystus in many respects (Bartz and H6ll- dobler 1982). In both, the frequency of pleometro- sis varied widely among sites and mating flights. Queens and nests tended to be clumped in distribu- tion, queens showed no aggression but a strong tendency to join one another for chamber excava- tion. Very large associations were usually not suc- cessful at rearing minims. In addition, queens of either species attempting to found within the terri- tory of a mature conspecific colony are killed by the workers of that colony.
This content downloaded from 128.186.14.5 on Tue, 03 Nov 2015 17:52:41 UTCAll use subject to JSTOR Terms and Conditions
While pleometrosis provides a clear advantage both to foundress associations and to individual queens during the claustral phase, the selective ad- vantage of pleometrosis probably acts throughout the entire period between colony foundation and maturity. We have shown that pleometrosis results in higher growth rates in addition to increased sur- vival. High growth rates may be important for at least four reasons. (1) Earlier maturation and re- production lead to shorter generation time and higher population growth rate. (2) Fire ants are territorial and war with conspecific colonies along their mutual territorial boundaries (Wilson et al. 1971). Such border wars probably result in attri- tion of the worker force, so that a higher worker production rate might give a competitive edge. (3) In the early post-claustral phase of Myrmecocystus mimicus and S. invicta colonies, workers move into whatever colony has the largest number of workers, bringing the brood with them. Their mothers are abandoned to die of starvation (Bartz and Holldobler 1982; Markin et al. 1973; Tschin- kel, unpublished). The winner is almost always the colony with the largest initial number of workers. This stresses the benefit of pleometrosis. (4) A colony's ability to survive adverse physical condi- tions is linked to colony size. Markin et al. (1973) showed that S. invicta colonies not attaining a certain minimum size by the onset of cold weather did not survive the winter. High worker numbers can be achieved in part by high worker production rates. While the native homeland of S. invicta in southern Brazil seems to lack a distinct winter, it is subject to a long dry season. Perhaps survival of drought is similar to winter from the point of view of the worker population required. Bartz and Holldobler (1982) suggest that high growth rate aids M. mimicus colonies to survive drought.
The chance that an individual queen will cash in on the advantages of pleometrosis is inversely proportional to the number of queens in the associ- ation (1/n). Clearly there must come a point when the chances of being the chosen queen in a surviv- ing colony are smaller than the chances of success by haplometrosis. At this point, it would be to a queen's advantage not to join such a group, but to search on or found alone. Bartz and Holldobler (1982) found that in Myrmecocystus, the group size showing optimal survival and production per queen was also nearest the mean natural group size, implying that Myrmecocystus queens may 'count' the number of foundresses before joining a group. Fire ants seem to have no ability to count, however, for there seems to be no upper limit on
the number of foundresses in an association. We and Markin et al. (1972) found up to 30 queens in a single chamber and several hundred under litter in the field.
Why has inhibition against joining large groups not evolved in fire ants? S. invicta is reported not to be very abundant in the areas in which it is native (S. Brazil), and appears to be mostly re- stricted to disturbed or seasonally flooded habitat (Buren, personal communication). Thus, mating flights and post-flight queen density would rarely be high, pleometrosis would be rare and of low average queen number, resulting in little opportu- nity to select against joining excessively large groups. However, selection for joining any avail- able group would be strong. Only after introduc- tion to the United States and the subsequent devel- opment of large populations would the opportuni- ty for selection against joining large groups have arisen.
Acknowledgements. The work of digging up fire ants queens under the summer noonday sun in a barren, parched clearing site in north Florida is beyond the call of normal wage-earning duty. For their uncomplaining, sometimes even enthusiastic help, we thank Virginia Beck, Linda Damico and Fran Turgeon, but above all Tracey Andreae who contributed tre- mendously to the management and completion of these difficult experiments. All sweated with remarkable esprit. For cheerful technical help at an earlier stage, we thank Ellen Slater. A portion of this work was supported by a grant from the Na- tional Science Foundation, Regulatory Biology Program.
References
Bartz SH, Holldobler H (1982) Colony founding in Myrmeco- cystus mimicus Wheeler (Hymenoptera: Formicidae) and the evolution of foundress associations. Behav Ecol Socio- biol 10: 137-147
Fletcher DJC, Blum MS, Whitt TV, Temple N (1980) Mono- gyny and polygyny in the fire ant, Solenopsis invicta. Ann Entomol Soc Am 73:658-661
Glancey BM, Craig CH, Stringer CE, Bishop PM (1972) Multi- ple fertile queens in colonies of the imported fire ant, Solen- opsis invicta. J Ga Entomol Soc 8:327-328
Markin GP, Collins HJ, Dillier JH (1972) Colony founding by queens of the red imported fire ant, Solenopsis invicta. Ann Entomol Soc Am 65:1053-1058
Markin GP, Dillier JH, Collins HL (1973) Growth and develop- ment of colonies of the red imported fire ant, Solenopsis invicta. Ann Entomol Soc Am 66:803-808
Mintzer A (1979) Colony foundation and pleometrosis in Ca- manotus (Hymenoptera: Formicidae). Pan Pac Entomol 55:81-89
Morrill WL (1974) Production and flight of alate red imported fire ants. Environ Entomol 3:265-271
Southwood TRE (1978) Ecological methods, 2nd edn. Halstead Press
Stumper R (1962) Sur un effect de groupe chez les femelles de Campanotus vagus (Scopli). Insectes Soc 9:329-333
This content downloaded from 128.186.14.5 on Tue, 03 Nov 2015 17:52:41 UTCAll use subject to JSTOR Terms and Conditions
Thorne BL (1982) Polygyny in termites: Multiple primary queens in colonies of Nasutitermes corniger (Isoptera: Ter- mitidae). Insectes Soc 29:102-117
Tschinkel WR, Belle G Van (1976) Dispersal of larvae of the tenebrionid beetle, Zophobas rugipes, in relation to weight and crowding. Ecology 57:161-168
Tschinkel WR, Howard DF (1978) Queen replacement in or- phaned colonies of the fire ant, Solenopsis invicta. Behav Ecol Sociobiol 3:297-310
Waloff N (1957) The effect of the number of queens of the ant Lasiusflavus (Fab.) Hym.: Formicidae) on their survival and on the rate of development of the first brood. Insectes Soc 4:391-408
Wilson EO (1966) Behavior of social insects. Symp R Entomol Soc (Lond) 3:81-96
Wilson EO (1971) The insect societies. Harvard, Cambridge Wilson NL, Dillier JH, Markin GP (1971) Foraging territories
of imported fir ants. Ann Entomol Soc Am 64: 660-665
This content downloaded from 128.186.14.5 on Tue, 03 Nov 2015 17:52:41 UTCAll use subject to JSTOR Terms and Conditions