EUROGRAPHICS Workshop on Graphics and Cultural Heritage (2016) C. E. Catalano and L. De Luca (Editors) Color Restoration of Scanned Archaeological Artifacts with Repetitive Patterns D. Gilad-Glickman & I. Shimshoni 1 1 University of Haifa, Department of Information Systems, Israel Abstract Our work addresses the problem of virtually restoring archaeological artifacts. Virtual restoration is the process of creating a noise-free model of a degraded object, to visualize its original appearance. Our work focuses on restoring the coloring of the object. We considered both 2D and 3D objects, including scans of ancient texts and 3D models of decorated pottery. Our denoising method exploits typical characteristics of archaeological artifacts, such as repetitive decoration motifs and a limited palette of colors. Our classification method is based on minimization of an energy function, which includes a correspondence term, to encourage consistent labeling of similar regions. The energy function is minimized using the Graph-Cuts algorithm. Categories and Subject Descriptors (according to ACM CCS): I.3.7 [Computer Graphics]: Three-Dimensional Graphics and Realism—Color, shading, shadowing, and texture I.4.6 [Image Processing and Computer Vision]: Segmentation—Pixel classi- fication I.5.3 [Pattern Recognition]: Clustering—Similarity measures 1. Introduction Historically significant artifacts tend to deteriorate over time. The objects may break, erode, get stained, and surface colors may fade or peel off. In our work, we address the problem of virtually restor- ing models of archaeological artifacts. We aim to restore only the color component, ignoring possible defects in the object’s shape. We consider both 2D scans of ancient texts, as well as 3D scans of decorated pottery. Given a digital version of the object, we wish to alter its colors to simulate the object’s original appearance. We restore the original appearance of a scanned object, by assigning each pixel a label representing its noise-free color. Archeological artifacts are decorated, in many cases, by repeti- tive decoration motifs, painted with a small number of colors. Re- occurring letters in text may be considered a special case of such repetitions. Our method exploits those two characteristics. We as- sume that the number of colors is known, and that the degradation is of a gradual nature, and use Gaussian Mixture Models (GMM) to estimate the main colors. Repeating patterns are used to deduce the original appearance on damaged areas, assuming similar regions have deteriorated differently. We create a denoised version of the object by color classification; each point is assigned a label (i.e. a cluster index), representing the noise-free color it most likely orig- inated from. The optimal labeling is detected by minimization of an energy function. Energy functions are usually comprised of a data term and a smoothness term. The data term measures the dis- agreement between a labeling f and the observed data I , and the smoothness term imposes spatial smoothness on labels of neigh- boring points. We add a correspondence term to the energy func- tion. The correspondence term acts on pairs of matching points, and encourages consistent labeling of similar regions. Our label- ing method thus integrates both local and semantic cues, as well as a probabilistic prior, to infer the optimal labeling of the data. The correspondence term can be considered a generalization of the smoothness term; while the smoothness term imposes similarity on pixels that are geometrically close, the correspondence term en- forces similarity on pixels that are semantically close. The energy function is minimized using Graph-Cuts, and each class is colored by the average color of all its members. The resulting model is considered a reconstructed version of the object. The method was tested on images of ancient texts and 3D models of archaeological artifacts. We compare the results of our algorithm to labeling ac- cording to GMM, and to the original Graph-Cuts. In both the 2D and 3D cases, our method achieved superior results; it managed to remove large portions of the noise, while keeping the repetitive pattern intact. 2. Algorithmic Flow 2.1. Method Overview Our method aims to improve labeling results, by utilizing similari- ties within the data. We do so by minimizing an energy function with an additional semantic similarity element. The new energy term is represented in the graph by correspondence edges. Cor- respondence edges assemble corresponding vertices into cliques c 2016 The Author(s) Eurographics Proceedings c 2016 The Eurographics Association.
Transcript
EUROGRAPHICS Workshop on Graphics and Cultural Heritage (2016)C. E. Catalano and L. De Luca (Editors)
Color Restoration of Scanned Archaeological Artifacts withRepetitive Patterns
D. Gilad-Glickman & I. Shimshoni1
1University of Haifa, Department of Information Systems, Israel
AbstractOur work addresses the problem of virtually restoring archaeological artifacts. Virtual restoration is the process of creatinga noise-free model of a degraded object, to visualize its original appearance. Our work focuses on restoring the coloring ofthe object. We considered both 2D and 3D objects, including scans of ancient texts and 3D models of decorated pottery. Ourdenoising method exploits typical characteristics of archaeological artifacts, such as repetitive decoration motifs and a limitedpalette of colors. Our classification method is based on minimization of an energy function, which includes a correspondenceterm, to encourage consistent labeling of similar regions. The energy function is minimized using the Graph-Cuts algorithm.
Categories and Subject Descriptors (according to ACM CCS): I.3.7 [Computer Graphics]: Three-Dimensional Graphics andRealism—Color, shading, shadowing, and texture I.4.6 [Image Processing and Computer Vision]: Segmentation—Pixel classi-fication I.5.3 [Pattern Recognition]: Clustering—Similarity measures
1. Introduction
Historically significant artifacts tend to deteriorate over time. Theobjects may break, erode, get stained, and surface colors may fadeor peel off. In our work, we address the problem of virtually restor-ing models of archaeological artifacts. We aim to restore only thecolor component, ignoring possible defects in the object’s shape.We consider both 2D scans of ancient texts, as well as 3D scansof decorated pottery. Given a digital version of the object, we wishto alter its colors to simulate the object’s original appearance. Werestore the original appearance of a scanned object, by assigningeach pixel a label representing its noise-free color.
Archeological artifacts are decorated, in many cases, by repeti-tive decoration motifs, painted with a small number of colors. Re-occurring letters in text may be considered a special case of suchrepetitions. Our method exploits those two characteristics. We as-sume that the number of colors is known, and that the degradationis of a gradual nature, and use Gaussian Mixture Models (GMM) toestimate the main colors. Repeating patterns are used to deduce theoriginal appearance on damaged areas, assuming similar regionshave deteriorated differently. We create a denoised version of theobject by color classification; each point is assigned a label (i.e. acluster index), representing the noise-free color it most likely orig-inated from. The optimal labeling is detected by minimization ofan energy function. Energy functions are usually comprised of adata term and a smoothness term. The data term measures the dis-agreement between a labeling f and the observed data I , and thesmoothness term imposes spatial smoothness on labels of neigh-
boring points. We add a correspondence term to the energy func-tion. The correspondence term acts on pairs of matching points,and encourages consistent labeling of similar regions. Our label-ing method thus integrates both local and semantic cues, as wellas a probabilistic prior, to infer the optimal labeling of the data.The correspondence term can be considered a generalization of thesmoothness term; while the smoothness term imposes similarity onpixels that are geometrically close, the correspondence term en-forces similarity on pixels that are semantically close. The energyfunction is minimized using Graph-Cuts, and each class is coloredby the average color of all its members. The resulting model isconsidered a reconstructed version of the object. The method wastested on images of ancient texts and 3D models of archaeologicalartifacts. We compare the results of our algorithm to labeling ac-cording to GMM, and to the original Graph-Cuts. In both the 2Dand 3D cases, our method achieved superior results; it managedto remove large portions of the noise, while keeping the repetitivepattern intact.
2. Algorithmic Flow
2.1. Method Overview
Our method aims to improve labeling results, by utilizing similari-ties within the data. We do so by minimizing an energy functionwith an additional semantic similarity element. The new energyterm is represented in the graph by correspondence edges. Cor-respondence edges assemble corresponding vertices into cliques
D. Gilad-Glickman & I. Shimshoni / Color Restoration of Scanned Artifacts
in the graph, thus encouraging consistent labeling of matching re-gions. While the new similarity term enriches the graph with a newtype of edges, it does not affect the minimization procedure. Wethus minimize the extended graph using the same graph-cut algo-rithm that was defined on graphs with the original structure. Forsimplicity, the concept of the algorithm will first be exemplified on2D images of ancient texts and then extended to 3D objects.
2.2. Modeling Color Distribution
Ancient texts are mostly bi-chromatic. Similarly, archeological ar-tifacts are decorated with a limited pallet of colors [ALY08]. Thecolors of scanned texts and objects, however, often vary from theoriginal colors. Limiting the number of main colors allows us totransform the de-noising problem into a clustering task. We modelthe color distribution and determine the main colors. We then com-pute the initial labeling by clustering each point to the most prob-able main colors. Modeling the colors’ distribution is done usinga Gaussian mixture model (GMM). The number of main colors isassumed to be known - given by a human observer or automaticallyinferred from the data. GMM clustering is done based on color in-formation solely, ignoring any spatial information. Clustering isperformed on points in a 3 dimensional color space (L*,u*,v*)(CIELUV).
2.3. Energy Function
We search for the optimal labeling of the data by minimizing anenergy function. Our energy function contains a data term and asmoothness term. But, in order to encourage consistent labeling ofmatching regions, we add an additional term, which we consider acorrespondence term. The new term defines a cost for disconnect-ing corresponding points, i.e., assigning different labels to match-ing vertices. Adding the correspondence term to the energy equa-tion yields:
E ( f ) = Edata ( f )+Esmooth ( f )+Ecorr ( f ) , (1)
where the data term Edata represents the initial probability that avertex has originated from each of the main colors. Edata is basedon the prior probabilities computed by the GMM. The smooth-ness term Esmooth is based on the Potts model as an interactionpenalty. The correspondence term Ecorr imposes smoothness onlabels of corresponding points. i.e. it encourages similar labelingof corresponding regions. Both the smoothness term and the cor-respondence term impose similarity between pixels. But while thesmoothness term imposes similarity on pixels that are geometri-cally close, the correspondence term enforce similarity on pixelsthat are semantically close. The minimal cut of the graph is de-tected using the standard graph-cuts algorithm [BVZ01].
2.4. Similarity search
We consider two pixels p and q to be semantically close if theirlocal neighborhoods Np, Nq are similar. We detect matching re-gions by correlating local neighborhood (patches) with the full im-age (in the 2D case). Query patches are taken from all over theimage, as overlapping tiles, with a vertical and horizontal shift ofhalf window-size between one another. Since letters in texts tend
to have similar sizes and alignment, we did not use neither scal-ing nor rotation in the 2D case. We compute the normalized cross-correlation between each query patch and the full image, and applynon-maximal suppression [Kov00] to detect local maxima in thecorrelation map. Patches centered at correlation peaks are consid-ered matching regions to the query patch.
2.5. Correspondence Term Weights
C-links (marked orange in Fig. 1), connect pairs of correspondingpixels, and thus define a semantic neighborhood system. We con-sider points with similar neighborhoods as matching points. Thecost of a C-link corresponds to a penalty for discontinuity in label-ing of corresponding pixels. Cutting a C-link represents the assign-ment of different labels to matching points.
In the 2D case, each query patch Nq is correlated with the fullimage. After detecting its matching regions Nq
i , i = [1, ..,m], thepatches are aligned, and each pixel q in the query patch Nq is con-nected to its corresponding pixels pi ∈Nq
i . In the graph, vertex vq isconnected by C-links to its corresponding vertices vpi (see Fig. 1).We assume that corresponding pixels behave similarly to adjacentpixels.
3. 3D Adjustments
We extended the method for 3D objects, decorated by repetitivepatterns. We wish to alter the appearance of the color data solely.Implementing the method on 3D objects required several adjust-ments. The major issues to consider were:
1. 3D object scans are not sampled on a regular grid2. Color correlation between non-planar patches is not well de-
fined3. Object decorations may include similar regions in different ori-
entations, as opposed to letters in texts, which are usually wellaligned.
The initial stage - modeling the color distribution and initial label-ing was done as before, see Section (2.2), based on vertices’ colors.
D. Gilad-Glickman & I. Shimshoni / Color Restoration of Scanned Artifacts
3.1. Query Patches and Search Region
To reduce the complexity of the problem, we project the patches onthe 2D tangent plane. To avoid major distortions in the projectedimage, we limit the size of the patches to an area with relativelysmall curvature. Similarly, the size of the search region is limiteddue to the object’s geometry. While in the 2D case the whole ob-ject was included in the search region, here it may contain just asection of it. In the 2D case, query patches were taken sequentially,from the entire image. In the 3D case, however, we chose to markthe query patches manually, at points of interest. This reduces thecomplexity of the computation, by omitting the matching stage ofunique or irrelevant patches. Figure 5 displays all query patches(marked in red. Marks appear partial when occluded by the object).The search region in this case is centered at the blue mark, and in-cludes the entire facade. The user defines a radius for each patch,and all points within a geodesic distance smaller than that radiusare considered part of the patch. Choosing query patches of dif-ferent sizes enables the preservation of both fine details and moregeneral structures.
3.2. Patch Projection and Rotation
Color correlation is not well defined between non-planar surfaces.To overcome this issue, we project both the search region and thequery patches onto a plane tangent to the surface at the center ofeach patch. After projecting the vertices onto the tangent plane, weresample it to form an image with a regular square grid. We wouldlike to allow detection of similar regions with different orientations.We thus project each query patch in multiple directions, with dθ =5◦, for θ ∈ [0,360◦). Projecting in multiple directions also allowspatches with self-symmetries to contribute multiple instances.
3.3. Matching and Alignment
After rotating the patches, projecting and resampling, we can nowsearch for matching regions using 2D correlation, as explained inSection (2.4). We compute the correlation between the search re-gion and all rotated versions of the query patches, and transformthe pixels of maximal correlation into vertices in the mesh. Eachquery patch is now related to a list of maximum correlating ver-tices. We define a patch around each correlation peak, and alignthem with the non-rotated query patch.
3.4. 3D Neighboring
3D meshes are not regularly sampled, and require a more fuzzy def-inition of neighborhood. Practically, we detect the K-nearest neigh-bors of each vertex by efficiently searching a KD-tree [FBF77]. Weadd a distance component to the weight functions, to compensatefor the variability in neighbor distances.
3.5. Data Term and Smoothness Term Weights
The data term for the 3D case is the same as for the 2D case.Smoothness edges connect vertices to their local neighbors. Wealso use the Potts model as an interaction penalty, but add a dis-tance element to the weight function, to reflect the non-regularityof the grid.
3.6. Correspondence Term Weights
C-links connect corresponding vertices. After aligning the corre-sponding regions with the query patch, we connect each vertex inthe query patch to its K-nearest neighbors (with K=100) from eachcorr_patch ( j). In the graph, vertex vq is connected by C-links to itscorresponding vertices vpi , with weights similar to the smoothnessedges.
4. Results
This section presents the results of our method, when applied to 2Dimages and 3D models of painted object. We compare our method(GCC) to the initial labeling by maximizing GMM probabilitiesand to the original Graph-Cuts (GC) method.
4.1. 2D images
We first tested our method on 2D images of ancient texts. The textare handwritten, which allows for greater variability even withindifferent instances of the same letter. We consider the whole imageas the search region. Correspondences are defined between reoccur-ring letters, so we thus set the size of the query patches (NQ×NQ)according to the size of the letters. Query patches are taken fromall over the image, as overlapping tiles, with a vertical and horizon-tal shift of half window-size between one another. No attempt wasmade to fit the tiles exactly around the letters.
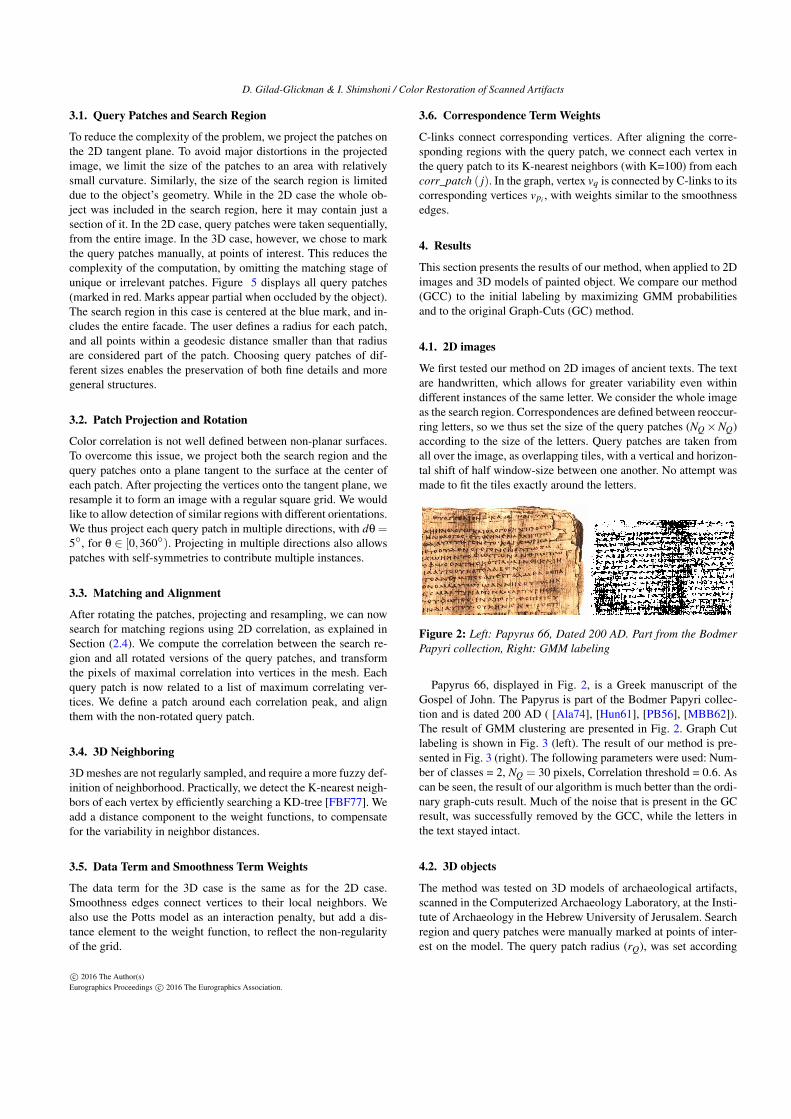
Figure 2: Left: Papyrus 66, Dated 200 AD. Part from the BodmerPapyri collection, Right: GMM labeling
Papyrus 66, displayed in Fig. 2, is a Greek manuscript of theGospel of John. The Papyrus is part of the Bodmer Papyri collec-tion and is dated 200 AD ( [Ala74], [Hun61], [PB56], [MBB62]).The result of GMM clustering are presented in Fig. 2. Graph Cutlabeling is shown in Fig. 3 (left). The result of our method is pre-sented in Fig. 3 (right). The following parameters were used: Num-ber of classes = 2, NQ = 30 pixels, Correlation threshold = 0.6. Ascan be seen, the result of our algorithm is much better than the ordi-nary graph-cuts result. Much of the noise that is present in the GCresult, was successfully removed by the GCC, while the letters inthe text stayed intact.
4.2. 3D objects
The method was tested on 3D models of archaeological artifacts,scanned in the Computerized Archaeology Laboratory, at the Insti-tute of Archaeology in the Hebrew University of Jerusalem. Searchregion and query patches were manually marked at points of inter-est on the model. The query patch radius (rQ), was set according
to element size, and the size of the search region is determined ac-cording to the curvature of the surface.
Fig. 4 presents the upper part of a decorated Phoenicianbichrome jug from the Tel Dor excavation, dated to late Iron AgeI [Gil99]. To avoid large distortions in the projected image we re-stored only the decorated facade.
Figure 4: Phoenician Bi-chromatic jug
In Fig 5(left), the query patches are marked by red circles, andthe center of the search region is marked blue. The entire (cropped)model is considered as the search region. Fig. 5(right) presents theresults of clustering according to GMM probabilities. The follow-ing parameters were selected: 6 classes, rQ = 10 mm, Correlationthreshold = 0.6. Fig. 6(left) and Fig. 6(right) presents the results ofGC and GCC labeling, respectively. Both GC methods manage tosmooth out much of the noise, but while GC merges the red lines,GCC separates them.
Figure 5: Left: Decorated facade. Query patches marked red onsearch region (the entire facade). Right: Labeling according toGMM, colored by average color
5. Conclusions
We have presented a method for virtually restoring the colors of ar-chaeological artifacts. Our method utilizes repetitive patterns, such
Figure 6: Left: GC labeling, colored by average color. Right: GCClabeling, colored by average color
as decoration motifs and reoccurring letters, to infer the original ap-pearance of degraded regions. In the restoration process, each pointis assigned a label, representing the color it most likely originatedfrom. The optimal labeling is detected by minimizing an energyfunction using the Graph-Cuts algorithm. Our energy function in-cludes the standard data and smoothness terms. To encourage con-sistent labeling of matching regions, we added a third (correspon-dence) term, to the energy function. The correspondence term actsupon pairs of matching points, assigning a cost for inconsistent la-beling of corresponding points. Our method thus incorporates bothlocal and semantic information, along with a probabilistic prior, toinfer the optimal labeling. We also detailed the adjustments neededfor applying the method to 3D models. The method was tested on2D images of ancient texts and 3D models of decorated pottery,yielding better results relative to those of GMM and the originalGraph-Cuts method. The algorithm successfully removed noise,while preserving and enhancing the repetitive patterns.
Acknowledgements: This research was funded in part by GRAVI-TATE under EU2020-REFLECTIVE-7-2014.
References[Ala74] ALAND K.: Neue neutestamentliche papyri iii. New Testament
Studies 20, 04 (1974), 357–381. 3
[ALY08] ALIAGA D. G., LAW A. J., YEUNG Y. H.: A virtual restorationstage for real-world objects. ACM Transactions on Graphics (TOG) 27,5 (2008), 149. 2
[BVZ01] BOYKOV Y., VEKSLER O., ZABIH R.: Fast approximate en-ergy minimization via graph cuts. IEEE Transactions on Pattern Analysisand Machine Intelligence 23, 11 (2001), 1222–1239. 2
[FBF77] FRIEDMAN J. H., BENTLEY J. L., FINKEL R. A.: An algo-rithm for finding best matches in logarithmic expected time. ACM Trans-actions on Mathematical Software (TOMS) 3, 3 (1977), 209–226. 3
[Gil99] GILBOA A.: The dynamics of phoenician bichrome pottery: aview from tel dor. Bulletin of the American Schools of Oriental Research(1999), 1–22. 4
[Hun61] HUNGER H.: Zur datierung des papyrus bodmer ii(p66). Anzeiger der Österreichischen Akademie der Wissenschaftenphilosophisch-historische Klasse 97 (1961), 12–23. 3
[Kov00] KOVESI P. D.: Matlab and octave functions for computer vi-sion and image processing. Online: http://www. csse. uwa. edu. au/˜pk/Research/MatlabFns/# match (2000). 2
[MBB62] MARTIN V., BARNS J. W. B., BODMERIANA B.: PapyrusBodmer II, supplément: Évangile de Jean, chap. 14-21. BibliothèqueBodmer, 1962. 3
[PB56] PAPYRUS BODMER I.: Evangile de jean chap. 1-14. Publié parVictor MARTIN (1956). 3