General Othe Authothe Authoassurancebe revisedissuing ra
acked by Aud rental and buonds, outstan
hority has pledority has also
Authority andment Act of 1ng in the amn and securin
mily/Project Bn, to reimburst of such cla" under this cllion followinose projects a
gage loans formillion, for thion and for thion have alsfrom HUD w
with respect to
e Products; Intion to make onds under th
Mortgage Bonds. See Apping Derivativs of the Auth
ther Borrowina and a commns of the Authnt financing ong under thoshereto as Appive Service N), which haveinesses in rur
Obligation Raority's ability ority's manag
e that any sucd downward oating agency, c
uthority Geneusiness loans
nding as of Dedged its full fo assumed, asd insured by1992, as amemount of appng the Bonds Bonds). In thse FHA for 5aim. See "Pcaption. To
ng the defaultand the settler the Platte Vahe Fox Run Ahe Gold Campo defaulted.
with respect to these loans,
nterest Rate Ctermination
he related mads under the pendix B – e Products" tority attached
ngs. The Autmercial bank hority and haof such loanse agreementspendix A. ThNotes (outstane been used toral areas. The
atings. Moodyto repay its g
gement, finanh rating will or withdrawncircumstance
eral Obligatiousing proceeecember 31, 2faith and creds a general ob the FHA u
ended. As ofproximately $
and $189.2 mhe case of a
50% of any loPrograms to date, the Autts on insured ement of the ralley Village
Apartments prp Apartments
The Authoo these loansfor which the
Contracts. Thpayments un
aster indenturrelated maste"OUTSTAN
to this Annuad hereto as Ap
thority has enfor borrowinve generally
ns. As of Ds. See footnohe Authority nding as of Do finance proje Authority h
y's has assigngeneral obligancial performcontinue for
n entirely by s so warrant.
5
on. The Aueds of, and ple2012 in the adit to the paybligation, 50%under Sectionf December 3$217.5 milliomillion held u§542(c) claimoss incurred bDate – Com
thority has inmortgage lo
respective finII project in roject in the project in the
ority has fileds. It is likelye Authority b
he Authority hnder the derivre, under the er indenture a
NDING GENal Report. Sppendix A.
ntered into agngs from time
been used to December 31,ote (5) to the ahas also borr
December 31,oject or workihas pledged it
ned an "A2" ration liabilitiemance and ov
any given peMoody's or S
uthority has edged to the raggregate prinyment of a su% risk of loss n 542(c) of 31, 2012, sucon ($28.3 munder the ma
m, the Authorby the FHA a
mmercial Loancurred risk-soans for certainal insurance the approximapproximate
e approximated insurance
y that the Autelieves it is a
has pledged ivative producinterest rate
and under theNERAL RESO
ee also footn
greements wite to time. Su
date to make, 2012, $71.audited finanrowed amoun, 2012 in theing capital loas full faith an
rating and S&es. The ratingverall prograeriod of time S&P, respecti
acquired or repayment of,ncipal amounubstantial port
in the mortgthe Housing
ch 542(c) momillion held uaster indenturrity is responas a result of an Programs sharing lossesin projects, thclaims with F
mate aggregataggregate pr
e aggregate pclaims and rthority will in
adequately res
its full faith acts relating tocontracts rela
e Derivative POLUTION O
note (8) to the
th the Federaluch borrowinge or purchase5 million in
ncial statemennts evidenced e aggregate prans or partici
nd credit to th
&P has assignegs have been am performanor that any s
ively, if, in th
originated cf, the Multi-Fant of $274,832tion of such age loans acq
g and Commortgage loansunder the Gere and securinnsible, as a gef and after the
– Rental Fis of approximhe foreclosurFHA. In adde principal amrincipal amou
principal amoureceived insuncur a risk-shserved.
and credit to so the Multi-Fating to the SProduct relatOBLIGATIOe audited fina
l Home Loan gs are also gee loans pendinn borrowings nts of the Auth
by Rural Burincipal amouipations therehe payment of
ed an "A" ratassigned bas
nce. There uch rating wihe judgment
certain amily/ 2,155. loans. quired
munity were eneral ng the eneral e final nance
mately re and dition, mount unt of unt of
urance haring
secure Family Single ing to NS – ancial
Bank eneral ng the
were hority siness unt of ein for f such
ting to sed on is no ill not of the
Summary
The follooutstandinprovided u
MFResMFSF SF SF Pri R B S
⁽¹⁾ Trep⁽2⁾INIBremesc
of Certain Au
wing is a tabng amount forunder the oth
Summ
F Housing Inssolution) F Project BonProgram SenMortgage BoProgram Bonvately Placed
Rental FinancBusiness FinanSingle Family
These are the Bort for more inIn March 2012BP Master Inde
maining 2009Arowed amount
uthority Oblig
ble which lisr such obligat
her subcaption
mary of Cert
Certain Au
sured Mortgag
nds (Master Innior/Subordinonds (2001 Mnds (NIBP Md Bonds: e nce
y
Bonds issued annformation abo2 $106,325,000enture was red
Statements of Net Position 17 Statements of Revenues, Expenses and Changes in Net Position 18 Statements of Cash Flows 19 – 20
NOTES TO BASIC FINANCIAL STATEMENTS 21 – 57
SUPPLEMENTAL INFORMATION 58 – 62
1. Combining Schedule – Statement of Net Position 59 2. Combining Schedule – Revenues, Expenses and Changes in Net Position 60 3. Combining Schedule – Statement of Cash Flows 61 - 62
1
EXECUTIVE LETTER
2
Message from Cris White, Executive Director and CEO March 28, 2013
In 2012, CHFA’s work played an important role in strengthening Colorado’s economy while fulfilling our mission of affordable housing and economic development finance. The estimated economic benefit resulting from our efforts during the past year exceeded $970 million and supported over 5,000 jobs.
Specifically, CHFA supported:
2,535 households with home mortgage loans or CHFA Statewide Mortgage Credit Certificates;
Homebuyer education classes for 6,888 households;
The construction or preservation of 22 affordable rental housing developments consisting of a total of 1,659 units;
278 small and medium sized businesses in accessing capital, impacting 3,227 jobs; and
31 Colorado nonprofit organizations with missions related to CHFA’s work in affordable housing or economic development through sponsorships and donations totaling over $166 thousand.
These accomplishments are the result of our continued efforts to better understand and address our partners’ and customers’ needs. Through strategic outreach, CHFA gained input and formed new relationships that were instrumental in allowing us to increase the number of Coloradans we serve. Among CHFA’s expanded product offerings were three new home finance programs designed to maximize borrower benefit, while improving the overall asset quality of the single family portfolio. CHFA SmartStep blended CHFA’s most popular programs – our lowest interest rate loan, down payment assistance, and an expanded Mortgage Credit Certificate – into one easy to use resource for lenders and customers. CHFA Advantage utilizes Fannie Mae’s Risk Share loan program to serve borrowers who have maintained a strong credit history. Our new Federal Housing Administration (FHA) Streamline Refinance provides a refinance option for existing borrowers to take advantage of the low interest rate environment, while still allowing CHFA to maintain a positive relationship with our customers who’ve demonstrated a strong payment history. Additionally, CHFA was pleased to reemerge in the multi-family arena after three years of inactivity in our 4 percent bond and direct lending programs due to ongoing market hurdles resulting from the 2008 economic decline. In 2012, CHFA supported 10 affordable housing developments with 4 percent Low Income Housing Tax Credit (LIHTC) allocations, and also provided financing for two of the ten transactions. In total, these developments will support the preservation of 600 affordable rental housing units and the construction of 324 new units. CHFA’s ability to contribute resources toward affordable rental housing helped meet a critical need for Colorado, as rental vacancies decreased statewide. CHFA’s business finance team partnered with the Colorado Office of Economic Development and International Trade to launch the Colorado Capital Access and Cash Collateral Support programs. Utilizing resources made available through the Small Business Jobs Act of 2010, these programs will help small and medium sized businesses access capital by using a small amount of public-sector resources to leverage private-sector resources that otherwise might not be available.
3
In another example of CHFA’s commitment to innovation and operational enhancement, CHFA embarked on a new partnership with Dovenmuehle Mortgage, Inc. (DMI) for the servicing of CHFA’s single family loan portfolio. By forming an alliance with DMI, CHFA expects to achieve a number of benefits over time including improved asset performance, enhanced customer service, and greater control over indirect costs and technology investment. The financial and operational savings generated will allow CHFA to remain focused on investing as many resources as possible back into its mission of affordable housing and economic development. Throughout the year ahead, CHFA will continue to remain focused on strengthening our financial and operational framework so we may further our mission of affordable housing and economic development finance on behalf of Colorado. Sincerely,
Cris A. White Executive Director and CEO
4
MANAGEMENT’S DISCUSSION AND ANALYSIS (UNAUDITED)
Management’s Discussion and Analysis
(unaudited)
5
This section of the Colorado Housing and Finance Authority’s (the Authority) annual financial report presents management’s discussion and analysis of the financial position and results of operations at and for the years ended December 31, 2012 and 2011. This information is being presented to provide additional information regarding the activities of the Authority and to meet the disclosure requirements of Government Accounting Standards Board (GASB) Statement No. 34, Basic Financial Statements – and Management’s Discussion and Analysis – for State and Local Governments (GASB No. 34). The Authority is a public enterprise that finances affordable housing, business and economic growth opportunities for residents and businesses of Colorado. Its dual mission is to increase the availability of affordable, decent and accessible housing for lower- and moderate-income Coloradans, and to strengthen the state’s development by providing financial assistance to businesses. Established by the Colorado General Assembly in 1973, the Authority raises funds through the public and private sale of bonds and notes, which are not obligations of the State of Colorado. The proceeds are loaned to eligible borrowers, primarily through private lending institutions across the state under sound fiscal practices established by the Authority. As a self-sustaining organization, the Authority’s operating revenues come from loan and investment income, program administration fees, loan servicing and gains on sales of loans. The Authority receives no tax appropriations, and its net revenues are reinvested in its programs and used to support bond ratings. In addition, the Authority participates in the Government National Mortgage Association (Ginnie Mae or GNMA) Mortgage Backed Securities (MBS) Programs. Through the MBS Programs, Ginnie Mae guarantees securities that are issued by the Authority and backed by pools of mortgage loans. Holders of the securities receive a “pass-through” of the principal and interest payments on a pool of mortgage loans, less amounts required to cover servicing costs and Ginnie Mae guaranty fees. The Ginnie Mae guaranty ensures that the holder of the security issued by the Authority receives the timely payment of scheduled monthly principal and any unscheduled recoveries of principal on the underlying mortgage loans, plus interest at the rate provided for in the securities. All loans pooled under the Ginnie Mae MBS Programs are either insured by the Federal Housing Administration or United States Department of Agriculture Rural Development, or are guaranteed by the Veterans Administration. Overview of the Financial Statements The basic financial statements consist of a Statement of Net Position, a Statement of Revenues, Expenses and Changes in Net Position, a Statement of Cash Flows and the notes thereto. The Authority, a body corporate and political subdivision of the State of Colorado, is a public purpose financial enterprise and therefore follows enterprise fund accounting. The financial statements offer information about the Authority’s activities and operations. The Statement of Net Position includes all of the Authority’s assets and liabilities, presented in order of liquidity, along with deferred outflows and deferred inflows. The resulting net position presented in these statements is displayed as invested in capital assets, restricted or unrestricted. Net position is restricted when its use is subject to external limits such as bond indentures, legal agreements or statutes. Over time, increases or decreases in net position may serve as a useful indicator of whether the financial assets of the Authority are improving or deteriorating. All of the Authority’s current year revenues and expenses are recorded in the Statement of Revenues, Expenses and Changes in Net Position. This statement measures the activities of the Authority’s operations over the past year and presents the resulting change in net position - calculated as revenues less expenses. The final required financial statement is the Statement of Cash Flows. The primary purpose of this statement is to provide information about the Authority’s cash receipts and cash payments during the reporting period. This statement reports cash receipts, cash payments and net changes in cash resulting from operating, noncapital financing, capital and related
Management’s Discussion and Analysis
(unaudited)
6
financing and investing activities. The statement provides information regarding the sources and uses of cash and the change in the cash balance during the reporting period. The notes to the financial statements provide additional information that is essential for a full understanding of the information provided in the financial statements. The notes follow the Statement of Cash Flows. Debt Activity The Authority issued $10.5 million in Multi-Family/Project 2012 Series A and $17.5 million in Multi-Family/Project 2012 Series B bonds during the third quarter of 2012 to finance different multi-family projects. In an effort to reduce liquidity facility needs, the Authority refunded or converted $335.8 million in outstanding single family variable rate demand obligations (VRDOs) into floating rate notes (FRNs) during 2012. Refunding or converting VRDOs requiring liquidity facilities into FRNs has proven to be an effective means for the Authority to reduce costs related to the indenture and we will continue to seek these opportunities in 2013. During 2012, the Authority put in place a new $58.9 million liquidity facility and renewed $245.1 million in expiring liquidity agreements. The Authority also entered into a number of replacement liquidity facility agreements with high quality banks in order to eliminate exposure from existing facility providers that were facing declining credit ratings. To this end, the Authority put in place $147.8 million in replacement liquidity agreements. The Authority novated (transferred) $275.8 million in swap agreements from AIG to Wells Fargo in December 2012. The novation was undertaken to eliminate the weaker credit counterparty, AIG, in favor of a stronger one, Wells Fargo, and the floating rate calculation was changed to be based on LIBOR in the new agreements. The Authority will evaluate additional novation and replacement opportunities that may arise in 2013. Programs – The financial statements present the activities of the Authority’s housing and lending programs. Combining schedules for these programs are provided in the supplemental schedules. Financial Highlights
Total net loans receivable as of December 31, 2012 were $1.9 billion, a decrease of $357.2 million, or 15.5%,
compared to the amount outstanding as of December 31, 2011. Loan repayments occurred without a corresponding increase in new loans retained as the Authority continued to issue and sell Ginnie Mae securities during the year. During 2012, $365.5 million in loans were sold through the issuance of Ginnie Mae securities.
Total investments as of December 31, 2012 were $800.9 million, a decrease of $83.7 million, or 9.5%, compared to the amount outstanding as of December 31, 2011. The decrease in investments was due to scheduled bond payments and additional unscheduled redemptions.
Total deferred outflows as of December 31, 2012 were $233.5 million, a decrease of $33.9 million, or 12.7%, compared to the amount outstanding as of December 31, 2011, which reflects market expectations of future interest rate increases (increase in forward yield curve).
As of December 31, 2012, total debt outstanding was $2.5 billion, a decrease of $426.3 million, or 14.5%, compared to the balance at December 31, 2011. Payments of loans have been used to reduce bond balances.
Management’s Discussion and Analysis
(unaudited)
7
Net position as of December 31, 2012 was $312.2 million, an increase of $41.7 million, or 15.4%, compared to the balance at December 31, 2011, increasing the Authority’s capital position. Net position as a percent of total assets increased from 8.0% as of December 31, 2011 to 10.5% as of December 31, 2012.
As reflected in the Statement of Revenues, Expenses and Changes in Net Position, the change in net position increased by $24.7 million, or 145.9%, compared to December 31, 2011. The increase in the change in net position compared to prior year was primarily composed of the following:
A $6.6 million decrease in net interest income as a result of lower investment rates and higher bond expenses.
A $30.2 million decrease in other operating revenues is a result of the following:
$6.1 million decrease in real estate owned (REO) rental income.
$8.3 million increase in gain on sale of loans.
$12.1 million increase in investment derivative activity loss.
$22.3 million decrease in fair value of investments.
$2.0 million increase in loan servicing and other revenues.
A $22.3 million decrease in operating expenses due primarily to a decrease in costs related to the Lehman swap termination settlement.
A $39.2 million increase in gain on sale of capital assets due to the sale of the four Rental Acquisition Program (RAP) properties during the first quarter of 2012.
Management’s Discussion and Analysis
(unaudited)
8
Analysis of Financial Activities Condensed Summary of Net Position (in thousands of dollars)
For the years ended December 31, 2012 2011 2010
Assets
Cash 156,431$ 89,292$ 91,981$
Investments 800,929 884,670 872,861
Loans receivable 1,915,886 2,264,846 2,601,983
Loans receivable held for sale 29,967 38,206 47,478
Capital assets, net 8,110 24,160 26,741
Other assets 60,666 70,365 79,061
Total assets 2,971,989 3,371,539 3,720,105
Deferred Outflows
Accumulated decrease in fair value of hedging derivatives 233,514 267,410 180,245
Liabilities
Bonds and notes payable, net and short-term debt 2,509,249 2,935,507 3,303,668
Derivative instruments and related borrowings 312,524 335,558 243,572
Other liabilities 70,062 97,362 99,531
Total liabilities 2,891,835 3,368,427 3,646,771
Deferred Inflows
Accumulated increase in fair value of hedging derivatives 1,489 - -
Net position:
Invested in capital assets 8,110 24,160 26,741
Restricted by bond indentures 129,758 137,096 113,252
Unrestricted 174,311 109,266 113,586
Total net position 312,179$ 270,522$ 253,579$
Comparison of Years Ended December 31, 2012 and 2011 Total assets decreased $399.6 million, or 11.9%, from the prior year. Cash and investments, combined, decreased $16.6 million, or 1.7%. Loans receivable decreased by $357.2 million, or 15.5%, as a result of loan repayments occurring without a corresponding increase in new loans retained as the Authority continued to issue and sell Ginnie Mae securities during the year. Deferred outflows decreased $33.9 million, or 12.7%, from the prior year, due to market expectations of future interest rate increases (increase in the forward yield curve). Total liabilities decreased $476.6 million, or 14.1%, from the prior year. Bonds and notes payable decreased $426.3 million, or 14.5%, primarily due to scheduled bond payments and additional unscheduled redemptions. Derivative instruments and related borrowings decreased $23.0 million, or 6.9%, from prior year due to a slight increase in market interest rates.
Management’s Discussion and Analysis
(unaudited)
9
Comparison of Years Ended December 31, 2011 and 2010 Total assets decreased $348.6 million, or 9.4%, from the prior year. Cash and investments, combined, increased $9.1 million, or 1.0%. Loans receivable decreased by $346.4 million, or 13.1%, as a result of loan repayments occurring without a corresponding increase in new loans retained as the Authority continued to issue Ginnie Mae securities during the year. Deferred outflows increased $87.2 million, or 48.4%, from the prior year, due to a decline in market expectations of future interest rates (decline in the forward yield curve). Total liabilities decreased $278.3 million, or 7.6%, from the prior year. Bonds and notes payable decreased $368.2 million, or 11.1%, primarily due to scheduled bond payments and additional unscheduled redemptions. Derivative instruments and related borrowings increased $92.0 million, or 37.8%, from prior year due to declining market interest rates. Subsequent Events In 2012, the Authority established a contractual, sub-servicing relationship with Dovenmuehle Mortgage, Inc. (DMI) for its single family portfolio beginning March 1, 2013. This approach will allow the Authority and its customers to benefit from the established infrastructure, technology, and economies of scale that a sub-servicer can provide. At the same time, it will reduce the Authority’s long-term costs, allowing the organization to remain focused on investing as much of its resources as possible back into its mission of affordable housing and business finance. The Authority will retain its mortgage servicing rights, which ensures that its ongoing vested and proactive relationship with its customers, investors, mortgage insurance providers, and guarantors will be actively maintained. Additionally, the Authority will retain key components of its internal loan servicing operation to help oversee DMI and to ensure that the Authority maintains an active and productive role in shaping the quality of loan servicing provided.
Management’s Discussion and Analysis
(unaudited)
10
Condensed Summary of Revenues, Expenses and Changes in Net Position (in thousands of dollars)
For the years ended December 31, 2012 2011 2010
Interest income and expense:
Interest on loans receivable 113,216$ 134,597$ 151,319$
Interest on investments 23,291 23,423 18,094
Interest on debt (123,606) (138,545) (141,458)
Net interest income 12,901 19,475 27,955
Other operating income (loss):
Rental income 2,675 8,804 9,306
Gain on sale of loans 25,103 16,792 19,817
Investment derivative activity loss (13,820) (1,715) (473)
Net increase in the fair value of investments 3,590 25,887 7,324
Other revenues 21,468 19,443 19,400
Total other operating income 39,016 69,211 55,374
Total operating income 51,917 88,686 83,329
Operating expenses:
Salaries and related benefits 17,836 18,210 17,808
General operating 19,750 40,783 55,636
Depreciation 2,722 3,684 3,773
Provision for loan losses 9,106 9,036 6,521
Total operating expenses 49,414 71,713 83,738
Net operating income (loss) 2,503 16,973 (409)
Nonoperating expenses:
Federal grant receipts 112,954 134,491 134,613
Federal grant payments (112,954) (134,491) (134,613)
Gain (loss) on sale of capital assets 39,154 (30) 128
Total nonoperating income and expenses, net 39,154 (30) 128
Change in net position 41,657 16,943 (281)
Net position:
Beginning of year 270,522 253,579 253,860
End of year 312,179$ 270,522$ 253,579$
Management’s Discussion and Analysis
(unaudited)
11
Comparison of Years Ended December 31, 2012 and 2011 Total operating income decreased by $36.8 million in 2012, or 41.5%, compared to 2011. The following contributed to the decrease:
Interest income decreased by $21.5 million in 2012 as a result of higher prepayments without a corresponding increase in new loan production retained.
Interest expense related to debt decreased by $14.9 million due to lower outstanding balances.
Gain on sale of loans increased by $8.3 million in 2012 related primarily to the increased amount of issuance of GNMA securities.
The fair value of investments decreased by $22.3 million due primarily to stable market interest rates during 2012. Total operating expenses decreased $22.3 million in 2012, or 31.1%, compared to 2011. The decrease was primarily due to a decrease in general operating costs related to the Lehman swap termination settlement. Total nonoperating revenues and expenses, net, increased by $39.1 million, or 100%, compared to 2011. The increase is due to the gain on sale of RAP properties. The federal grant receipts/payments consist primarily of pass-through amounts related to the Authority’s role as a contract administrator of the U.S. Department of Housing and Urban Development’s Section 8 subsidy program. Under the Section 8 subsidy program, tenants pay 30% of their income toward rent and the balance is paid by federal subsidy. Comparison of Years Ended December 31, 2011 and 2010 Total operating income increased by $5.4 million in 2011, or 6.4%, compared to 2010. The following contributed to the increase:
Interest income decreased by $11.4 million in 2011 as a result of higher prepayments without a corresponding new loan investment.
Interest expense related to debt decreased by $2.9 million due to lower outstanding balances.
Gain on sale of loans decreased by $3.0 million in 2011 related primarily to the reduced amount of issuance of GNMA securities.
The fair value of investments increased by $18.6 million due primarily to a decrease in market interest rates during 2011.
Total operating expenses decreased $12.0 million in 2011, or 14.4%, compared to 2010. The decrease was primarily due to an increase in salaries and related benefits due to increased staffing, merit increases and health insurance costs, a decrease in general operating costs related to swap terminations, a decrease in depreciation expense due to assets becoming fully depreciated and an increase in provision for loan losses due to increasing delinquencies and foreclosures. Total nonoperating revenues and expenses, net, consist primarily of pass-through amounts related to the Authority’s role as a contract administrator of the U.S. Department of Housing and Urban Development’s Section 8 subsidy program. Under the Section 8 subsidy program, tenants pay 30% of their income toward rent and the balance is paid by federal subsidy.
12
INDEPENDENT AUDITORS’ REPORT
13
Independent Auditors’ Report
The Board of Directors
Colorado Housing and Finance Authority
Denver, Colorado
Report on the Financial Statements
We have audited the accompanying financial statements of the business-type activities of the Colorado
Housing and Finance Authority (the Authority) as of and for the years ended December 31, 2012 and 2011,
and the related notes to the financial statements, which collectively comprise the Authority’s basic
financial statements as listed in the table of contents.
Management’s Responsibility for the Financial Statements
Management is responsible for the preparation and fair presentation of these financial statements in
accordance with U.S. generally accepted accounting principles; this includes the design, implementation,
and maintenance of internal control relevant to the preparation and fair presentation of financial statements
that are free from material misstatement, whether due to fraud or error.
Auditors’ Responsibility
Our responsibility is to express an opinion on these financial statements based on our audits. We conducted
our audits in accordance with auditing standards generally accepted in the United States of America and
the standards applicable to financial audits contained in Government Auditing Standards, issued by the
Comptroller General of the United States. Those standards require that we plan and perform the audits to
obtain reasonable assurance about whether the financial statements are free from material misstatement.
An audit involves performing procedures to obtain audit evidence about the amounts and disclosures in the
financial statements. The procedures selected depend on the auditors’ judgment, including the assessment
of the risks of material misstatement of the financial statements, whether due to fraud or error. In making
those risk assessments, the auditor considers internal control relevant to the entity’s preparation and fair
presentation of the financial statements in order to design audit procedures that are appropriate in the
circumstances, but not for the purpose of expressing an opinion on the effectiveness of the entity’s internal
control. Accordingly, we express no such opinion. An audit also includes evaluating the appropriateness of
accounting policies used and the reasonableness of significant accounting estimates made by management,
as well as evaluating the overall presentation of the financial statements.
We believe that the audit evidence we have obtained is sufficient and appropriate to provide a basis for our
audit opinion.
KPMG LLP Suite 800 1225 17th Street Denver, CO 80202-5598
KPMG LLP is a Delaware limited liability partnership, the U.S. member firm of KPMG International Cooperative (“KPMG International”), a Swiss entity.
14
Opinion
In our opinion, the financial statements referred to above present fairly, in all material respects, the
financial position of the business-type activities of the Colorado Housing and Finance Authority as of
December 31, 2012 and 2011, and the changes in financial position and cash flows for the years then
ended, in accordance with U.S. generally accepted accounting principles.
Other Matters
Required Supplementary Information
U.S. generally accepted accounting principles require that the management’s discussion and analysis on
pages 4 – 11 be presented to supplement the basic financial statements. Such information, although not a
part of the basic financial statements, is required by the Governmental Accounting Standards Board who
considers it to be an essential part of financial reporting for placing the basic financial statements in an
appropriate operational, economic, or historical context. We have applied certain limited procedures to the
required supplementary information in accordance with auditing standards generally accepted in the United
States of America, which consisted of inquiries of management about the methods of preparing the
information and comparing the information for consistency with management’s responses to our inquiries,
the basic financial statements, and other knowledge we obtained during our audits of the basic financial
statements. We do not express an opinion or provide any assurance on the information because the limited
procedures do not provide us with sufficient evidence to express an opinion or provide any assurance.
Supplementary and Other Information
Our audit was conducted for the purpose of forming an opinion on the financial statements that collectively
comprise the Authority’s basic financial statements as a whole. The supplementary information included in
Schedules 1 through 7 is presented for purposes of additional analysis and is not a required part of the basic
financial statements.
The supplementary information included in Schedules 1 through 7 is the responsibility of management and
was derived from and relates directly to the underlying accounting and other records used to prepare the
basic financial statements. Such information has been subjected to the auditing procedures applied in the
audit of the basic financial statements and certain additional procedures, including comparing and
reconciling such information directly to the underlying accounting and other records used to prepare the
basic financial statements or to the basic financial statements themselves, and other additional procedures
in accordance with auditing standards generally accepted in the United States of America. In our opinion,
the supplementary information included in Schedules 1 through 7 is fairly stated in all material respects in
relation to the basic financial statements as a whole.
The executive letter has not been subjected to the auditing procedures applied in the audit of the basic
financial statements, and accordingly, we do not express an opinion or provide any assurance on them.
15
Other Reporting Required by Government Auditing Standards
In accordance with Government Auditing Standards, we have also issued our report dated March 28, 2013
on our consideration of the Authority’s internal control over financial reporting and on our tests of its
compliance with certain provisions of laws, regulations, contracts, and grant agreements and other matters.
The purpose of that report is to describe the scope of our testing of internal control over financial reporting
and compliance and the results of that testing, and not to provide an opinion on internal control over
financial reporting or on compliance. That report is an integral part of an audit performed in accordance
with Government Auditing Standards in considering the Authority’s internal control over financial
reporting and compliance.
Denver, Colorado
March 28, 2013
16
BASIC FINANCIAL STATEMENTS
17
Colorado Housing and Finance Authority
Statements of Net Position
(in thousands of dollars)
2012 2011
Assets
Current assets:
Cash
Restricted 89,268$ 56,011$
Unrestricted 67,163 33,281
Investments (partially restricted, see note 2) 461,711 538,082
Loans receivable (partially restricted, see note 3) 93,831 113,701
Loans receivable held for sale 29,967 38,206
Other current assets 20,035 25,049
Total current assets 761,975 804,330
Noncurrent assets:
Investments (partially restricted, see note 2) 339,218 346,588
Loans receivable, net (partially restricted, see note 3) 1,822,055 2,151,145
Capital assets, net 8,110 24,160
Other assets 40,631 45,316
Total noncurrent assets 2,210,014 2,567,209
Total assets 2,971,989 3,371,539
Deferred Outflows
Accumulated decrease in fair value of hedging derivatives 233,514 267,410
Liabilities
Current liabilities:
Short-term debt 71,475 46,100
Bonds payable 172,041 321,512
Notes payable 103 104
Other current liabilities 64,140 73,421
Total current liabilities 307,759 441,137
Noncurrent liabilities:
Bonds and notes payable, net 2,265,630 2,567,791
Derivative instruments 239,291 281,951
Hybrid instrument borrowing 73,233 53,607
Other liabilities 5,922 23,941
Total noncurrent liabilities 2,584,076 2,927,290
Total liabilities 2,891,835 3,368,427
Deferred Inflows
Accumulated increase in fair value of hedging derivatives 1,489 -
Net position
Invested in capital assets 8,110 24,160
Restricted by bond indentures 129,758 137,096
Unrestricted 174,311 109,266
Total net position 312,179$ 270,522$
For the years ended December 2012 and 2011
See accompanying notes to basic financial statements.
18
Colorado Housing and Finance Authority
Statements of Revenues, Expenses and Changes in Net Position
(in thousands of dollars)
2012 2011
Interest income and expense:
Interest on loans receivable 113,216$ 134,597$
Interest on investments 23,291 23,423
Interest on debt (123,606) (138,545)
Net interest income 12,901 19,475
Other operating income (loss):
Rental income 2,675 8,804
Gain on sale of loans 25,103 16,792
Investment derivative activity loss (13,820) (1,715)
Net increase in the fair value of investments 3,590 25,887
Other revenues 21,468 19,443
Total other operating income 39,016 69,211
Total operating income 51,917 88,686
Operating expenses:
Salaries and related benefits 17,836 18,210
General operating 19,750 40,783
Depreciation 2,722 3,684
Provision for loan losses 9,106 9,036
Total operating expenses 49,414 71,713
Net operating income 2,503 16,973
Nonoperating income and expenses:
Federal grant receipts 112,954 134,491
Federal grant payments (112,954) (134,491)
Gain (loss) on sale of capital assets 39,154 (30)
Total nonoperating income and expenses 39,154 (30)
Change in net position 41,657 16,943
Net position:
Beginning of year 270,522 253,579
End of year 312,179$ 270,522$
For the years ended December 2012 and 2011
See accompanying notes to basic financial statements.
19
Colorado Housing and Finance Authority
Statements of Cash Flows
(in thousands of dollars)
2012 2011
Cash flows from operating activities:
Principal payments received on loans receivable
and receipts from dispositions of other real estate owned $ 411,579 $ 303,302
Interest payments received on loans receivable 116,272 138,083
Payments for loans receivable (427,769) (367,983)
Receipts from sales of Ginnie Mae securities 390,631 420,989
Receipts from rental operations 2,865 8,748
Receipts from other revenues 21,731 19,391
Payments for salaries and related benefits (17,617) (18,775)
Payments for goods and services (50,009) (41,362)
All other, net 8,688 1,503 -
Net cash provided by operating activities 456,371 463,896
Cash flows from noncapital financing activities:
Net increase (decrease) in short-term debt 25,375 (41,800)
Proceeds from issuance of bonds 133,375 266,435
Proceeds from (payments on) issuance of notes payable 137 1,388
Receipts from federal grant programs 114,064 135,352
Payments for federal grant programs (112,954) (134,491)
Principal paid on bonds (579,500) (583,898)
Payments on terminations of interest rate swaps 5,337 -
Principal paid on notes payable (103) (105)
Interest paid on short-term debt (182) (271)
Interest rate swap settlements (84,086) (92,102)
Interest paid on bonds (50,036) (49,000)
Interest paid on notes payable (1,140) (756)
Bond issuance costs paid (1,788) (1,728) -
Net cash used in noncapital financing activities (551,501) (500,976)
Cash flows from capital and related financing activities:
Purchase of capital assets (487) (1,133)
Proceeds from the disposal of capital assets 52,970 -
Net cash provided by (used in) capital and related financing activities 52,483 (1,133)
Cash flows from investing activities:
Proceeds from maturities and sales of investments 2,761,770 3,089,608
Purchase of investments (2,674,441) (3,075,530)
Income received from investments 22,457 21,446
Net cash provided by investing activities 109,786 35,524
Net increase (decrease) in cash 67,139 (2,689)
Cash at beginning of year 89,292 91,981
Cash at end of year $ 156,431 $ 89,292
Restricted $ 89,268 $ 56,011
Unrestricted 67,163 33,281
Cash, end of year $ 156,431 $ 89,292
For the years ended December 2012 and 2011
Continued on the next page
20
Colorado Housing and Finance Authority
Statements of Cash Flows (continued)
For the years ended December 2012 and 2011
(in thousands of dollars)
2012 2011
Reconciliation of operating income to net cash
provided (used) by operating activities:
Net operating income $ 2,503 $ 16,973
Adjustments to reconcile operating income to
net cash provided by operating activities:
Depreciation expense 2,722 3,684
Amortization of service release premiums 6,060 3,538
Amortization of deferred loan fees/costs, net 222 65
Amortization of derivatives related borrowings (6,807) (6,364)
Provision for loan losses 9,106 9,036
Interest on investments (23,291) (23,418)
Interest on debt 130,412 144,909
Unrealized loss on investment derivatives 13,820 1,715
Unrealized gain on investments (3,590) (25,887)
(Gain) loss on sale of REO (1,166) 1,631
Gain on sale of loans receivable held for sale (25,103) (16,792)
Changes in assets and liabilities:
Loans receivable and other real estate owned 369,368 350,818
Accrued interest receivable on loans and investments 3,014 3,742
Other assets 3,046 1,446
Accounts payable and other liabilities (23,945) (1,200)
Net cash provided by operating activities $ 456,371 $ 463,896
See accompanying notes to basic financial statements.
21
NOTES TO BASIC FINANCIAL STATEMENTS
Notes to Basic Financial Statements
(tabular dollar amounts are in thousands)
22
1) Organization and Summary of Significant Accounting Policies (a) Authorizing Legislation and Reporting Entity Authorizing Legislation - The Colorado Housing and Finance Authority (the Authority) is a body corporate and a political subdivision of the State of Colorado (the State) established pursuant to the Colorado Housing and Finance Authority Act, Title 29, Article 4, Part 7 of the Colorado Revised Statutes, as amended (the Act). The Authority is not a state agency and is not subject to administrative direction by the State. The governing body of the Authority is its board of directors (the Board). Operations of the Authority commenced in 1974. The Authority is not a component unit of the State or any other entity.
The Authority was created for the purpose of making funds available to assist private enterprise and governmental entities in providing housing facilities for lower- and moderate-income families. Under the Act, the Authority is also authorized to finance projects and working capital loans to industrial and commercial enterprises (both for-profit and nonprofit) of small and moderate size.
In 1992, Colorado voters approved an amendment to the State Constitution, Article X, Section 20, which, among other things, imposes restrictions on increases in revenue and expenditures of state and local governments. In the opinion of its bond counsel, the Authority qualifies as an enterprise under the amendment and therefore is exempt from its provisions.
In 2001, the Colorado state legislature repealed the limitation on the amount of debt that the Authority can issue as well as removed the moral obligation of the State on future debt issues of the Authority. The bonds, notes and other obligations of the Authority do not constitute debt of the State. Blended Component Units – Rental Acquisition Program (RAP) - Hyland Park Centre Corporation (Hyland Park), Tanglewood Oaks Apartments Corporation (Tanglewood), and Village of Yorkshire Corporation (Yorkshire) have been designated as blended component units and included in the Authority's financial statements. Hyland Park, Tanglewood and Yorkshire were public, nonprofit instrumentalities of the Authority, each of which owns and operates a single, separate multi-family rental housing project. In March 2012, the Authority completed the sale of the real estate for all Blended Component Units. In addition, the Authority completed the sale of real estate for Maple Tree Settlement, which is not a Blended Component Unit, but is part of the RAP. Each of these properties was sold at a gain. The gain on sale is reported in nonoperating revenues and expenses, net. Lending and Housing Programs – The Authority accounts for its lending and operating activities in the following groups:
General Program – The General Program is the Authority’s primary operating program. It accounts for assets, liabilities, revenues and expenses not directly attributable to a bond program. Most of the bond resolutions of the programs permit the Authority to make cash transfers to the general accounts after establishing reserves required by the bond resolutions. The general accounts financially support the bond programs when necessary. The general accounts include proprietary loan programs developed by the Authority to meet the needs of low- and moderate-income borrowers not served by traditional lending programs. The general accounts also include administrative activities related to the federal government’s Section 8 housing assistance payments program. Single Family Program – The Single Family Program includes bonds issued and assets pledged for payment of the bonds under the related indentures. Loans acquired under this program with the proceeds of single family bond issues include Federal Housing Administration (FHA), conventional, United States Department of Agriculture (USDA) Rural Development, Rural Economic and Community Development Department (RD), and Veterans Administration (VA) loans made under various loan programs.
Notes to Basic Financial Statements
(tabular dollar amounts are in thousands)
23
Multi-Family/Business Program – The Multi-Family/Business Program includes bonds issued and assets pledged for payment of the bonds under the related indentures. Loans acquired under this program with the proceeds of multi-family and business (sometimes referred to as project) bond issues include loans made for the purchase, construction or rehabilitation of multi-family rental housing. In addition, business loans are made to both for-profit and nonprofit organizations primarily for the purpose of acquisition or expansion of their facilities or for the purchase of equipment.
(b) Basis of Accounting The Authority presents its financial statements in accordance with United States Generally Accepted Accounting Principles (U.S. GAAP) as established by the Governmental Accounting Standards Board (GASB). For financial purposes, the Authority is considered a special-purpose government engaged in business-type activities. The financial statements are prepared using the economic resources measurement focus and the accrual basis of accounting. Under the accrual basis, revenues are recognized when earned, and expenses are recorded when incurred. All significant intra-entity transactions have been eliminated.
(c) Summary of Significant Accounting Policies Estimates – The preparation of financial statements in conformity with U.S. GAAP requires management to make estimates and assumptions that affect the reported amounts of assets and liabilities and disclosure of contingent assets and liabilities at the date of the financial statements and the reported amounts of revenue and expenses during the reported period. Significant estimates to the Authority’s financial statements include the allowance for loan losses and fair value estimates. Actual results could differ from those estimates. Cash and Restricted Cash – The Authority’s cash and cash equivalents are represented by cash on hand and demand deposits held in banks. Restricted cash includes payments received on pledged assets and used for the payment of bonds under the related indenture agreements. Also included in restricted cash are escrow balances, payments in process and various government deposits. Restricted Assets – Essentially all investments and loans receivable are restricted assets. Restricted assets are held for the benefit of respective bondholders and accounted for by program. Certain other assets are held on behalf of various governmental housing initiatives or regulations. Investments – Noncurrent investments of the Authority, representing those investments which are held as reserves under indenture or other restrictions, are reported at fair value based on values obtained from third-party pricing services. The values are based on quoted market prices when available or on adjusted value in relation to observable prices on similar investments. All other investments are reported at amortized cost. Virtually all investments are restricted. Loans Receivable – Mortgage loans receivable are reported at their unpaid principal balance net of deferred down payment assistance expense, deferred fee income, loan origination costs and an allowance for estimated loan losses. Deferred down payment assistance expense, deferred fee income and loan origination costs are capitalized and amortized over the contractual life of the loan using the effective interest method. Virtually all mortgage loans receivable are serviced by the Authority and are restricted. Loans Receivable Held for Sale – Loans originated or acquired and intended for sale in the secondary market are carried at the lower of cost or fair value. Gains and losses on loan sales (sales proceeds minus carrying value) are reported as other operating income. Allowance for Loan Losses – The allowance for loan losses is a reserve against current operations based on management's estimate of expected loan losses. Management’s estimate considers such factors as the payment history of the loans, the projected cash flows of the borrowers, estimated value of the collateral, subsidies, guarantees, mortgage
Notes to Basic Financial Statements
(tabular dollar amounts are in thousands)
24
insurance, historical loss experience for each loan type, additional guarantees provided by the borrowers and economic conditions. Based on the review of these factors, a total reserve amount is calculated and a provision is made against current operations to reflect the estimated balance. Troubled Debt Restructuring – A restructuring of a debt constitutes a troubled debt restructuring if the creditor for economic or legal reasons related to the debtor’s financial difficulties grants a concession to the debtor that it would not otherwise consider. Whatever the form of concession granted by the creditor to the debtor in a troubled debt restructuring, the creditor’s objective is to make the best of a difficult situation. That is, the creditor expects to obtain more cash or other value from the debtor, or to increase the probability of receipt, by granting the concession than by not granting it. Interest income is recognized using the new interest rate after restructuring, which approximates the effective interest rate. Additional information is disclosed in the loans receivable note. See note 3. Capital Assets – The Authority’s capital assets consist of two groups. Corporate capital assets include those capital assets other than those used in its RAP activities. The RAP properties were sold in 2012 at a gain. Capital assets are defined by the Authority as assets with an initial, individual cost of $2,500. Capital assets are depreciated or amortized using the straight-line method over their estimated useful lives, which are 30 years for buildings and from 3 to 10 years for furniture and equipment. Other Assets – The major other assets are as follows:
Mortgage servicing rights (servicing release premiums): amortized over the life of the related loans using the effective interest method. Unamortized costs totaling $18.9 million and $21.5 million were outstanding at December 31, 2012 and 2011, respectively. Included in these amounts are mortgage servicing rights of $9.5 million and $9.5 million as of December 31, 2012 and 2011, respectively, related to loans sold by the Authority for which the Authority retained the mortgage servicing rights. These mortgage servicing rights are reported at the lower of cost or fair value. In 2012, the Authority recognized an impairment loss of $2.4 million due to a decrease in the current Ginnie Mae security interest rate compared to the Authority’s Ginnie Mae portfolio weighted rate. The impairment loss is reported in general operating expense on the Statement of Revenues, Expenses and Changes in Net Position. In 2011, the Authority recognized an impairment loss of $635 thousand.
Other real estate owned (REO): represents real estate acquired through foreclosure and in-substance foreclosures. Other real estate owned is recorded at the lower of the investment in the loan or the estimated net realizable value, which equals estimated fair value minus closing costs.
Bond and note issuance costs: costs of debt issuance are deferred and amortized to interest expense over the lives of the bond issues using the effective interest method.
Bonds – Bonds payable are limited obligations of the Authority, and are not a debt or liability of the State or any subdivisions thereof. Each bond issue is secured, as described in the applicable trust indenture, by all revenues, moneys, investments, mortgage loans, and other assets in the accounts of the program. Substantially all of the Authority’s loans and investments are pledged as security for the bonds. The provisions of the applicable trust indentures require or allow for redemption of bonds through the use of unexpended bond proceeds and excess funds accumulated primarily through prepayment of mortgage loans and program certificates. All outstanding bonds are subject to redemption at the option of the Authority, in whole or in part at any time after certain dates, as specified in the respective series indentures. The Authority issues fixed rate and variable rate bonds. The rate on the fixed rate bonds is set at bond closing. The variable rate bonds bear interest at either a monthly or a weekly rate until maturity or earlier redemption. For bonds that pay weekly rates, the remarketing agent for each bond issue establishes the weekly rate according to each indenture’s remarketing agreement. The weekly rates are communicated to the various bond trustees for preparation of debt service payments. The weekly rate, as set by the remarketing agent, allows the bonds to trade in the secondary market at a price
Notes to Basic Financial Statements
(tabular dollar amounts are in thousands)
25
equal to 100% of the principal amount of the bonds outstanding, with each rate not exceeding maximum rates permitted by law. The variable rate bonds that bear interest monthly are based on the one-month London Interbank Offered Rate (LIBOR). Variable rate bonds have an assumed Stand-by Purchase Agreement (SBPA), which states that the issuer of the SBPA will purchase the bonds in the event the remarketing agent is unsuccessful in marketing the bonds. In this event, the interest rate paid by the Authority will be calculated using a defined rate from the SBPA. If the bonds remain unsold for a period of 90 days, they are deemed to be “bank bonds” and the Authority is required to repurchase the bonds from the SBPA issuer. The timing of this repurchase, or term out, will vary by issuer from two years to ten years. Bond Discounts and Premiums – Discounts and premiums on bonds payable are amortized to interest expense over the lives of the respective bond issues using the effective interest method. Debt Refundings – For current refundings and advance refundings resulting in defeasance of debt, the difference between the reacquisition price and the net carrying amount of the old debt is deferred and amortized as a component of interest expense over the remaining life of the old or new debt, whichever is shorter. The difference is amortized using the effective interest method, with the exception of the amount relating to deferred loss on interest rate swap hedging relationship termination, which is amortized on a straight-line basis. The deferred refunding amounts are classified as a component of bonds payable in the statement of net position. Derivative Instruments – Derivative instruments, as defined in GASB No. 53, Accounting and Financial Reporting for Derivative Instruments, are measured on the Statement of Net Position at fair value. Changes in fair value for those derivative instruments that meet the criteria for hedging instruments under GASB No. 53 are reported as deferred inflows and outflows. Changes in fair value of investment derivative instruments, which are ineffective derivative instruments, are reported within investment derivative activity loss in the period of change. Derivative Instruments - Interest Rate Swap Agreements – The Authority enters into interest rate swap agreements (Swap) with rated swap counterparties in order to (1) provide lower cost fixed rate financing for its loan production needs through synthetic fixed rate structures and (2) utilize synthetic fixed rate structures with refunding bonds in order to generate cash flow savings. The interest differentials to be paid or received under such swaps are recognized as an increase or decrease in interest expense of the related bond liability. The Authority enters into fixed payor swaps, where it pays a fixed interest rate in exchange for receiving a variable interest rate from the counterparty. The variable interest rate may be based on either a taxable or tax-exempt index. By entering into a swap agreement, the Authority hedges its interest rate exposure on the associated variable rate bonds. With the exception of one swap, at December 31, 2012 and 2011, all of the swaps are considered hedging derivatives. Additional information about the swap agreements is provided in note 8. Derivative Instruments - Forward Sales Contracts – Forward sales securities commitments and private investor sales commitments are utilized to hedge changes in fair value of mortgage loan inventory and commitments to originate mortgage loans. At December 31, 2012, the Authority had executed 31 forward sales transactions with an $88.0 million notional amount with five counterparties with concentrations and ratings (Standard and Poor’s/Moody’s Investors Service) as shown in note 8. The forward sales will all settle by March 19, 2013. These contracts are considered investment derivative instruments. Hybrid Instrument Borrowings – Hybrid instrument borrowings represent cash premiums received on interest rate swaps that had a fair value other than zero at the date of execution, generally because the fixed rates were different from market rates at that date. Interest expense is imputed on these borrowings, which are reported at amortized cost.
Notes to Basic Financial Statements
(tabular dollar amounts are in thousands)
26
Other Liabilities – The major other liabilities are as follows:
Servicing escrow: The net amount of collected escrow funds currently being held on behalf of borrowers to pay future obligations of property taxes and insurance premiums due on real properties. The Authority has a corresponding asset that is recorded in restricted cash.
Deferred Low Income Housing Tax Credit (LIHTC) Income: Compliance monitoring fees collected in advance on multi-family properties that have been awarded low-income housing tax credits to be used over a 15-year period. These fees cover the ongoing cost the Authority incurs to certify that these properties remain low-income compliant during the 15-year period and continue to be eligible to use the tax credits awarded.
Compensated Absences: Employees accrue paid time off at a rate based on length of service. Employees may accrue and carry over a maximum of 150% of their annual paid time off benefit. The liability for compensated absences is based on current salary rates and is reported in the Statement of Net Position.
Capital lease: The Authority includes as capital assets the present value of noncancelable lease payments for leases that qualify as a capital lease. Capital lease payments of principal and interest total $66 thousand per year through 2016.
Classification of Revenues and Expenses – The Authority distinguishes operating revenues and expenses from nonoperating items. Operating revenues and expenses generally result from providing services in connection with the Authority’s ongoing operations. The principal operating revenues of the Authority are interest income on loans and investment income. The Authority also recognizes revenues from rental operations and other revenues, which include loan servicing fees and other administrative fees. Operating expenses include interest expense, administrative expenses, depreciation, and the provision for loan losses. All revenues and expenses not meeting this definition are reported as nonoperating revenues and expenses. The Authority’s nonoperating revenues and expenses consist primarily of pass-through amounts related to the Authority’s role as a contract administrator of the U.S. Department of Housing and Urban Development’s Section 8 subsidy program. Under the Section 8 subsidy program, tenants pay 30% of their income toward rent and the balance is paid to the Authority by federal subsidy. In addition, under the federal government’s American Recovery and Reinvestment Act (ARRA), passed in February 2009, the Authority became the allocator of the Tax Credit Assistance Program (TCAP) and the Tax Credit Exchange Program (TCEP). The two programs were created to assist developers holding allocations of federal LIHTC. In 2009, the Authority received an allocation of over $60 million in federal funds to distribute to projects already underway across the State. As of December 31, 2011, all TCEP and TCAP funds have been distributed, and the Authority has no remaining obligations under the programs. Future Accounting Principles – GASB issued Statement No. 65, Items Previously Reported as Assets and Liabilities, which is effective for financial statements for periods beginning after December 15, 2012. The standard includes new requirements related to the proper classification of certain items that were previously reported as assets or liabilities as deferred outflows/inflows of deferred resources or the recognition of certain items that were previously reported as assets and liabilities as outflows (expenses)/inflows (revenues) of resources. These determinations are based on the definitions of those elements in GASB Concepts Statement No. 4, Elements of Financial Statements. This will be applicable to the Authority in 2013 as the Authority has a number of accounts that were previously recognized as assets or liabilities that will now be considered an outflow or inflow of resources, related to the purchase of loans and the issuing of bonds. In addition, GASB issued Statement No. 66, Technical Corrections - 2012, which is effective for financial statements for periods beginning after December 15, 2012. The standard is designed to improve accounting and financial reporting by resolving conflicting guidance that resulted from the issuance of two pronouncements – Statements No. 54, Fund Balance Reporting and Governmental Fund Type Definitions, and No. 62, Codification of Accounting and Financial Reporting Guidance Contained in Pre-November, 1989 FASB and AICPA Pronouncements. This standard will be applicable to the
Notes to Basic Financial Statements
(tabular dollar amounts are in thousands)
27
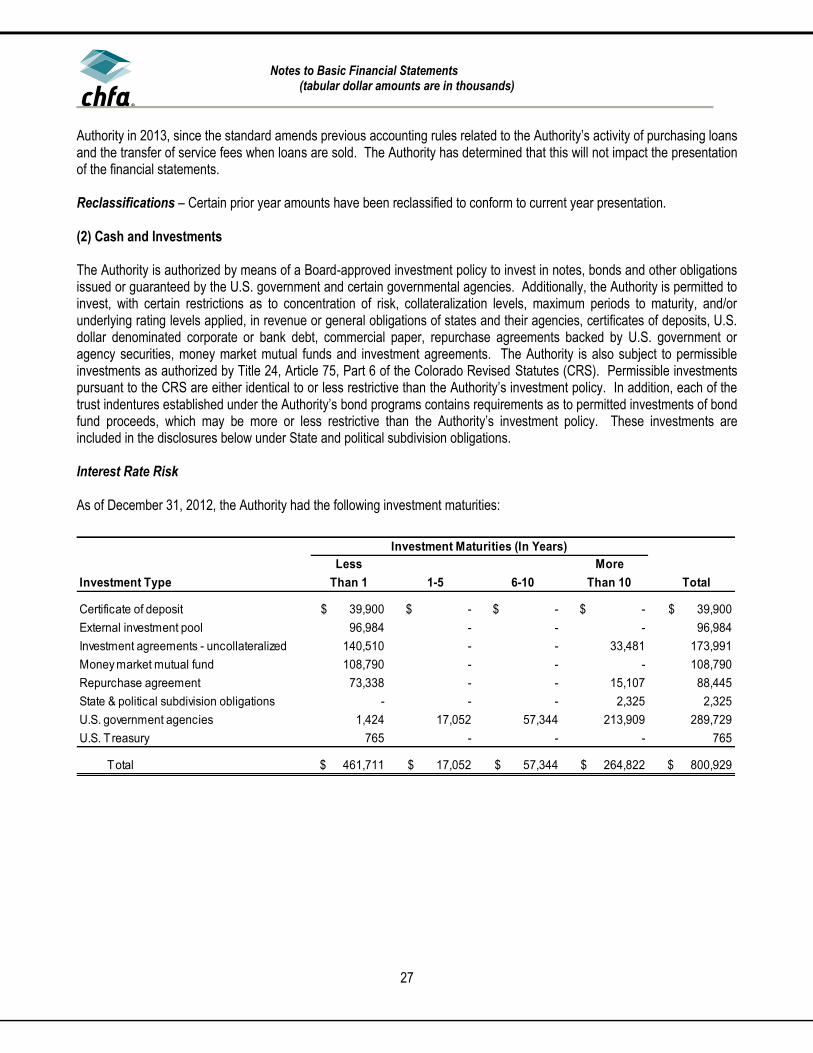
Authority in 2013, since the standard amends previous accounting rules related to the Authority’s activity of purchasing loans and the transfer of service fees when loans are sold. The Authority has determined that this will not impact the presentation of the financial statements. Reclassifications – Certain prior year amounts have been reclassified to conform to current year presentation. (2) Cash and Investments The Authority is authorized by means of a Board-approved investment policy to invest in notes, bonds and other obligations issued or guaranteed by the U.S. government and certain governmental agencies. Additionally, the Authority is permitted to invest, with certain restrictions as to concentration of risk, collateralization levels, maximum periods to maturity, and/or underlying rating levels applied, in revenue or general obligations of states and their agencies, certificates of deposits, U.S. dollar denominated corporate or bank debt, commercial paper, repurchase agreements backed by U.S. government or agency securities, money market mutual funds and investment agreements. The Authority is also subject to permissible investments as authorized by Title 24, Article 75, Part 6 of the Colorado Revised Statutes (CRS). Permissible investments pursuant to the CRS are either identical to or less restrictive than the Authority’s investment policy. In addition, each of the trust indentures established under the Authority’s bond programs contains requirements as to permitted investments of bond fund proceeds, which may be more or less restrictive than the Authority’s investment policy. These investments are included in the disclosures below under State and political subdivision obligations. Interest Rate Risk As of December 31, 2012, the Authority had the following investment maturities:
General Program investments of $45.9 million include investments pledged as of December 31, 2012 as follows: a $39.9 million certificate of deposit pledged to the Federal Home Loan Bank (FHLB) line of credit and COLOTRUST investments of Rural Development Loan Program (RDLP), RDLP II and RDLP V in the amounts of $313 thousand, $329 thousand and $22 thousand, respectively; each pledged as collateral for the RDLP notes payable and $688 thousand of investments pledged as collateral for private placement bonds. General Program investments of $9.7 million include investments pledged as of December 31, 2011 as follows: a $2.7 million certificate of deposit pledged to the FHLB line of credit and COLOTRUST investments of RDLP, RDLP II and RDLP V in the amounts of $152 thousand, $511 thousand and $18 thousand, respectively; each pledged as collateral for the RDLP notes payable and $2.0 million of investments pledged as collateral for private placement bonds. All Single Family and Multi-Family/Business Program investments, which total $755.0 million and $875.0 million as of December 31, 2012 and 2011, respectively, are restricted under bond indentures or other debt agreements, or otherwise pledged as collateral for borrowings. Interest rate risk is the risk that changes in interest rates will adversely affect the fair value of an investment. The Authority’s investment policy requires 1) staggered maturities to avoid undue concentrations of assets in a specific maturity sector, 2) stable income, 3) adequate liquidity to meet operations and debt service obligations, and 4) diversification to avoid overweighting in any one type of security.
Notes to Basic Financial Statements
(tabular dollar amounts are in thousands)
29
Credit Risk – The following table provides credit ratings of the Authority’s investments as determined by Standard and Poor’s and/or Moody’s Investors Service.
2012 2011
Investment Type Rating Total Rating Total
Certificate of deposit Not Rated $ 39,900 Not Rated $ 2,700
Money market mutual fund AAA/Aaa 108,790 AAA/Aaa/NR 275,372
Repurchase agreements AA/Aaa 88,833 AA/Aaa 67,864
State and political subdivision obligations AAA/Aaa/AA/Baa 2,325 AAA/Aaa/AA 2,587
U.S. government agencies AA/Aaa 289,729 AA/Aaa 296,696
U.S. Treasury AA/Aaa 765 AA/Aaa 658
Total 800,929$ 884,670$
Of the investments in securities issued by state and political subdivisions, 40.4% and 46.6% as of December 31, 2012 and 2011, respectively, are rated AAA. Investment agreements meet the requirements of the rating agency providing the rating on the related debt issue and of the Board’s investment policy. The Board’s investment policy states that the Authority is empowered to invest in any security that is a revenue or general obligation of any political subdivision. The credit rating at the time of purchase must be rated in one of its two highest rating categories by one or more nationally recognized organizations which regularly rate such obligations and concentration limits may not exceed more than 20% of the investment portfolio. As of December 31, 2012 and 2011, the Authority had invested in the Colorado Local Government Liquid Asset Trust (COLOTRUST), an investment vehicle established for local governmental entities in Colorado to pool funds available for investment. COLOTRUST is reflected in the above tables as an external investment pool. The State Securities Commissioner administers and enforces all State statutes governing COLOTRUST. COLOTRUST operates similarly to a money market fund and each share’s fair value is $1.00. Concentration of Credit Risk – The Authority has various maximum investment limits both by type of investment and by issuer to prevent inappropriate concentration of credit risk. The following table provides information on issuers in which the Authority has investments representing more than 5% of its total investments as of December 31, 2012 and 2011.
Issuer 2012 2011
External investment pool - COLOTRUST 12.11% 11.34%
Custodial Credit Risk – Investments – Custodial credit risk is the risk that, in the event of the failure of the custodian, the Authority will not be able to recover the value of its investment or collateral securities that are in the possession of the custodian. All securities owned by the Authority are either in the custody of the related bond indenture trustees or held in the name of the Authority by a party other than the issuer of the security. Custodial Credit Risk – Cash Deposits – In the case of cash deposits, custodial credit risk is the risk that in the event of a bank failure, the Authority’s deposits may not be returned to it. All deposit accounts were either covered by the Federal Deposit Insurance Corporation or collateralized in accordance with the State of Colorado’s Division of Banking’s Public Deposit Protection Act. Included in cash deposits are escrow deposits in the amount of $37.8 million and $24.7 million held in a fiduciary capacity as of December 31, 2012 and 2011, respectively. These escrow deposits are primarily held for the payment of property taxes and insurance on behalf of the mortgagors whose loans are owned or serviced by the Authority. (3) Loans Receivable, Related Allowances and Troubled Debt Restructuring Loans receivable and loans receivable held for sale at December 31, 2012 and 2011 consist of the following:
2012 2011
General Fund 191,864$ 222,249$
Single Family Fund:
Program Senior and Subordinate 20,640 54,300
Mortgage 1,050,852 1,285,980
Total Single Family Fund loans 1,071,492 1,340,280
Multi-Family/Business Fund:
Insured Mortgage Revenue 42,815 49,697
Multi-Family/Project 667,360 727,057
Total Multi-Family/Business Fund loans 710,175 776,754
Less intercompany loans, included in Multi-Family/Project above (2,726) (16,852)
Total loans receivable 1,970,805 2,322,431
Payments in process (5,024) 112
Deferred cash assistance expense 5,387 6,082
Deferred fee income (7,497) (8,150)
Allowance for loan losses (17,818) (17,423)
Total loans receivable, net 1,945,853$ 2,303,052$
Substantially all loans are restricted by bond indentures or other debt agreements. Loans in the Single Family Program and the Multi-Family/Business Program in the table above are grouped based on the related bond type (see note 6 for additional information). General Program loans include single family, multi-family and business finance loans acquired under various programs of the General Program, loans to be sold through the issuance of GNMA securities, loans held as investments, and loans
Notes to Basic Financial Statements
(tabular dollar amounts are in thousands)
31
backed by bonds within the General Program. These loans are typically collateralized by mortgages on real property and improvements. Certain of these loans are also guaranteed by agencies of the U.S. government. Single family bond program loans are collateralized by mortgages on applicable real property and, in the case of loans with an initial loan-to-value ratio of 80% or more, are generally either insured by the FHA or guaranteed by the VA or RD or insured by private mortgage insurance. The single family loan portfolio included in the general and single family programs as of December 31, 2012 comprised of $746.9 million of FHA insured loans, $58.9 million of VA guaranteed loans, $33.2 million of RD loans and $195.2 million of conventional insured loans with the balance of $143.6 million made up of uninsured conventional and second mortgage loans. The single family loan portfolio included in the general and single family programs as of December 31, 2011 comprised of $926.5 million of FHA insured loans, $84.4 million of VA guaranteed loans, $38.9 million of RD loans and $249.2 million of conventional insured loans with the balance of $168.0 million made up of uninsured conventional and second mortgage loans. The Authority is exposed to operational risk, which makes it subject to loss or repurchase of insured FHA loans if specific guidelines are not met. As of December 31, 2012 and 2011, the Authority recorded a reserve of $353 thousand and $458 thousand for claim refunds to be paid to the U.S. Department of Housing and Urban Development (HUD), respectively. As of December 31, 2012 and 2011, single family mortgage loans with pending foreclosure actions have aggregate principal balances of approximately $28.1 million and $63.1 million, respectively. As of December 31, 2012 and 2011, the aggregate principal balance of single family mortgage loans delinquent 91 days or greater was approximately $75.3 million and $117.0 million, respectively. The Multi-Family/Business Program loans and a portion of General Program loans are commercial loans. Commercial loans are collateralized by mortgages on applicable real estate and, in some cases, are insured by an agency of the U.S. government, which reduces the credit risk exposure for that type of insured loan. As of December 31, 2012, approximately $447.7 million, or 69.0%, of the commercial loan balances are not covered by insurance. The insured loans comprised of $214.8 million of Section 542(c) risk share loans, which are 50% insured, and $38.2 million of Sections 221(d) and 223(f) new construction and rehabilitation loans, which are 99% insured. As of December 31, 2011, approximately $526.4 million, or 74.4%, of the commercial loan balances are not covered by insurance. The insured loans comprised of $240.0 million of Section 542(c) risk share loans, which are 50% insured, and $39.5 million of Sections 221(d) and 223(f) new construction and rehabilitation loans, which are 99% insured. As of December 31, 2012, commercial loans with pending foreclosure actions had an aggregate principal balance of approximately $5.2 million, of which $2.5 million was insured. A reserve amount of $714 thousand has been established for the uninsured portion of these loans. There were no commercial loans with pending foreclosure actions as of December 31, 2011. As of December 31, 2012 and 2011, commercial loans delinquent 91 days or greater aggregate principal balances were approximately $6.1 million and $804 thousand, respectively.
Notes to Basic Financial Statements
(tabular dollar amounts are in thousands)
32
Activity in the allowance for loan loss for the years ended December 31, 2012 and 2011 was as follows:
2012 2011
Beginning balance 17,423$ 19,737$
Provision 9,106 9,036
Net charge-offs
Single-family (8,288) (8,568)
Multi-family/Business (423) (2,782)
Ending balance 17,818$ 17,423$
The Authority services loans on the behalf of others, primarily for Ginnie Mae, which are not reported on the Statement of Net Position. As of December 31, 2012 and 2011, these outstanding loan balances were $1.2 billion and $1.0 billion, respectively. Under the Ginnie Mae program, the Authority must use its own funds if a borrower fails to make a timely payment on a mortgage loan. The Authority must also assess the overall performance of the portfolio and will repurchase certain loans as necessary to maintain required delinquent thresholds. All Ginnie Mae loans are either insured by the FHA or RD, or are guaranteed by the VA.
Notes to Basic Financial Statements
(tabular dollar amounts are in thousands)
33
The Authority has granted terms and interest rate concessions to Debtors, which are considered troubled debt restructuring, as of December 31, 2012 and 2011, as summarized below:
Single Family Program Loans: 2012 2011
Aggregate recorded balance $17,168 $26,524
Number of loans 118 177
Gross interest revenue
if receivables had been current $1,013 $1,600
Interest revenue included in
changes in net position $689 $973
Multi-Family/Business Program Loans: 2012 2011
Aggregate recorded balance $25,638 $29,008
Number of loans 32 35
Gross interest revenue
if receivables had been current $1,532 $1,803
Interest revenue included in
changes in net position $1,355 $1,748
Notes to Basic Financial Statements
(tabular dollar amounts are in thousands)
34
(4) Capital Assets and Rental Acquisition Program (RAP) Capital asset activity for the year ended December 31, 2012 was as follows:
Beginning
Balance Additions Reductions
Ending
Balance
Nondepreciable capital assets:
Land 4,785$ -$ (3,212)$ 1,573$
Construction in progress 241 68 - 309
Total nondepreciable capital assets 5,026 68 (3,212) 1,882
Depreciable capital assets:
Cost:
Computer equipment/software * 13,523 340 - 13,863
Furniture and equipment 1,067 19 - 1,086
Rental property - nonbuilding related 2,171 60 (2,231) -
Buildings and related improvements 27,772 - (19,981) 7,791
Total depreciable capital assets 44,533 419 (22,212) 22,740
Rental property - nonbuilding related (816) (242) 241 (817)
Buildings and related improvements (13,171) (1,101) - (14,272)
Total accumulated depreciation (21,956) (3,684) 241 (25,399)
Total depreciable capital assets, net 21,194 (2,030) (30) 19,134
Total capital assets, net 26,741$ (1,411)$ (1,170)$ 24,160$
Notes to Basic Financial Statements
(tabular dollar amounts are in thousands)
36
As discussed in note 1(c), the Authority’s capital assets consist of two groups: corporate capital assets and RAP capital assets. In March 2012, the Authority sold all RAP real estate for a gain. The gain on sale is reported in nonoperating revenues and expenses, net. Summary of capital asset activity for these two groups for the year ended December 31, 2012 was as follows:
Total capital assets, net 26,741$ (1,411)$ (1,170)$ 24,160$
Notes to Basic Financial Statements
(tabular dollar amounts are in thousands)
37
Summary of financial information for the Authority’s RAP activities as of December 31, 2012 and 2011 was as follows:
For the years ended December 31, 2012 2011
Property, net of accumulated depreciation -$ 13,926$
Total assets - 19,334
Total liabilities - 14,348
Net position - 4,986
For the years ended December 31, 2012 2011
Operating income:
Rental income 1,700$ 8,096$
Interest income 1 7
General operating expenses (892) (4,544)
Depreciation expense (173) (939)
Interest expense (453) (1,060)
Total operating income 183 1,560
Nonoperating income:
Gain on sale of capital assets 39,154 (30)
Transfer liquid assets from discontinued operations (44,323) -
Total nonoperating income (5,169) (30)
Change in net position (4,986)$ 1,530$
(5) Short-Term Debt The Authority has agreements with the FHLB of Topeka for collateralized borrowings in an amount not to exceed the lending limit internally established by the FHLB, which is 40% of the Authority’s total assets, or $1.2 billion. As of December 31, 2012 and 2011, the Authority had $71.5 million and $46.1 million of short-term debt outstanding with the FHLB, respectively. Borrowings under these agreements are used to support the Authority’s various lending programs, to purchase loans to be sold through the issuance of GNMA securities and activities related to the Authority’s private activity bond volume cap preservation program. Amounts drawn under the agreements bear interest at the same rates charged by the FHLB to its member banks and are collateralized by certain mortgage loans and investments. There are no commitment fees associated with these agreements. The Authority also has a revolving, unsecured, commercial bank line of credit agreement for borrowings of up to $30.0 million. Amounts drawn under the agreement bear interest fixed at 1.95% per annum above the daily one-month LIBOR. This line of credit agreement terminates on September 30, 2013. The Authority pays an unused line fee at the rate of 0.25% per annum, payable in arrears on the first business day after each calendar quarter. The fee is based upon the amount by which the daily average of the aggregate principal amount of the borrowings outstanding is less than the line of credit.
Notes to Basic Financial Statements
(tabular dollar amounts are in thousands)
38
Short-term debt activity for the years ended December 31, 2012 and 2011 was as follows:
2012 2011
Beginning balance 46,100$ 87,900$
Additions 3,125,105 5,228,735
Reductions (3,099,730) (5,270,535)
Ending balance 71,475$ 46,100$
(6) Bonds, Notes Payable and Other Liabilities The Authority issues bonds and notes payable to finance its lending programs. Proceeds from long-term debt of the Single Family and Multi-Family/Business bonds are used for funding of single family, multi-family and business loans. Long-term debt of the General Programs (including notes payable) is used to finance single family and business loans related to various private placements, the Authority’s RAP activities and general corporate purposes. The aggregate principal amounts of bonds and notes payable outstanding as of December 31, 2012 and 2011 are shown in the table on the following pages. Interest is payable semiannually unless otherwise noted. Interest rates on variable rate debt reset on a weekly or monthly basis. At December 31, 2012, these rates ranged from 0.12% to 1.12%. At December 31, 2011, these rates ranged from 0.08% to 1.85%. Nineteen of the bond series reset on a monthly basis based on LIBOR, and one bond sub-series resets monthly based on the Securities Industry Financial Markets Association Municipal Swap Index (SIFMA). The Authority issued $10.5 million in Multi-Family/Project 2012 Series A and $17.5 million in Multi-Family/Project 2012 Series B bonds during the third quarter of 2012 to finance different multi-family projects. During 2012, the Authority put in place a new $58.9 million liquidity facility and renewed $151.2 million in expiring liquidity agreements with Barclays Capital. The Authority also renewed $93.9 million in expiring liquidity facilities with FHLB of Topeka during the course of 2012. The Authority entered into several replacement liquidity facility agreements with high quality banks in order to eliminate exposure to banks providing existing facilities and facing declining credit ratings. To this end, the Authority put in place $50 million in new liquidity facilities with the Royal Bank of Canada as a replacement bank for facilities provided by KBC and $73.9 million in new liquidity agreements with JPMorgan Chase as a replacement bank for facilities provided by Credit Agricole. JPMorgan Chase also provided a liquidity agreement of $23.9 million to replace facilities provided by the TCLP.
Notes to Basic Financial Statements
(tabular dollar amounts are in thousands)
39
Descripton and due date Interest rate (%) 2012 2011
Bonds payable:
General Fund (prior to 2011, all General Fund bonds carry the Authority's general obligation pledge):
Single Family:
Taxable Mortgage Revenue Bonds: (* principal and interest payable monthly )
2000 Series A* 2013 - 2020 6.91 352$ 358$
2001 Series AP* 2013 - 2021 6.14 1,209 1,220
2004 Series A* 2013 - 2024 4.95 646 815
2004 Series B* 2013 - 2035 4.98 1,754 2,075
2004 Series CV* 2013 - 2035 5.14 950 1,146
2005 Series A * 2013 - 2035 5.17 3,834 5,135
2005 Series B* 2013 - 2036 5.32 3,475 4,651
2006 Series A* 2013 - 2036 5.92 3,757 5,774
2007 Series A* 2013 - 2037 5.50 3,559 4,672
Total Single Family 19,536 25,846
Multi-Family/Business Finance:
Guaranteed Loan Participation Purchase Bonds: (* principal and interest payable monthly)
1999 Series A 2013 - 2024 5.71 148 491
2003 Series A* 2013 - 2023 5.00 6 193
2004 Series A* 2013 - 2024 4.62 233 935
2004 Series B* 2013 - 2024 4.88 3,664 4,652
2005 Series A* 2013 - 2025 4.81 1,962 2,241
2006 Series A* 2013 - 2026 5.98 1,178 2,366
2007 Series A* 2013 - 2027 5.89 863 1,933
2011 Series A* 2013 - 2031 2.92 3,096 4,678
2012 Series A* 2013 - 2025 2.84 6,325 -
Total Guaranteed Loan Participation Purchase Bonds 17,475 17,489
Project Loan Participation Purchase Bonds: (* principal and interest payable monthly)
2004 Series AP* 2013 - 2024 4.90 2,307 3,556
Taxable Rental Project Revenue Bonds: (* principal and interest payable monthly)
2000 Series A 2013 - 2020 6.15 3,512 3,799
2002 Series AV* 2013 - 2022 5.55 3,481 5,176
2003 Series AV* 2013 - 2024 5.19 3,225 3,332
2004 Series A* 2013 - 2024 4.90 10,666 11,087
Total Taxable Rental Project Revenue Bonds 20,884 23,394
Total Multi-Family/Business Finance 40,666 44,439
Total General Fund 60,202 70,285
Table continued on following page.
Notes to Basic Financial Statements
(tabular dollar amounts are in thousands)
40
Descripton and due date Interest rate (%) 2012 2011
Single Family Fund:
Single Family Program Senior and Subordinate Bonds:
1998 Series A 2013 - 2029 6.50 - 6.60 -$ 1,820$
1998 Series B 2013 - 2029 5.50 - 2,198
1998 Series C 2013 - 2029 5.63 - 3,698
1998 Series D 2013 - 2029 6.13 - 6.35 - 2,935
1999 Series A 2013 - 2030 6.05 - 6.45 2,315 3,340
1999 Series B 2013 - 2030 6.50 - 6.80 - 1,075
1999 Series C 2013 - 2031 6.75 - 7.05 - 2,810
2000 Series A 2013 - 2031 7.35 - 7.50 - 1,480
2000 Series B 2013 - 2031 6.70 - 7.25 - 1,630
2000 Series C 2013 - 2031 5.70 - 8.40 - 1,040
2000 Series D 2013 - 2032 6.75 - 6.90 1,635 1,905
2000 Series E 2013 - 2032 6.60 - 7.00 1,605 1,780
2001 Series A 2013 - 2032 5.00 - 6.50 3,940 4,345
2001 Series B 2013 - 2033 5.00 - 6.80 4,275 5,160
2001 Series C 2013 - 2033 4.88 - 6.60 5,355 6,505
Total Single Family Program Senior and Subordinate Bonds 19,125 41,721
Single Family Mortgage Bonds:
2001 Series AA 2013 - 2038 Variable & 5.25 106,840 111,840
2002 Series A 2013 - 2032 Variable & 5.65 30,515 33,895
2002 Series B 2013 - 2030 Variable 31,765 31,765
2002 Series C 2013 - 2030 Variable & 4.40 36,055 39,485
2003 Series A 2013 - 2032 Variable & 4.75 - 5.15 7,660 29,065
2003 Series B 2013 - 2028 Variable 99,565 102,845
2003 Series C 2013 - 2032 Variable 41,825 43,125
2004 Series A 2013 - 2032 Variable & 5.25 41,220 42,190
2004 Series B 2013 - 2032 Variable & 5.25 33,705 34,585
2005 Series A 2013 - 2033 Variable & 5.25 37,295 38,095
2005 Series B 2013 - 2036 Variable & 4.98 - 5.22 62,780 68,490
2006 Series A 2013 - 2036 Variable & 5.00 74,985 77,350
2006 Series B 2013 - 2036 Variable 115,520 115,520
2006 Series C 2013 - 2036 Variable & 4.63 86,230 97,830
2007 Series A 2013 - 2037 Variable & 4.80 100,295 100,295
2007 Series B 2013 - 2038 Variable 136,370 136,370
2008 Series A 2013 - 2038 Variable & 5.00 110,955 194,790
2009 Series A 2013 - 2029 3.10 - 5.50 58,895 69,570
2011 Series AA 2013 - 2041 1.00 - 5.00 91,935 96,415
2011 Series B 2013 - 2014 Variable 64,180 64,180
2011 Series C 2013 - 2013 Variable 33,750 108,970
2011 Series D 2013 - 2016 Variable 47,090 54,085
2012 Series A 2013 - 2038 Variable 98,705 -
Total Single Family Mortgage Bonds 1,548,135 1,690,755
Single Family Program Bonds:
2009 Series AA 2015 Variable - NIBP - 216,410
Total Single Family Fund 1,567,260 1,948,886
Table continued on following page.
Notes to Basic Financial Statements
(tabular dollar amounts are in thousands)
41
Descripton and due date Interest rate (%) 2012 2011
2001 Series A 2013 - 2043 5.30 - 5.55 5,965 22,710
2002 Series A 2013 - 2042 Variable & 5.70 19,390 22,150
2002 Series C 2013 - 2042 Variable & 5.30 103,630 108,660
2003 Series A 2013 - 2033 Variable 36,730 37,210
2004 Series A 2013 - 2045 Variable & 4.60 63,610 73,255
2005 Series A 2013 - 2040 Variable 60,120 63,730
2005 Series B 2013 - 2040 Variable 22,730 25,065
2006 Series A 2013 - 2036 Variable 44,945 51,815
2007 Series B 2013 - 2038 Variable 72,490 78,545
2008 Series A 2013 - 2043 Variable 30,325 30,775
2008 Series B 2013 - 2052 Variable 162,375 163,505
2008 Series C 2013 - 2038 Variable 33,575 34,650
2009 Series A 2013 - 2041 Variable & 3.00 - 5.40 37,350 41,630
2012 Series A 2013 - 2051 2.75 - 4.50 10,500 -
2012 Series B 2013 - 2054 2.55 - 4.20 17,450 -
Total Multi-Family/Project Bonds 747,870 797,220
Total Multi-Family/Business Fund 820,160 874,575
Total bonds payable 2,447,622$ 2,893,746$
Premiums and losses classified as bonds payable
Deferred premiums 2,000$ 3,273$
Deferred losses on refunding (19,418) (15,147)
Bonds payable, net 2,430,204 2,881,872
Notes payable 7,570 7,535
Bonds and notes payable, net 2,437,774$ 2,889,407$
Statement of Net Assets Summary
Current:
Bonds payable 172,041$ 321,512$
Notes payable 103 104
Noncurrent:
Bonds and notes payable, net 2,265,630 2,567,791
Total 2,437,774$ 2,889,407$
Notes to Basic Financial Statements
(tabular dollar amounts are in thousands)
42
A breakdown of bonds payable as of December 31, 2012 and 2011, by fixed and variable interest rates, follows in the table below. Certain of the Authority’s variable rate debt has been hedged by entering into pay fixed/receive variable rate interest rate swap agreements as further described in note 8. Such debt is referred to in the table as synthetic fixed rate debt.
Description 2012 2011
Fixed rate debt 451,432$ 552,332$
Synthetic fixed rate debt 1,820,834 1,944,459
Unhedged variable rate debt 175,356 396,955
Total 2,447,622$ 2,893,746$
Included in certain of the bond issues shown in the previous table are capital appreciation term bonds. The principal amounts of these bonds appreciate based on semiannual compounding of the original principal balances at the interest rates specified. The capital appreciation term bonds were called on July 1, 2012. The appreciated balances of these bonds at maturity, and as reflected in the accompanying Statement of Net Position as of December 31, 2012 and 2011, are as follows:
2012 2011
Description and due date
Interest
Rate Maturity
Appreciated
Balances
Interest
Rate Maturity
Appreciated
Balances
Single Family Program Senior and Subordinate Bonds:
1998 Series B - 2025-2029 0.00% -$ -$ 5.50% 5,046$ 2,198$
1998 Series C - 2020-2029 0.00% - - 5.63% 7,459 3,698
-$ 5,896$
Also included in the table of bonds and notes payable outstanding are certain Single Family and Multi-Family/Project bonds, which carry the Authority’s general obligation pledge. These general obligation bonds are presented in the following table as of December 31, 2012 and 2011:
Description 2012 2011
General Fund Program Bonds 50,781$ 65,607$
Single Family Program Subordinate Bonds 120 310
Single Family Mortgage Bonds, Class III 47,200 53,480
Multi-Family/Project Bonds, Class I 248,565 265,430
Multi-Family/Project Bonds, Class II 21,820 22,095
Multi-Family/Project Bonds, Class III - 1,700
Total 368,486$ 408,622$
Notes to Basic Financial Statements
(tabular dollar amounts are in thousands)
43
Standby Purchase Agreements provide liquidity support on variable rate bonds that are remarketed weekly. The liquidity/commitment fees vary by agreement and are based on a percentage of the outstanding bond balance, payable monthly or quarterly. Liquidity fees for the years ended December 31, 2012 and 2011 were $10.8 million and $10.2 million, respectively. A schedule of providers and maturities is presented below, as of December 31, 2012:
Liquidity
Expiration
Barclays Bank
PLC. (1) FHLB (2) JP Morgan (3)
Royal Bank of
Canada (4) TCLP (5) Grand Total
2013 98,610$ 501,600$ -$ -$ -$ 600,210$
2014 - 442,785 96,425 190,930 71,840 801,980
2015 58,870 - - 50,000 - 108,870
Total 157,480$ 944,385$ 96,425$ 240,930$ 71,840$ 1,511,060$
The following provides the terms of the debt service requirements that would result if the SBPA commitments were to be exercised (bank bond rate, accelerated payment schedule, and lien):
(1) (a) Bank Rate: for the first 30 days following the purchase date, the "Base Rate" which equals the highest of the Fed funds plus 5%, prime rate plus 5% and Three-Month LIBOR plus 5%; then for the period 31-90 days following the purchase date, the Base Rate plus 2.00%; then for the period 91 days and higher following the purchase date, 12%.
(b) Term out provisions: accelerated principal payment due in full on the date, which is three years following the purchase date. Class III lien/General Obligation.
(2) (a) Bank Rate: One-Month LIBOR plus 2.00% (1.50% for 2003 Series B-3 Bonds). (b) Term out provisions: repayments due 90 days following purchase date in equal semiannual installments until fifth anniversary of the purchase
date. Class III lien/General Obligation. (3) (a) Bank Rate: for the first 90 days following the purchase date, the "Base Rate" which equals the highest of (i) the prime rate plus 1.50%, (ii) the Fed funds rate plus 2.00% and (iii) 7.50%; then for the period 91 days and higher following the purchase date, the Base Rate plus1.00%. (b) Term out provisions: repayments due on the first business day of April and October on or following 90 days following purchase date and
thereafter on each such dates in equal installments to the fifth anniversary of such purchase date. Class I lien. (4) (a) Bank Rate: for the first 90 days following the purchase date, the "Base Rate" which equals the highest of (i) the prime rate plus 2.50%, (ii) the Fed funds rate plus 3.00% and (iii) 8.00%; then for the period 91-180 days following the purchase date, the Base Rate plus 1.00%; then
for the period 181 days and higher following the purchase date, the Base Rate plus 2.00%. (b) Term out provisions: repayments due on the first business day of February, May, August or November on or following 90 days following purchase
date and thereafter quarterly on each such dates in equal installments to the third anniversary of such purchase date. Class I lien. (5) (a) Bank Rate: prime rate (based on JPMorgan Prime Rate) plus 1.00%.
(b) Term out provisions: accelerated principal payment due in full on tenth anniversary of the purchase date. Class I lien.
Notes to Basic Financial Statements
(tabular dollar amounts are in thousands)
44
The following table presents the detail of bonds, notes payable and other noncurrent liabilities including activity for the noncurrent portion for the year ended December 31, 2012:
Beginning Ending Due Within
Description Balance Additions Reductions Balance One Year
Deferred losses on refunding (14,088) (12,494) 8,539 (18,043) (1,375)
Net bonds payable 2,560,360 120,881 (423,078) 2,258,163 172,041
Notes payable 7,431 137 (101) 7,467 103
Arbitrage rebate payable 1,479 218 (855) 842 -
Deferred income 2,722 228 (348) 2,602 186
Other liabilities 19,740 340 (17,602) 2,478 73
Total other liabilities 23,941 786 (18,805) 5,922 259
Total liabilities 2,591,732$ 121,804$ (441,984)$ 2,271,552$ 172,403$
The following table presents the detail of bonds, notes payable and other noncurrent liabilities including activity for the noncurrent portion for the year ended December 31, 2011:
Beginning Ending Due Within
Description Balance Additions Reductions Balance One Year
Other liabilities 2,784 19,006 (2,050) 19,740 17,009
Total other liabilities 8,767 20,024 (4,850) 23,941 17,204
Total liabilities 2,925,269$ 276,397$ (609,934)$ 2,591,732$ 338,820$
Notes to Basic Financial Statements
(tabular dollar amounts are in thousands)
45
Bonds and notes payable sinking fund installments and contractual maturities subsequent to December 31, 2012, using rates in effect as of December 31, 2012, are as follows:
Years Ending
December 31, Principal Interest Principal Interest Principal Interest Principal Interest
Total 60,202$ 47,023$ 1,567,260$ 262,390$ 820,160$ 114,119$ 7,570$ 764$
General Fund Single Family Multi-Family Notes Payable
In response to capital market disruptions nationally, in late 2009, the U.S. Department of the Treasury (the Treasury) announced a plan to assist Housing and Finance Authorities (HFAs) through a two-part initiative: a new bond purchase program called the New Issue Bond Program (NIBP) to support new lending by HFAs and a temporary credit and liquidity program (TCLP) to improve the access of HFAs to liquidity for outstanding HFA bonds. The NIBP provided financing for HFAs to issue new mortgage revenue bonds no later than December 31, 2011. Pursuant to the NIBP, the Authority issued its Single Family Program Class I Bonds in the amount of $275.2 million on January 12, 2010. Using authority under the Housing and Economic Recovery Act of 2008 (HERA), the Treasury purchased securities of Fannie Mae and Freddie Mac backed by these mortgage revenue bonds. The bonds initially carried variable interest rates that approximate the investment interest rates earned from the investment of bond proceeds. The bonds must be converted to fixed rate debt, concurrent with the issuance of other mortgage revenue bonds by the Authority or redeemed no later than December 31, 2015. As of December 31, 2011, $216.4 million in NIBP bonds had not been converted. As of December 31, 2012, all bonds related to the NIBP had been redeemed or converted to fixed rate debt. The TCLP allows Fannie Mae and Freddie Mac to provide replacement credit and liquidity facilities to HFAs. The Treasury will backstop the replacement credit and liquidity facilities for the HFAs by purchasing an interest in them using HERA authority. The TCLP was set to expire December 31, 2012 but was extended to December 31, 2015 subject to submission and acceptance of a plan submitted by the Authority to extinguish TCLP facilities by the new expiration date. Pursuant to the TCLP, the Authority utilized $903.7 million to replace Standby Purchase Agreements on its variable rate bonds that are remarketed weekly, of which $71.8 million and $492.3 million was outstanding as of December 31, 2012 and 2011, respectively. The Authority plans to replace the TCLP facility with liquidity facilities provided by other banks or convert the underlying variable rate bonds to fixed rate bonds or to variable-rate debt that does not require standby liquidity. (7) Conduit Debt Obligation The Authority has issued certain conduit bonds, the proceeds of which were made available to various developers and corporations for rental housing and commercial purposes. Other conduit proceeds were made available to the State of
Notes to Basic Financial Statements
(tabular dollar amounts are in thousands)
46
Colorado for the Colorado Unemployment Insurance Trust Fund. The bonds are payable solely from amounts received by the trustees from the revenue earned by the developers and corporations. Loan and corresponding debt service payments are generally guaranteed by third-party irrevocable direct-pay letters of credit or other credit enhancement arrangements. The faith and credit of the Authority is not pledged for the payment of the principal or interest on the bonds. Accordingly, these obligations are excluded from the Authority's financial statements. As of December 31, 2012, there were 53 series of conduit bonds outstanding, with an aggregate principal amount outstanding of $963.8 million. As of December 31, 2011, there were 68 series of bonds outstanding, with an aggregate principal amount outstanding of $407.3 million.
(8) Derivative Instruments The Authority reports derivative instruments at fair value. The fair value of all derivatives is reported on the Statement of Net Position as a derivative instrument at the end of the year. If the interest rate hedge is considered ineffective, an investment derivative, the change in fair value is reported on the Statement of Revenues, Expenses and Changes in Net Position as investment derivative activity loss. The annual changes in the fair value of effective hedging derivative instruments are reported as deferred inflows and outflows, as appropriate, on the Statement of Net Position. Swaps Transactions – The Authority has entered into pay fixed, receive variable interest rate swaps in order to (1) provide lower cost fixed rate financing for its production needs through synthetic fixed rate structures and (2) utilize synthetic fixed rate structures with refunding bonds in order to generate cash flow savings. The objective of the swaps is to hedge interest rate risk. The fair values take into consideration the prevailing interest rate environment and the specific terms and conditions of each swap. All fair values were estimated using the zero-coupon discounting method. This method calculates the future payments required by the swap, assuming that the current forward rates implied by the yield curve are the market’s best estimate of future spot interest rates. These payments are then discounted using the spot rates implied by the current yield curve for hypothetical zero coupon rate bonds due on the date of each future net settlement payment on the swaps. (a) The Authority’s interest rate swaps, which were used to hedge interest rate risk, are considered to be hedging derivative
instruments under GASB No. 53, with the exception of Single Family Swap 2001-AA, which is considered to be an investment derivative instrument.
(b) On September 19, 2012, the Authority refunded certain single family bonds that were subject to existing interest rate
swap agreements that were considered effective interest rate hedges. As a result of the partial refunding, deferred outflows related to those hedges in the amount of $10.4 million has been reclassified to deferred refunding loss, which is presented as part of bonds and notes payable in the basic financial statements. The deferred refunding loss is amortized to interest expense over the life of the new debt using the straight line method. The interest expense is offset by an equal amount that is accreted to deferred outflows over the remaining life of the respective swap.
(c) On December 28, 2012, the Authority novated (transferred) $275.8 million in swap agreements from AIG to Wells Fargo.
The novation was undertaken to eliminate the weaker credit counterparty, AIG, in favor of a stronger one, Wells Fargo and the floating rate calculation was changed to be based on LIBOR in the new agreements.
Notes to Basic Financial Statements
(tabular dollar amounts are in thousands)
47
A summary of interest rate swaps for the years ended December 31, 2012, and 2011 was as follows:
2012 2011
Summary of Interest Rate Swaps Fair Value Fair Value
Par optional termination right with trigger 71,723$ 101,856$
Par optional termination right 65,358 66,850
T rigger 18,886 20,665
Plain 83,041 91,853
Total fair value 239,008$ 281,224$
Trigger: The variable rate received on these swaps is 68% of the one-month LIBOR, if LIBOR is equal to or greater than 3.5%. The variable rate received on these swaps is SIFMA plus a spread if the one-month LIBOR is less than 3.5%. See further discussion in the basis risk section below. Par optional termination right: Certain swaps contain a cancellation clause that provides the Authority the option to cancel a certain amount of the swaps on certain dates. The Authority may cancel the optional termination amount for no payment (callable at par). The optional termination dates coincide with the debt service dates on the associated hedged bonds payable. These dates and amounts are provided in the table below. Detail of Outstanding Interest Rate Swaps – The key terms, including the fair values and counterparty credit ratings of the outstanding swaps as of December 31, 2012, are shown in the table below. The notional amounts of the swaps approximate the principal amounts of the associated debt. Except as discussed under amortization risk below, the Authority’s swap agreements contain scheduled reductions to outstanding notional amounts that are expected to approximately follow scheduled or anticipated reductions in the associated bonds payable. Based on the standard swap agreement, payments are settled on a net basis. The Authority enters into master netting arrangements with each of its swap counterparties. All of the agreements provide for the netting of the value of assets and liability positions of all transactions with the respective counterparty. There are no other significant transactions with these counterparties outside of these swap agreements, such that the aggregate amount of liabilities included in the master netting arrangements is equal to the net fair value of the swaps.
Notes to Basic Financial Statements
(tabular dollar amounts are in thousands)
48
Outstanding Swaps at December 31, 2012:
Associated
Current
Notional Effective Termination
Fixed
Rate Variable Rate Embedded
Optional
Termination
Optional
Termination
Counterparty
Rating 2012 Change in 2011
Bond Issue Amount Date Date Paid Received * Options Date, at Par Amount S&P/Moody's Fair Value ** Fair Value Fair Value **
(*) SIFMA is the Securities Industry Financial Markets Association Municipal Swap Index. LIBOR is the London Interbank Offered Rate. (**) All fair values include the effect of any related embedded option. (***) Par optional termination right. (****) Swaps for which cash premiums were received in 2008. The outstanding unamortized balance of the premium is reported on the Statement of Net Position as hybrid instrument borrowings. (SPV) Counterparty operates as a special purpose vehicle.
Risk Disclosure Credit Risk: All of the Authority’s swaps rely upon the performance of the third parties who serve as swap counterparties, and as a result, the Authority is exposed to credit risk – that is, the risk that a swap counterparty fails to perform according to its contractual obligations. The appropriate measurement of this risk at the reporting date is the fair value of the swaps, as shown in the column labeled “Fair Value” in the outstanding swaps table above. The Authority is exposed to credit risk in the amount of any positive net fair value exposure to each counterparty. As of December 31, 2012, the Authority was exposed to minimal credit risk to any of its counterparties. To mitigate credit risk, the Authority maintains strict credit
Notes to Basic Financial Statements
(tabular dollar amounts are in thousands)
50
standards for swap counterparties. All swap counterparties must be rated in the AA/Aa or higher category by either Standard & Poor’s (S&P) or Moody’s Investors Service (Moody’s), respectively, at the time the contract is executed. At December 31, 2012, the Authority had executed 71 swap transactions with nine counterparties with concentrations and ratings (Standard and Poor’s/ Moody’s Investors Service) as shown in the following table:
Swap Notional Counterparty Rating
Count Amount Concentration (S&P / Moody's)
1 2,170$ 0.1% A / A2
14 370,930 20.4% A / A3
8 95,965 5.3% A- / Baa1
31 674,204 37.0% A+ / A2
6 140,805 7.7% A+ / Aa3
1 67,385 3.7% AA- / Aa1
9 464,690 25.5% AA- / Aa3
1 4,685 0.3% AAA / NR
71 1,820,834$ 100%
At December 31, 2011, the Authority had executed 74 swap transactions with nine counterparties with concentrations and ratings (Standard and Poor’s/ Moody’s Investors Service) as shown in the following table:
Interest Rate Risk: The Authority is exposed to interest rate risk in that as the variable rates on the swaps agreements decrease, the Authority’s net payment on the swap agreement could increase. Basis Risk: The Authority is exposed to basis risk when the variable interest rate paid to the holders of its variable rate demand obligations (VRDOs) is not equivalent to the variable interest rate received from its counterparties on the related swap agreements. When exposed to basis risk, the net interest expense incurred on the combination of the swap agreement and the associated variable rate debt may be higher or lower than anticipated.
Swap Notional Counterparty Rating
Count Amount Concentration (S&P / Moody's)
14 384,215$ 19.8% A / A2
2 8,880 0.5% A / Aa3
13 385,250 19.8% A- / WR
6 179,240 9.2% A+ / Aa1
31 701,674 36.0% A+ / Aa3
4 193,600 10.0% AA- / Aa1
1 80,100 4.1% AA- / Aaa
1 5,095 0.3% AAA / NR
2 6,405 0.3% NR / Baa1
74 1,944,459$ 100%
Notes to Basic Financial Statements
(tabular dollar amounts are in thousands)
51
The Authority’s tax-exempt variable-rate bond interest payments are substantially equivalent to the SIFMA rate (plus a trading spread). Certain tax-exempt swaps, as indicated in the table above, contain a trigger feature in which the Authority receives a rate indexed on SIFMA should LIBOR be less than a predetermined level (the trigger level, 3.5%), or a rate pegged at a percentage of LIBOR should LIBOR be equal to or greater than the predetermined trigger level. For these swaps, the Authority would be negatively exposed to basis risk during the time period it is receiving the rate based on a percentage of LIBOR should the relationship between LIBOR and SIFMA converge. The Authority’s taxable variable-rate bond interest payments are substantially equivalent to LIBOR (plus a trading spread). The Authority is receiving LIBOR (plus a trading spread) or LIBOR flat for all of its taxable swaps and therefore is only exposed to basis risk to the extent that the Authority’s bonds diverge from their historic trading relationship with LIBOR. Termination Risk: The Authority’s swap agreements do not contain any out-of-the-ordinary termination events that would expose it to significant termination risk. In keeping with market standards, the Authority or the counterparty may terminate each swap if the other party fails to perform under the terms of the contract. In addition, the swap documents allow either party to terminate in the event of a significant loss of creditworthiness. If at the time of the termination a swap has a negative value, the Authority would be liable to the counterparty for a payment equal to the fair value of such swap. There are certain termination provisions relevant to the Authority’s counterparties operating as special purpose vehicles (SPV) with a terminating structure. In the case of certain events, including the credit downgrade of the SPV or the failure of the parent company to maintain certain collateral levels, the SPV would be required to wind up its business and terminate all of its outstanding transactions with all clients, including the Authority. All such terminations would be at mid-market pricing. In the event of such termination, the Authority would be exposed to the risk of market re-entry and the cost differential between the mid-market termination and the offered price upon re-entry. Rollover Risk: The Authority is exposed to rollover risk only on swaps that mature or may be terminated at the counterparty’s option prior to the maturity of the associated debt. As of December 31, 2012 and 2011, the Authority was not exposed to rollover risk. Amortization Risk: The Authority is exposed to amortization risk in the event that the swap amortization schedules fail to match the actual amortization of the underlying bonds as a result of loan prepayments, which significantly deviate from expectations. If prepayments are significantly higher than anticipated, the Authority would have the option of reinvesting or recycling the prepayments, or calling unhedged bonds. Alternatively, if the Authority chose to call bonds associated with the swap, the Authority could elect an early termination of the related portions of the swap at a potential cost to the Authority. If prepayments are significantly lower than anticipated and the associated bonds remained outstanding longer than the relevant portion of the swap, the Authority could experience an increase in its exposure to unhedged variable rate bonds. Alternatively, the Authority could choose to enter into a new swap or an extension of the existing swap. If interest rates are higher at the time of entering into a new swap or swap extension, such action would result in an increased cost to the Authority. Collateral Requirements: The Authority is subject to a contingency feature that would require the Authority to post collateral on swap agreements if the Class I obligations credit rating falls to a Moody’s A1, or equivalent ratings by S&P and Fitch, and is greater than the established thresholds. As of December 31, 2012 and 2011, all agreements were rated higher than the Moody’s A1 and did not require collateral. The majority of the class 1 bonds are rated AAA by both rating agencies. The bond indentures for these swaps are over collateralized and the underlying assets are insured. The likelihood that the bonds would be downgraded by four categories is considered remote, but if it were to occur, it would require the Authority to post collateral approximately equal to the fair value of the interest rate swap.
Notes to Basic Financial Statements
(tabular dollar amounts are in thousands)
52
Swap Payments – Using interest rates as of December 31, 2012, debt service requirements of the Authority’s outstanding variable-rate debt and net swap payments were as follows. As rates vary, variable rate interest rate payments on the bonds and net swap payments will change.
Years Ending
December 31, Principal Interest Swaps, Net Total
2013 113,329$ 5,837$ 80,863$ 200,029$
2014 106,425 5,307 75,584 187,316
2015 93,280 4,805 70,664 168,749
2016 107,930 4,502 66,462 178,894
2017 121,775 4,224 61,802 187,801
2018-2022 368,245 17,291 249,283 634,819
2023-2027 308,170 12,194 171,804 492,168
2028-2032 264,905 7,773 107,759 380,437
2033-2037 243,740 3,378 49,899 297,017
2038-2042 58,980 578 15,517 75,075
2043-2047 34,055 139 3,860 38,054
Total 1,820,834$ 66,028$ 953,497$ 2,840,359$
Hybrid Instrument Borrowings – Certain interest rate swaps, as identified on the detailed swap table above, include fixed rates that were off-market at the execution of the interest rate swaps. For financial reporting purposes, these interest rate swaps are considered hybrid instruments and are bifurcated between borrowings, with an aggregate original amount of $98.5 million reflecting the fair value of the instrument at its execution, and an interest rate swap with a fixed rate that was considered at-the-market at execution. Activity for the hybrid instrument borrowings for the years ended December 31, 2012 and 2011 was as follows:
2012 2011
Beginning balance 53,607$ 59,972$
Additions 25,018 -
Reductions (5,392) (6,365)
Ending balance 73,233$ 53,607$
Notes to Basic Financial Statements
(tabular dollar amounts are in thousands)
53
The following table sets forth as of December 31, 2012, payments of principal and interest on the hybrid instrument borrowings for the next five years and thereafter. The total payments generally reflect the difference between the stated fixed rate of the hybrid instrument and the at-the-market fixed rate at the execution of the instrument.
Years Ending Principal
December 31, and Interest
2013 15,079$
2014 14,146
2015 9,433
2016 6,426
2017 5,658
2018-2022 13,880
2023-2027 6,056
2028-2032 1,969
2033-2037 468
2038-2042 111
2043-2047 7
Total 73,233$
Forward Sales Contracts – The Authority has entered into forward sales contracts for the delivery of Ginnie Mae securities in order to lock in the sales price for the securitization of certain taxable single family loans. The contracts offset changes in interest rates between the time of the loan reservations and the securitization of such loans into Ginnie Mae securities. These contracts are considered investment derivative instruments, such that their change in fair value is reported as investment derivative activity losses on the Statement of Revenues, Expenses and Changes in Net Position. The outstanding forward contracts, summarized by counterparty as of December 31, 2012, were as follows:
Count Par Exposure
Original Sales
Price
12/31/12
Premium Fair Value
Counterparty
Rating
2 1,000$ 1.2% 1,063$ 1,064$ 1$ BBB-/n/a
2 8,000 9.8% 8,648 8,661 13 A2/P2
3 10,000 12.3% 10,790 10,861 71 A1/P1
2 17,000 20.9% 18,408 18,453 45 A2/P1
22 45,500 55.8% 49,098 49,251 153 A1/P1
31 81,500$ 100.0% 88,007$ 88,290$ 283$
Notes to Basic Financial Statements
(tabular dollar amounts are in thousands)
54
The outstanding forward contracts, summarized by counterparty as of December 31, 2011, were as follows:
Summary A summary of derivative instruments activity for the years ended December 31, 2012 and 2011 is as follows:
2012 2011
Hedging Investments Hedging Investments
Swaps Swaps Forwards Total Swaps Swaps Forwards Total
(9) Debt Refundings On September 19, 2012, the Authority issued its Single Family Bonds 2012 Series A and B in the aggregate principal amount of $99.1 million. The entire proceeds of the bonds were used to refund a portion of various single family mortgage bonds. The refunding resulted in a decrease in the aggregate future debt service requirement, including related fees, of approximately $3.9 million based on the change in variable interest rates at the time of refunding and an approximate economic gain to the Authority of $2.6 million. In accordance with GASB Statement No. 23, Accounting and Financial Reporting for Refundings of Debt Reported by Proprietary Activities, $10.9 million was deferred and is being amortized over the contractual life of the new debt. In addition, the Authority converted $236.7 million in outstanding VRDOs into FRNs through a direct placement transaction with Federal Home Loan Bank (FHLB) of Seattle. Refunding or converting VRDOs requiring liquidity facilities into FRNs has proven to be an effective means for the Authority to reduce costs related to the indenture and we will continue to seek these opportunities in 2013. On November 10, 2011, the Authority issued its Single Family Bonds 2011 Series B, C and D, in the aggregate principal amount of $227.2 million. The entire proceeds of the bonds were used to refund a portion of various single family mortgage bonds. The refunding resulted in a decrease in the aggregate future debt service requirement of approximately $1.4 million, based on the change in variable interest rates at the time of refunding and an approximate economic gain to the Authority of $468 thousand. In accordance with GASB Statement No. 23, $11.5 million was deferred and is being amortized over the contractual life of the new debt.
Count Par Exposure
Original Sales
Price
12/31/11
Premium Fair Value
Counterparty
Rating
5 20,500$ 26.4% 21,698$ 21,916$ 218$ A/A1
17 35,000 45.2% 37,346 37,654 308 A/Aa3
12 22,000 28.4% 23,348 23,549 201 AA-/Aa3
34 77,500$ 100.0% 82,392$ 83,119$ 727$
Notes to Basic Financial Statements
(tabular dollar amounts are in thousands)
55
Economic gain or loss is calculated as the difference between the present value of the old debt service requirements, including related fees, and the present value of the new debt service requirements less related upfront costs of issuance, bond call premiums and bond insurance premiums, discounted at the effective interest rate. In prior years, the Authority defeased certain bonds by placing the proceeds of new bonds in an irrevocable trust to provide for all future debt service payments on the bonds. Accordingly, the trust account assets and the liability for the defeased bonds are not included in the Authority’s financial statements. On December 31, 2012, $58.9 million of bonds outstanding are considered defeased. (10) Restricted and Unrestricted Net Position The amounts restricted for the Single Family bond programs and the Multi-Family/Business bond programs are for the payment of principal, redemption premium, if any, and interest, including net swap payments, on all outstanding single family and multi-family/business bond issues, in the event that no other funds are legally available for such payments. Such assets are segregated within the Single Family and Multi-Family/Business bond programs and are held in cash, loans receivable and investments. The Board may authorize the withdraw of all or part of this restricted balance if (1) updated cash flow projections indicate that adequate resources will exist after any withdrawal to service the outstanding debt, subject to approval by the bond trustee and the rating agency review; (2) the Authority determines that such funds are needed for the implementation or maintenance of any duly adopted program of the Authority; and (3) no default exists in the payment of the principal, redemption premium, if any, or interest on such bonds. The Board has designated certain amounts of the unrestricted net position of the General Programs as of December 31, 2012 and 2011, for various purposes, as indicated in the following table. These designations of net position are not binding, and can be changed by the Board.
Unrestricted Net Position for the years ended December 31, 2012 and 2011:
2012 2011
Designations:
Housing loans 70,874$ 76,786$
Commerical loans 15,079 17,757
General operating and working capital 11,496 14,723
Rating agency reserves 23,189 -
General obligation bonds 31,321 -
Nongeneral obligation bonds 22,352 -
Total general programs unrestricted net position 174,311$ 109,266$
(11) Retirement Plans The Authority contributes to the Local Government Division Trust fund (Trust) a cost-sharing multiple-employer public defined benefit plan administered by the Public Employees’ Retirement Association of Colorado (PERA). The Trust provides retirement, disability and death benefits for members or their beneficiaries. Generally, all employees of the Authority are members of the Trust.
Notes to Basic Financial Statements
(tabular dollar amounts are in thousands)
56
The Authority contributes to the Health Care Trust Fund (Health Fund), a cost-sharing multiple-employer postemployment health care plan administered by PERA. The Health Fund provides a health care premium subsidy to PERA participating benefit recipients and their eligible beneficiaries.
Colorado Revised Statutes assign the authority to establish Trust and Health Fund benefit provisions to the State Legislature. PERA issues a publicly available annual financial report that includes financial statements and required supplementary information for the Trust and the Health Fund. That report may be obtained by writing to PERA at P.O. Box 5800 Denver, Colorado 80217-5800, by calling PERA at 303-832-9550 or 1-800-759-PERA (7372) or from PERA’s website at www.copera.org. Plan members and the Authority are required to contribute to the Trust at rates set by Colorado Statutes. A portion of the Authority’s contribution is allocated for the Health Fund. Member contributions to the Health Fund are not required. The contribution rate for members and the Authority’s contributions to the Trust and Health Fund, which equaled the Authority’s required contributions for each year, were as follows:
2012 2011
Contribution rate of covered salary:
Members 8.00% 8.00%
Authority:
Trust 12.68% 12.68%
Health Fund 1.02% 1.02%
Total Authority contribution rate 13.70% 13.70%
Contributions by the Authority:
Trust 1,637$ $1,730
Health Fund 132 139
Total Authority contributions 1,769$ $1,869
An additional benefit offered to eligible Authority employees through PERA is a Voluntary Investment Program, established under Section 401(k) of the Internal Revenue Code. Participants invest a percentage of their annual gross salary up to the annual Internal Revenue Service limit of their gross salaries. The Authority contributed 1% of each participating employee’s salary as part of the 401(k) match, and in addition to the 1% contribution, the Authority matched half of the employee’s 401(k) contribution up to 5% of the participating employee’s gross salary for a maximum Authority match of 3.5%. Starting in 2012, employees are required to invest a percentage of their annual gross salary to participate in the plan and receive the Authority’s 1% contribution and match. Contributions by the Authority for the years ended December 31, 2012 and 2011 were $389 thousand and $396 thousand, respectively. Contributions by participating employees for the years ended December 31, 2012 and 2011 were $951 thousand and $902 thousand, respectively. All required contributions are paid in full annually. (12) Risk Management The Authority has an Enterprise Risk Management program under which various risks of loss associated with its business operations are identified and managed. The ERM program includes Internal Audit, Compliance and Security/Privacy. The risk management techniques utilized include a combination of standard policies and procedures and purchased insurance.
Commercial general liability, property losses, business automobile liability, workers’ compensation, Crime, Executive Risk Package with Directors’ and Officer and Employed Lawyers Professional Liability, Network Security and Privacy coverage and public officials’ liability are all managed through purchased insurance. There were no significant reductions or changes in insurance coverage from the prior year. Settled claims did not exceed insurance coverage in any of the past three years. (13) Related-Party Transactions The Authority has three outstanding loans with the Housing Authority of the City of Loveland, Colorado, the Executive Director of which is a member of the Authority’s Board. The unpaid principal balance for the years ended December 31, 2012 and 2011 were $2.6 million and $2.7 million, respectively. (14) Commitments and Contingencies The Authority had outstanding commitments to make or acquire single family and multi-family/business loans of $66.9 million and $6.4 million, respectively, as of December 31, 2012. The Authority had outstanding commitments to make or acquire single family and multi-family/business loans of $62.1 million and $3.0 million, respectively, as of December 31, 2011. There are a limited number of claims or suits pending against the Authority arising in the Authority’s ordinary course of business. In the opinion of the Authority’s management and counsel, any losses that might result from these claims and suits are either covered by insurance or, to the extent not covered by insurance, would not have a material adverse effect on the Authority’s financial position. The Authority participates in the Ginnie Mae Mortgage-Backed Securities (MBS) Programs. Through the MBS Programs, Ginnie Mae guarantees securities that are issued by the Authority and backed by pools of mortgage loans. If a borrower fails to make a timely payment on a mortgage loan, the Authority must use its own funds to ensure that the security holders receive timely payment. All loans pooled under the Ginnie Mae MBS Program are either insured by the FHA or RD, or are guaranteed by the VA. The Authority assesses the overall risk of loss on loans that it may be required to repurchase and repurchases the loans as necessary. The Authority repurchased $48.0 million and $21.3 million of these loans in 2012 and 2011, respectively. 15) Subsequent Events In 2012, the Authority established a contractual, sub-servicing relationship with Dovenmuehle Mortgage, Inc. (DMI) for its single family portfolio beginning March 1, 2013. This approach will allow the Authority and its customers to benefit from the established infrastructure, technology, and economies of scale that a sub-servicer can provide. At the same time, it will reduce the Authority’s long-term costs, allowing the organization to remain focused on investing as much of its resources as possible back into its mission of affordable housing and business finance. The Authority will retain its mortgage servicing rights, which ensures that its ongoing vested and proactive relationship with its customers, investors, mortgage insurance providers, and guarantors will be actively maintained. Additionally, the Authority will retain key components of its internal loan servicing operation to help oversee DMI and to ensure that the Authority maintains an active and productive role in shaping the quality of loan servicing provided.
58
SUPPLEMENTAL INFORMATION
59
Colorado Housing and Finance Authority
Combining Schedule - Statement of Net Position
(with summarized financial information for December 31, 2011)
Net cash provided by (used in) capital and related financing activities 37,872 - - 14,611 52,483 (1,133)
Cash flows from investing activities:
Proceeds from maturities and sales of investments 1,451,130 910,230 400,410 - 2,761,770 3,089,608
Purchase of investments (1,487,324) (778,867) (408,250) - (2,674,441) (3,075,530)
Income received from investments 148 15,708 6,601 - 22,457 21,446
Net cash provided by (used in) investing activities (36,046) 147,071 (1,239) - 109,786 35,524
Net increase (decrease) in cash 67,139 - - - 67,139 (2,689)
Cash at beginning of year 89,292 - - - 89,292 91,981
Cash at end of year $ 156,431 $ - $ - $ - $ 156,431 $ 89,292
Restricted $ 89,268 $ - $ - $ - $ 89,268 $ 56,011
Unrestricted 67,163 - - - 67,163 33,281
Cash, end of year $ 156,431 - $ - $ - $ 156,431 $ 89,292
Continued on the next page
62
Colorado Housing and Finance Authority
Combining Schedule - Statement of Cash Flows (continued)
For the year ended December 31, 2012
(with summarized financial information for the year ended December 31, 2011)
(in thousands of dollars)
General Single Multi-Family/ Summarized
Program Family Business Eliminations 2012 2011
Reconciliation of operating income (loss) to net cash
provided by (used in) operating activities:
Net operating income (loss) $ 11,955 $ (19,656) $ 10,204 $ - $ 2,503 $ 16,973
Adjustments to reconcile operating income (loss) to
net cash provided by (used in) operating activities:
Depreciation expense 2,722 - - - 2,722 3,684
Amortization of service release premiums 6,060 - - - 6,060 3,538
Amortization of deferred loan fees/costs, net (430) 796 (144) - 222 65
Amortization of imputed debt associated with swaps - (4,060) (2,747) - (6,807) (6,364)
Provision for losses 1,407 6,356 1,343 - 9,106 9,036
Interest on investments (150) (16,123) (7,018) - (23,291) (23,418)
Interest on debt 4,718 83,715 42,368 (389) 130,412 144,909
Unrealized loss on derivatives (445) 14,265 - - 13,820 1,715
Unrealized gain on investments 13 (3,087) (516) - (3,590) (25,887)
(Gain) loss on sale of REO (65) (1,124) 23 - (1,166) 1,631
Gain on sale of loans (25,103) - - - (25,103) (16,792)
Changes in assets and liabilities:
Loans receivable and other real estate owned 48,661 267,424 67,409 (14,126) 369,368 350,818
Accrued interest receivable on loans and investments 1,092 1,580 438 (96) 3,014 3,742
Other assets 2,985 54 7 - 3,046 1,446
Accounts payable and other liabilities (24,420) - 475 - (23,945) (1,200)
Net cash provided by (used in) operating activities $ 29,000 $ 330,140 $ 111,842 $ (14,611) $ 456,371 $ 463,896
See accompanying independent auditors’ report.
Outstand
TMulti-FamMortgage2012.
ding General
The Authoritymily Housinge Loans. Eigh
Outsta
Resolution B
y has previoug Insured Moht (8) of such
Multi-FamilIssued a
Series OMF97B-2MF97B-2MF97B-2MF97B-3MF97C-2MF97C-2MF97C-2MF97C-3MF98A-2MF98A-2MF98A-2MF98B-2MF98B-2MF99A-1MF99A-2MF99A-2MF99A-2MF99A-3MF99A-3MF99A-3MF99BMF99BMF99BMF99C-2MF99C-2MF99C-3MF99C-3MF02AA
In connecPurchase as the 200facility wliquidity f Outstand
In connecthe intere"Counter Pursuant trate and wactual intefloating raProduct dAuthorityProduct cBonds an2002AA Dnot an Obany otheragainst th
The Authority conditions, wassets and m
ts.
ding General
ction with theAgreement w
02AA Liquidwith Credit anfacility with J
ding General
ction with theest rate swaprparty"). As o
to the 2002Awill receive inerest paymenate date). Th
does not affecy's obligation constitutes annd other OblDerivative Prbligation under person othe
he Counterpar
is permitted which additiomoneys pledg
Resolution L
issuance of twith Westdeudity Facility Pnd Liquidity JP Morgan Ch
Resolution D
e issuance of agreement (of December
A Derivativenterest from thnts by the Auhe agreement ct the Authori
to make intn Obligation uligations. Throduct in the er the Generaer than the Aty.
by the Generonal Bonds wged under the
Liquidity Fa
the 2002 Seriutsche LandesProvider. On
Facility (CLhase Bank, N.
Derivative Pr
the 2002 Ser(the "2002AA31, 2012, the
Product, the he Counterparuthority on th
of the Countity's obligatioterest paymeunder the Gehe Authorityevent of earlyal ResolutionAuthority hav
ral Resolutionwill be securede General Res
cilities
es AA Bondssbank Girozen
December 16LF). On Oct.A.
roducts
ries AA BondA Derivativee total outstan
Authority wirty at a variab
he 2002 Serieterparty to maon to make pents to the Ceneral Resolu's obligation y termination
n. Neither theve any rights
n to issue addd equally withsolution as d
s, the Authorintrale, acting 6, 2009, the Atober 10, 20
ds, the Authoe Product") nding notional
ill pay interesble rate whiches AA Bonds ake paymentsayment of th
Counterparty ution, secured
to make tern is a general e Owners of s under the 2
ditional Seriesth the outstandescribed in t
ity entered in through its NAuthority rep12, the Auth
ority has prevwith Barclayl amount was
st to the Counh will be an a(unless and
s under the 2he 2002 Serie
under the 20d on parity wrmination paobligation ofthe 2002 Ser
2002AA Deri
s of Bonds, sunding Bonds bthe related Of
nto a Standby New York Brplaced the liqhority replace
iously entereys Bank PLCs $23,935,000
nterparty at aamount equal
until any alte2002AA Derivs AA Bonds.002AA Deriv
with the lien oayments undef the Authoritries AA Bondivative Produ
ubject by the fficial
Bond ranch,
quidity ed the
d into C (the 0.
a fixed to the ernate vative . The vative of the er the ty and ds nor uct or
TO
The chart includeOutstanding Mort
Multi-FamilyInsured Bonds
(MFIB)MFIB 1997 Series BMFIB 1997 Series BMFIB 1997 Series BMFIB 1997 Series CMFIB 1997 Series CMFIB 1997 Series CMFIB 1998 Series AMFIB 1998 Series AMFIB 1998 Series AMFIB 1998 Series AMFIB 1998 Series BMFIB 1998 Series BMFIB 1999 Series AMFIB 1999 Series AMFIB 1999 Series AMFIB 1999 Series BMFIB 2002 Series AAMFIB 2002 Series AAMFIB 2002 Series AAMFIB 2002 Series AAMFIB 2002 Series AA
ed in this Appentgage Loans and
Partic. %1.14 FOUNTA
64.61 VILLAGE3.97 LAKEWO
DENVER 79.72 FOUNTA77.68 LAKEWO
MADISOMONTVIGRAND VHEATHE
71 MERCY H2.4 NATIONA29 MERCY H
35.39 VILLAGE97.6 NATIONA
BROOMFA VALLEY A HIGHLANA ALLIED SA 35.8 NIBLOCKA GRAND J
Certain Informa
dix C has been pProjects.
Company NamAIN RIDGE ASSOCIAE CREST APTSOOD HOMESTEAD LNORTHEAST ASSO
AIN RIDGE ASSOCIAOOD HOMESTEAD L
ON AVENUE APARTIEW MEADOWS ASVALLEY APARTMEN
ERWOOD APARTMEHOUSING COLORADAL GRAND LOWRYHOUSING COLORADE CREST APTSAL GRAND LOWRYFIELD SENIOR HOUSSUNNDSOUTHKJUNCTION HOUSING