29
Maximizing Value for Students and our State COLORADO RISES: Colorado Department of Higher Education’s Annual Return on Investment Report Statute: CRS 23-1-135

Maximizing Value for Students and our State
COLORADO RISES:
Colorado Department of Higher Education’sAnnual Return on Investment Report
Statute: CRS 23-1-135

Maximizing Value for Students and our State2 COLORADO RISES:
This report was prepared by the Colorado Department of Higher Education (CDHE)
Statute: CRS 23-1-135July 30, 2019
https://highered.colorado.gov/Data/Workforce/ROI.html
For more information contact: Katie Zaback, Senior Policy Director
Michael Vente, Senior Director of Research [email protected]

3COLORADO RISES: Maximizing Value for Students and our State
1600 Broadway, Suite 2200, Denver, CO 80202 P 303.862.3001 F 303.996.1329 highered.colorado.gov
In every corner of our state, we find hardworking Coloradans making a better life for themselves and their families. For many, that path to prosperity means earning a postsecondary certificate or degree—and for good reason. Those who continue their education beyond high school earn more money, feel healthier and engage more deeply with their communities. This social mobility yields benefits for our state. Postsecondary graduates contribute more tax dollars and rely on fewer government programs. They’re less likely to be involved with the criminal justice system and fare better during economic downturns. Higher education makes our economy stronger and more efficient. But with rising tuition and student debt, the value of college has been called into question. We know many Colorado families are sitting around the kitchen table today asking, is a postsecondary certification or degree even worth it? The data clearly show that yes, it is—as long as students finish what they start. This inaugural report aims to help Coloradans understand their options and maximize their higher education investment. As the report details, a credential’s worth isn’t neatly expressed in spreadsheets and numbers —it depends on where a student goes to school, how long they attend, what they major in and, most importantly, if they graduate. Other choices—like living at home or on campus—can significantly change the calculus of college. To understand this complex dynamic, we’ve broken down the report in four key pillars: price, debt, choice and value. Despite flagging state funding, institutions have worked hard to put college in reach. Close to 90 percent of students at two-year colleges and 72 percent at four-year universities receive a mix of federal, state and institutional aid that reduces the overall cost of attendance. Thanks to this support, students from low and middle-income families often attend for very low cost or even tuition-free. What’s more, the proportion of students taking on debt, as well as the average amount, has leveled off at four-year colleges and even declined at two-year schools. Countering national trends, just 10 percent of Colorado undergraduate students at four-year institutions took on more than $40,000 in debt; those rates and averages are even lower for community college students. With improved advising and academic planning, colleges can substantially reduce the risk of default by getting students though quickly and efficiently.
Jared Polis Governor
Dr. Angie Paccione Executive Director
1600 Broadway, Suite 2200 Denver, CO 80202
1600 Broadway, Suite 2200, Denver, CO 80202 P 303.862.3001 F 303.996.1329 highered.colorado.gov
Dr. Angie Paccione Executive Director Colorado Department of Higher Education
Improving access is vitally important in our advanced economy, which all but requires a certificate or degree to participate. About 75 percent of all Colorado jobs and 97 percent of top ones—those with high growth rates and that pay a living wage—require further education and training. It’s these demands that inspired us to reach 66 percent educational attainment by 2025, up from 56.9 percent currently. To power our economy, we must meet that mark and go even higher. Getting to 66 is not just a lofty goal, it’s a call to action for state, business and education leaders to work together and create a Colorado that works for everyone. Armed with this robust data, individuals—and our state—can make the most of higher education investment. Sincerely,
Jared Polis Governor

Maximizing Value for Students and our State4 COLORADO RISES:
1600 Broadway, Suite 2200, Denver, CO 80202 P 303.862.3001 F 303.996.1329 highered.colorado.gov
Dr. Angie Paccione Executive Director Colorado Department of Higher Education
In addition to maximizing financial aid, our administration is focused on decreasing higher education costs and helping to put a postsecondary credential in reach for every student. This means focusing on interventions like concurrent enrollment, which provides students with the opportunity to take higher education coursework while in high school, and expanding the use of open educational resources, which can significantly decrease textbook costs for students. Improving access is vitally important in our advanced economy, which all but requires a certificate or degree to participate. About 75 percent of all Colorado jobs and 97 percent of top ones—those with high growth rates and that pay a living wage—require further education and training. It’s these demands that inspired us to reach 66 percent educational attainment by 2025, up from 56.9 percent currently. To power our economy, we must meet that mark and go even higher. Getting to 66 is not just a lofty goal, it’s a call to action for state, business and education leaders to work together and create a Colorado that works for everyone. Armed with this robust data, individuals—and our state—can make the most of higher education investment. Sincerely,
Jared Polis Governor
1600 Broadway, Suite 2200, Denver, CO 80202 P 303.862.3001 F 303.996.1329 highered.colorado.gov
Dr. Angie Paccione Executive Director Colorado Department of Higher Education
Improving access is vitally important in our advanced economy, which all but requires a certificate or degree to participate. About 75 percent of all Colorado jobs and 97 percent of top ones—those with high growth rates and that pay a living wage—require further education and training. It’s these demands that inspired us to reach 66 percent educational attainment by 2025, up from 56.9 percent currently. To power our economy, we must meet that mark and go even higher. Getting to 66 is not just a lofty goal, it’s a call to action for state, business and education leaders to work together and create a Colorado that works for everyone. Armed with this robust data, individuals—and our state—can make the most of higher education investment. Sincerely,
Jared Polis Governor

5COLORADO RISES: Maximizing Value for Students and our State
Table of Contents
7 Introduction 19 The Value of Postsecondary Education
8 Return on Investment Factors 23 Conclusion and Future Areas of Focus
10 Cost 26 Data and Methodology
11 Price 27 Endnotes
13 Student Debt 28 Appendix
17 Factoring Choice into the Equation: Time and Credits to Credential

Maximizing Value for Students and our State6 COLORADO RISES:
This page is intentionally left blank

7COLORADO RISES: Maximizing Value for Students and our State
Introduction
To ensure Colorado continues to be an attractive place to live, work as well as conduct business, we must
empower and educate our workforce and meet the demands of employers.
Increasingly, that means expanding opportunity to earn a postsecondary credential. Analysis by the Georgetown Center on Education and the Workforce shows that in the current economy, approximately 56 percent of good jobs1 require a bachelor’s degree, and another 24 percent require some other postsecondary experience.2
Colorado’s public system of higher education educates and trains most of our citizens. To meet industry demands, The Colorado Department of Higher Education (CDHE) and the Colorado Commission on Higher Education (CCHE) released Colorado Rises: Advancing Education and Talent Development, a statewide master plan that aims to reach 66 percent educational attainment among Colorado’s adults by 2025.3 This plan highlights the value of postsecondary education for individuals, the economy and Colorado broadly.
The strategic goals outlined in this master plan focus on what public colleges and universities in Colorado can do to improve measurable postsecondary outcomes. These goals include:
STRATEGIC GOAL 1: Increase Credential
Completion
STRATEGIC GOAL 2: Erase Equity Gaps
STRATEGIC GOAL 3: Improve Student
Success
STRATEGIC GOAL 4: Invest in Affordability
and Innovation

Maximizing Value for Students and our State8 COLORADO RISES:
To assist lawmakers, taxpayers, students and families in understanding the value of postsecondary education in Colorado, HB18-1226, Higher Education Review Degree Program Costs and Outcomes, directed CDHE to publish an annual return on investment report. This inaugural volume explores four key factors that, in concert, describe return on investment.
Return on Investment Factors
As the report explains, return on investment varies by individual. The actual price of attendance goes beyond tuition costs, including fees, room and board and other costs associated with being a successful college student. Since most students receive financial aid, few pay the published cost of attendance; however, more students in Colorado and nationally are graduating with debt to finance their education. Debt and price are also influenced by choices available to and made by students and families along their credential pathway, including academic program, career opportunities, living arrangements and more. Taken together, these elements help students and families understand the value of their credential.
Price
How much education costs and how much students and families pay out-of-pocket
The number of students who take on loans and their average debt load
Debt
Choice Value
How students’ chosen educational pathways impact their overall return
The public and personal value of completing a postsecondary credential
The actual cost of
attendance goes beyond
tuition costs, including fees,
room and board and other
costs associated with being a
successful college student.

9COLORADO RISES: Maximizing Value for Students and our State
Data in this report show that higher education costs overall have been increasing. Although this report focuses on the costs and benefits to individuals, it’s also important to understand the factors driving increased costs of higher education—one of which is personnel. Personnel are essential to providing quality education services, and institutions must employ many highly educated faculty and staff to serve students well. As in other industries, the cost to employ such individuals has risen in the modern economy; personnel costs are also driving increases in industries like medicine, legal services, banking and engineering. Another factor is the growing need for high cost equipment and technology to deliver educational services.
As more postsecondary students with limited economic means enroll in college, Coloradans must have access to information on the economic returns of different credential paths. This report aims to improve overall student success, erase equity gaps and maximize the return of higher education investments by helping individuals and policymakers better understand the individual economic value of the postsecondary education system. For institutions, this report underscores the importance of making higher education more affordable and innovative to contain costs.
Finally, this report details strategies that maximize the value of Colorado’s
postsecondary education system and ensure all Coloradans have access to education
beyond high school to pursue their dreams and improve our communities.

Maximizing Value for Students and our State10 COLORADO RISES:
The increasing costs of higher education has attracted public scrutiny over the last decade. Although cost increases at public colleges have leveled out recently, tuition increases have far outpaced inflation for many years4. The published “sticker price” for tuition and fees at public two-year institutions grew 37 percent between 2008 and 2018 to $3,670; during the same period, tuition at four-year institutions across the US grew 32 percent to $10,2705. In Colorado, these numbers are even more dramatic, with tuition at public two-year institutions growing by 52 percent (to $4,470) and tuition at public four-year institutions increasing 68 percent (to $11,130).6
There are many reasons for these national and state level trends. Notably, the most dramatic tuition increases at public colleges happened
between 2009 and 2012 when states, faced with declining revenues due the Great Recession, dramatically cut higher education budgets. During this time higher education appropriations declined 24.2 percent nationally. Higher education institutions, also financing benefits and personnel costs, offset decreases in state appropriations by raising tuition. In fact, higher education funding levels in Colorado and nationally are still 11 percent below pre-recession funding levels.7
Despite these trends, Colorado institutions must continue to find innovative ways to control costs while educating diverse populations of students; guiding more to graduation and offering innovative, workforce-aligned programs. This means rethinking some traditional models and structures of higher education.
Cost
In-state tuition and fees in Colorado four-year institutions are about $11,140 (10 percent above the national average), ranking Colorado 15th nationally. Tuition at two-year institutions is $4,510 (about 20 percent above the national average), ranking Colorado 23rd nationally.8
Because the state and the institutions have committed to affordability for in-state students, many students—particularly those from low-income families—pay little, if any tuition, and end up with a significantly lower net price overall.
Two-Year Colleges
Lowe
st
Average Highest
$1,5
00
$3,700
$8,200
Colorado$4,500
Four-Year Colleges and Universities
Lowe
st
Average Highest
$5,4
00
$10,300
$16,500
Colorado$11,100
Two-Year Colleges
Lowe
st
Average Highest
$1,5
00
$3,700
$8,200
Colorado$4,500
Four-Year Colleges and Universities
Lowe
st
Average Highest
$5,4
00
$10,300
$16,500
Colorado$11,100
Given low state investment—Colorado ranks
47th in the nation for state appropriations
for postsecondary education—institutions
have worked hard to keep in-state tuition
costs close to the national average.
View program level tuition and fee data by institution.https://highered.colorado.gov/Data/Workforce/ROIfiles/programleveltuitionandfeedata.xlsx

11COLORADO RISES: Maximizing Value for Students and our State
Room and BoardLiving at Home $4,400
Room and Boardfor Independents
$10,300
$4,500Two-Year InstitutionTuition and Fees
Four-Year InstitutionTuition and Fees $11,100
Computer $1,100Personal Expenses $1,400
Transportation $1,700Books and Other Expenses $1,800
Room and BoardOn Campus
$10,800
Books andOther Expenses
Roomand Board
Tuitionand Fees
Institutions of higher education calculate a student’s total cost of attendance based on the student’s living situation and determine financial aid levels based on the student’s family income. Very few students pay the total cost of attendance; almost all receive a mix of federal, state and college funded grants and scholarships, otherwise known as financial aid. The total cost of attendance, subtracting financial aid, is often referred to as a student’s net price. The net price is what a student and their family pays of-out-of-pocket.
Net Price What Students and Families Must Pay
Financial Aid
• Federal Grants
• State Grants and Scholarships
• Institutional Grants and Scholarships
Cost of Attendance
• Tuition and Fees
• Room and Board
• Books and Other Expenses
What is the total cost? When attending postsecondary education, students pay costs beyond the listed price for tuition and fees. These expenses include housing, food, books and other costs associated with being a successful student. The full cost burden of college is referred to as the total cost of attendance.
Price

Maximizing Value for Students and our State12 COLORADO RISES:
Increasing FAFSA CompletionStudents are required to complete the Free Application for Federal Student Aid (FAFSA) to apply for federal and most state financial aid, and most institutions use this form to determine institutional aid. Colorado is ranked 47th nationally for FAFSA completion, and as a result, CDHE estimates high school seniors missed out on $47 million in federal student aid for which they would have been eligible. Prior funding allowed the Department to assist students and families in filling out the FAFSA; as those resources have diminished, FAFSA completion rates have declined. HB19-1187, Increase Student Aid Application Completion Rates, signed by Governor Polis earlier this year, replaces some of these resources and aims to increase the number of students who complete the FAFSA, helping reduce the total cost of attending college for individuals.
Increasing Investments in Need-Based Student Aid and the Colorado Opportunity Scholarship Initiative (COSI) As the state works to reach pre-recession funding levels, need-based aid for students continues to be an essential strategy in reducing the costs of college. In 2019 Colorado awarded more than $150 million in need-based financial aid to students (including work study); COSI leveraged $7.5 million in matching state funds to provide $15 million in new student scholarships. In May, Governor Polis signed HB19-1196, Financial Aid For Students With In-State Tuition, which allows all Colorado residents, regardless of immigration status, to receive these state funds.
KEY StrategiesCOST AND PRICE
Average Financial Aid $7,100
$6,400$4,300 $1,800 $1,100
$10,500 $9,500
$6,300 $2,700 $1,600
AverageNet Price
$11,900 $12,600
$14,700 $17,200
$17,900
$15,100 $16,100
$19,300 $22,900
$24,000
0 - $30,000 $30,001 - $48,000 $48,001 - $75,000 $75,001 - $110,000 > $110,000
Average cost of attendance Two-Year InstitutionTuition and FeesOther CostsTotal Cost of Attendance
$4,500$14,500$19,000
+=
+=
Four-Year Institution$11,100$14,500$25,600
+=
Family Income
2-year 4-year 2-year 4-year 2-year 4-year 2-year 4-year 2-year 4-year
Financial aid impacts cost of attendance
PercentReceiving
Financial Aid99% 96% 92% 48% 20%99% 98% 84% 44% 39%

13COLORADO RISES: Maximizing Value for Students and our State
To pay the net price of college, families and students depend on private scholarships, savings, income earned while a student is enrolled in school, and increasingly, student debt. Recent reports by the New York Federal Reserve show that student debt is one of the fastest growing forms of debt nationally9.
Countering these trends, debt among graduates of Colorado’s public institutions has declined 5 percent among those who attended four-year schools and 10 percent for those who attended two-year schools since 2014. In 2018, two-thirds of bachelor’s degree graduates and half of two-year college graduates accrued student loan debt. In 2018, the average student loan debt for a Colorado bachelor’s degree graduate was approximately $25,500.
Student Debt
When adjusting for inflation, debt levels at two and four-year institutions have declined since 2014.
Certificate or Associate Graduate Bachelor’s Graduate
Average debt for students attending public colleges and universities has leveled off and even declined recently
2014 2016 2018Percent of Graduates with Debt
65% 60% 56%
Average Debt
$14,900 $14,300 $13,300
2014 2016 2018Percent of Graduates with Debt
69% 71% 69%
Average Debt
$26,900 $27,200 $25,500
View average debt by institution over time.https://highered.colorado.gov/Data/Workforce/ROIfiles/avgdebtbyinstitution.xlsx
Maximizing Value for Students and our State14 COLORADO RISES:
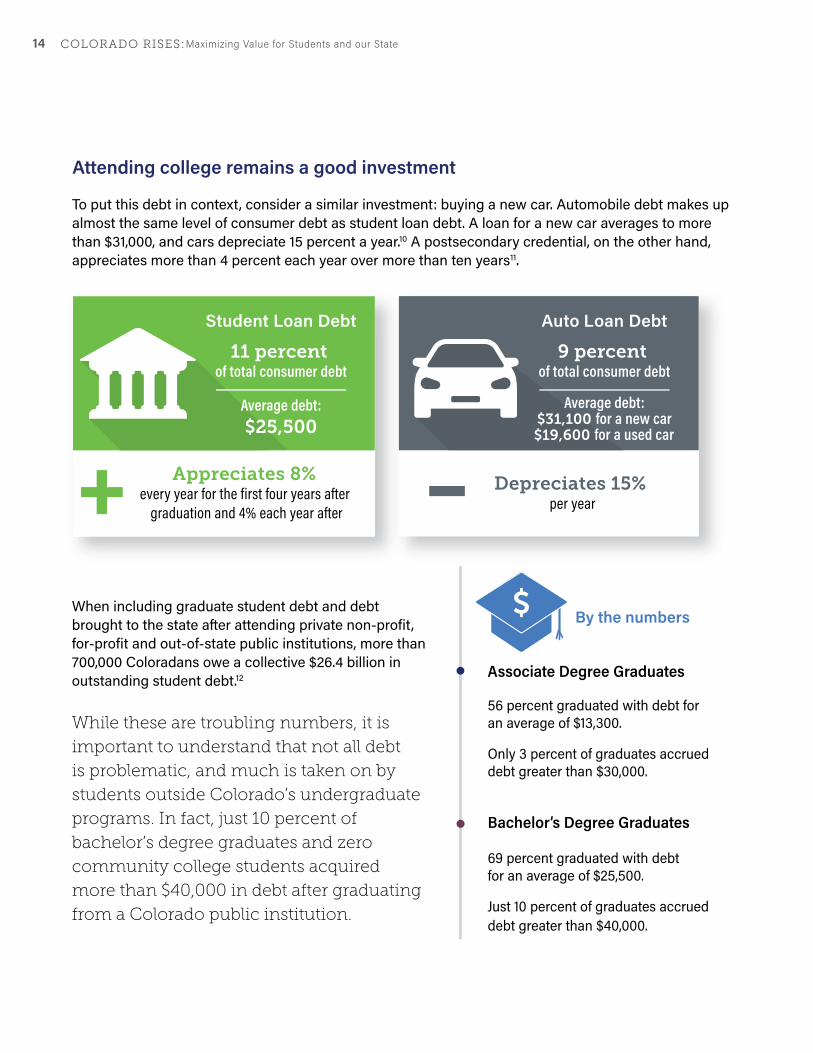
Associate Degree Graduates 56 percent graduated with debt for an average of $13,300.
Only 3 percent of graduates accrued debt greater than $30,000.
Bachelor’s Degree Graduates 69 percent graduated with debt for an average of $25,500.
Just 10 percent of graduates accrued debt greater than $40,000.
$
Student Loan Debt
11 percent of total consumer debt
Average debt:$25,500
+ Appreciates 8% every year for the first four years after
graduation and 4% each year after
Auto Loan Debt
9 percent of total consumer debt
Average debt:$31,100 for a new car
$19,600 for a used car
Depreciates 15% per year
To put this debt in context, consider a similar investment: buying a new car. Automobile debt makes up almost the same level of consumer debt as student loan debt. A loan for a new car averages to more than $31,000, and cars depreciate 15 percent a year.10 A postsecondary credential, on the other hand, appreciates more than 4 percent each year over more than ten years11.
When including graduate student debt and debt brought to the state after attending private non-profit, for-profit and out-of-state public institutions, more than 700,000 Coloradans owe a collective $26.4 billion in outstanding student debt.12
While these are troubling numbers, it is
important to understand that not all debt
is problematic, and much is taken on by
students outside Colorado’s undergraduate
programs. In fact, just 10 percent of
bachelor’s degree graduates and zero
community college students acquired
more than $40,000 in debt after graduating
from a Colorado public institution.
Attending college remains a good investment
By the numbers

15COLORADO RISES: Maximizing Value for Students and our State
Although taking on debt feels daunting for many, it’s a tool to make college affordable—as long as students finish what they start:
How to make the most of student loans
Colorado holds loan servicers accountable In 2019, Governor Jared Polis signed SB19-002, Regulate Student Education Loan Servicers, which creates a new student loan ombudsperson in the Colorado Attorney General’s office and provides other important protections for student loan borrowers.
Why does the average debt seem less than what’s often reported nationally? These data reflect undergraduate debt taken on by students attending Colorado public institutions. Debt accrued while attending graduate school, private schools, for-profit educational institutions or out-of-state institutions inflated averages reported in other sources.
There are also several programs that can help reduce graduates’ debt burden once they begin working:
9%
Two-thirds of people who default on their student loan
debt accrue less than $10,000.
compared to
24%of college graduates default on their loans
of students who don’t complete their degree
Just
Income Driven Repayment ��These plans make payments manageable by basing them on a borrower’s ability to pay. Graduates pay lower amounts over a longer period and may qualify for loan forgiveness at the end of the loan term (typically after 15 to 25 years).
Student Loan Forgiveness��The federal government allows teachers in high needs areas and individuals who work in public service for more than 10 years to have their student loans forgiven after a shorter time frame if they meet the program requirements.
Finally, debt can be an
important tool to achieve
affordability if students
finish what they start.
Students who do not graduate are more likely to default than completers—24 versus 9 percent respectively. Among those who default, two-thirds default on less than $10,000.13
Encouraging timely completion, providing more intensive wraparound services and building targeted loan forgiveness programs will help more Coloradans meet their obligations, avoid default and benefit from credential completion. In fact, two recent studies illustrate that discouraging debt can reduce completion and increase default rates—particularly for community college students.14 To stave off default risk, Colorado leaders and policymakers should continue to discuss stronger protections for student borrowers and monitor how student loan debt affects economic behavior.

Maximizing Value for Students and our State16 COLORADO RISES:
Cost Containment Equal Opportunity
Accelerating TimeReasonable Debt Public Investment
Guiding Principles
KEY StrategiesSTUDENT DEBT
Expanding the use of 529 Accounts CollegeInvest is a not-for-profit division of the Colorado Department of Higher Education committed to helping Colorado families take the critical first steps in accessing education beyond high school. CollegeInvest Savings Plans, otherwise known as 529 savings plans, allow Colorado residents to deduct every dollar they save from their Colorado state income taxes in addition to receiving federal tax benefits. HB19-1280, Child College Savings Accounts, will provide all children, born or adopted, in Colorado from 2020 to 2040 with a $100 credit to kickstart their college education savings.
CCHE’s Affordability Framework To meet workforce demands, continue robust economic growth and ensure all Coloradans can pursue their dreams, we must expand educational opportunity and erase equity gaps. However, these goals are only achievable if all Coloradans can afford higher education, whether they pursue a certificate, degree or other credential. This imperative inspired the Colorado Commission on Higher Education to establish an affordability framework in May of 2019 that will drive a bold, students-first policy agenda. This framework will guide the Commission’s policy decisions, such as supporting SB19-003, Educator Loan Forgiveness Program, which aims to alleviate the debt burden for Colorado teachers.
A postsecondary education is affordable when all Coloradans can access financial resources that cover the costs of earning a credential of their choice, and institutions, the state, the federal government, students and families work together to put that opportunity in reach. On top of federal, state, and institutional aid, resources may include student and family contributions, including savings; private grants and scholarships; income from reasonable work expectations while in school; and a manageable debt load relative to the value of the student’s course of study and overall higher education experience. While students and families can make choices that impact what they pay, the decisions and policies of institutions, the state, and federal government have a responsibility to contain costs.
To reduce the burden on students, Colorado institutions commit to containing costs and operating as efficiently as possible while maintaining quality.
Multiple postsecondary pathways should be accessible to all Coloradans regardless of age, income, race and zip code.
Student debt can be a tool to achieve affordability, depending on total cost of credential, student loan terms and potential future earnings.
Student’s educational choices—such as course selection in college, prior learning, and participation in precollegiate programs like Concurrent Enrollment, Advanced Placement and International Baccalaureate—can reduce the cost and time it takes to earn a credential.
State investment in higher education provides Coloradans access to the skills and knowledge they need to thrive, yielding social, civic and economic returns for our state and advancing the public good.
Reasonable Debt: Students can repay the debt they must incur to complete their educational programs within a 10-year period based on a reasonable expectation of earnings they receive from completing their program without undue burden or hardship.
Cost: The listed cost to attend a higher education program, commonly referred to as the “sticker price.” This includes tuition and fees as well as room and board, books and other education related expenses.
Price: The final amount paid by the student, subtracting financial aid, scholarships and additional resources.
DEFINITIONS
Affordability Framework

17COLORADO RISES: Maximizing Value for Students and our State
Factoring Choice into the Equation: Time and Credits to Credential for First Time StudentsMany choices impact the affordability of a student’s education pathway, including their institution, living arrangements, degree and program choice. Students can dramatically reduce the cost of education by reducing the time and credit load it takes to complete a postsecondary credential—a strategy that also increases their likelihood of success.15
To maximize the return on investment of a credential, students and institutions should
act to reduce the time it takes to and minimize the number of credits accumulated in
route to a credential. This mitigates opportunity costs while lowering net price.
Compared to other states, Colorado students complete credentials faster and with fewer credits—largely due to Colorado’s long-standing statewide transfer and articulation agreement framework, Prior Learning Assessment opportunities and accelerated developmental education strategy. 16 There is still a long way to go, however, to support students, and the Department continues to work with Colorado institutions to implement best practices that reduce excess time and credits toward graduation.
Certificate Associate Degree Bachelor’s Degree
Average Credits at Credential
1-Year 2-Years 3-Years 4-Years 5-Years
Certificate
Associate
Bachelor’s
Average Time to Degree
2.04 Years
3.94 Years
4.66 Years
1-Year
2-Years
4-Years
9-30Between
Average
25.29
60Average
66.73
120Average
134.67
View average time and credits to credential by institution.https://highered.colorado.gov/Data/Workforce/ROIfiles/timetodegree_2019.xlsx

Maximizing Value for Students and our State18 COLORADO RISES:
Complete College America Momentum State, Developmental Education Reform and Guaranteed Transfer Pathways In October 2018, Colorado became a Complete College America (CCA) Momentum Pathways State, working with institutions to implement evidence-based strategies that help students meet key, first-year benchmarks.17 This designation builds on the Department’s existing leadership to reform developmental education through HB19-1206, Higher Education Supplemental Academic Instruction. This bill requires developmental education placement policies to maximize student success and ensures all students have access to co-requisite developmental education, thus reducing the number of students placed into developmental education and time and credits to credential for those who are. Moreover, CCA’s guided pathways approach, already rolled out on many Colorado campuses, assists students in choosing their education pathway earlier. Guided pathways also leverage Guaranteed Transfer (or GT) Pathways that improve transparency and minimize credit loss in the transfer process.
Concurrent Enrollment Concurrent Enrollment is a key strategy that enables students to reduce their time and cost to credential by enrolling in college courses while in high school. Almost all districts in Colorado offer Concurrent Enrollment, and participation grew 10 percent last year. In fact, 2,800 high school students completed a postsecondary credential before high school graduation through Concurrent Enrollment in 2018.18 Governor Polis recently signed SB19-176, Expanding Concurrent Enrollment Opportunities, which will help more students access high quality Concurrent Enrollment opportunities and ensure all credits earned transfer to every state public institution.
KEY StrategiesCHOICE
STUDENTSHIGH SCHOOL
2,800
Completed a postsecondary credential before high school graduation through Concurrent Enrollment
In 2018
19COLORADO RISES: Maximizing Value for Students and our State
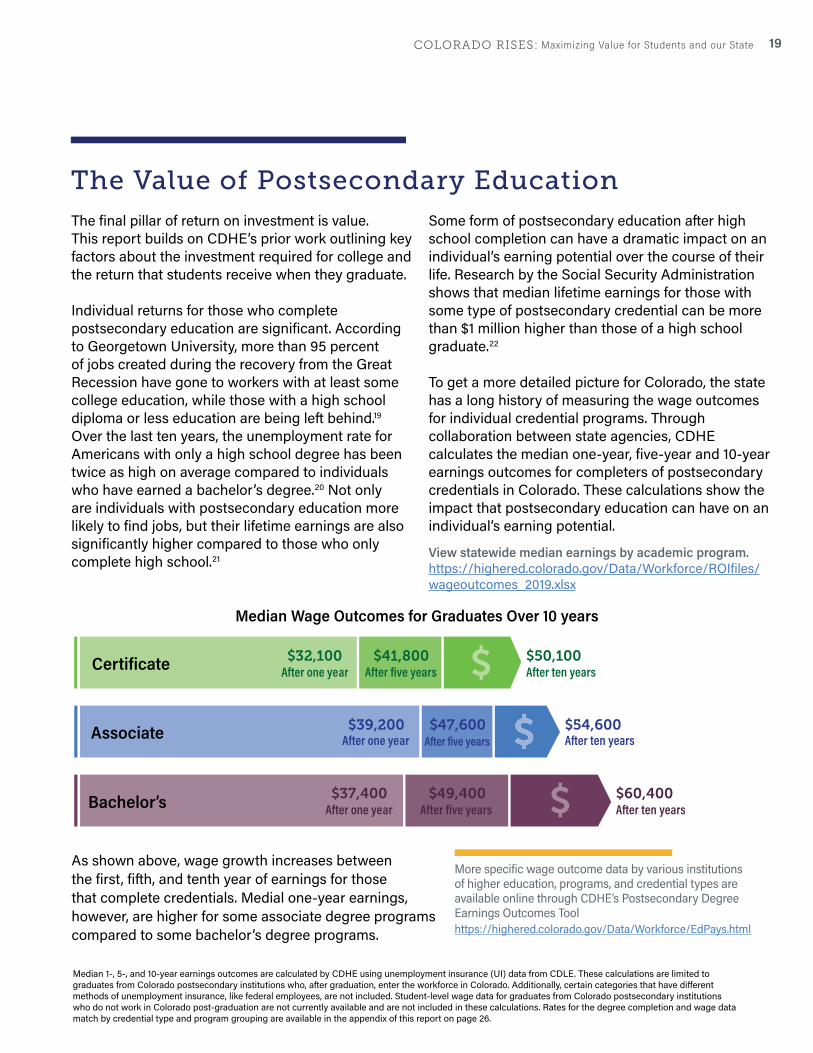
Certificate
Associate
Bachelor’s
$32,100After one year
$39,200After one year
$37,400After one year
$41,800After five years
$47,600After five years
$49,400After five years
$50,100After ten years
$54,600After ten years
$60,400After ten years
The Value of Postsecondary Education
As shown above, wage growth increases between the first, fifth, and tenth year of earnings for those that complete credentials. Medial one-year earnings, however, are higher for some associate degree programs compared to some bachelor’s degree programs.
Median 1-, 5-, and 10-year earnings outcomes are calculated by CDHE using unemployment insurance (UI) data from CDLE. These calculations are limited to graduates from Colorado postsecondary institutions who, after graduation, enter the workforce in Colorado. Additionally, certain categories that have different methods of unemployment insurance, like federal employees, are not included. Student-level wage data for graduates from Colorado postsecondary institutions who do not work in Colorado post-graduation are not currently available and are not included in these calculations. Rates for the degree completion and wage data match by credential type and program grouping are available in the appendix of this report on page 26.
The final pillar of return on investment is value. This report builds on CDHE’s prior work outlining key factors about the investment required for college and the return that students receive when they graduate.
Individual returns for those who complete postsecondary education are significant. According to Georgetown University, more than 95 percent of jobs created during the recovery from the Great Recession have gone to workers with at least some college education, while those with a high school diploma or less education are being left behind.19 Over the last ten years, the unemployment rate for Americans with only a high school degree has been twice as high on average compared to individuals who have earned a bachelor’s degree.20 Not only are individuals with postsecondary education more likely to find jobs, but their lifetime earnings are also significantly higher compared to those who only complete high school.21
Some form of postsecondary education after high school completion can have a dramatic impact on an individual’s earning potential over the course of their life. Research by the Social Security Administration shows that median lifetime earnings for those with some type of postsecondary credential can be more than $1 million higher than those of a high school graduate.22
To get a more detailed picture for Colorado, the state has a long history of measuring the wage outcomes for individual credential programs. Through collaboration between state agencies, CDHE calculates the median one-year, five-year and 10-year earnings outcomes for completers of postsecondary credentials in Colorado. These calculations show the impact that postsecondary education can have on an individual’s earning potential.
More specific wage outcome data by various institutions of higher education, programs, and credential types are available online through CDHE’s Postsecondary Degree Earnings Outcomes Tool https://highered.colorado.gov/Data/Workforce/EdPays.html
Median Wage Outcomes for Graduates Over 10 years
View statewide median earnings by academic program.https://highered.colorado.gov/Data/Workforce/ROIfiles/wageoutcomes_2019.xlsx

Maximizing Value for Students and our State20 COLORADO RISES:
Certificate Median wage outcome1-YEAR
Arts, Humanities and Communication
Business
Education
Health
Science, Technology, Engineering and Math
Social and Behavioral Sciences and Human Services
Trades
Median wage outcome5-YEAR
Median wage outcome10-YEAR
2.04 YEARS 25.29Time to Credential Credits at Credential
$25,325
$38,928
$23,806
$26,084
$38,822
$28,323
$39,734
$33,082
$42,272
$28,835
$38,861
$44,890
$36,884
$48,221
$37,186
$47,237
$24,009
$46,200
$48,832
$40,014
$58,422
$32,111 $41,763 $50,130 Earnings by Credential Type and Program Grouping
Median wage outcome1-YEAR
Arts, Humanities and Communication
Business
Education
Health
Science, Technology, Engineering and Math
Social and Behavioral Sciences and Human Services
Trades
Median wage outcome5-YEAR
Median wage outcome10-YEAR
3.94 YEARS 66.73Time to Credential Credits at Credential
$29,168
$35,404
$24,384
$51,048
$40,346
$28,102
$40,284
$40,195
$42,765
$26,704
$57,815
$48,657
$35,944
$53,150
$46,122
$46,845
$30,471
$64,922
$55,262
$37,004
$64,637
$39,223 $47,558 $54,595Earnings by Credential Type and Program Grouping
Associate
Median Wage Outcomes by Program
CDHE led the country by linking wage data to postsecondary education data as part of their partnership with College Measures, a project of the American Institutes of Research.23 This project led to several resources being made available to students and families displaying the average expected earnings of graduates with specific credentials from specific institutions, namely Launch My Career Colorado.24 This tool displayed expected earnings for credentials as well as the expected amount of time for a student to pay back postsecondary education costs, enabling students to explore the various postsecondary education paths available to them based on their interests and life goals.

21COLORADO RISES: Maximizing Value for Students and our State
For individuals, research suggests that people who earn postsecondary credentials have more social mobility, better health outcomes and greater life expectancy. They are also significantly less likely to interact with the criminal justice system and much more likely to volunteer and/or be civically engaged.25 For society, citizens who earn a postsecondary credential contribute more tax dollars to the local and state economy and are less likely to be dependent on government assistance programs.26
Beyond economic gains, postsecondary education yields individual and societal benefits.
Median Wage Outcomes by Program
Bachelor’s Median wage outcome1-YEAR
Arts, Humanities and Communication
Business
Education
Health
Science, Technology, Engineering and Math
Social and Behavioral Sciences and Human Services
Trades
Median wage outcome5-YEAR
Median wage outcome10-YEAR
4.66 YEARS 134.67Time to Credential Credits at Credential
$29,634
$43,363
$34,218
$55,231
$43,420
$29,988
$37,723
$42,507
$57,101
$40,320
$59,954
$60,049
$44,389
$50,489
$50,092
72,448
$45,152
$66,651
$76,054
$52,926
$60,156
Earnings by Credential Type and Program Grouping
$37,364 $49,351 $60,370

Maximizing Value for Students and our State22 COLORADO RISES:
KEY StrategiesVALUE
Talent Pipeline ReportThe Colorado Talent Pipeline Report (TPR), written by the Colorado Workforce Development Council in partnership with the Colorado Department of Higher Education (CDHE) and other state agencies, is the guiding document on Colorado’s workforce. The annual report highlights areas of growing workforce demand within the state and Colorado’s progress in meeting that demand. The TPR also highlights key strategies while recommending new policies that further the state’s workforce goals. CDHE and stakeholders use this report to guide career pathways and strategic development.
My Colorado Journey Colorado state agencies—from workforce development, higher education and human services—have teamed up with pioneering data and technology firms to launch My Colorado Journey, a groundbreaking education and career planning initiative. This powerful, personal and private system provides step-by-step guidance for accomplishing life goals, whether it’s applying to the right college, finding the best job or successfully switching careers. A free resource, My Colorado Journey integrates collaborative case management tools that connect users to the professionals who support them.
This platform allows students and job seekers of all ages to navigate Colorado’s education system in an informed way and find and complete an education and training path of their choice. The tool also allows students to know workforce needs in their region to enable postsecondary education choices that match workforce needs.
30+
have become law based on the findings of the Talent Pipeline Report
over the past five years
BILLS

23COLORADO RISES: Maximizing Value for Students and our State
Conclusion and Future Areas of Focus
Earning a postsecondary credential can positively
impact the lives of students and improve Colorado’s
society broadly.
Increased wages among postsecondary graduates enhance Colorado’s labor market, which provides more opportunities to support families across the state. Additionally, societal benefits beyond economic gains, such as higher social mobility, higher likelihood of civic engagement and reduced likelihood to be involved with the criminal justice system, benefit all Coloradans.
However, as outlined in this report, barriers to achieving postsecondary education can hinder a student’s postsecondary success. To improve odds of success, the state must provide information on the price and expected debt for postsecondary education as well as the value of postsecondary education and the various education choices available to them. This report highlights key strategies the Governor’s office, the Colorado General Assembly and CDHE are already pursuing to ensure Colorado maximizes the return on investment of its postsecondary education system.

Maximizing Value for Students and our State24 COLORADO RISES:
Expanding the use of Prior Learning Assessment (PLA)
Almost 40 percent of students who attend Colorado postsecondary institutions are older than 25 and increasingly work while in school. Some estimates suggest that as many as 75 percent of Colorado students are working more than 20 hours a week.27 Additionally, many of these individuals have life experiences and other academic experiences that may translate to credit. To make higher education more accessible, affordable and efficient for these students, Colorado must begin recognizing competencies and knowledge honed outside a traditional classroom.
The state’s existing Prior Learning Assessment (PLA) infrastructure awards credential-applicable college courses for demonstrated learning and competencies. Using this infrastructure to award credit for more student experiences will save adult students two precious commodities: time and money.
Expanding Concurrent Enrollment and Open Education Resources Access
The state’s Concurrent Enrollment program has shown rich, scalable impact year-over-year. Participation of high school students in Concurrent Enrollment courses can be an effective strategy that levels the playing field for students by providing them exposure to postsecondary coursework, saving them time and money. CDHE plans to continue to find ways for more high school students to experience Concurrent Enrollment by reducing barriers to participation.
In total, Colorado students paid an estimated $148 million dollars on textbooks in 2016.28 The high cost of textbooks can lead students to enroll in fewer courses—which threatens successful graduation—or forego purchasing required textbooks. When students can’t afford course materials, they get set back in learning, retention and earning a college degree. The state currently has an Open Education Resources Council leading this work and has awarded significant grant aid to encourage further innovation. These innovations should be used to reduce costs to students and maximize their likelihood of achieving a credential.
Focusing Resources Toward Need Based Financial Aid Programs and Wraparound Support Services
The state can reduce costs to students by increasing need-based financial aid funds, including work study and the Colorado Opportunity Scholarship Initiative (COSI). Their approach to complement financial resources with wraparound support services, through Community Partner Program (CPP) grantees, ensures that Colorado’s investment in need-based aid yields better results. Internal studies using the latest available data show that 87 percent of COSI students enrolled in CPP—TRIO-style support services—persist in their education path.29 This is a significant outcome, as the persistence rate of CPP students is 15 percentage points higher than that of peers in similar demographic groups. Students who receive COSI Matching Student Scholarships (MSS) perform even better: 89 percent continue in their second and third years, outpacing their non-COSI counterparts by 25 percentage points.
CDHE will continue to invest time and talent in initiatives aimed at
removing barriers to students. The bold areas of focus below show
promise in ensuring that all Coloradans have an education beyond
high school to pursue their dreams and improve our communities.

25COLORADO RISES: Maximizing Value for Students and our State
Further investments this and other programs that provide resources directly to students would help more students get the financial assistance needed to maximize the return of their credential and the wraparound support that leads to credential completion.
Find Innovative Ways to Reduce Costs for Credential with High Social Value but low Economic Returns Beginning with Rethinking Educator Preparation
Educators empower the citizenry of Colorado and ensure we have a bright civic and economic future. Without strong educators, the higher education system will not be able to produce the workforce our state needs to thrive. However, the findings of this report suggest that the return on investment for Colorado educators may not add up. Ten years after graduation, students who graduate with a bachelor’s degree in education make an average of just $45,000. Although there may be other benefits associated with being an educator, the low economic return and increasing costs limits who can pursue a career in education.
To reverse these trends, the state may consider growing the Educator Loan Forgiveness Program, which authorizes the Colorado Department of Higher Education to offer loan repayment for educators serving in hard-to-fill positions. Additionally, SB19-190, Teacher Preparation Program Support, asks CDHE, in collaboration with CDE, to create report on best practices in education preparation by January 2020. In identifying best practices, the state should prioritize those that ensure quality
educator preparation while also minimizing the financial burden. Apprenticeship models, paid field experience opportunities and other approaches that allow educators to earn while they progress to a credential may show promise in making an education career more economical to more people and helping to diversify the educator ranks.
Ensuring Accountability
Enhancing accessibility to data like the metrics outlined in this report improves transparency and accountability for postsecondary institutions and the system of higher education in Colorado. Additionally, these data also inform students (of all ages) and families in making the best choice for their future. Further development of metrics associated with postsecondary success using data from institutions continues to be a goal of the Department. Showcasing these data and metrics on interactive dashboards (like an enhanced Colorado Rises Master Plan Dashboard) enables this valuable information to reach a wide audience. Additionally, the My Colorado Journey platform serves up information relevant to users’ goals and life situation, whether they are high school students choosing between education pathways; military veterans transitioning into civilian life; adults changing careers; justice-involved individuals re-entering society; or opportunity youth starting a more promising life. The platform connects students to government tools and professionals for coaching, goal-setting, and wraparound information and resources, leveraging partner professionals and resources throughout the state.

Maximizing Value for Students and our State26 COLORADO RISES:
Data and Methodology
Program groupingsPrograms were grouped into categories using by two- digit CIP codes and the Complete College America Meta Major framework that has been adopted by the Bill and Melinda Gates Foundation, SHEEO, NCHEMS and other foundations. Grouping programs provides higher match rates (by overarching program) and more aggregated counts of students (to address data privacy concerns).
Cost DataTo allow for national comparisons, state level published tuition and fees estimates were taken from the College Board’s Trends in College Pricing Report. These data are closely aligned with the numbers reported in the Department’s annual Tuition and Fees report. Institutional and program data on tuition and fees in this report come from the CDHE Tuition and Fees report. Estimates for other housing, food, books and other expenses used to calculate cost of attendance are from the Colorado Commission on Higher Education’s approved student budget parameters. Finally, average financial aid data is derived from data reported on the Financial Aid portion of the Integrated Postsecondary Data System (IPEDS).
DebtState and institutional level debt was calculated using 2017-18 SURDS Financial Aid File. It includes students who completed at a Colorado institution of higher education and were classified as resident students through the duration of their education. For graduates from four-year institutions, it includes debt that they incurred up to six years before graduation; for graduates from two-year institutions, it includes debt that was incurred up to three years before graduation.
View average debt by institution over time. https://highered.colorado.gov/Data/Workforce/ROIfiles/avgdebtbyinstitution.xlsx
Time to credential and credits at credentialTime to credential was calculated using completion data from the 2017-2018 SURDS Degree file. Of those who completed at a Colorado public institution of higher education (IHE), the student’s first-time enrollment at that same Colorado IHE was found. Additionally, a student’s first-time enrollment was matched to the type of credential the student was seeking. For example, if a student received a bachelor’s degree then the students first-time, bachelor’s degree seeking status entry was used. Based on these
data, a time to credential (in years) was calculated. Calculations for associate degrees and certificates used a similar method. Students who transfer to other institutions and students receiving a credential via the state’s Reverse Transfer process were removed from the calculations. Credits at credential data was calculated using the maximum cumulative credits hours accumulated by a student at the time of their credential completion. A data file with more detailed time to credential and credits at credential information by IHE can be found here.
Median earningsCDHE’s work over several years to link credential completion and UI wage data has resulted in the ability to provide valuable insights into actual wage outcomes for those that complete and credential in Colorado and stay in Colorado post-graduation to work. Median one, five and 10-year earnings data were calculated matching degree completion and UI wage data. A detailed methodology for these calculations as well as median wage outcomes by IHE, program grouping (2-digit CIP) and program (4-digit CIP) can be found via CDHE’s Postsecondary Degree Earnings Outcomes Tool.
To calculate the various metrics outlined in this report, CDHE receives data from several sources, including Colorado public postsecondary institutions of higher education (IHEs) via the Department’s SURDS (Student Unit Record Data System) and unemployment insurance (UI) wage data from the Colorado Department of Labor and Employment. The sharing of data among IHEs and CDHE, as well as data sharing between CDHE and other state agencies, has allowed CDHE to provide valuable insights into student postsecondary success. The summary below lists several metrics outlined in this report and the methods used to calculate those metrics.
Cohorts of graduates included in wage outcomes:1-Year 2002-2017 5-Year 2002-2013 10-Year 2002-2008

27COLORADO RISES: Maximizing Value for Students and our State
Endnotes1 Good jobs are defined as jobs paying a minimum of $35,000 for workers between the ages of 25 and 44 and $44,000 for those 45 to 64 years old.2 Carnevale, A., Strohl, J., Ridley, N., and Gulish, A. (2018). Three Educational Pathways to Good Jobs. Georgetown University Center on Education and the Workforce3 https://highered.colorado.gov/Publications/CDHE-Master-Plan-2017.pdf4 https://trends.collegeboard.org/college-pricing5 Author’s Calculations from Figure 3 in College Board Trends in College Pricing 2018. Available here: https://trends.collegeboard.org/college-pricing6 Authors Calculations from Table 5 in College Board Trends in College Pricing 2018. Available here: https://trends.collegeboard.org/college-pricing7 https://sheeo.org/project/state-higher-education-finance/8 https://trends.collegeboard.org/college-pricing/figures-tables/published-prices-national#Published%20Charges,%202018-199 New York Federal Reserve, Household Debt and Credit Report (Q1 2019) available at: https://www.newyorkfed.org/microeconomics/hhdc.html10 https://www.newyorkfed.org/newsevents/news/research/2019/20190212 11 Author’s calculations based on data presented on later sections of this report. 12 https://neweracolorado.org/updates/#495913 https://trends.collegeboard.org/student-aid/figures-tables/two-year-default-rates-sector-and-completion-status
14 http://www.edworkingpapers.com/sites/default/files/ai19-89.pdf, https://pubs.aeaweb.org/doi/pdfplus/10.1257/pol.2018027915 https://www.luminafoundation.org/resources/time-is-the-enemy16 Compared to data reported at: https://completecollege.org/17 https://completecollege.org/article/colorado-idaho-join-complete-college-americas-national-momentum-pathways-project/18 https://highered.colorado.gov/Publications/Reports/Enrollment/FY2018/2018_Concurrent_Enrollment_April_2019.pdf19 https://cew.georgetown.edu/cew-reports/americas-divided-recovery/20 Author’s calculation’s based on data available at: Bureau of Labor Statistics, U.S. Department of Labor, The Economics Daily, Unemployment rate 2.1 percent for college grads, 3.9 percent for high school grads in August 2018 on the Internet at https://www.bls.gov/ opub/ted/2018/unemployment-rate-2-1-percent-for-college-grads-3-9-percent-for-high-school-grads-in-august-2018.htm(visited July 01, 2019).21 https://www.ssa.gov/policy/docs/research-summaries/education-earnings.html22 https://www.ssa.gov/policy/docs/research-summaries/education-earnings.html23 https://www.air.org/resource/higher-education-pays-initial-earnings-graduates-colorado-s-colleges-and-universities24 https://launchmycareercolorado.org/25 https://www.luminafoundation.org/files/resources/its-not-just-the-money.pdf26 https://www.urban.org/sites/default/files/publication/99078/evaluating_the_return_on_investment_in_higher_education.pdf, https://trends.collegeboard.org/sites/default/files/education-pays-2016-full-report.pdf27 https://younginvincibles.org/wp-content/uploads/2018/11/LuminaFactsheets_Colorado_Workers.pdf28 Colorado Open Educational Resources Council Report: https://highered.colorado.gov/Publications/Reports/legislative/OER/OER_Nov2017.pdf29 COSI Outcomes Reports: https://sites.google.com/a/state.co.us/cosi/about#TOC-Program-Reports

Maximizing Value for Students and our State28 COLORADO RISES:
Appendix
Wage Match Rate by Credential Type and Program Grouping
Certificate Median wage outcome1-YEAR
Arts, Humanities and Communication
Business
Education
Health
Science, Technology, Engineering and Math
Social and Behavioral Sciences and Human Services
Trades
Median wage outcome5-YEAR
Median wage outcome10-YEAR
32%
42%
37%
44%
39%
45%
53%
35%
39%
37%
44%
37%
39%
52%
31%
37%
36%
43%
31%
32%
54%
Wage Match Rate for Graduates by Program
Statewide
Wage Match Rate by Credential Type and Program Grouping
Associate Median wage outcome1-YEAR
Arts, Humanities and Communication
Business
Education
Health
Science, Technology, Engineering and Math
Social and Behavioral Sciences and Human Services
Trades
Median wage outcome5-YEAR
Median wage outcome10-YEAR
39%
53%
42%
74%
54%
52%
57%
42%
50%
45%
68%
53%
45%
56%
40%
46%
57%
62%
50%
42%
58%
Statewide
Wage Match Rate by Credential Type and Program Grouping
Bachelor’s Median wage outcome1-YEAR
Arts, Humanities and Communication
Business
Education
Health
Science, Technology, Engineering and Math
Social and Behavioral Sciences and Human Services
Trades
Median wage outcome5-YEAR
Median wage outcome10-YEAR
44%
59%
59%
68%
49%
45%
54%
47%
61%
57%
63%
50%
48%
59%
42%
56%
47%
56%
48%
45%
56%
Statewide
46% 44%45%
51% 49%51%
50% 48%52%
The wage data does have limitations since not all graduates can be matched. Notably federal employees, self-employed individuals; and individuals working outside of the Colorado are not included in the Unemployment Insurance (UI) data used for these estimates. The number of graduates who were matched, the "Match Rate" is defined below. Please note that HB18-1226 defines this as the “employment rate”.

29COLORADO RISES: Maximizing Value for Students and our State
Completion of this inaugural report on the return on investment of postsecondary education would not have been possible without support from the Colorado General Assembly and the hard work of several employees at the Colorado Department of Higher Education, including (but not limited to):
Emma Fedorchuk, Budget and Finance Analyst
Lauren Gilliland, Lead Finance Analyst
Beth Hunter, Graphic Designer
Megan McDermott, Director of Communications
Dr. Chris Rasmussen, Director of Academic Affairs
Lindsay Sandoval, Communications and Social Media Strategist
Bradley Tugan, Data Analyst
Maggie Yang, Senior Director of Data Systems and Applications
Acknowledgements
For More InformationColorado Department of Higher Education https://highered.colorado.gov/
Colorado Rises: Advancing Education and Talent Development http://masterplan.highered.colorado.gov/
1600 BroadwaySuite 2200Denver, CO 80202
Main: (303) 862-3001


