See discussions, stats, and author profiles for this publication at: https://www.researchgate.net/publication/351936855 Colors and dyes of archaeological textiles from Tarapacá in the Atacama Desert (South Central Andes) Article in Heritage Science · May 2021 DOI: 10.1186/s40494-021-00538-9 CITATIONS 0 READS 5 8 authors, including: Some of the authors of this publication are also working on these related projects: Archaeometry at LAIA-Chile View project Colecciones, coleccionistas y objetos precolombinos de Atacama en el mundo View project Marcela Sepúlveda Pontificia Universidad Católica de Chile 102 PUBLICATIONS 871 CITATIONS SEE PROFILE Benjamin Ballester Université de Paris 1 Panthéon-Sorbonne 113 PUBLICATIONS 437 CITATIONS SEE PROFILE All content following this page was uploaded by Marcela Sepúlveda on 28 May 2021. The user has requested enhancement of the downloaded file.
Transcript
See discussions, stats, and author profiles for this publication at: https://www.researchgate.net/publication/351936855
Colors and dyes of archaeological textiles from Tarapacá in the Atacama
Desert (South Central Andes)
Article in Heritage Science · May 2021
DOI: 10.1186/s40494-021-00538-9
CITATIONS
0READS
5
8 authors, including:
Some of the authors of this publication are also working on these related projects:
Archaeometry at LAIA-Chile View project
Colecciones, coleccionistas y objetos precolombinos de Atacama en el mundo View project
Marcela Sepúlveda
Pontificia Universidad Católica de Chile
102 PUBLICATIONS 871 CITATIONS
SEE PROFILE
Benjamin Ballester
Université de Paris 1 Panthéon-Sorbonne
113 PUBLICATIONS 437 CITATIONS
SEE PROFILE
All content following this page was uploaded by Marcela Sepúlveda on 28 May 2021.
The user has requested enhancement of the downloaded file.
Sepúlveda et al. Herit Sci (2021) 9:59 https://doi.org/10.1186/s40494-021-00538-9
RESEARCH ARTICLE
Colors and dyes of archaeological textiles from Tarapacá in the Atacama Desert (South Central Andes)Marcela Sepúlveda1* , Cecilia Lemp Urzúa2, José Cárcamo‑Vega3, Edgar Casanova‑Gónzalez4, Sebastián Gutiérrez5, Miguel Ángel Maynez‑Rojas6, Benjamín Ballester3 and José Luis Ruvalcaba‑Sil6
Abstract
This work concerns the study of colors and dyes identified on archaeological textiles from the Atacama Desert. The different garments and ornaments come from the excavation of two important pre‑Columbian cemeteries of the Tarapacá region: Tarapacá‑40 attributed to the Formative period (1100 BC–660 AD) and Pica‑8 to the Late Intermedi‑ate period (900–1450 AD). For the first time, a multi‑analytical approach with non‑invasive techniques using FORS and SERS was applied on samples of less than 2 cm of length for physicochemical characterization of the raw materials and the dyes employed in the textile production of northern Chile. The fibers are from animal origin. Blue, green, and yellow are identified as indigo, but we cannot discard a mixture with other dyes to vary hue and shade; while carminic acid and alizarin—to a lesser extent—are found on red, orange, and brown samples. This research provides new ele‑ments for the discussion about the textile technology developed in this desertic region, its changes, and continuities along the history. Our results are compared to recent findings on neighboring regions from South‑Central Andes, to improve the current knowledge and discuss the existence of dyeing textile cultural traditions.
IntroductionIn South America, Andean textiles are recognized as a major art of the pre-Columbian societies that inhab-ited these territories. This tradition is still preserved and stands out for the variety of techniques and materials employed, their rich iconography and their wide chro-matic palette visible from the first archaeological textiles testimonies. In the words of John Murra, an important Andean scholar: “No political, military, social, or reli-gious event was complete without textiles being volun-teered or bestowed, burned, exchanged, or sacrificed” [1]. And even if Murra is referring in this case to the Inca State, from the 14th to sixteenth centuries, we can easily
imagine a similar situation in previous periods. Textile testimonies are exhibited in famous museums around the world, acting as evidence of the great achievement of textile artisans. For their production, they used differ-ent types of fibers (animal, vegetal and human hair) spun, and weave with a variety of structural techniques, using naturally colored threads or others painted and dyed, with eventual decorations made of beads, colored min-erals, metals, and feathers. The textile craft in the Andes involved the gradual development of a technological sys-tem, which began in the Late Pleistocene [2]. The use of dyes also evidences a long historic tradition, as recently proven by the identification of indigo on 5000-year-old textiles, the oldest record of the use of this type of dye in the world so far [3].
Today, the techniques, materials and polychromy recognized on certain objects raise textile produc-tion to a prominent position among the handcrafts of
Open Access
*Correspondence: [email protected] Escuela de Antropología, Pontificia Universidad Católica de Chile, Chile & UMR 8096 (CNRS‑Paris 1), Francia. Av. Vicuña Mackenna 4860, Macul, ChileFull list of author information is available at the end of the article
Page 2 of 21Sepúlveda et al. Herit Sci (2021) 9:59
pre-Columbian Andean communities [1, 4–10]. The knowledge related to the acquisition of the diverse raw materials, the weaving and structure of textiles, as well as the mathematical logic applied to the elaboration of the textile is widely recognized [11, 12]. The chromatic attributes have also attracted great interest since it has been demonstrated that numerous plants and insects were used and prepared to achieve the wide color palette observed in textile dyeing [1, 13–22].
Textile manufacture involves several technological pro-cedures related, on one side, with the procurement of the fibers and the preparation of the yarns, made from animal (mainly camelids and other mammals in a minor proportion), plants (cotton, totora and junquillo, among others) or human hair, which will become part of the tex-tile structure (warp and weft). Such procedures are also related to the incorporation or application of color on yarns, to accomplish the design of the textiles. Color was incorporated through dyeing or painting, using organic dyestuffs or mineral pigments, collected, and prepared using other compounds that served as mordants or post-mordants, for ensuring a better adherence of the color on the fibers [9, 10, 19, 20]. A third element are the skills associated with the weaving or the construction of the textile [5, 23–25]. Moreover, the incorporation of sym-bols or figures through color constitute a true semiotic device. The final form of the textiles, as well as the choice of colors, the logics that shape the design, figures and elements elaborated on each textile, contribute to defin-ing diverse styles and manufacturing traditions, often related to socio-cultural distinctions of status, gender or role, as well as ethnic or cultural identities, among others [26–35].
In the Andes, the color in archaeological textiles have been interpreted in terms of the prestige and power of certain social entities, but also as an expression of gen-der identity [1, 29, 36–43]. However, until now the color materiality is poorly understood, i.e., regarding the mate-rials and immaterial knowledges involved in the making of textiles. The interpretation of their materiality requires an interdisciplinary approach and the implementation of various analytical techniques.
A review of the available published literature shows that analytical studies applied to historic Andean tex-tiles are still scarce [3, 44–73], more so for colonial and republican periods [47]. For the pre-Columbian period, studies usually involve the analysis of a few samples, commonly reds or blues, with little information about other colors or shade variations [3, 48–55, 57–67, 70]. Further colors like yellow, green, white, or brown are less studied [49, 50, 53, 56, 64, 66, 67, 69, 70]. Only a few of them have widened the analyses of the dyes and focused on the mordants [50, 51, 54, 67, 68, 70]. Some
investigations have approached the painted textiles, a rarely addressed subject [71, 72]. From an analytical perspective, they applied chromatographic or spectro-metric techniques including gas chromatography-mass spectrometry (GC–MS), high-performance liquid chro-matography with diode array detectors (HPLC–DAD) and/or mass spectrometry (HPLC–MS), direct analy-sis in real time mass spectrometry (DART-MS), which albeit sensitive are destructive methods [3, 48–50, 53, 54, 56–60, 62–64, 66, 70]. Analysis by surface-enhanced Raman spectroscopy (SERS) was applied in just five publications to analyze archaeological textiles from Peru and northern Chile [55, 61, 65, 69, 73]. Finally, the available literature shows a particular emphasis on the analysis of polychrome textiles from the Paracas and Nazca cultures (700 BC–800AD), on South—Central Perú [51–53, 59–61, 66, 67, 70]. For northern Chile, only three studies have been published addressing the physicochemical analysis of textile dyes: one related to textiles from San Pedro de Atacama, almost 500 km to the south of our study region, and the others for Arica, 270 km to the north [63, 69, 73]. Other results were just announced at a conference and are still unpublished [55]. In general, those studies and others have dem-onstrated the use of indigo from plants of the genera Indigofera spp., between others, for the blue shades, car-minic acid obtained from cochineal (Dactylopius coccus coccus), purpurin and alizarin from plants of the Rubi-aceae family (Galium spp. or Rebulnium spp.) for the reds and other plants mixed in complex recipes with several dyes and mordants to obtain other colors and tones [13–22, 55, 67, 74, 75].
The identification of the fibers and the colorant raw materials used for dyeing constitutes one of the ways for achieving a better understanding of textile technol-ogy and production [10, 51, 66–68, 70]. Although several analyses are available, more knowledge of the techno-logical processes involved can be reached through the combination of multiple analytical techniques. HPLC and other chromatographic techniques are preferred for the identification of textile dyes [74, 76–78], but every textile garment or ornament is unique; hence we must prioritize the use of non-destructive or micro-analytical techniques. In sum, we present the analysis of dyed fibers from different textiles from the Atacama Desert in north-ern Chile, specifically from the Tarapacá region (Fig. 1). Each sample was first observed by optical microscopy. The fibers were identified by Fourier-transform infra-red spectroscopy (FTIR). Then colorimetry was used for preliminary identification of colors. Finally, dye iden-tifications were performed by fiber-optics reflectance spectroscopy (FORS) and surface-enhanced raman spec-troscopy (SERS).
Page 3 of 21Sepúlveda et al. Herit Sci (2021) 9:59
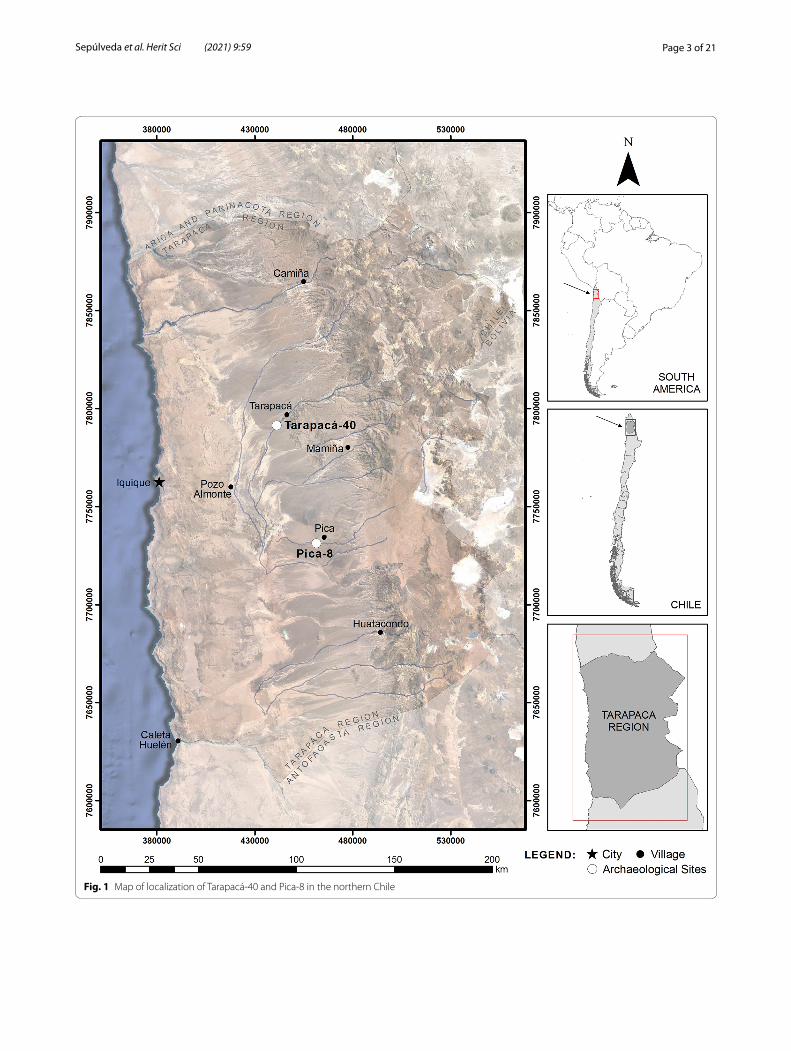
Fig. 1 Map of localization of Tarapacá‑40 and Pica‑8 in the northern Chile
Page 4 of 21Sepúlveda et al. Herit Sci (2021) 9:59
Materials and methodsArchaeological samplesThe analyzed textiles belong to two important cemeter-ies from the Tarapacá region, ascribed to two different periods of the pre-Columbian chronological sequence of the Atacama Desert in northern Chile: Tarapacá-40 and Pica-8 (Fig. 1).
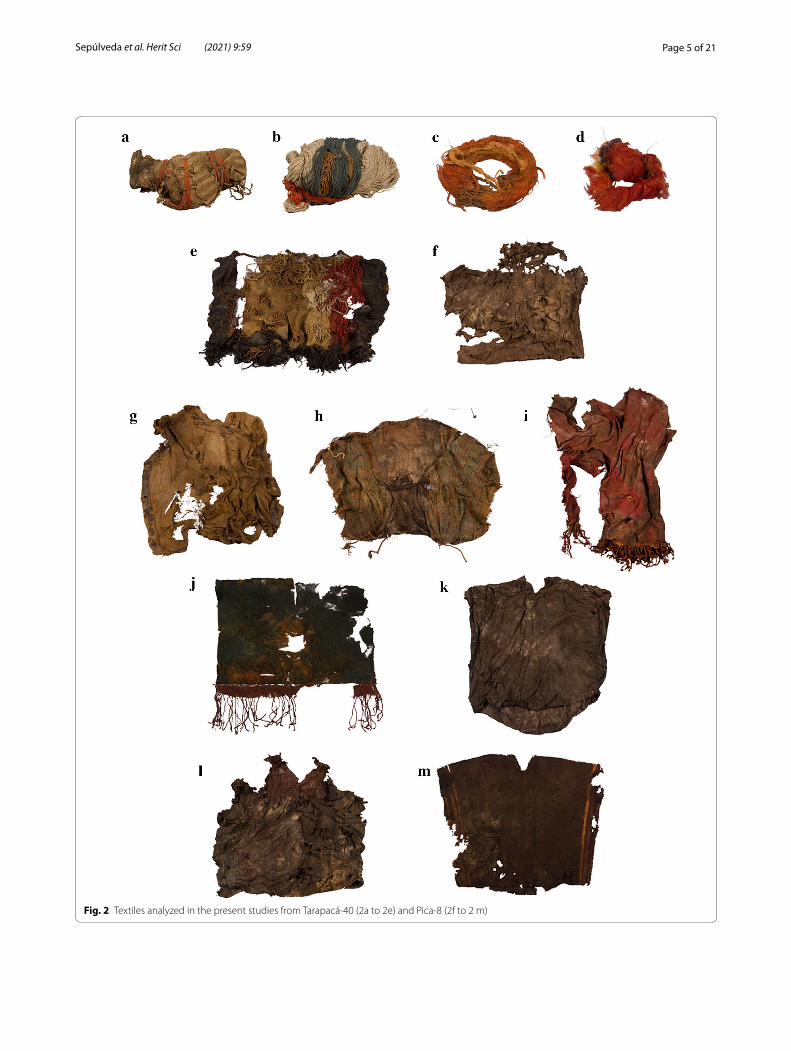
Tarapacá-40 is located in the desert, about 60 km from the Pacific coast; the site corresponds to an exten-sive cemetery, placed at the north slope of the Tarapacá ravine (Fig. 1). Excavations began in the 1960s and con-tinued until the 2000s [79–83], and now its collections are deposited in different institutions (museums and universities) throughout the country [84]. 14C-AMS dat-ing of different burial contexts from the site allowed proposing it was occupied during the Formative period (ca. 1.110–1.100 B.C.- 410–550 A.D.) [26, 83]. The cem-etery’s configuration is associated with the occupation of its contemporary village Caserones-1, composed of more than 350 structures [81, 82, 85, 86]. This period is char-acterized by the consolidation of the villages with more sedentary dwellers and a food-producing economy [87]. Previous textiles studies from Tarapacá-40 have focused on the collections available on museums from northern Chile [26, 41, 79]. In the present study, a total of 163 tex-tiles from this cemetery were considered: five samples were taken from five textiles, including two blankets, two headdresses, and a bracelet (Fig. 2a–e; Table 1).
Pica-8 is a vast cemetery located in the Pica oasis, at the south from Tarapacá valley and 90 km from the Pacific coast (Fig. 1). The site was excavated in the 1960s [88–91], and as in the case of Tarapacá-40, the collections are also dispersed in several institutions [84]. Dating studies placed the occupation in the Late Intermediate Period (ca. 769–969 to 1301–1414 A.D. [92]. Pica-8 belongs to the Pica-Tarapacá cultural complex, a set of commu-nities settled in the driest area of the Atacama Desert, which for living exploited several resources from other ecological regions and at the same time articulated the exchange of resources with other neighboring cultural traditions. Deep social differences and inequalities, with a higher economic specialization, are characteristics of this considered society of the Late Intermediate period [91]. Textile analyses from this same cemetery were also previously published [28, 93]. During our project, a group of 258 textiles were considered, and a total of 17 sam-ples were collected from eight textiles (Fig. 2f–m). The textile pieces correspond to seven tunics and a loincloth (Table 1).
Sampling was performed at the Collection Deposit of the Anthropology Department of Universidad de Chile after a process of dry cleaning and repackaging in new boxes to replace previous and original plastic bags from
the excavation. The study included a material-technical analysis and an assessment of their state of conservation, which in turn contributed to the identification of func-tional and typological characteristics. The first descrip-tion of textiles fibers, techniques and colors was carried out. Colors were preliminarily reported using the Mun-sell Table. Quantitative colorimetric measurements were also performed with a CR-10 colorimeter (Konica Minolta) to complete the Munsell description. Sam-ples consist of a textile fiber fragment of less than 2 cm of length. At the laboratory, optical microscopy analyses were performed using a B-600TiFL microscope (Optika) to acquire morphological information of the yarns and fibers of the archaeological textiles, the state of conser-vation, the color and possible salt adhered coming from the sand and the original archaeological context (Fig. 3). Infrared reflectance spectra of the archaeological textiles were preliminarily acquired using a Bruker Alpha FTIR spectrometer equipped with an external attenuated total reflection module (ATR-FTIR) to confirm the origin of the fiber before FORS and SERS analysis.
Fiber‑optics reflectance spectroscopyA portable FieldSpect-4 (ASD Inc., Colorado, USA) available at LANCIC Laboratory in Mexico was used to acquire visible, NIR and shortwave near-infrared (SWNIR) reflectance and absorbance (log[1/R]) spec-tra. This technique is not available in Chile until now. A non-contact probe was used, which is placed at 8 cm from the sample. A D65 illuminant provides illumination over the whole spectral range. The analysis area is about 3 mm in diameter and spectra were obtained with a 0.2 s integration time. In absorbance mode, data is processed with the Kubelka–Munk theory [94, 95]. Calibration was performed using a certified reflectance standard (AS-02035-000CSTM-SRM-990–362, ASD Inc).
For analysis purposes, the visible and NIR regions are presented together in a zone named visible-near infrared (VNIR). VNIR ranges from 300 to 1000 nm and SWNIR ranges from 1000 to 2500 nm. Inflection points in all spectra were determined using the first derivative of the spectrum, generated using the Origin Software (Origin-Lab Corporation, Northampton, USA).
SERS analysisA washing protocol was developed to avoid particles adhered to the surface of the fiber from interfering with the dye-substrate interaction during SERS analysis. Textile samples of approximately 5 mm were placed in vials containing 0.01% v/v solutions of Triton™ X-100, a mild non-ionic detergent, and then stirred in a vortex. After washing, the samples were repeatedly rinsed with water under vortex stirring to remove the detergent. The
Page 5 of 21Sepúlveda et al. Herit Sci (2021) 9:59
Fig. 2 Textiles analyzed in the present studies from Tarapacá‑40 (2a to 2e) and Pica‑8 (2f to 2 m)
Page 6 of 21Sepúlveda et al. Herit Sci (2021) 9:59
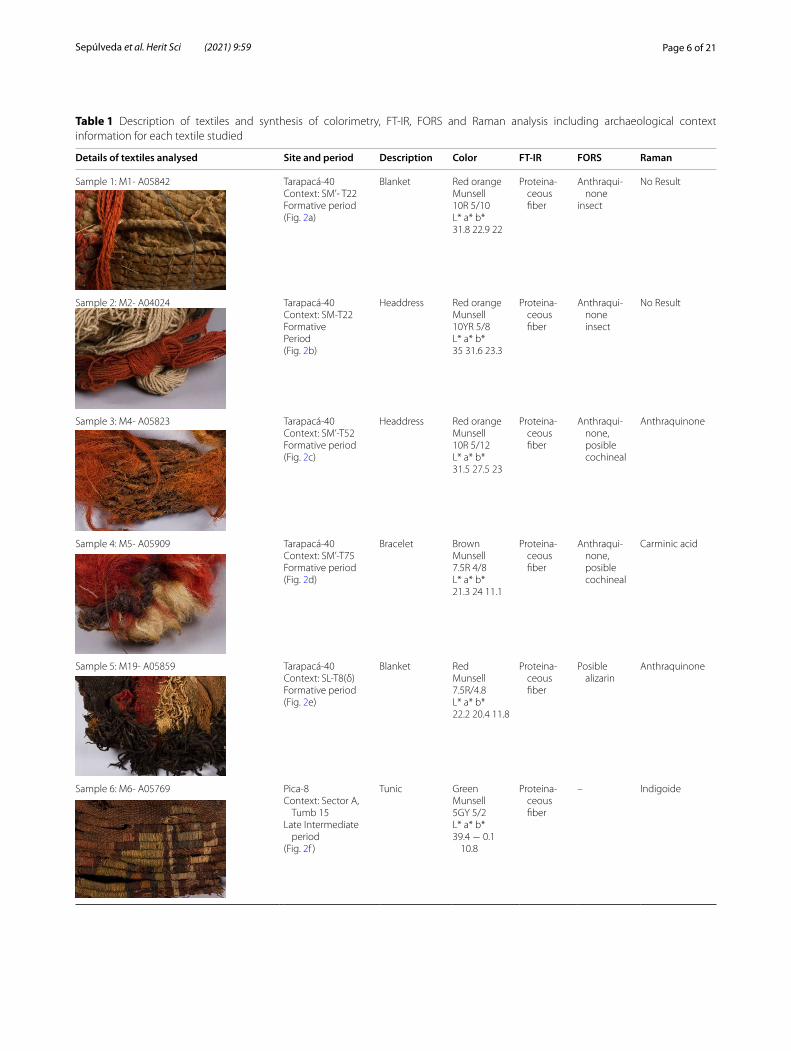
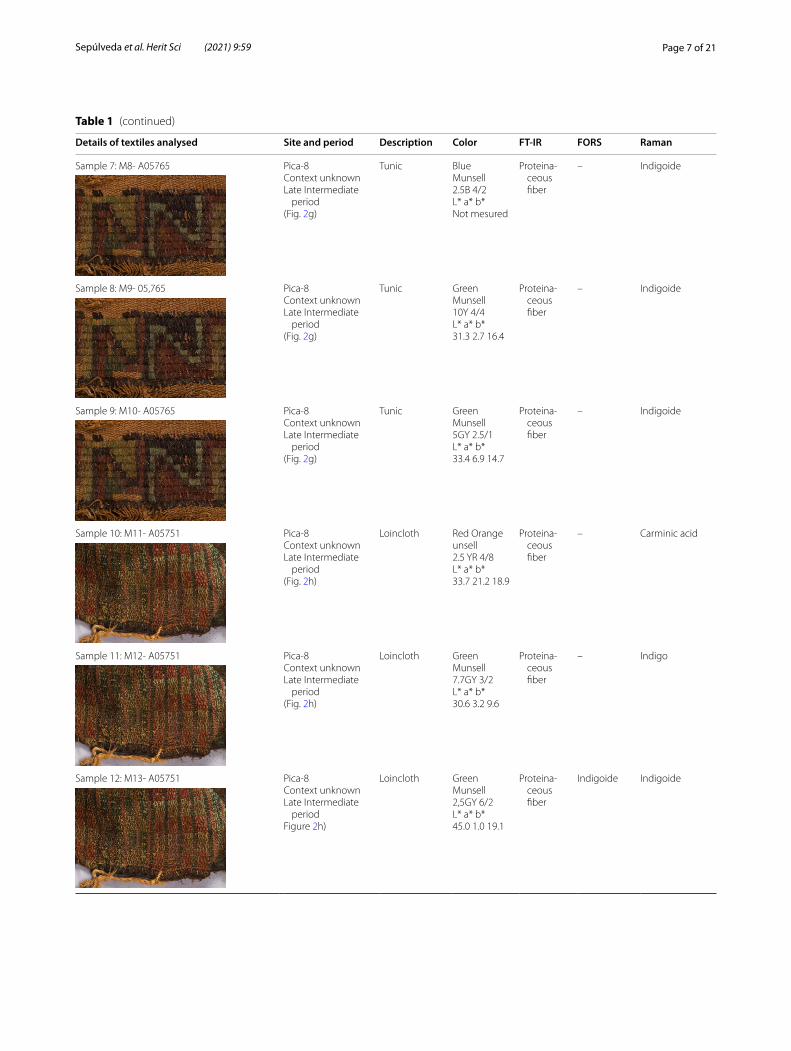
Table 1 Description of textiles and synthesis of colorimetry, FT‑IR, FORS and Raman analysis including archaeological context information for each textile studied
Details of textiles analysed Site and period Description Color FT‑IR FORS Raman
Page 9 of 21Sepúlveda et al. Herit Sci (2021) 9:59
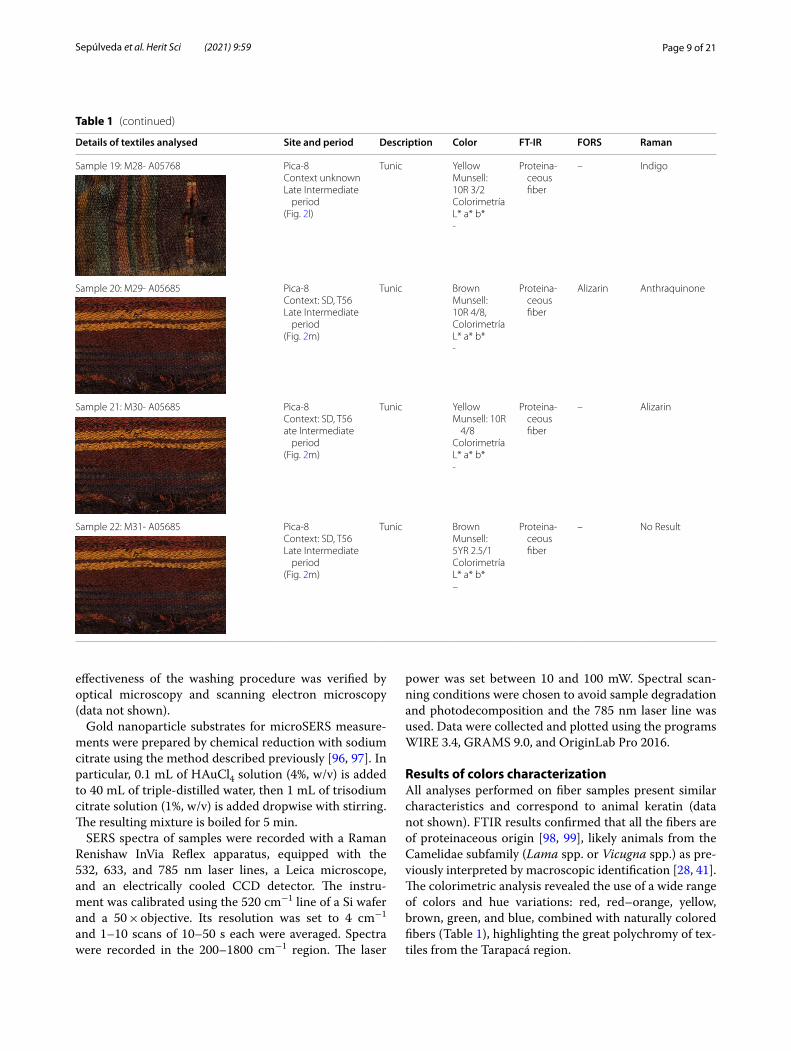
effectiveness of the washing procedure was verified by optical microscopy and scanning electron microscopy (data not shown).
Gold nanoparticle substrates for microSERS measure-ments were prepared by chemical reduction with sodium citrate using the method described previously [96, 97]. In particular, 0.1 mL of HAuCl4 solution (4%, w/v) is added to 40 mL of triple-distilled water, then 1 mL of trisodium citrate solution (1%, w/v) is added dropwise with stirring. The resulting mixture is boiled for 5 min.
SERS spectra of samples were recorded with a Raman Renishaw InVia Reflex apparatus, equipped with the 532, 633, and 785 nm laser lines, a Leica microscope, and an electrically cooled CCD detector. The instru-ment was calibrated using the 520 cm−1 line of a Si wafer and a 50 × objective. Its resolution was set to 4 cm−1 and 1–10 scans of 10–50 s each were averaged. Spectra were recorded in the 200–1800 cm−1 region. The laser
power was set between 10 and 100 mW. Spectral scan-ning conditions were chosen to avoid sample degradation and photodecomposition and the 785 nm laser line was used. Data were collected and plotted using the programs WIRE 3.4, GRAMS 9.0, and OriginLab Pro 2016.
Results of colors characterizationAll analyses performed on fiber samples present similar characteristics and correspond to animal keratin (data not shown). FTIR results confirmed that all the fibers are of proteinaceous origin [98, 99], likely animals from the Camelidae subfamily (Lama spp. or Vicugna spp.) as pre-viously interpreted by macroscopic identification [28, 41]. The colorimetric analysis revealed the use of a wide range of colors and hue variations: red, red–orange, yellow, brown, green, and blue, combined with naturally colored fibers (Table 1), highlighting the great polychromy of tex-tiles from the Tarapacá region.
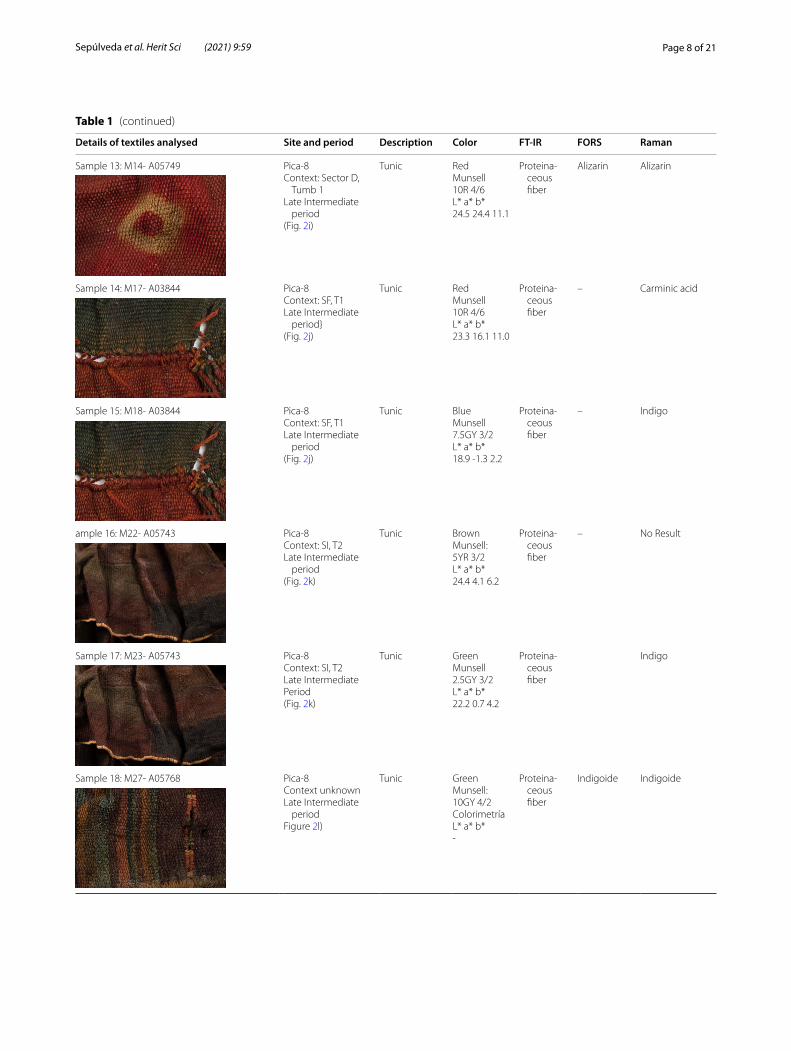
Table 1 (continued)
Details of textiles analysed Site and period Description Color FT‑IR FORS Raman
Sample 19: M28‑ A05768
Pica‑8Context unknownLate Intermediate
period(Fig. 2l)
Tunic YellowMunsell:10R 3/2ColorimetríaL* a* b*‑
Proteina‑ceous fiber
– Indigo
Sample 20: M29‑ A05685
Pica‑8Context: SD, T56Late Intermediate
period(Fig. 2m)
Tunic BrownMunsell:10R 4/8,ColorimetríaL* a* b*‑
Proteina‑ceous fiber
Alizarin Anthraquinone
Sample 21: M30‑ A05685
Pica‑8Context: SD, T56ate Intermediate
period(Fig. 2m)
Tunic YellowMunsell: 10R
4/8ColorimetríaL* a* b*‑
Proteina‑ceous fiber
– Alizarin
Sample 22: M31‑ A05685
Pica‑8Context: SD, T56Late Intermediate
period(Fig. 2m)
Tunic BrownMunsell:5YR 2.5/1ColorimetríaL* a* b*–
Proteina‑ceous fiber
– No Result
Page 10 of 21Sepúlveda et al. Herit Sci (2021) 9:59
FORS analysis of the fibers suggested the presence of anthraquinones of both vegetal and animal origin for the red fibers, as well as indigo on the green ones. The FORS spectral features of alizarin and cochineal, among other red dyes, have been previously reported [100–103]. Alizarin and other similar red dyes from vegetable origin show apparent absorption maxima at 505–510 and 540 nm, while for cochineal those are red shifted towards 520–525 and 555–560 nm, leading to differentiating both anthraquinones (Fig. 4a, b). In our case, those apparent absorbance maxima are barely present on the spectra of the red samples, probably due to the combination of two factors: the degradation of the dye over time and the small sample size. The non-contact FORS probe used has an analysis area of 3 mm in diameter and the fibers studied are only about 1 mm thick, hence, part of the signal acquired originated on the sample support, instead of the fiber itself. How-ever, the first derivative of the reflectance has proven to be more sensitive for the identification of madder and cochineal-based dyes [100], due to the presence of inflection points at 496–503 nm and 533–545 nm for cochineal, while for alizarin they are at 486–490 nm and 520–524 nm. Although we are only referring to alizarin, it is worth pointing out that purpurin is often found in the same vegetable sources and the FORS spectra of both dyes are similar [103]. Therefore, by this analytical technique we would only be able to dis-tinguish plant-based anthraquinone dyestuffs from the anthraquinones with animal origin.
With the information from the reflectance and the first derivative spectra, it can be suggested that cochineal was used to dye the Samples 1 and 2, while a plant from the genus Galium spp. or Relbunium spp. is the source of the plant-based dye present on Sample 4 (Fig. 4a, b, respec-tively; Table 1). However, other animal-based anth-raquinone dyes, such as kermes or Armenian cochineal, cannot be discriminated from the American cochineal by FORS alone [102, 103] and the assumption that the ani-mal-based anthraquinone dye found on the analyzed fib-ers is in fact cochineal is supported by historical context, since this is the only red anthraquinone of animal origin found on previous studies on the Andean area for pre-Columbian collections [15, 17, 18, 21] and that was still used during colonial times [105, 106].
In the case of the green samples (Samples 12 and 18), FORS results suggest the presence of indigo (Fig. 4c), from the apparent absorption maxima at 648 nm and the inflection point at 717 nm, in agreement with the spectra of indigo references and the results of FORS analysis of Mexican codices [107] and polychrome ceilings [108].
SERS has proven to be a powerful technique for the analysis of colorants in textiles [61, 65, 109–113]. Most of these works used silver nanoparticles, while gold nanoparticles are equally useful [114, 115]. In our analyses, the best results were obtained using gold nanoparticles and a 785 nm excitation laser. The optical microscopy images of the fibers, covered with nanoparticles and later dried, showed that the tex-tile samples have an adherence to the nanoparticles
Fig. 3 Details of fibers samples analyzed: a Sample 4; b Sample 5; c Sample 7; d Sample 8; e Sample 10; f Sample 13; g Sample 19; h Sample 20
Page 11 of 21Sepúlveda et al. Herit Sci (2021) 9:59
as previously described [112]. In our case, using fibers already washed with Triton™ X-100, we observed areas with agglomerates of the nanoparticles, while others showed a thin and uniform layer of AuNPs. The latter led to better-defined spectra, with a high signal-to-noise ratio, while photodegradation was avoided.
Alizarin, carminic acid and indigo were identified on the samples (Table 1). In the case of alizarin, Cañamares and collaborators carried out a complete theoretical analysis and SERS experiments [116], while the results reported by Chen and co-authors were registered after the extrac-tion of the dye from the textile by acid hydrolysis [110]. In our case, the spectra were acquired directly from the dye adhered to the fiber.
The SERS measurement obtained for Sample 13 (Fig. 5a) shows a complex spectrum of the dye-mordant-fiber (DMF) molecular system where groups of bands are con-sistent with signals reported for alizarin [117, 118]. The SERS spectra provide additional information regarding shifts in wavenumbers, changes on their relative intensi-ties are fundamentally the presence of new bands that can-not be observed when analyzing isolated molecules. These spectral features may be related to a certain arrangement and orientation of the dyes due to the interaction between NPs/fibers or NPs/dyed fibers. According to SERS selec-tion rules, the intensity increases or decreases when the αzz component of the polarizability of the analyzed vibra-tional mode is parallel or perpendicular to the excitation beam, respectively. Band shifts are related to the electronic redistribution in the vicinity of the atoms involved in the interaction. This concept supports the chemical or charge transfer contribution to the mechanism of enhancement of the Raman signals [119].
The spectral changes discussed above are present in the spectrum of Fig. 5a (see spectra (a) in Additional file 1: Appendix A). The weak band around 1647 cm−1 can be attributed to the coupled υCO/υCC vibrational modes. The coupled vibrational mode ipδCH3/ipδCOH/υCC is observed at 1475 cm−1 as a shoulder and with medium intensity, although it has been described before as a high-intensity mode [116, 117]. This difference may be because this molecular moiety is vibrating inclined in relation to the surface.
A commonly reported high-intensity characteris-tic band is present at 1258 cm−1 [120, 121]. It is associ-ated with coupled υ(CO)/υ(CC)/δ(CCC) modes and is included among a group of high-intensity bands in the 1460—1200 cm−1 interval. The signal at 1078 cm−1, attributed to a CC stretching in proteins, is not reported
for alizarin [116–118]. Owing to our experience in the vibrational analysis of proteins and according to the liter-ature [122–125], this band may be related to the protein structure of the animal fiber. Vibrations of the peptide backbone in proteins are usually associated with three main regions of the Raman spectrum [126]. We expect to find the vibrations of the backbone skeletal stretch region at 870–1150 cm−1, which arose from the Cα-C, Cα-Cβ, and Cα-N stretching coordinates. The extended amide III region, expected at 1230–1340 cm−1, is mainly involved in the in-phase combination of the N–H in-plane deformation with the Cα-N stretch, with mixing among the N–H and the Cα-H deformations. Finally, the C = O stretch gives rise to the amide I region in the range of ~ 1630–1700 cm−1 [126]. In our case, some amino acid bands were also observed in the spectrum of the DMF complex, as is the case for the proline bands at 956 or 858 cm−1. A complete vibrational assignment is given in Table 2.
The SERS vibrational analysis of carminic acid was per-formed based on our own SERS data and those reported for the pure dye, isolated from cultural heritage samples or as part of a more complex molecular system [116, 118, 127]. As in the case of alizarin, Cañamares et al. car-ried out a complete theoretical and experimental analy-sis using analytical grade carminic acid [116], while the results published by Pozzi et al. account for the effect of sample pretreatment with vapours of hydrofluoric acid, before the SERS analysis [111].
Cochineal was identified in Sample 4 and its SERS spec-tra (Fig. 5b) show bands of both carminic acid and pro-tein [116, 118, 127] (see spectra (b) in Additional file 1: Appendix A). The intense band at 1582 cm−1 is attributed to υCC of an aromatic ring, while Cañamares et al. found this band to be of medium intensity and assigned it to a coupled υ(CC)/δ(COH)/δ(CH) mode. As discussed for alizarin, the differences in the intensity may be related to the orientation of this vibrational mode, parallel to the excitation beam. It is also described that this signal is accompanied by the bands at 1472 and 1322 cm−1, asso-ciated with modes ipδCH3/ipδCOH/υCC and δCOH/δCC, respectively. The band at 1322 cm−1 is particularly interesting since it has been reported as a strong band by Garrido et al. [128], while Cañamares and collabora-tors reported it as a medium intensity band [116]. In both cases is broadband that encloses a group of bands in the 1380–1300 cm−1 interval. Moreover, this band could be influenced by the amide III vibration described for proteins [123, 124]. Bands near 1397, 1076, 956 and
(See figure on next page.)Fig. 4 FORS spectrum: a Sample 1: anthraquinone, b Sample 13: anthraquinone, and c Sample18: indigo
Page 12 of 21Sepúlveda et al. Herit Sci (2021) 9:59
Page 13 of 21Sepúlveda et al. Herit Sci (2021) 9:59
858 cm−1 suggest the presence of the proteinic structure of the animal fiber, as reported before by our group in the study of isolated proteins or as part of a complex matrix [122–124]. Other bands that can be attributed to the dye are located at 505 and 456 cm−1. A complete vibrational assignment is given in Table 2.
In some cases, we were not able to differentiate aliza-rin from carminic acid, because a band group can be present in the spectral region 1200—1600 associated to anthraquinone structure present in both molecules [116]. This overlapping of the spectrum can be associated with changes in pH and the similarity of both dyes’ structures.
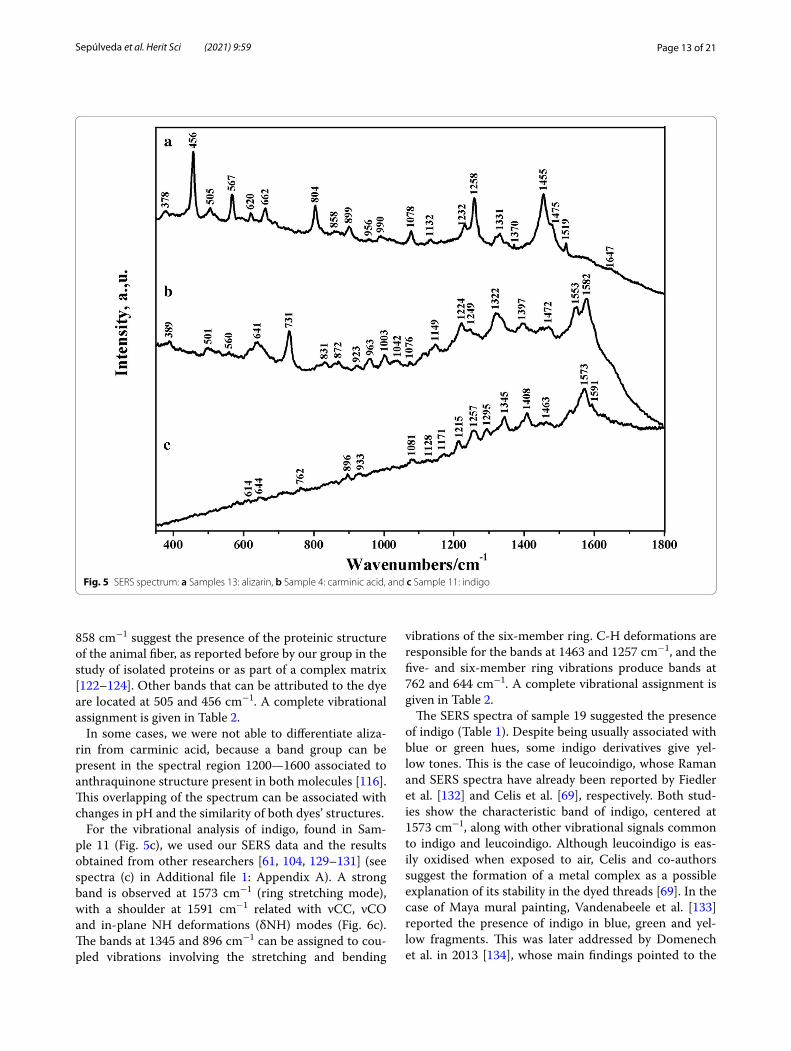
For the vibrational analysis of indigo, found in Sam-ple 11 (Fig. 5c), we used our SERS data and the results obtained from other researchers [61, 104, 129–131] (see spectra (c) in Additional file 1: Appendix A). A strong band is observed at 1573 cm−1 (ring stretching mode), with a shoulder at 1591 cm−1 related with νCC, νCO and in-plane NH deformations (δNH) modes (Fig. 6c). The bands at 1345 and 896 cm−1 can be assigned to cou-pled vibrations involving the stretching and bending
vibrations of the six-member ring. C-H deformations are responsible for the bands at 1463 and 1257 cm−1, and the five- and six-member ring vibrations produce bands at 762 and 644 cm−1. A complete vibrational assignment is given in Table 2.
The SERS spectra of sample 19 suggested the presence of indigo (Table 1). Despite being usually associated with blue or green hues, some indigo derivatives give yel-low tones. This is the case of leucoindigo, whose Raman and SERS spectra have already been reported by Fiedler et al. [132] and Celis et al. [69], respectively. Both stud-ies show the characteristic band of indigo, centered at 1573 cm−1, along with other vibrational signals common to indigo and leucoindigo. Although leucoindigo is eas-ily oxidised when exposed to air, Celis and co-authors suggest the formation of a metal complex as a possible explanation of its stability in the dyed threads [69]. In the case of Maya mural painting, Vandenabeele et al. [133] reported the presence of indigo in blue, green and yel-low fragments. This was later addressed by Domenech et al. in 2013 [134], whose main findings pointed to the
Fig. 5 SERS spectrum: a Samples 13: alizarin, b Sample 4: carminic acid, and c Sample 11: indigo
Page 14 of 21Sepúlveda et al. Herit Sci (2021) 9:59
presence of dehydroindigo, another yellow derivative of indigo. Recently, the same group revisited the subject and discussed evidence that supports their previous results [135].
DiscussionAll colors identified in our study suffered numerous alterations during the years, which undoubtedly modi-fied their original hue and shade. The variation in shade, saturation, and shine in the same and/or different yarn can also be related to the degradation of the dye, since all the analyzed textiles belong to burial contexts (Table 1), where they were used as mortuary clothing and/or deposited as burial offerings. Several variations on the shade (Sample 22) and color saturation for a single yarn (Sample 10) can be attributed to changes that took place after the chemical interaction of the dye with the body fluids, during the decomposition of the buried individual. However, we cannot rule out the occurrence of different initial preparations for dyeing, associated with the use of varied aqueous media and/or the inclusion of mordants looking for better fixation of the color on the fibers [10, 54, 66–68, 70]. Thus, the observed differences can be the consequence of technological factors inherent to the dye-ing process (fermentation time, length of the exposure of the yarn to the mordants, temperature and humidity during the process, among others), which yield numerous alternatives and combinations amid them, as well as pro-voked by external agents and factors following the use of the textiles as burial offerings.
We were able to demonstrate the usefulness and expe-ditiousness of the simultaneous application of different analytical techniques to the study of Andean textiles. FORS was just recently applied to textiles from this region [65] but has proven very suitable for preliminary characterization of the dyes if the proper references are available. In our case, the analysis was hampered by the fact that they were performed on small fragments of the dyed fibers, after sampling. When possible, it is always advisable to carry out the FORS measurements directly on the textile, using the non-contact probe. In this way, one may take advantage of both the portability and non-destructive character of the technique and acquire mul-tiple spectra from different areas of the same textile, looking for more precise identification of the dyes pre-sent. On the contrary, SERS is a potent tool for the char-acterization of textile dyes on small fragments of fibers and with relatively short analysis times, for a big num-ber of samples. At this stage, we decided not to pursue the identification of mordants, in part, due to a cleaning and fumigation protocol applied to the textiles in 2015, which could interfere with the results. Also as indi-cated by Wallert and Boytner, soil and body remain can
contaminate textile, and results obtained by elemental analysis for example can be ambiguous [54].
In general terms, FORS and SERS allowed the identi-fication of red, orange, yellow, blue, and green dyes. For a set of samples, the identification of alizarin using both techniques were very precise, while for others, although the FORS signals are very weak, it was possible to iden-tify the presence of alizarin or carminic acid (Table 1:
Table 2 SERS bands (cm−1) in the range 350–1800 cm−1 of alizarin, carminic acid and indigo identified in Samples 13, 4 and 11, respectively and the most probable bands assignment
Band description: w weak, vw very weak, m medium, mw medium weak, s strong, vs very strong. str.. stretching, def., deformation, ip in plane, op out plane, breath. breathing, skel. Skeletal, ring6 six-member rings, ring5 five-member rings, prot. protein, sh shoulder, Pro proline, Phe phenylalanine
Vibrational modes description: ν stretching, δ in the plane bending, γ out plane bending, ρ rocking, τ torsion
Page 15 of 21Sepúlveda et al. Herit Sci (2021) 9:59
Samples 3 and 20). For this second group of samples, the dyes identification by SERS is troublesome, due to the complexity of the spectra acquired. Some of the SERS bands observed can be assigned to alizarin or carminic acid, indistinctly, as opposed to FORS. However, the observed bands are characteristic of anthraquinones, the common molecular structure of both alizarin and car-minic acid (Table 1: Sample 4).
Our colorimetric, FORS and SERS results show that the different colors and their shade variations can be achieved from natural extracts, both from animal and vegetal origin. For the reds and its varied shades, includ-ing a few orange and brown fibers, we detected the use of anthraquinones from animal origin, carminic acid, from an extract of the cochineal insect (Dactylopius coccus coccus), as well as alizarin, commonly found on the roots of a plant from the family of Rubiaceae, Galium spp. or Relbunium spp., depending on the taxonomic classifica-tion, used [14, 18, 21, 66]. In the blue, green and one yel-low (Sample 19) samples, we found indigo or indigo-like molecules, known as indigoids, obtained from indigo- producing plants [13, 16, 18, 21, 66]. However, we cannot discard that other dyes were mixed with indigo to modify hue and shade as observed in Paracas textiles [53, 66].
Finally, the results reached for textiles from the Tara-pacá region associated with the Formative period allowed detecting the use of carminic acid and alizarin, dyestuffs that will continue to be used during Later Intermediate period (Table 1). In chronological terms, it is interesting to confirm that the same dye technology was preserved for almost 2400 years. It is also interesting to observe that the same colorants can be used for different types of textile garments and ornaments. When comparing our results with previous molecular identification of red dyes in neighboring regions, we found that in the north in southern Peru purpurin from a plant from Relbunium species and carminic acid from cochineal were reported for the Late Intermediate period (1000–1450 A.D.) [54]. The use of cochineal (carminic acid) was also recently reported in Formative textiles from Arica locality to the north of Tarapacá region studied, but without more pre-cision to archaeological context [73]; while only purpu-rin was identified at San Pedro de Atacama to the eastern south, for the Middle (600–1000 A.D.) and Late Interme-diate periods (1000–1450 A.D.) [63]. In the case of the Tarapacá region, only alizarin and carminic acid have been continuously used for a long time. If this can be confirmed we could identify some specific and different knowledge concerning the dye manufacturing process and dyeing cultural tradition, as each region demon-strates the use of different dye molecules (carminic acid, alizarin and purpurin) probably from different plant origins.
The local origin of dyeing plantsNiemeyer and Agüero [63] suggested that the Relbunium spp. found in the San Pedro de Atacama textiles came from northweast Argentina, based on the strong trade relationship between the localities in the area. Never-theless, the authors did not consider the possibility that the raw materials may also have its origin on the Pacific coast, where specimens of R. corymbosum have been reg-istered, locally identified as G. corybosum [21, 136–138], as well as other Galium species, principally G. corymbo-sum and G. aparine (distributed along the whole coast-line of northern Chile), G. diffusoramosum (Taltal) and G. hypocarpium (Paposo) [137–145].
In relation to indigo, for its part, the main sources in South America are plants from the genus Indigofera (Fabaceae), Eupatorium (Asteraceae) and Yangua (Bigno-niaceae), of which only the first two are found near our study area [21]. Although Indigofera species are typically found in Perú and Northwestern of Argentina [21, 146], there are also records of I. suffruticosa specimens in the Azapa Valley, near Arica, as well as in the Chaca area on the Vitor ravine, to the north of Tarapacá region [147, 148]. Specimens of I. truxillensis have also been found in regions north of Arica, and Tarapacá [140, 149]. Mean-while, the only native Eupatorium species in the Atacama Desert are E. glechonophyla (also known as Ageratina glechonophyll) and E. salvia. The first is distributed in the coast (0–200 m.a.s.l.) from Antofagasta to the south, almost 400 km of distance from Tarapacá locality [137], mainly in Paposo locality [136]. E. salvia is also found along the coast further to the south, with a northernmost limit in the Coquimbo region, more than 1000 km to the south of our region study [137].
Considering this phytogeographical distribution of dye plants in the Atacama Desert, Niemeyer and Agüe-ro’s proposal should be re-evaluated. Because it is a fact that pre-Colombian communities in the Atacama coast were in close contact with this inland oasis, as well as with other groups that inhabited the inland valleys ter-ritories since remote times [150–155]. The traditional Andean model has placed in a prominent position the trade with foreign regions and the products and tech-nologies from abroad, from territories beyond the Andes mountain to the east, while to the coastal gath-erer-hunters have been assigned a passive role in the regional economies. In that sense, given the abundance of plants of Galium species along the northern Chile coastline, this could have been also a possible source of direct supply or by an exchange of dyestuffs, for the textile production. This possible hypothetical link with the coast becomes even more plausible when we con-sider that several vegetable sources of indigo are also found on the littoral, including E. glechonophyla and A.
Page 16 of 21Sepúlveda et al. Herit Sci (2021) 9:59
glechonophylla. Also, we cannot forget that brominated indigo can be extracted from an extremely popular marine mollusc from the coast of the Atacama Desert, the Concholepas concholepas [21], a potential animal source of dye supply that has not yet been considered in archaeological studies of the region. Further efforts for the elaboration of local references are absolutely needed.
Archaeological studies on textile dyes in the Ata-cama Desert have also scarcely considered the available ethnohistorical and ethnographic information, look-ing rather for substances and species popular in other neighbouring regions. This trend generates a hiatus in local information, since not all Andean or South Amer-ican communities opted for the same technical solu-tions when it came to coloring their fabrics.
As an example, for the San Pedro de Atacama area, the naturalist Rodolfo Philippi pointed out in 1854 that “for the blue, you can use añil [or indigo], for the red grana, for the yellow and indigenous plant, called fique, which I have not seen. Grana is a kind of cochineal that is brought from the Otra Banda provinces [Northwest-ern Argentina], mainly from Santiago del Estero” [156]. In an ethnographic study from the mid-twenty century, Grete Mostny and co-workers recorded that the people from Peine village used alum as a mordant for dyeing textiles, and the color came from different local plants, such as monte verde, chilca and mocaraca for the green, tícara for the brown, algarrobo for mustard hues and sacha-uva for purples [157]. Munizaga and Gunckel, in a similar contemporary study, carried out at the Socaire village, also acknowledged the use of tícara (Krameria iluca), romasa (Rumex patientia) and monte verde for dyeing yellow textiles [158]. Finally, Villagrán and Cas-tro, on a research with an extensive geographic scale, identified the use of molle (Schinus molle), algarrobo (Prosopis alba), monte verde (Krameria lappacea), pingopingo (Ephedra andina), kopa (Artemisia kopa), Siput´olas or pulikas (Parastrephia species, including P. lepidophylla, P. quadrangularis and P. teretiuscula) and male tíkara (Ambrosia artemisoides) for dyeing purposes, each one of them with a particular color and shade, depending on their preparation and combina-tion [159]. We need to broaden our knowledge about the use of local plants to produce dyes, to later gener-ate useful references for chemical analysis as it has been done in different regions of the Central Andes [17–21, 160].
ConclusionsThe results presented here show that the textiles from Tarapacá-40 and Pica-8 cemeteries from the Atacama Desert were dyed with substances that until now were
not found near the localities. Its closest supply is, on the other hand, at approximately 100 km, both on the Pacific coast and in the valleys to the north and Northwestern Argentina to the southeast. However, the local popu-lations of the Pica and Tarapacá valleys lived in close social and economic ties with those inhabitants settled in the supply areas of these plants and insects with dyeing potentials [87, 91]. Thus, the color technology from the Tarapacá pre-Columbian textiles must have depended above all on an extensive social network and the associa-tion with different and distant communities. Extra local relations constructed not just for dyes procurement, but also for the other raw materials needed such as fibers. The identification of cotton was also confirmed in our preliminary recognition of the complete textile collec-tion studied. Unfortunately, the advancement of regional archaeology does not yet make it possible to confirm how and where textiles were produced and how dyed fib-ers were obtained. At this moment, we cannot precise if they obtained only the dyestuffs and completed locally the process of dyeing fibers, or balls of dyed yarns and they wove the different textile garments, or finally, they obtained the complete woven textile pieces by exchange from other localities.
In addition, archaeological studies dealing with textile dyes in the Atacama Desert have paid little attention to the available ethnohistorical and ethnographic informa-tion, looking instead for substances and species popular in neighboring regions. This has led to a lack of infor-mation about local dyeing technologies since not all the Andean or South American communities had probably chosen the same technical solutions when it comes to textile dyeing. The brief ethnohistoric and ethnographic review presented in the discussion section demonstrates the local availability of a wide variety of plants with dye-ing capabilities in the Atacama Desert. However, very few of them have been studied to identify chemical markers that can be traced to pre-Columbian objects. Meanwhile, archaeology continues to look for the most popular dye-ing plants used outside the region.
Considering these shortcomings concerning the refer-ence samples, the textiles from the Tarapacá region are an excellent evidence of deep knowledge regarding dyes and dyeing techniques, about botanical and insect spe-cies available for these purposes, as well as a particular dexterity for the construction of complex polychrome textiles, conceived before the fabrication. The num-ber and size of the textiles deposited as offerings, their shapes, and designs points to the existence of special-ists, committed not only to the fabrication of the textiles but also to the previous stages of acquisition and condi-tioning of the fibers, in addition to the procurement and
Page 17 of 21Sepúlveda et al. Herit Sci (2021) 9:59
elaboration of the materials used to prepare the solutions or dyestuffs where the fibers were immersed.
So, to conclude, these results need to be complemented and reviewed regarding the production processes: on the one side to precise the nature of the fiber raw materials and their possible provenance (wool, cotton, etc.) and hence their domestication and exploitation; and on the other side, the nature and localization of the vegetable and animal resources from where the dyes were extracted and produced. This paper constitutes just a first approach to this topic in the Atacama Desert.
Supplementary InformationThe online version contains supplementary material available at https:// doi. org/ 10. 1186/ s40494‑ 021‑ 00538‑9.
AcknowledgementsAnalysis was performed at Laboratorio de Análisis e Investigaciones Arqueo‑métricas (LAIA) of Universidad de Tarapacá and LANCIC Laboratory of Universi‑dad Nacional Autónoma de México during 2016. Thanks to Departamento de Antropología from Universidad de Chile for the access to archaeological textile collection. We are grateful for the collaboration of Adriana Muñoz and Pilar Babot which provide us with bibliographic references and Mariana Ugarte for the map of Figure 1. Finally, authors want to thank the four anonymous reviewers for their helpful comments on this article.
Authors’ contributionsMS: conceptualization, investigation, in situ analyses, formal analysis, writ‑ing original draft, editing, funding acquisition, project administration; CL: investigation, in situ analysis, funding acquisition, project administration; JC‑V: laboratory analyses, formal analysis, visualization, writing,; EC‑G: formal analysis, visualization, writing original draft, editing; SG: in situ analyses, labora‑tory analyses; MAM‑R: in situ analyses, laboratory analyses; BB: investigation, formal analysis, writing original draft; JLRS: investigation, supervision, editing original draft, funding acquisition, project administration; All authors read and approved the final manuscript.
FundingThis work was financed by FONDART 420982 (Chile), FONDECYT 1190263 (Chile), Proyecto REDES CONICYT 150136 (Chile), and partially supported by CONACYT Mexico Grants LN279740, LN293904, LN299076, LN314846, CB239609, PAPIIT UNAM Grant IN112018 (Mexico).
Availability of data and materialsData is available by contacting the corresponding author. After reviewers’ comments supplementary data (Supplementary Material‑Appendix A) is included in this final version.
Declarations
Competing interestsThe authors declare that they have no competing interests.
Author details1 Escuela de Antropología, Pontificia Universidad Católica de Chile, Chile & UMR 8096 (CNRS‑Paris 1), Francia. Av. Vicuña Mackenna 4860, Macul, Chile. 2 Laboratorio de Arqueología, Escuela de Arqueología, Universidad Austral de Chile, Sede Puerto Montt, Los Pinos S/N, Puerto Montt, Chile. 3 Universi‑dad de Tarapacá, POBox 6D, Arica, Chile. 4 CONACyT – Laboratorio Nacional de Ciencias para la Investigación y Conservación del Patrimonio Cultural, Instituto de Física, Universidad Nacional Autónoma de México, Circuito de la
Investigación s/n, Ciudad Universitaria, Coyoacán, 04510 Mexico City, Mexico. 5 Departamento de Antropología, Universidad de Tarapacá, Cardenal Caro 348, Arica, Chile. 6 Instituto de Física, Laboratorio Nacional de Ciencias Para La Investigación Y Conservación del Patrimonio Cultural, Universidad Nacional Autónoma de México, Circuito de la Investigación s/n, Ciudad Universitaria, Coyoacán, 04510 Mexico City, Mexico.
Received: 11 February 2021 Accepted: 13 May 2021
References 1. Murra J. Cloth and its function in the Ica State. Am Anthropol.
1962;64:710–28. 2. Jolie EA, Lynch TF, Geib PR, Adovasio JM. Cordage, textiles, and the late
pleistocene peopling of the Andes. Curr Anthropol. 2011;52(2):285–96. 3. Splitstoser J, Dillehay T, Wouters J, Claro A. Early pre‑Hispanic use of
indigo blue in Peru. Sci Adv. 2016;2:e1501623. 4. Oakland Rodman A, Cassman C. Andean tapestry. Structure informs the
surface Art J. 1995;54(2):33–9. 5. Frame M. Las imágenes visuales de estructuras textiles en el arte del
antiguo Perú. Revista Andina. 1994;12(2):295–350. 6. Rowe A. The art of Peruvian textiles. In: Boone EH, editor. Andean art at
Dumbarton Oaks. Washington DC: Dumbarton Oaks Research Library and Collection; 1996. p. 329–45.
7. Conklin W. Structure as meaning in Andean Textiles. Chungara. 1997;29(1):109–31.
8. Cereceda V. Semiología de los textiles andinos: las talegas de Isluga. Chungara. 2010;42(1):181–98.
9. Ramos G. Los tejidos y la Sociedad colonial andina. Colon Lat Am Rev. 2010;19(1):115–49.
10. Arnold D. Introduction. In: Arnold D, Espejo E, Maidana F, editors. Tejiendo la vida la colección textil del Museo Nacional de Etnografía y Folklore según la cadena de producción. La Paz: MUSEF; 2016. p. 1–26.
11. Urton G, Brezine C. Khipu accounting in ancient Peru. Science. 2005;309:1065–7.
12. Arnold D. Introduction. In: Arnold D, Dransart P, editors. Textiles, techni‑cal practice, and power in the Andes. UK: Archetype books; 2014. p. 1–20.
13. Fester G, Cruellas J. Colorantes de Paracas. Rev del Mus Nac. 1934;3:154–6.
14. Fester G, Lexow S. Las raíces del género “Rebulnium” en la tintorería americana. An Soc Cient Arg. 1941;136:233–40.
15. Fester G, Lexow S. Colorantes de insectos. An Soc Cient Arg. 1943;135:89–96.
16. Antúnez de Mayolo KK. Peruvian natural dye plants. Econ Bot. 1989;43(2):181–91.
17. Saltzman M. Identifying dyes in textiles. Am Sci. 1992;80(5):474–81. 18. Roquero A. Colores y colorantes de América. An Mus Am.
1995;3:145–60. 19. Roquero A. Identification of red dyes in textiles from the Andean region.
In: Textile Society of America Symposium Proceedings, p. 129. 2008. http:// digit alcom mons. unl. edu/ tsaco nf/ 129. Accessed 15 Jan 2021.
20. Trillo C, Demaio P. Tintes Naturales. Guía para el reconocimiento y uso de plantas tintóreas del Centro de Argentina. Córdoba: Ed. Sezo; 2007.
21. Le CD. monde des teintures naturelles. Paris: Editions Belin; 2014. 22. Babot MP, Apella MC. Recursos y procedimientos potenciales para una
tintorería prehispánica en la puna Meridional Argentina. In: Rojas‑Mora S, Belmar C, compilers. De las muchas historias entre las plantas y la gente. Alcances y perspectivas de los estudios arqueobotánicos en América Latina. Bogotá: ICAHN; 2018. p. 289–34.
23. DHarcourt R, . Textiles of ancient Peru and their techniques. Seattle: University of Washington Press; 1962.
24. Emery I. The primary Structures of Fabrics. Washington DC: Watson‑Guptill Publications/Whitney Library of Design The Textil Museum; 1995.
25. Manrique E. Tecnología textil en Perú. In: De Lavalle JA, De Lavalle de Cárdenas R. compilers. Tejidos Milenarios del Perú. Lima: Integra AFP; 1999. p. 29–73
Page 18 of 21Sepúlveda et al. Herit Sci (2021) 9:59
26. Oakland RA. Andean textiles from village and cemetery: Caserones in the Tarapacá Valley, north Chile. In: Ballard P, Webster L, editors. Beyond cloth and cordage. Archaeological textiles research in the Americas. Salt Lake City: The University of Utah Press; 2000. p. 229–51.
27. Agüero C. Tradiciones textiles de Atacama y Tarapacá presentes en Quillagua durante el Período Intermedio Tardío. Boletín del Comité Nacional de Conservación Textil. 1998;3:103–28.
28. Agüero C. Vestuario y sociedad andina. Desarrollo del Complejo Pica‑Tarapacá (800–1400 DC). San Pedro de Atacama: QILLQA Ediciones IAA. Universidad Católica del Norte; 2015.
29. Agüero C, Uribe M, Ayala P, Cases B. Variabilidad textil durante el período Intermedio Tardío en el valle de Quillagua: una aproximación a la etnicidad. Estud Atacamenos. 1997;14:263–90.
30. Carmona G. Los textiles en el contexto multiétnico del período Tardío en Arica. Chungara. 2004;36:249–60.
31. Cassman V. Prehistoric ethnicity and status based on textiles evidence from Arica. Chile Chungara. 2000;32(2):253–7.
32. Oakland‑Rodman A. Textiles and ethnicity: Tiwanaku in San Pedro de Atacama. North Chile Lat Am Antiq. 1992;3(4):316–40.
33. Paul A. Paracas Ritual Attire: symbols of authority in ancient Peru. Nor‑man: University of Oklahoma Press; 1990.
34. Ulloa L. Evolución de la industria textil prehispánica en la zona de Arica. Chungara. 1982;8:97–108.
35. Gallardo F. La sustancia privilegiada: turbantes, poder y simbolismo en el Formativo del norte de Chile. Santiago de Chile: Museo Chileno de Arte Precolombino; 1992.
36. Decoster JJ. Identidad Étnica y manipulación cultural: la indumentaria incca en la época colonial. Estud Atacamenos. 2005;29:163–70.
37. Dransart P. Inner worlds and the event of a thread in Isluga, Northern Chile. In: Dransart P, editor. Andean art: visual expression and its relation to Andean beliefs and values. Avebury: Aldershot; 1995. p. 228–42.
38. Cook A. The Emperor’s new clothes: symbols of royalty, hierarchy and identity. J Steward Anthropol Soc. 1996;24(1–2):85–120.
39. Agüero C, Uribe M, Ayala P, Cases B. Una aproximación arqueológica a la etnicidad, y el rol de los textiles en la construcción de la identidad cultural en los cementerios de Quillagua (norte de Chile). Gaceta Arqueológica Andina. 1999;25:167–97.
40. Agüero C. Las tradiciones de Tierras Altas y de Valles Occidentales en la textilería arqueológica del valle de Azapa. Chungara. 2000;32(2):217–25.
41. Agüero C. Textiles del asentamiento Caserones y su cementerio: Signifi‑cado social y político para la población tarapaqueña durante el período Formativo (norte de Chile). Rev Chil Antropol. 2012;26:59–94.
42. Peters A. Emblematic and material color in the Paracas‑Nasca transition. Nuevo Mundo Mundos Nuevos [Online], Workshops, Online since 08 December 2016. https:// doi. org/ 10. 4000/ nuevo mundo. 69877. Accesed 17 Jan 2021.
43. Femenias B. Structure, design, and gender in Inka textiles. PreColum‑bian Textile Conference VII / Jornadas de Textiles PreColombinos VII. 2017. http:// digit alcom mons. unl. edu/ pct7/ 172017. Accessed 17 Jan 2021.
44. Boytner R. Preferencias culturales: un punto de vista desde la investi‑gación sobre los tintes de los textiles andinos. In: Solanilla Demestre V. editor. Actas de las II Jornadas internacionales sobre textiles preco‑lombinos. Barcelone: Departament d’Art de la Universitat Autònoma de Barcelona, Institut Català de Coperación Iberoamericana; 2002. p. 61–78.
45. Babot P. Apella M C. Aschero C. López Campeny S, Martínez J. Hocsman S. Tintes y textiles prehispánicos: diversidad, continuidad y cambio en el uso del color en Antofagasta de la Sierra (Catamarca, Argentina).1° jornadas sobre estudio y conservación de textiles, San Miguel de Tucuman. 2006: without page.
46. Verhecken A. The textile raw materials of ancient Peru. In: De Bolle MG, editor. Rediscovery of pre‑columbian textiles. Antwerp: Huize Dumor‑tier—Ruiselede: Lamandart Publishers; 1994. p.49–65.
47. Chirinos N.R. Tintes en el Perú prehispánico virreinal y republicano. In: De Lavalle JA, De Lavalle de Cárdenas R, editors. Tejidos Milenarios del Perú. Lima, Integra AFP; 1999. p. 29–73
48. Kashiwagi KM. An analytical study of pre‑Inca pigments, dyes, and fib‑ers. B Chem Soc Jpn. 1976;46(5):1236–9.
49. Geiss‑Mooney ME, Needles HL. Dye analysis of a group of Late Inter‑mediate period textiles from Ica, Peru. In: Williams J, editor. Preservation
of paper and textiles of historic and artistic value II. Washington DC: American Chemical Society; 1981. p. 291–300.
50. Ekroth‑ Edebo M. Paracas and Pachacamac textiles from the Museum’s Collections. In: Zetterstrom K, editor. Morphological, chemical, and physical analysis. Annual Reports for 1987–1988. Goteborg: Goteborg Etnografiska Museum; 1987–1988. p. 1–20.
51. Martoglio PA, Bouffard SP, Sommer AJ, Katon JE, Jakes KA. Unlocking the secrets of the past: the analysis of archaeological textiles and dyes. Anal Chem. 1990;62(21):1123A‑A1128.
52. Michel R, Lazar J, McGovern PE. Indigoid dyes in Peruvian and Coptic textiles of the University Museum of Archaeology and Anthropology. Archaeomaterials. 1992;6:69–83.
53. Wouters J, Rosario‑Chirinos N. Dye analysis of pre‑Columbian Peruvian textiles with high‑performance liquid chromatography and diode‑array detection. J Am Inst Conserv. 1992;31:237–55.
54. Wallert A, Boytner R. Dyes from the Tumilaca and Chiribaya cultures, South Coast of Peru. J Arch Sci. 1996;23:853–61.
55. Rull F, De La Pisa R, Agüero C, Llagostera A, Costa MA. FT‑IR and FR‑Raman characterisation of dye pigments in textile samples from Chilean mummies: a preliminary study. XIX ICOS, Australia 8–13 Agosto 2004.
56. Zhang X, Boytner R, Cabrera JL, Laursen R. Identification of yellow dye types in pre‑columbian Andean textiles. Anal Chem. 2007;79:1575–82.
57. Sousa MM, Miguel C, Rodrigues I, Parola AJ, Pina F, Seixas de Melo JS, Melo MJ. A photochemical study on the blue dye indigo: from solution to ancient Andean textiles. Photochem Photobiol Sci. 2008;7:1353–9.
58. Degano I, Colombini MP. Multi‑analytical techniques for the study of pre‑Columbian mummies and related funerary materials. J Archaeol Sci. 2009;36(8):1783–90.
59. Claro A, Melo MJ, de Melo JSS, van den Berg KJ, Burnstock A, Montague M, Newman R. Identification of red colorants in van Gogh paitings and ancient Andean textiles by microscpetrofluorimetry. J Cult Herit. 2010;11:27–34.
60. Armitage RA, Jakes KA, Day CJ. Direct analysis in real time‑mass spec‑troscopy for identification of red dye colorants in Paracas necropolis textiles. Sci Technol Archaeol Res. 2015;1(2):60–9.
61. Bernardino ND, De Faria DLA, Negrón ACV. Applications of Raman spec‑troscopy in archaeometry: an investigation of pre‑columbian Peruvian textiles. J Arch Sci Rep. 2015;4:23–31.
62. Lech K, Witkos K, Wilenska B, Jaorsz M. Identification of unknown color‑ants in pre‑Columbian textiles dyed with American cochineal (Dactylo‑pius coccus Costa) using high‑performance liquid chromatography and tandem mass spectrometry. Anal Bioanal Chem. 2015;407:855–67.
63. Niemeyer H, Agüero C. Dyes used in pre‑Hispanic textiles from the Mid‑dle and Late Intermediate periods of San Pedro de Atacama (Northern Chile): new insights into patterns of exchange and mobility. J Archaeol Sci. 2015;57:14–23.
64. Price K, Higgitt C, Deviese T, McEwan C, Sillar B. Tools for eternity: pre‑Columbian workbaskets as textile production toolkits and grave offerings. Tech Res Bull. 2015;9:65–86.
65. Burr E. Dye analysis of archaeological Peruvian textiles using surface enhanced Raman spectroscopy (SERS). Thesis submitted in partial satisfaction of the requirements for the degree Master of Arts in Con‑servation of Archaeological and Ethnographic Materials. University of California, Los Angeles. 2016 https:// escho larsh ip. org/ uc/ item/ 5699m 0tt. Accessed 15 Jul 2020.
66. Boucherie N, Nowik W, Cardon D. La producción tintórea Nasca: nuevos datos analíticos obtenidos sobre textiles recientemente descubiertos en excavaciones. Nuevo Mundo Mundos Nuevos [Online], Colloques. 2016. Doi: https:// doi. org/ 10. 4000/ nuevo mundo. 69222. Accessed 15 Jul 2020.
67. Javer A, Hacke M, Thays Delgado C, Thuresson K. Paracas textiles‑colour and condition. Investigation of the mordants and state of degradation of the Paracas textiles collections in Peru and Sweden. In: Bridgland J., editor. ICOM‑CC 18th Triennial Conference Preprints, Copenhagen, 4–8 September 2017. Paris: International Council of Museums; 2017.
68. López‑Campeny SML, Suarez S, Quiroga B, Romano AS, Babot MP, Hocs‑man S, Martinez JG, Martinez MS. Uso del color en textiles: Antofagasta de la Sierra, Catamarca (ca. 8000 a 200 años AP). Caracterización por PIXE. Libro de Resumenes VII Congreso Nacional de Arqueometría, San Miguel de Tucuman; 2018. p. 228–232.
Page 19 of 21Sepúlveda et al. Herit Sci (2021) 9:59
69. Celis F, Tirapeguy C, García M, Aracena A, Aliaga A, Campos‑Vallette M. Identification of coexisting indigo species in an ancient green thread using direct plasmon‑enhanced raman spectroscopy. J Chil Chem Soc. 2020;65(2):4798–803.
70. Sabatini F, Bacigalupo M, Degano I, Javer A, Hacke M. Revaling the organic dye and mordant composition of Paracas textiles by a com‑bined analytical approach. Herit Sci. 2020;8:122.
71. Barnard H, Boytner R, Khandekar N, Schleider M. Painted textiles: knowl‑edge and technology in the Andes. Ñawpa Pacha. 2016;36(2):209–28.
72. Summerour R, Giaccai J, Webb K, Mori C, Little N, Technical analysis of four archaeological andean painted textiles. Nuevo Mundo Mundos Nuevos [Online], Colloques. 2016. Doi: https:// doi. org/ 10. 4000/ nuevo mundo. 69257. Accessed 15 Jul 2020.
73. Celis F, Segura C, Gómez‑Jeria JS, Campos‑Vallette M, Sanchez‑Cortes S. Analysis of biomolecules in cochineal dyed archaeological textiles by surface‑enhanced Raman spectroscopy. Sci Rep. 2021;11:6560.
74. Degano I, Ribechini E, Modugno F, Colombini MP. Analytical methods for the characterization of organic dyes in artworks and in historical textiles. App Spectrosc Rev. 2009;44(5):363–410.
75. Armitage R, Fraser D, Degano I, Colombini MP. The analysis of the Saltzman Collection of Peruvian dyes by high performance liquid chromatography and ambient ionization mass spectrometry. Herit Sci. 2015;7:81.
76. Shahid M, Wertz J, Degano I, Aceto M, Khan MI, Quye A. Analytical methods for determination of anthraquinone dyes in historical textiles: a review. Anal Chim Acta. 2019;1083:58–87. https:// doi. org/ 10. 1016/j. aca. 2019. 07. 009.
77. Lewis SW. Analysis of dyes using chromatography. In: Houck M, editor. Identification of Textile Fibers. Woodhead Publishing Series in Textiles. 2009. p. 103–223.
78. Beldean‑Galea M, Copaciu F‑M, Coam M‑V. Chromatographic analysis of textile dyes. J AOAC Int. 2018;101(5):1353–70.
79. Agüero C. Tarapacá‑40 y la textilería formativa del norte de Chile. Actas XIII Reunión Anual Comité Nacional de Conservación Textil; 1999. p. 7–18.
80. Núñez L. Caserones‑I, una aldea prehispánica del norte de Chile. Estu‑dios Arqueológicos. 1966;2:25–9.
81. True D. Archaeological investigations in northern Chile: Caserones. In: Meighan C, True D, editors. Prehistoric trails of Atacama: archaeology of Northern Chile. Monumenta Archaeologica 7. Los Angeles: University of California; 1980. p. 139–178.
82. Núñez L. Temprana emergencia de sedentarismo en el desierto chileno: proyecto Caserones. Chungara. 1982;1982(9):80–122.
83. Uribe M, Agüero C, Catalán D, Herrera MJ, Santana‑Sagredo F. Nuevos fechados del del sitio Tarapacá‑40: recientes análisis y reflexiones sobre un cementerio clave del período Formativo del norte de Chile y Andes Centro Sur (1110 aC–660 dC). Ñawpa Pacha. 2015;25:57–89.
84. Lemp C. Prologo. In: Sepúlveda M, editor. Vistiendo la vida y la muerte en Tarapacá. Períodos Formativo e Intermedio Tardío. Santiago de Chile: FONDART. 2018. p. 6–11.
85. Urbina S, Adán L, Pellegrino C. Arquitecturas formativas de las Quebra‑das de Guatacondo y Tarapacá a través del proceso aldeano (ca. 900 a.C.–1000 d.C.). B Mus Chil Arte Prec. 2012;17(1):31–60.
86. Pellegrino C, Adán L, Urbina S. La arquitectura Formativa de Guata‑condo y Caserones: Diseño, organización y configuración del espacio arquitectónico. Rev Chil Antropol. 2016;34(2):41–63.
87. Uribe M, Angelo D, Capriles J, Castro V, DePorras ME, et al. El Formativo en Tarapacá (3000–1000aP): Arqueología, naturaleza y cultura en la Pampa del Tamarugal, desierto de Atacama, norte de Chile. Lat Am Antiq; 2020;31(1):81–102.
88. Niemeyer H. Excavaciones en Pica (Provincia de Tarapacá). Boletín del Museo Arqueológico de La Serena. 1959;10:59–67.
89. Núñez L. Desarrollo cultural prehispánico del norte de Chile. Estudios Arqueológicos. 1965;1:37–115.
90. Zlatar V. Cementerio prehispánico Pica‑8. Antofagasta: Universidad de Antofagasta; 1984.
91. Uribe M. Acerca de complejidad, desigualdad social y el complejo cultural Pica‑Tarapacá en los Andes Centro‑ Sur (1000–1450 DC). Estud Atacamenos. 2006;31:91–114.
92. Santana‑Sagredo F, Shulting R, Lee Thorp J, Agüero C, Uribe M, Lemp C. Paired radiocarbon dating on human samples, camelid fibers and
textiles from Pica (tarapacá region), northern of Chile. Radiocarbon. 2017;59(4):1195–213.
93. Agüero C. Vestuario e identidad cultura en Tarapacá durante el período Intermedio Tardío. Actas del XVII Congreso Nacional de Arqueología Chilena, Tomo 1. Valdivia: Ediciones Kultrun; 2010. p. 33–45.
94. Kubelka P, Munk F. Ein Beitrag zur Optik der Farbanstriche. Zeitschrift Für Tech Phys. 1931;12:593–601.
95. Vargas WE, Niklasson G. Applicability conditions of the Kubelka‑Munk theory. Appl Opt. 1997;36:5580–6. https:// doi. org/ 10. 1364/ AO. 36. 005580.
96. Turkevich J, Stevenson PC, Hillier J. Nucleation and growth process in the synthesis of colloidal gold. Discuss Faraday Soc. 1951;11:55–75.
98. Yang YJ, Ganbat D, Aramwit P, Bucciarelli A, Chen J, Migliaresi C, Motta A. Processing keratin from camel hair and cashmere with ionic liquids. EXPRESS Polym Lett. 2019;13(2):97.
99. Carter EA, Edwards HG. Biological applications of Raman spectroscopy In: Gremlich HU, Yan B, Dekker M, editors. Infrared and Raman spectros‑copy of biological molecules, practical spectroscopy series, vol. 24. New York; 2001. p. 421–475.
100. Gulmini M, Idone A, Diana E, Gastaldi D, Vaudan D, Aceto M. Identifica‑tion of dyestuffs in historical textiles: strong and weak points of a non‑invasive approach. Dyes Pigments. 2013;98:136–45.
101. Maynez‑Rojas MA, Casanova‑González E, Ruvalcaba‑Sil JL. Identification of natural red and purple dyes on textiles by Fiber‑optics Reflec‑tance Spectroscopy. Spectrochim Acta Part A Mol Biomol Spectrosc. 2017;178:239–50.
102. Aceto M, Aceto A, Agostino G, Fenoglio A, Idone M, et al. Characteri‑sation of colourants on illuminated manuscripts by portable fibre optic UV‑visible‑NIR reflectance spectrophotometry. Anal Methods. 2014;6:1488–500.
103. Kirby J. A spectrophotometric method for the identification of lake pig‑ment dyestuffs. Natl Gallery Tech Bull. 1977;1:35–45.
104. Fonseca B, Schmidt Patterson C, Ganio M, et al. Seeing red: towards an improved protocol for the identification of madder‑ and cochineal‑based pigments by fiber optics reflectance spectroscopy (FORS). Herit Sci. 2019;7:92. https:// doi. org/ 10. 1186/ s40494‑ 019‑ 0335‑1.
105. Phipps E. Cochineal red: the art history of a color. New York: The Metro‑politan Museum of Art‑New Haven and London: Yale University Press; 2010.
106. Tomasini E, Cárcamo J, Castellanos D, Careaga V, Gutierrez S, Rua C, Sepúlveda M, et al. Characterization of pigments and binders in a mural painting from the Andean church of San Andrés de Pachama (north‑ernmost of Chile). Herit Sci. 2018;6:61.
107. Grazia C, Buti D, Amat A, Rosi F, Romani A, Domenici D, Sgamellotti A, Miliani C. Shades of blue: non‑invasive spectroscopic investigations of Maya blue pigments. From laboratory mock‑ups to Mesoamerican codices. Herit Sci. 2020;8:1. https:// doi. org/ 10. 1186/ s40494‑ 019‑ 0345‑z.
108. Casanova‑González E, Maynez‑Rojas MÁ, Mitrani A, Rangel‑Chávez I, García‑Bucio MA, et al. An imaging and spectroscopic methodology for in situ analysis of ceiling and wall decorations in Colonial missions in northern Mexico from XVII to XVIII centuries. Herit Sci. 2020;8:91. https:// doi. org/ 10. 1186/ s40494‑ 020‑ 00434‑8.
109. Bruni S, Guglielmi V, Pozzi F. Surface‑enhanced Raman spectroscopy (SERS) on silver colloids for the identification of ancient textile dyes: Tyrian purple and madder. J Raman Spectrosc. 2010;41(2):175–80.
110. Chen K, Leona M, Vo‑Dinh KC, Yan F, Wabuyele MB, Vo‑Dinh T. Applica‑tion of surface‑enhanced Raman scattering (SERS) for the identifica‑tion of anthraquinone dyes used in works of art. J Raman Spectrosc. 2006;37(4):520–7.
111. Pozzi F, Leona M. Surface‑enhanced Raman spectroscopy in art and archaeology. J Raman Spectrosc. 2016;47(1):67–77.
112. Van Elslande E, Lecomte S, Le Hô AS. Micro‑Raman spectroscopy (MRS) and surface‑enhanced Raman scattering (SERS) on organic colourants in archaeological pigments. J Raman Spectrosc. 2008;39(8):1001–6.
113. Newman J, Chen K, Leona M, Vo‑Dinh T. Surface‑enhanced Raman scat‑tering for identification of organic pigments and dyes in works of art and cultural heritage material. Sens Rev. 2007;27(2):109–20.
Page 20 of 21Sepúlveda et al. Herit Sci (2021) 9:59
135. Doménech‑Carbó A, Holmwood S, Di Turo F, Montoya N, Valle‑Algarra FM, Edwards HG, Doménech‑Carbó MT. Composition and color of Maya Blue: reexamination of literature data based on the dehydroindigo model. J Phy Chem C. 2019;123(1):770–82.
136. Marticorena C, Matthei O, Rodríguez R, Arroyo M, Muñoz M, et al. Catálogo de la flora vascular de la segunda región (región de Antofa‑gasta). Chile Gayana Bot. 1998;55(1):23–83.
137. Rodríguez R, Marticorena C, Alarcón D, Baeza C, Cavieres L, et al. Catálogo de las plantas vasculares de Chile. Gayana Bot. 2018;75(1):1–430.
138. Schulz N. Loma‑Formationen der Küsten‑Atacama/Nordchile unter besonderer Berücksichtigung rezenter Vegetations—und Klimaveränderungen. Der Naturwissenschaftlichen Fakultät der Friedrich‑Alexander‑Universität Erlangen‑Nürnberg zur Erlangung des Doktorgrades; 2009.
139. Dempster L. The genus Galium (Rubiaceae) in South America II. Allerto‑nia. 1981;2(8):393–426.
140. Gatica‑Castro A, Marticorena A, Rojas G, Arancio G, Squeo F. Estado de conservación de la flora nativa de las regiones de Arica‑Parinacota y de Tarapacá, Chile. Gayana Botánica. 2015;72(2):305–39.
141. Jaffuel F. Excursiones botánicas a los alrededores de Tocopilla. Rev Chil Hist Nat. 1936;40:265–74.
142. Johnston I. Papers on the flora of northern Chile. Contributions from the Gray Herbarium of Harvard University 1929;85:1‑172
143. Johnston I. New records for the flora of the nitrate coast. Rev Chil Hist Nat. 1932;36(1):4–8.
144. Luebert F, García N, Schulz N. Observaciones sobre la flora y vegetación de los alrededores de Tocopilla (22°s, Chile). Boletín del Museo Nacional de Historia Natural. 2007;56:27–52.
145. Pinto R, Luebert F. Datos sobre la flora vascular del desierto costero de Arica y Tarapacá, chile, y sus relaciones fitogeográficas con el sur de Perú. Gayana Bot. 2009;66(1):28–49.
146. Bukart A. Las especies de Indigofera de la Flora Argentina. Darwiniana. 1942;4(2/3):145–78.
147. Ricardi M, Torres F. Plantas vasculares nuevas para Chile. Bol Soc Biol Concepc. 1957;32:11–6.
148. Estades C, Andrade M, Latorre V, Vukasovic M, Serra M. Elaboración de Línea Base, Zonificación y Guía de Manejo de un Predio Fiscal, Sitio Prioritario para la conservación de la Biodiversidad en la Quebrada de Chaca, Región de Arica y Parinacota. Unión de Ornitólogos de Chile; 2009.
149. Flores R. Caracterización florística de las formaciones de vegetación De la región de Arica y Parinacota. Memoria de título para optar al grado de Ingeniero Agrónomo. Santiago: Universidad de Chile; 2016.
150. Ballester B, Gallardo F. Prehistoric and historic networks on the Atacama Desert coast (northern Chile). Antiquity. 2011;85:875–89.
151. Ballester B, Gallardo F. 2017 Reflexiones sobre valor e intercambio de objetos en la costa de Atacama. Taltalia. 2017;10:53–64.
152. Ballester B, Calás E, Labarca R, Pestle W, Gallardo F, et al. The ways of fish beyond the sea: the circulation and consumption of fish in the Atacama Desert during the Formative period. Anthropozoologica. 2019;54(6):55–76.
153. Gallardo F, Correa I, Blanco J, Pimentel G. Consumption consumes: cir‑culation, exchange, and value of San Pedro de Atacama black polished ceramics. Lat Am Antiq. 2017;28(2):252–68.
154. Núñez L. Geoglifos y tráfico de caravanas en el desierto chileno. In: Niemeyer H, editor Homenaje al Dr. Gustavo Le Paige, SJ. Santiago: Universidad del Norte; 1976. p.147–201.
155. Núñez L. Tráfico de complementariedad de recursos entre las tierras altas y el Pacifico en el área Centro Sur Andina. Tesis doctoral. Tokio: Universidad de Tokio; 1984.
156. Phillipi R. Viage al desierto de Atacama hecho de orden del Gobierno de Chile. Halle en Sajonia, Librería Eduardo Anton; 1860.
157. Mostny G, Jeldes F, González R, Oberhauser F. Peine, un pueblo ataca‑meño. Santiago: Instituto de Geografía de la Universidad de Chile; 1954.
158. Munizaga C, Gunckel H. Notas etnobotánicas del pueblo atacameño de Socaire. Publicación del Centro de Estudios Antropológicos. 1958;5:7–35.
159. Villagrán C, Castro V. Ciencia indígena de los Andes del Norte de Chile. Santiago: Editorial Universitaria; 2003.
114. Liu J, Zhou J, Tang B, Zeng T, Li Y, Li J, et al. Surface enhanced Raman scattering (SERS) fabrics for trace analysis. Appl Surf Sci. 2016;386:296–302.
115. Prikhodko SV, Rambaldi DC, King A, Burr E, Muros V, Kakoulli I. New advancements in SERS dye detection using interfaced SEM and Raman spectromicroscopy (μRS). J Raman Spectrosc. 2015;46(7):632–5.
116. Cañamares M, García‑Ramos J, Domingo C, Sánchez‑Cortes S. Adsorp‑tion of the anthraquinone dye alizarin on ag nanoparticles studied by surface‑enhanced raman spectroscopy. J Raman Spectrosc. 2004;35:921–7.
117. Amato F, Micciche C, Cannas M, Gelardi F, Pignataro B, et al. Ag nanoparticles agargel nanocomposites for SERS detection of cultural heritage interest pigments. Eur Phys J Plus. 2018;133:74. https:// doi. org/ 10. 1140/ epjp/ i2018‑ 11907‑2.
118. Whitney AV, Casadio F, Van Duyne RP. Identification and characteriza‑tion of artist’s red dyes and their mixtures by surface‑enhanced Raman spectroscopy. Appl Spectrosc. 2007;61:994–1000.
119. Aroca R. Surface‑enhanced vibrational spectroscopy. Chichester: Wiley; 2006.
120. Marcaida I, Maguregui M, Morillas H, García‑Florentino C, et al. Opti‑mization of sample treatment for the identification of anthraquinone dyes by Surface‑Enhances Raman Spectroscopy. Anal bioanal Chem. 2017;409:2221–8.
121. Retko K, Ropret P, Cerc Korošec R, Sánchez‑Cortes S, Cañamares MV. Characterization of HPC‑based photoreduces SERS substrates and detection of different organic dyes. J Raman Spectrosc. 2018;49:1288–300.
122. Cárcamo‑Vega JJ, Aliaga AE, Clavijo E, Brañes M, Campos‑Vallette M. Raman and Surface‑Enhanced Raman scattering in the study of human rotator cuff tissues after shock wave treatment. J Raman Spectrosc. 2012;43(2):248–54.
123. Cárcamo‑Vega JJ, Aliaga AE, Clavijo E, Brañes M, Campos‑Vallette M. Raman study of the shockwave effect on collagens. Spectrochim Acta Part A Mol Biomol Spectrosc. 2012;86:360–5.
124. Cárcamo‑Vega JJ, Brañes MR, Loske AM, Campos‑Vallette M. The influence of the number of shock waves and the energy flux density on the Raman spectrum of collagen type I from rat. Shock Waves. 2020;30:201–14.
125. Lyng FM, Faoláin EÓ, Conroy J, Meade AD, Knief P, et al. Vibrational spectroscopy for cervical cancer pathology, from biochemical analysis to diagnostic tool. Exp Mol Pathol. 2007;82:121–9.
126. Tu AT. Peptide backbone conformation and microenvironment of protein side chains. In: Clark RJH, Hester RE, editors. Spectroscopy of biological systems. New York: Wiley; 1986. p. 47–112.
127. Leona M, Stenger J, Ferloni E. Application of Surface‑Enhanced Raman scattering techniques to the ultrasentitive identification of natural dyes in works of art. J Raman Spectrosc. 2006;37:981–92.
128. Garrido C, Clavijo E, Copaja S, Gómez‑Jeria J, Campos‑Vallette M. Vibrational ad electronic spectroscopic detection and quantification of carminic acid in candies. Food Chem. 2019;283:164–9.
129. Baran A, Fiedler A, Schulz H, Baranska M. In situ Raman and IR spectro‑scopic analysis of indigo dye. Anal Methods. 2010;2(9):1372–6.
130. Corales G, Celis F, Gómez‑Jeria JS, Campos‑Vallette M, Cárcamo‑Vega JJ. Raman of indigo on a silver surface. Raman and theoretical characteri‑zation of indigo deposited on silicon dioxide‑coated and uncoated silver nanoparticles. Spectrosc Lett. 2017;50(6):316–21.
131. García‑Bucio MA, Casanova‑González E, Ruvalcaba‑Sil JL, Arroyo‑Lemus E, Mitrani‑Viggiano A. Spectroscopic characterization of sixteenth century panel painting references using Raman, surface‑enhanced Raman spectroscopy and helium‑Raman system for in situ analysis of Ibero‑American Colonial paintings. Philos Trans A Math Phys Eng Sci. 2016;374(2082):20160051. https:// doi. org/ 10. 1098/ rsta. 2016. 0051.
132. Fiedler A, Baranska M, Schulz H. FT‑Raman spectroscopy—a rapid and reliable quantification protocol for the determination of natural indigo dye in Polygonum tinctorium. J Raman Spectrosc. 2011;42:551–7.
133. Vandenabeele P, Bodé S, Alonso A, Moens L. Raman spectroscopic analysis of the Maya wall paintings in Ek’Balam, Mexico. Spectrochim Acta A. 2005;61:2349–56.
134. Doménech‑Carbó A, Doménech‑Carbó MT, Valle‑Algarra FM, Domine ME, Osete‑Cortina L. On the dehydroindigo contribution to Maya Blue. J Mater Sci. 2013;48(20):7171–83.
Page 21 of 21Sepúlveda et al. Herit Sci (2021) 9:59
160. Armitage RA, Fraser D, Degano I, Colombini MP. The analysis of the Saltzman Collection of peruvian dues by high performance liquid chromatography and ambient ionization mass spectrometry. Herit Sci. 2019;7:81. https:// doi. org/ 10. 1186/ s40494‑ 019‑ 0319‑1.
Publisher’s NoteSpringer Nature remains neutral with regard to jurisdictional claims in pub‑lished maps and institutional affiliations.