Open AcceProceedingsColour model analysis for microscopic image processingGloria Bueno*1, Roberto González1, Oscar Déniz1, Jesús González2 and Marcial García-Rojo2
Address: 1Escuela Técnica Superior de Ingenieros Industriales, Universidad de Castilla-La Mancha, Avda. Camilo José Cela, s/n, 13071 Ciudad Real, Spain and 2Hospital General de Ciudad Real. Calle Tomelloso s/n. 13004 Ciudad Real, Spain
AbstractThis article presents a comparative study between different colour models (RGB, HSI andCIEL*a*b*) applied to a very large microscopic image analysis. Such analysis of different colourmodels is needed in order to carry out a successful detection and therefore a classification ofdifferent regions of interest (ROIs) within the image. This, in turn, allows both distinguishingpossible ROIs and retrieving their proper colour for further ROI analysis. This analysis is notcommonly done in many biomedical applications that deal with colour images. Other importantaspects is the computational cost of the different processing algorithms according to the colourmodel. This work takes these aspects into consideration to choose the best colour model tailoredto the microscopic stain and tissue type under consideration and to obtain a successful processingof the histological image.
BackgroundA challenge still facing scientists is the efficient analysisand management of biomedical data, including images.Advances in biomedical imaging diagnosis have been pos-sible thanks to the development of new imaging technol-ogies. Anatomical Pathology has also benefited fromthese new technologies, which have provided solutionsfor whole slide scanning by means of motorized micro-scopes and scanners [1], that is, whole slide imaging(WSI). However, the image processing performed withthese slides is still limited both in data processed andprocessing methods.
Much research has been carried out on the developmentof algorithms for histological image analysis. Most ofthem are based on the segmentation of just one region ofinterest (ROI), which is usually the nucleus, and its classi-fication for diagnosis purposes. To this end, statisticalinformation techniques, region growing algorithms,active contour models and morphological methods havebeen used for ROI detection and processing [2-5].
The main problem with these methods is that they are notdesigned to process large amounts of data, which is thecase when working with WSI in pathology. Besides that,many of these methods show limited results because theyare mainly focused on a single structure or a type of tissue.
from 9th European Congress on Telepathology and 3rd International Congress on Virtual MicroscopyToledo, Spain. 15–17 May 2008
<supplement> <title> <p>New trends in digital pathology: Proceedings of the 9th European Congress on Telepathology and 3rd International Congress on Virtual Microscopy</p> </title> <editor>Marcial García Rojo, Gloria Bueno García and José Sacristán París</editor> <note>Proceedings</note> </supplement>
This article is available from: http://www.diagnosticpathology.org/content/3/S1/S18
There is a need to develop more general and efficientimage processing methods. To this end the colour modelshould be analysed, as well as the distance colour modelapplied to the processing algorithm in order to reduce thecomputational cost and obtain, in an efficient way, a setof heterogeneous, complex and specific image analysis. Inthis work different colour models and distances have beenstudied and applied under a general parallel image-processing model designed and implemented with MPP(Massively Parallel Processing).
MethodsThere are three main colour models:
RGB: channel Red, channel Green and channel Blue,
HSI: channel Hue, channel Saturation and channel Inten-sity,
L*a*b*: channel Luminance, channel a*, that is, range ofchannel between Red to Green and channel b* that isrange of colours between Yellow to Blue.
All colour models have their advantages and drawbacks. Itis necessary to identify which colour model is suitable torepresent and reproduce the ROI under consideration foreach tissue type and WSI modality. Analysing the distancecolour formulae applied between two colours may dothis,
,
,
.
The distances considered within this study are: the Eucli-dean distance for the RGB model (Equation 1), the NBScolour distance formulae for HSI model (Equation 2) andthe CIEDE2000 for the CIEL*a*b*, colour model (Equa-tion 3).
Where KL, Kc, KH are weight factors and the rest of compo-nents, SL, SC, SH, C', H', may be calculated by means of the,{L*, a*, b*} coordinates [6].
Moreover, another aspect to be considered is how to dealwith the colour coordinates, that is as a vector or in a mar-ginal way. These aspects have been analysed within thiswork. To this end the 3*2 distances to the most represent-ative colour ROIs and statistically identified on the imagewere calculated on different WSI, which is to prostatebiopsies and lung cytology stained with hematoxiline-eosine (HEO), inmunohistochemistry and papanicolau.The images were obtained by the ALIAS II automaticmicroscope and the processing was done using our ownlibraries, implemented by the research group, runningunder MPI on a grid composed by 17 nodes Intel XEON(3,2 GHz) INFINIBAND net (10 GB full-duplex) architec-ture. The results are shown as follows.
ResultsThe results applied to microscopic images show that theEuclidean and NBS vector distance for the RGB and HSImodel respectively distinguish between different ROIs butthe vector CIEDE2000 distance for the CIEL*a*b* modelreproduces in a better way, the original colour. However,the computational cost of the last one is higher than theother two colour models.
Figure 1 shows the result for a biopsy stained with Hema-toxiline-Eosine and Figure 2 for a cytology stained withPapanicolau.
The computational cost for the three colour distance vec-tor models against different number of ROIs is shown inFigure 3.
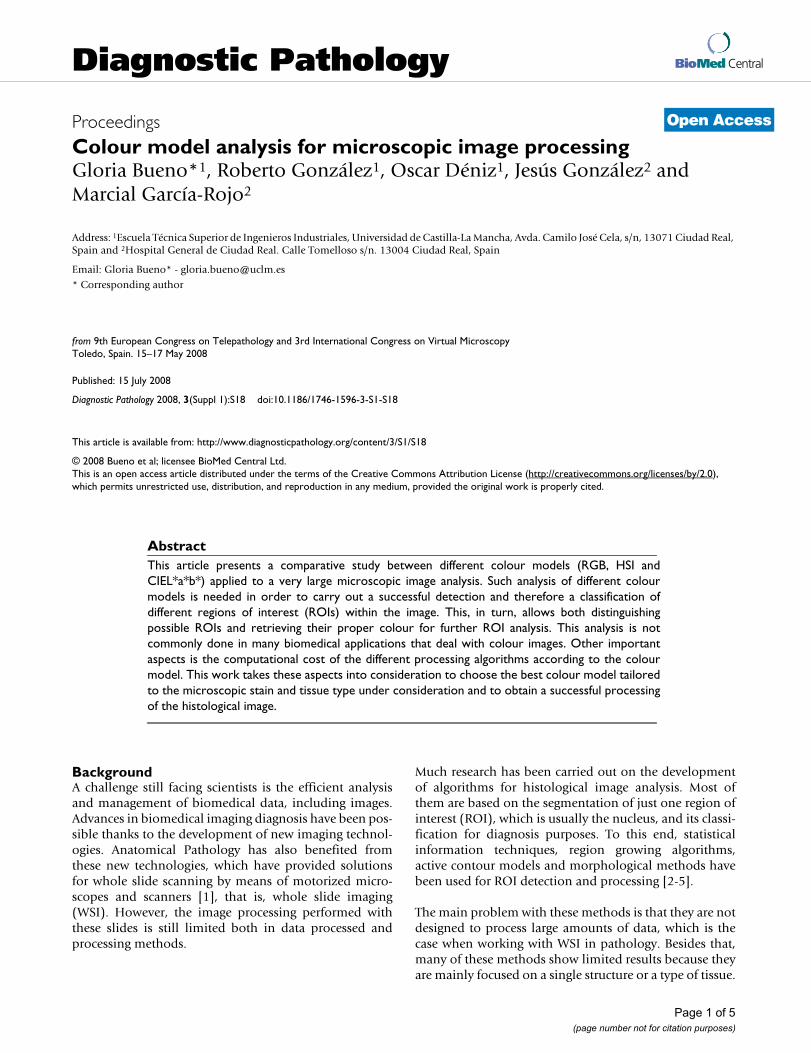
To quantify the goodness of the distance formulae a ROCanalysis has been carried on. Figure 4 shows this analysisfor two ROIs in a prostate biopsy at 10× stained withHEO. The true pixels belonging to the ROIS were indi-cated by experts at Hospital General Ciudad Real. Figure4b) and 4c) show the true values for the two regions ofinterest, the glandular light and the nucleus, extractedfrom the original image (Figure 4a). Figure 4d) to i) showthe different colour distance results for these two regions.Finally, Table 1 shows the ROC analysis for the Eucludian,NBS and CIEDE2000 colour distance for the RGB, HSIand CIEDEL*a*b* models. It is shown that the % of spe-cificity is higher for the CIEDE2000 distance with lowervalue of FP.
d x y,( )
x x x x= ( , ),1 2 3
y y y y= ( , , )1 2 3
d x y x y x y x y,( ) = −( ) + −( ) + −( )1 12
2 22
3 32
( )
d x y x yH
S I, . cos( ) = ∗ − ⎛⎝⎜
⎞⎠⎟
⎛
⎝⎜
⎞
⎠⎟ + + ( )1 2 2 1
2100
42 22 2πΔ Δ Δ
Δ Δ Δ Δ ΔE
LK LSL
CKCSC
HK HSH
RC
KCST00
2 2 2
=′⎛
⎝⎜
⎞
⎠⎟ +
′⎛
⎝⎜
⎞
⎠⎟ +
′⎛
⎝⎜
⎞
⎠⎟ +
′
CC
HK HSH
⎛
⎝⎜
⎞
⎠⎟
′⎛
⎝⎜
⎞
⎠⎟
Δ
Page 2 of 5(page number not for citation purposes)
ConclusionThis article has presented a comparative study betweenRGB, HSI and CIEL*a*b* colour models applied histolog-ical images. This analysis, in turn, allows both distinguish-ing possible regions of interest and retrieving their propercolour for further region analysis.
The results applied to prostate biopsies stained with HEOand lung cytologies stained with papanicolau show thatthe vector CIEDE2000 distance for the CIEL*a*b* modelreproduces in a better way the original colour.
Therefore, this comparison does allow us to choose thebest colour model tailored to the microscopic stain andtissue type under consideration to obtain a successfulprocessing. Moreover, a compromise between the compu-tational cost and the results focus always to distinguishbetween different colour detection and colour retrieval forfurther ROI analysis should be kept. The colour modelshould be taken into consideration when defining stand-ards for histological images. Computational cost of the colour distances vs. number of ROIsFigure 3
Computational cost of the colour distances vs. number of ROIs. Computational cost for the different col-our models against the number of ROIs analysed.
Colour distances for ROI detection applied to biopsiesFigure 1Colour distances for ROI detection applied to biop-sies. a) Original Image, b) RGB (Euclidean), c) HSI (NBS), d) CIEL*a*b (CIEDE2000). Colour distances for ROI detection applied to biopsies.
Colour distances for ROI detection applied to cytologyFigure 2Colour distances for ROI detection applied to cytol-ogy. a) Original Image, b) RGB (Euclidean), c) HSI (NBS), d) CIEL*a*b (CIEDE2000). Colour distances for ROI detection applied to cytology.
Page 3 of 5(page number not for citation purposes)
Publish with BioMed Central and every scientist can read your work free of charge
"BioMed Central will be the most significant development for disseminating the results of biomedical research in our lifetime."
Sir Paul Nurse, Cancer Research UK
Your research papers will be:
available free of charge to the entire biomedical community
peer reviewed and published immediately upon acceptance
cited in PubMed and archived on PubMed Central
yours — you keep the copyright
Submit your manuscript here:http://www.biomedcentral.com/info/publishing_adv.asp
BioMedcentral
AcknowledgementsThis work has been possible thanks to project MEC DPI2004-01346 carried out at Engineering School in collaboration with Hospital General at Ciudad Real.
This article has been published as part of Diagnostic Pathology Volume 3 Sup-plement 1, 2008: New trends in digital pathology: Proceedings of the 9th European Congress on Telepathology and 3rd International Congress on Virtual Microscopy. The full contents of the supplement are available online at http://www.diagnosticpathology.org/supplements/3/S1
References1. Rojo M G, García GB, Mateos CP, García JG, Vicente MC: Critical
comparison of 31 commercially available digital slide sys-tems in pathology. Int J Surg Pathol 2006, 14:285-305.
2. Gao M, Bridgman P, Kumar S: Computer aided prostate cancerdiagnosis using image enhancement and JPEG2000. Proc SPIEInternational Conf on Applications of Digital Image Processing 2003,5203:323-334.
3. Li Y, Lu D, Lu X, Liu J: Interactive colour image segmentationby region growing combines with image enhancement basedon bezier model. Proceedings of the Third International Conference onImage and Graphics (ICIG'04) 2004, 100:96-99.
4. Begelrnan G, Gur E, Rivlin E, Rudzsky M, Zalevsky Z: Cell nucleisegmentation using fuzzy logic engine. IEEE Intern Conference onImage Processing 2004:2937-2940.
5. Hu MP, Ding XY: Automated cell nucleus segmentation usingimproved snake. Proc Intern Conference on Image Processing 2004,4:2737-2740.
6. Wyszecki G, Stiles WS: Color Science: Concepts and Methods,Quantitive Data and Formulae. 2nd edition. Wiley; 2000.
Page 5 of 5(page number not for citation purposes)