Journal of Natural Sciences Research www.iiste.org ISSN 2224- 3186 (Pape r) ISSN 222 5-0921 (Online) Vol.3, No.11, 2013 19 Colour Vision Performance Test Stephen Songden * Emeka Ike Department of Physics, University of Jos, PMB 2084 Jos, Nigeria. * E-mail of the corresponding author:[email protected]Abstract Colour vision is important in everyday life and colour vision deficiency generally lowers the quality of life. The objective of the study was to investigate colour vision performance through tests and measurements. The visual acuity tests were obtained using the Snellen letters while the Colour vision measurements were achieved through designed colour targets. A total number of 8 participants were tested. The results of the measurements further confirmed that having good visual acuity is necessary but not sufficient for good colour vision per formance. Keywords: Colour Vision, Visual Acuity, Snellen Letters, Ishihara, Dvorine Colour Test, Performance 1. Introduction The importance of colour vision cannot be overemphasized and it is hypothesized that colour vision in the visual system evolved as a means of overcoming the extremely unfavourable lighting conditions in the natural environment of early vertebrates (Maximov 2000). Colours are the basic information carriers of any natural scene (Khan et al 1994). Daily life depends on colour to an enormous extent in education, packaging, medicine, sport, horticulture, transport, and many industrial activities (Fletcher and Voke 1985). Minor frustrations for the colour abnormal in dividual include weather forecast (because of the colour coding on the legen ds), light emitting diodes, traffic lights, purchasing clothing, bank tellers (normally in triplicate, each for a specified box) e.t.c. According to Lennie (1984), colour vision has attracted scientific attention for at least 275 years, though it was not until the nineteenth century that we began to understand it properly. Since then, Scientists have provided very precise descriptions of the phenomena of colour vision and provided much new information on the mechanisms of colour vision. The loss of information due to inadequate colour decoding prevents or slows down comprehension, increases reaction time and generally lowers the quality of life. 8% of men and 0.5% of women have colour deficiency or colour blindness in the civilized world. It is more prevalent among the whites than other racial groups (Kilborn and Beh 1934; Shu ey 1936) and colour vision tests are necessary for different professions(Squire et al, 2005). In order for colour to be seen, electromagnetic energy has to reach the eye. An object is seen when light is reflected from it. If it looks green in daylight, then this must imply that it is only reflecting the green part of the light back to o ur eyes. The remainder of the spectrum is absorbed. With regard to cost-effectiveness, labour planning always opts for the minimum amount of workers needed Colour vision deficiency is a condition in which certain colours cannot be distinguished, and is mostly due to an inherited condition. Red-Green colour deficiency (blindness) is by far the most common form, about 99%, and causes problems in distinguishing reds and greens. Another colour deficiency, Blue-Green also exits, but is rare and there are no commonly available tests for it. Abnormal colour vision interests a wide range of people, including the millions who realize that their appreciation of colour is ‘defective’, their families and many more who are responsible for the dangers and other consequences of their condition, including industrial and professional i mplications. T he objective of this stud y was to perform tests and measurements to investigate the colour vision performance. 2. Theoretical Background The optics of the eye bear a general resemblance to a camera system, but the way in which the retina image is processed into a mental image and stored for later use in the memory is almost infinitely complicated. The human eye’s key features include: a highly-corrected optical design, repeatable geometry of materials, control by the brain, processing of retina information, interfacing with the brain from six different levels of sensor cells in the retina, colour vision, compression of data going to the brain, and the highly specific make up and orientation which enable each eye to function and memory of scenes to take place (Deckert 2008). The visual acuity of the eye is an important measure of its ability to function well. 2.1 Visual Acuity Standard visual acuity is defined as the ability to see an object so small that the angle subtended at the eye is only one minute of arc or one sixtieth of a degree. Visual acuity is also defined as the reciprocal of the visual angle expressed in minutes of arc. Acuity is said to be normal if details in an object can be resolved with a visual angle of one minute of arc (Beynon 1985). Many factors affect visual acuity, which could be psychological, retinal location, target orientation, pupil size, state of mind, photoreceptor size, refractive error, eye movement, shape, distance, illumination conditions, age, hue, and background (Glezer et al 1974; Levi 1980; Longhurst 1973; Ike and Jwanbot 2002 and Kelton et al 1978). Visual acuity measurements are generally carried out using
Journal of Natural Sciences Research www.iiste.org
ISSN 2224-3186 (Paper) ISSN 2225-0921 (Online)
Vol.3, No.11, 2013
19
Colour Vision Performance Test
Stephen Songden*
Emeka Ike
Department of Physics, University of Jos, PMB 2084 Jos, Nigeria.* E-mail of the corresponding author:[email protected]
Abstract
Colour vision is important in everyday life and colour vision deficiency generally lowers the quality of life. The
objective of the study was to investigate colour vision performance through tests and measurements. The visual
acuity tests were obtained using the Snellen letters while the Colour vision measurements were achieved throughdesigned colour targets. A total number of 8 participants were tested. The results of the measurements further
confirmed that having good visual acuity is necessary but not sufficient for good colour vision performance.
The importance of colour vision cannot be overemphasized and it is hypothesized that colour vision in the visual
system evolved as a means of overcoming the extremely unfavourable lighting conditions in the naturalenvironment of early vertebrates (Maximov 2000). Colours are the basic information carriers of any natural
scene (Khan et al 1994). Daily life depends on colour to an enormous extent in education, packaging, medicine,
sport, horticulture, transport, and many industrial activities (Fletcher and Voke 1985). Minor frustrations for the
colour abnormal individual include weather forecast (because of the colour coding on the legends), light
emitting diodes, traffic lights, purchasing clothing, bank tellers (normally in triplicate, each for a specified box)
e.t.c. According to Lennie (1984), colour vision has attracted scientific attention for at least 275 years, though it
was not until the nineteenth century that we began to understand it properly. Since then, Scientists have provided
very precise descriptions of the phenomena of colour vision and provided much new information on the
mechanisms of colour vision. The loss of information due to inadequate colour decoding prevents or slows down
comprehension, increases reaction time and generally lowers the quality of life. 8% of men and 0.5% of women
have colour deficiency or colour blindness in the civilized world. It is more prevalent among the whites than
other racial groups (Kilborn and Beh 1934; Shuey 1936) and colour vision tests are necessary for different
professions(Squire et al, 2005). In order for colour to be seen, electromagnetic energy has to reach the eye. Anobject is seen when light is reflected from it. If it looks green in daylight, then this must imply that it is only
reflecting the green part of the light back to our eyes. The remainder of the spectrum is absorbed.
With regard to cost-effectiveness, labour planning always opts for the minimum amount of workers needed
Colour vision deficiency is a condition in which certain colours cannot be distinguished, and is mostly due to an
inherited condition. Red-Green colour deficiency (blindness) is by far the most common form, about 99%, and
causes problems in distinguishing reds and greens. Another colour deficiency, Blue-Green also exits, but is rare
and there are no commonly available tests for it. Abnormal colour vision interests a wide range of people,
including the millions who realize that their appreciation of colour is ‘defective’, their families and many more
who are responsible for the dangers and other consequences of their condition, including industrial and
professional implications. The objective of this study was to perform tests and measurements to investigate the
colour vision performance.
2. Theoretical BackgroundThe optics of the eye bear a general resemblance to a camera system, but the way in which the retina image is
processed into a mental image and stored for later use in the memory is almost infinitely complicated. The
human eye’s key features include: a highly-corrected optical design, repeatable geometry of materials, control by
the brain, processing of retina information, interfacing with the brain from six different levels of sensor cells in
the retina, colour vision, compression of data going to the brain, and the highly specific make up and orientation
which enable each eye to function and memory of scenes to take place (Deckert 2008). The visual acuity of the
eye is an important measure of its ability to function well.2.1 Visual Acuity
Standard visual acuity is defined as the ability to see an object so small that the angle subtended at the eye is
only one minute of arc or one sixtieth of a degree. Visual acuity is also defined as the reciprocal of the visual
angle expressed in minutes of arc. Acuity is said to be normal if details in an object can be resolved with a visual
angle of one minute of arc (Beynon 1985). Many factors affect visual acuity, which could be psychological,
retinal location, target orientation, pupil size, state of mind, photoreceptor size, refractive error, eye movement,shape, distance, illumination conditions, age, hue, and background (Glezer et al 1974; Levi 1980; Longhurst
1973; Ike and Jwanbot 2002 and Kelton et al 1978). Visual acuity measurements are generally carried out using
Journal of Natural Sciences Research www.iiste.org
ISSN 2224-3186 (Paper) ISSN 2225-0921 (Online)
Vol.3, No.11, 2013
20
the Snellen letters which are the most widely used clinically. This is a primary test normally done to ascertainwhether the person has normal or abnormal visual response. The black targets (Snellen letters) are normally
presented at a standard reading distance of 6 meters. At each acuity level, different Snellen letters are presented
for the subject or participant to identify the letter. Someone with 6/6 vision (visual acuity) is just able to
decipher a letter that subtends a visual angle of 5 minutes of arc (written 5' ) at the eye. (5' of arc is 5/60 of adegree, because there are 60' of arc in 1 degree.) What this means is that if you draw a line from the top of a 6/6
letter to the eye and another line from the bottom of the letter to the eye, the size of the angle at the intersectionof these two lines at the eye is 5' of arc. (Also, the individual parts of the letter subtend a visual angle of 1' of arc
at the eye.) It does not matter how far away something is from the eye; if it subtends an angle of 5' of arc at the
eye, then a person with 6/6visual acuity will just be able to determine what it is. Now, someone with 6/6 visual
acuity does not have “perfect” vision, since it is quite possible to see better than 6/6. The less the denominator in
the visual acuity ratio, the better the acuity; and the greater the denominator, the worse the acuity. Therefore, 6/5
acuity is better than 6/6 acuity, and 6/9 acuity is worse than 6/6 acuity. Although 6/6 is "normal" visual acuityfor most people, it is possible (and, in fact, very common) to be able to see better than that.
2.2 Colour Vision Theory
Colour processing begins at a very early level in the visual system (within the retina) through initial color
opponent mechanisms. Opponent mechanisms refer to the opposing colour effect of red-green, blue-yellow, and
light-dark in the X and Y cells of the retina. Visual information is then sent back via the optic nerve to the opticchiasm: a point where the two optic nerves meet and information from the temporal (contralateral) visual fieldcrosses to the other side of the brain. After the optic chiasm the visual fiber tracts are referred to as the optic
tracts, which enter the thalamus to synapse at the lateral geniculate nucleus (LGN). There are three categories of
colour vision theory or model; three-components theory, opponent-colour theory and stage theory.
2.2.1 Three Components Theory:
This theory was briefly stated in 1807 by Thomas Young and was elaborated by Helmholtz about 50 years later.
It is also known as the trichromatic theory of colour vision. It assumes the existence of three independent
response mechanisms in the normal eye: one predominantly sensitive to long-wave light and yielding the
response red; a second predominantly sensitive to middle-wave light and yielding the response green; and a third
sensitive to short-wave light and yielding the response violet (Judd, 1966). The theory assumes that yellow is
produced by the sum of red and green responses and that white is produced by the sum of equal amounts of red,
green and violet responses. The theory fails to explain the way some colour stimuli appear to an observer. Colour
vision is possible with two receptor types. However, not all colors can be seen.2.2.2 Opponent-Colours Theory:
This theory was proposed and explained in detail by E. Hering in 1878. It is based on an analysis of sensations of
colour rather than of the stimuli required to evoke them. It assumes that there are six independent unitary colours
(red, yellow, green, blue, white and black), no one of which partakes of any other; that is for example, yellow is
a basic colour in its own right, not a product of combining red and green. The Hering theory assumes that light is
absorbed in the receptors by photopigments, that this absoption starts activity in the rest of the visual system and
that this activity is directly responsible for the colours we see. This activity is not found in six separate systems,
but in three opposing pairs of processes: black-white, yellow-blue and red-green. Black and white blend to
produce gray but equal amounts of yellow and blue and of red and green cancel to zero (Judd 1966 and
Goldstein 1989). The theory fails to explain certain types of “colour blindness” or deficiencies.
2.2.3 Stage –theory:
This is also called the zone theory of colour vision. According to Fletcher and Voke (1985). The rival theories of
trichromatism and colour opponency competed until the stage theory was introduced principally by Muller,which incorporated the two views. The stage theory separates colour vision processing into a series of three
stages or zones namely: photopigment stage, cone-response stage and optic-nerve stage. Signals resulting from
the reception of light by the photoreceptors are modified at each successive zone often associated with a
physiological level. The photopigment stage follows the three components theory based on the Young primaries.
The cone-response stage follows an opponent-colours form and the optic-nerve stage is the opponent-colours
formulation of Hering with red opposing green and blue opposing yellow. The two-stage theory is based on the
retinal photopigment stage and the cone-response stage. There has been a considerable uncertainty as to
precisely at what stage of the visual process the signals from the receptors can be said to be organized in
opponent colours, whether this is in the retina, the optic nerve, or the occipital lobe of the cortex (Judd 1966).
3. Materials And Method
The investigations were carried out in two parts: Visual Acuity Measurements (Songden and Ike 2004; Beynon
1985) and Colour arrangement Test. All sessions were done under normal natural lighting room condition,which was good for near and distance acuity measurements. All subjects on glasses were tested without their
glasses on to avoid any effect of performance, details of the visual ac
3.1 Visual Acuity Measurements
Visual acuity measurements of the
designed on the computer followinusing power point on the computer
out in a spacious room in the PhysSnellen letters were presented one a
3.2 Colour Arrangement Test
Another test given to the participan
to their saturation. The targets wer
scattered. They were designed usi
similar colour targets and then arranthe number of colour groups.
4. Results
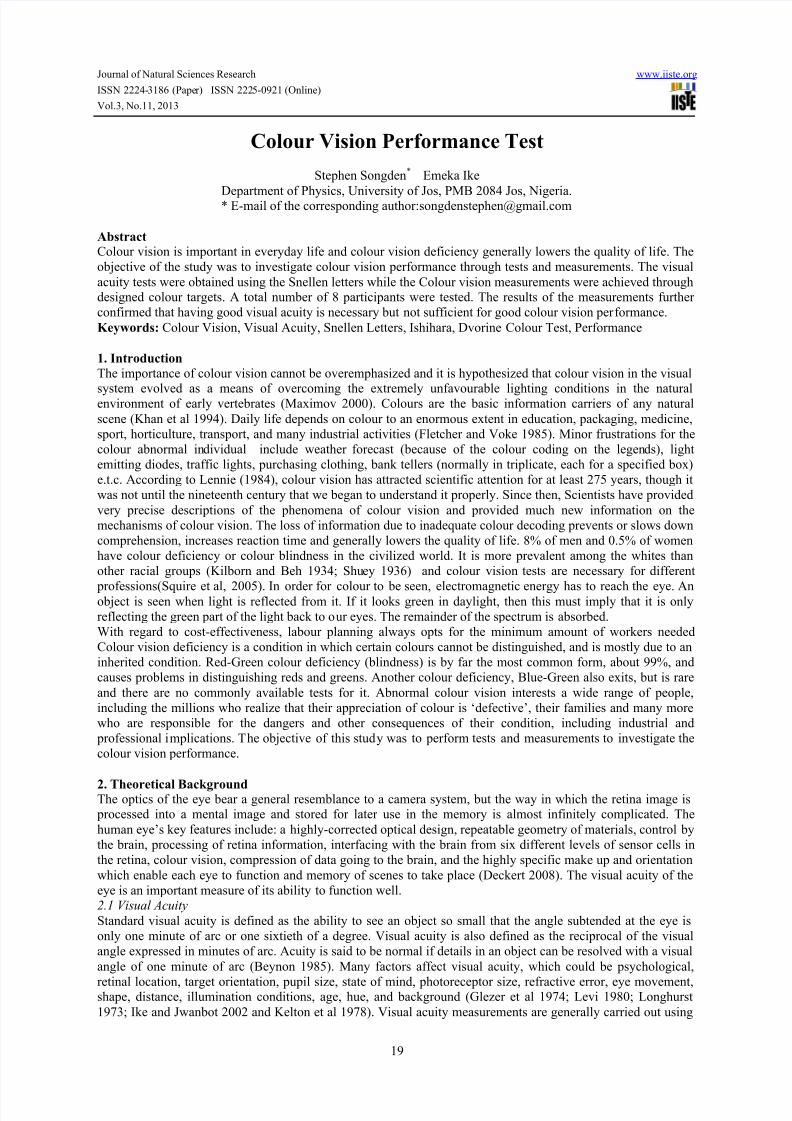
Figure 1 and Table 1 show the re
designed and presented on power po1(b) was arranged by participant A,1(c) was arranged by participant B
was arranged by participant E who
was arranged by participant F who
thirty three targets.
(a)
(b)
Online)
21
such on the measurements. Since the focus of theuity measurements are described in an earlier paper (
articipants were carried out using the Snellen letters.
g established method (Songden and Ike 2004; Beyncreen. The standard reading distance of 6 meters wa
ics Laboratory of the University of Jos. At each aca time.
s was that of arranging different colour targets into c
e squares of dimensions 1.27 cm each and a total o
g microsoft power point and each participant was
ge them according to their saturation in decreasing or
sults of the arrangements of the 8 participants. Fig
int for the arrangement according to the colour groupwho missed two targets (interchanged the first two) iho got everything correctly and this was the case for
issed two targets (interchanged the first two) in the
missed thirty seven targets and figure 1(f) was by pa
(b)
(d)
www.iiste.org
work is on the colour ongden and Ike 2010).
The black targets were
n 1985) and presentedused. This was carried
ity level, the different
olour groups according
f 42 of them randomly
told to group same or
der. They were not told
re 1(a) was the target
s and saturation. Figuren the red group. FigureC, D and H. Figure 1(d)
The results obtained indicated all the participants having good visual acuity. Four of the participants (B,C,D & H)
arranged all the targets correctly. Participant A missed 2 only, which are the first two targets of the red group.This is not a serious problem and therefore negligible. The case of participant E is similar to that of A, missing
only 2, in the blue group. Again this is negligible and not an indication of a colour deficiency. However, this is
not the case with the participants F and G whose arrangements were clear indication of colour vision deficiencies.
Journal of Natural Sciences Research www.iiste.org
ISSN 2224-3186 (Paper) ISSN 2225-0921 (Online)
Vol.3, No.11, 2013
24
This is a confirmation that having a good visual acuity is necessary but not sufficient for good colour vision. The participant F mixed up red and green and was able to group all the yellow targets though not all in the order of
saturation. Participant G was also able to arrange all the yellow targets in one group and in the right order of
saturation but grouped all the blue and purple targets together. The colour deficiencies of the two participants are
closely related though that of F is worse. These results also confirmed those obtained in an earlier study(Songden and Ike 2010) using the Ishihara (1995) and Dvorine (1963) test plates and that colour targets
arrangements could be used in colour vision determination.
References
Beynon J. (1985) “Visual Acuity”, Physics Education 20 (5), 234-237
Deckert C. (2008) http://www.eyedesignbook.com/ch2/eyech2-abc.html#Chapter%202. (Retrieved 7th
May 2008)
Dvorine I. (1963) Pseudo-Isochromatic Plates. 2nd
Edition, Fourth Printing. Waverly Press, Inc. Maryland,
USA,1-15.Fletcher R. & Voke J. (1985) Defective Color Vision: Fundamentals, Diagnosis and Management. Adam Hilger
Ltd. Great Britain. P. 1, 35, 57, 276.
Goldstein E.B. (1989) Sensation and Perception. 3rd
Edition. California, USA. Wadsworth Publishing Company,
Inc, 122-125.
Glezer V.D., Leushina L.I, Nevskaya A.A. & Prazdnikova N.V.(1974) “Studies on Visual pattern recognition inMan and Animals”, Vision Research 14 553-583Ike E.E. & Jwanbot D.I. (2002) “Visual extraction of regular geometrical patterns in random background noise: A
possible visual and Military test”. African Journal of Natural Sciences. 5 20-29
Ishihara S. (1995) Ishihara’s Tests for Colour-Blindness, 24 Plates Edition. Kanehara Shuppan Co. Ltd. Japan. 1-
17
Judd D. B. (1966) “Fundamental Studies of Colour Vision from 1860 to 1960” Proceedings of the National
Academy of Sciences of the United States of America. 55 (6) 1313-1330.
Khan A.A., Rizvi A.A, & Zubairy M.S. (1994) “Colored Pattern Recognition with a neural network model”
Applied Optics, (33) 23, 5467-5471.
Kelton J.F., Holmes S.K. & Pollack R.H. (1978) “Visual Acuity for Single Lines as a Function of Hue and Age”
Child Development. 49 (1), 141-145.
Kilborn L.G. & Beh Y.T. (1934) “The incidence of Color-Blindness Among the Chinese” Science. (79) 2037, 34.
Lennie P. (1984) “Recent Developments in the Physiology of Color Vision” Trends in Neuroscience. 7(117):243-248.
Levi L. (1980). Applied Optics. A Guide to Optical System Design. volume 2 John Wiley & Sons, New York. pp
345,357
Longhurst R.S. (1973) Geometrical and Physical Optics. London, Longman Group Limited, 432.
Maximov V.V.(2000) “Environmental Factors which may have led to the appearance of Colour Vision” Philosophical Transactions of the Royal Society of London. (355) 1401, 1239-1242.
Shuey A.M. (1936) “The Incidence of Color-Blindness among Jewish males” Science. (84) 2175, 228.
Squire T.J., Rodriguez-Carmona M., Evans A. D. B. & Barbur J. L. (2005) “Color Vision Tests for Aviation:
Comparison of the Anomaloscope and Three Lantern Types” Aviation, Space and Environmental Medicine 76(5),
421- 429.
Songden S.D. and Ike E.E. (2004) “A Comparative Determination of Visual Acuity using Different Test Targets”
Zuma Journal of. Pure and Applied Sciences. 6(2): 157-159.
Songden S.D. and Ike E.E. (2010) “Determination of Colour Vision Using Ishihara and Dvorine Plates” Journal of Medicine in the Tropics. 12, 14-17


![Proposed General Direction - Impaired Colour Vision · Impaired Colour Vision GD/VIS/01/2013.1 of [DATE] 2013 Description of the proposed Impaired Colour Vision GD: Page 1 ... is](https://static.documents.pub/doc/80x56/5ca4e23c88c99313358c1701/proposed-general-direction-impaired-colour-vision-impaired-colour-vision-gdvis0120131.jpg)


