+ All Categories
Home > Documents > {COM(2015) 120 final} {SWD(2015) 51 final}...

{COM(2015) 120 final} {SWD(2015) 51 final}...

Date post: 14-Sep-2018
Category:
Upload: trananh
View: 222 times
Download: 0 times
Share this document with a friend
91
EN EN EUROPEAN COMMISSION Brussels, 9.3.2015 SWD(2015) 54 final COMMISSION STAFF WORKING DOCUMENT Report on the implementation of the Water Framework Directive River Basin Management Plans Member State: GREECE Accompanying the document COMMUNICATION FROM THE EUROPEAN COMMISSION TO THE EUROPEAN PARLIAMENT AND THE COUNCIL The Water Framework Directive and the Floods Directive: Actions towards the 'good status' of EU water and to reduce flood risks {COM(2015) 120 final} {SWD(2015) 50 final} {SWD(2015) 51 final} {SWD(2015) 52 final} {SWD(2015) 53 final} {SWD(2015) 55 final} {SWD(2015) 56 final}
Transcript

EN EN

EUROPEAN COMMISSION

Brussels, 9.3.2015

SWD(2015) 54 final

COMMISSION STAFF WORKING DOCUMENT

Report on the implementation of the Water Framework Directive River Basin

Management Plans

Member State: GREECE

Accompanying the document

COMMUNICATION FROM THE EUROPEAN COMMISSION TO THE EUROPEAN

PARLIAMENT AND THE COUNCIL

The Water Framework Directive and the Floods Directive: Actions towards the 'good

status' of EU water and to reduce flood risks

{COM(2015) 120 final}

{SWD(2015) 50 final}

{SWD(2015) 51 final}

{SWD(2015) 52 final}

{SWD(2015) 53 final}

{SWD(2015) 55 final}

{SWD(2015) 56 final}

2

TABLE OF CONTENTS

1. GENERAL INFORMATION ........................................................................................................................ 4

2. STATUS OF RIVER BASIN MANAGEMENT PLAN REPORTING AND COMPLIANCE ....................................... 7

3. GOVERNANCE ........................................................................................................................................ 9

3.1 TIMELINE OF IMPLEMENTATION ....................................................................................................................... 9

3.2 ADMINISTRATIVE ARRANGEMENTS - RIVER BASIN DISTRICTS AND COMPETENT AUTHORITIES ......................................... 9

3.3 RBMPS - STRUCTURE, COMPLETENESS, LEGAL STATUS ...................................................................................... 10

3.4 CONSULTATION OF THE PUBLIC, ENGAGEMENT OF INTERESTED PARTIES ................................................................. 11

3.5 COOPERATION AND COORDINATION WITH THIRD COUNTRIES ............................................................................... 11

3.6 INTEGRATION WITH OTHER SECTORS ............................................................................................................... 13

4. CHARACTERISATION OF RIVER BASIN DISTRICTS ................................................................................... 14

4.1 WATER CATEGORIES IN THE RBD................................................................................................................... 14

4.2 TYPOLOGY OF SURFACE WATERS .................................................................................................................... 14

4.3 DELINEATION OF SURFACE WATER BODIES ....................................................................................................... 15

4.4 IDENTIFICATION OF SIGNIFICANT PRESSURES AND IMPACTS .................................................................................. 16

4.5 PROTECTED AREAS ...................................................................................................................................... 21

5. MONITORING ...................................................................................................................................... 21

5.1 GENERAL DESCRIPTION OF THE MONITORING NETWORK ..................................................................................... 21

5.2 MONITORING OF SURFACE WATERS ................................................................................................................ 23

5.3 MONITORING OF GROUNDWATER .................................................................................................................. 24

5.4 MONITORING OF PROTECTED AREAS............................................................................................................... 29

6. OVERVIEW OF STATUS (ECOLOGICAL, CHEMICAL, GROUNDWATER) ..................................................... 31

7. ASSESSMENT OF ECOLOGICAL STATUS OF SURFACE WATERS ................................................................ 49

7.1 ECOLOGICAL STATUS ASSESSMENT METHODS ................................................................................................... 49

7.2 APPLICATION OF METHODS AND ECOLOGICAL STATUS RESULTS ............................................................................ 54

8. DESIGNATION OF HEAVILY MODIFIED WATER BODIES (HMWB) AND ASSESSMENT OF GOOD

ECOLOGICAL POTENTIAL .............................................................................................................................. 56

8.1 DESIGNATION OF HMWBS .......................................................................................................................... 56

8.2 METHODOLOGY FOR SETTING GOOD ECOLOGICAL POTENTIAL (GEP) .................................................................... 60

8.3 RESULTS OF ECOLOGICAL POTENTIAL ASSESSMENT IN HMWB AND AWB.............................................................. 60

9. ASSESSMENT OF CHEMICAL STATUS OF SURFACE WATERS ................................................................... 61

9.1 METHODOLOGICAL APPROACH TO THE ASSESSMENT .......................................................................................... 61

10. ASSESSMENT OF GROUNDWATER STATUS ........................................................................................ 63

10.1 QUANTITATIVE STATUS ................................................................................................................................ 63

10.2 GROUNDWATER CHEMICAL STATUS ................................................................................................................ 64

10.3 PROTECTED AREAS ...................................................................................................................................... 65

11. ENVIRONMENTAL OBJECTIVES AND EXEMPTIONS ............................................................................. 67

11.1 ADDITIONAL OBJECTIVES IN PROTECTED AREAS ................................................................................................. 67

3

11.2 EXEMPTIONS ACCORDING TO ARTICLE 4(4) AND 4(5) ........................................................................................ 67

11.3 EXEMPTIONS ACCORDING TO ARTICLE 4(6) ..................................................................................................... 70

11.4 EXEMPTIONS ACCORDING TO ARTICLE 4(7) ..................................................................................................... 70

11.5 EXEMPTIONS TO GROUNDWATER DIRECTIVE.................................................................................................... 72

12. PROGRAMMES OF MEASURES .......................................................................................................... 73

12.1 PROGRAMME OF MEASURES – GENERAL ......................................................................................................... 73

12.2 MEASURES RELATED TO AGRICULTURE ............................................................................................................ 75

12.3 MEASURES RELATED TO HYDROMORPHOLOGY .................................................................................................. 79

12.4 MEASURES RELATED TO GROUNDWATER ......................................................................................................... 82

12.5 MEASURES RELATED TO CHEMICAL POLLUTION ................................................................................................. 83

12.6 MEASURES RELATED TO ARTICLE 9 (WATER PRICING POLICIES) ............................................................................ 84

12.7 ADDITIONAL MEASURES IN PROTECTED AREAS .................................................................................................. 85

13. CLIMATE CHANGE ADAPTATION, WATER SCARCITY AND DROUGHTS, FLOOD RISK MANAGEMENT AND

OTHER EMERGING AND LINKED ISSUES AS PART OF THE RBMP .................................................................... 87

13.1 WATER SCARCITY AND DROUGHTS ................................................................................................................ 87

13.2 FLOOD RISK MANAGEMENT ......................................................................................................................... 87

13.3 ADAPTATION TO CLIMATE CHANGE ................................................................................................................ 88

14. RECOMMENDATIONS ....................................................................................................................... 89

4

1. GENERAL INFORMATION

Figure 1.1: Map of River Basin Districts

International River Basin Districts (within EU)

International River Basin Districts (outside EU)

National River Basin Districts (within EU)

Countries (outside EU)

Coastal Waters

Source: WISE, Eurostat (country borders)

Greece has a population of 11 million1 with a high concentration in the Athens metropolitan

area, and a total surface area of 131,957 square km.2 It is located in the southern extremity of

the Balkan peninsula in south-east Europe. Its territory includes more than 2,000 islands in the

Aegean and Ionian seas. Mount Olympus is the highest point in the country.

1 Eurostat data for 2014.

2 Greece country fiche (http://europa.eu/about-eu/countries/member-countries/greece/index_en.htm)

5

Greece has 14 River Basin Districts (RBDs) (see Table 1.1. below). The two largest ones are

the Western Macedonia RBD (GR09) covering 13,585 km2 and the Thessalia (GR08)

covering 13,153 km2. Two of the RBDs, namely Aegean Islands (GR14) and Crete (GR13)

cover islands, while 6 more (Northern Peloponese-GR02, Western Sterea Ellada-GR04,

Epirus-GR05, Attica-GR06, Eastern Sterea Ellada-GR07 and Thrace-GR12) cover both

mainland and island areas.

The following overview is provided regarding the shared transboundary catchment with

MS/third countries (see Table 1.2 below):

With Albania: Lake Prespa Basin (Part of Drin/Drim sub-basin) (GR09), Aoos/Vjosa

River Basin (GR05);

With Bulgaria: Mesta-Nestos River Basin (GR12), Struma-Strymonas River Basin

(GR11), Maritsa-Evros-Meric River Basin (GR12), Axios/Vardar River Basin

(GR10);

With the former Yugoslav Republic of Macedonia: Lake Prespa Basin (Part of

Drin/Drim sub-basin) (GR09), Axios/Vardar River Basin including the Doirani Lake

Basin (GR10), Struma-Strymonas River Basin (GR11); and,

With Turkey: Maritsa-Evros-Meric River Basin (GR12).

RBD Name Size* (km2) Countries sharing borders

GR01 Western Peloponnese 7,235 -

GR02 Northern Peloponnese 7,418 -

GR03 Eastern Peloponnese 8,442 -

GR04 Western Sterea Ellada 10,432 -

GR05 Epirus 10,007 AL

GR06 Attica 3,139 -

GR07 Eastern Sterea Ellada 12,268 -

GR08 Thessalia 13,153 -

GR09 Western Macedonia 15,218 AL, FYROM

GR10 Central Macedonia 14,264 BG, FYROM

GR11 Eastern Macedonia 7,320 BG, FYROM

GR12 Thrace 11,242 BG, TR

GR13 Crete 8,301 -

GR14 Aegean Islands 9,118 -

Table 1.1: Overview of Greece’s River Basin Districts

* Area in Greek territory

Source: River Basin Management Plans reported to WISE3: http://cdr.eionet.europa.eu/be/eu/wfdart13

3 This report reflects the corrections submitted by EL in late 2014. There are some discrepancies between the

information reported in the RBMPs and the information provided by EL/submitted to WISE.

6

Name international

river basin

National

RBD

Countries

sharing

borders

Co-ordination category

2 3 4

km² % km² % km² %

Lake Prespa (Part of

Drin/Drim Sub-basin) GR09 AL, MK 347 25.1

Aoos/Vjosa GR05 AL 2,154 33.0

Mesta-Nestos GR12 BG 2,429 42.3%

Struma-Strymonas GR11 BG, FYROM 6,295 36.5%

Maritsa-Evros_Meric GR12 BG, TR 3,345 6.3%

Axios/Vardar GR09 FYROM, BG 863 3.9

Axios/Vardar GR10 FYROM, BG 1,636 7.3

Table 1.2: Transboundary river basins by category (see CSWD section 8.1) and % share in Greece4.

Category 1: Co-operation agreement, co-operation body, RBMP in place.

Category 2: Co-operation agreement, co-operation body in place.

Category 3: Co-operation agreement in place.

Category 4: No co-operation formalised.

Source: EC Comparative study of pressures and measures in the major river basin management plans in the EU.

Note: the area figures (km2) refer to the actual hydrological catchment of the respective river (i.e. not the RBD

area, nor the respective WFD river basin area which both contain additional small catchments grouped with the

actual river catchment)

4 Categorisation determined under the EC Comparative study of pressures and measures in the major river

basin management plans in the EU (Task 1b: International co-ordination mechanisms).

7

2. STATUS OF RIVER BASIN MANAGEMENT PLAN REPORTING AND COMPLIANCE

At the time of drafting the current report, Greece had adopted 12 RBMPs (GR01, 02, 03, 04,

05, 06, 07, 08, 09, 10,11, 12), which have also been fully reported in WISE (along with the

accompanying Annexes) and thus the current report only considers those (see Table 2.1

below). In late 2014, in the context of a bilateral meeting between Commission Services and

Greek authorities, some additions and corrections to specific tables of this report were

provided, which have been incorporated.

The drafting of the RBMPs was commissioned to different consultants and coordinated by the

Ministry of Environment, Energy and Climate Change – Special Secretariat for Water (EGY)

assisted by a “coordinator consultant”. A general national approach has been followed, yet it

is evident that RBMPs’ implemented approaches and structures present commonalities within

the plans assigned to the same consultant, and differences across the background documents

(Annexes) of the plans assigned to different consultants. Thus, the following groups can be

observed: GR01/02/03, GR04/05/08, GR06/07, GR09/10, GR11/12. The role of the

“coordinator consultant” was to support the EGY and provide expertise and guidelines (also

in the form of guidance documents, which were nevertheless not officially published) for the

streamlining and harmonisation of the process.

One of the main shortcomings of the Greek RBMPs is that they have been delayed due to a

number of factors which relate to technical issues, as well as legislative and administrative

barriers and socio-economic constraints. Consequently, time to implement the suggested

Programme of Measures (PoMs) by 2015 and revise the plans for the second WFD cycle

(considering and embedding the effects of the measures) is very tight. Nevertheless EL has

specified that implementation of a great number of measures included in the PoMs had started

before the approval of the RBMPs (detailed information on this aspect is reported by EL to be

available in the PoM-Implementation Progress Report – national level, due in December 2012

but submitted to the COM in late 2014, and uploaded on WISE on 22.01.2015; the contents of

that Progress Report has not been assessed yet and therefore is not taken into account in this

report).

Another significant problem with the RBMPs was the lack of WFD-compliant data. The

information used for the various assessments was based on the old monitoring network which

was obsolete (with regard to the WFD required data) and the time-series fragmented and

incomplete. Thus, the embedded uncertainty in the characterisation is judged significant, and

in some cases it is not transparent how water bodies have been classified as “good” status

(given the lack of complete information), as opposed to “unknown” status, since the

characterisation is based on limited data and assumptions.

The new National Monitoring Programme (NMP), according to the WFD requirements, has

been established late in the process (in 2012) and it is mentioned that it will furnish the

necessary data for the revision and update of the RBMPs in the second cycle. Yet, the RBMPs

have proposed some modifications with regard to the sites and parameters of the NMP based

on their current findings, which essentially resulted from the new typology using system B (as

opposed to the original typology using system A back in 2011 when the NMP was designed,

see section 5.1 below). These suggestions have not been taken up yet by the Special

Secretariat for Water, and would in some cases require additional financial resources (i.e.

when supplementary sites are proposed). It is stated by EL that the NMP will be updated for

the planning period 2016-2021, taking into account all available data and information from

8

the RBMPs and of course the proposed modifications in each RBD. After the adoption of the

RBMPs for all of the country’s RBDs and a cost-effectiveness analysis in relation to the

financial resources already allocated for the planning period 2016-2021, the Special

Secretariat for Water will propose a new updated National Monitoring Network to be

consulted on with all involved national and regional authorities, within 2015. The new

updated National Monitoring Network will be defined in an amendment of the JMD

140384/9-9-2011.

With regard to harmonisation and common approaches across the RBMPs, a national

coordination programme was in place, yet it is not clearly reflected that all RBMPs

implemented exactly the same approaches (e.g. on issues with small water bodies, definition

of “significance” of pressures, assessment of groundwater quantitative status) when reading

the WISE summary reporting and the Annexes. The Annexes themselves are very different in

structure and content (for the same topics) which confuses the reader. A common structure

and content across the RBMPs’ Annexes would have increased transparency and

understanding.

Finally, a common approach to ensure adequate incentives for efficient use and an adequate

contribution from different users was not in place (Art. 9). Moreover, economic analysis

varied across the RBMPs, partly due to missing information. It is planned that the

methodologies for the economic analysis will be increasingly harmonised in the second and

future cycles of review of the RBMPs.

An important strength for the Greek RBMPs is that all underwent strategic environmental

assessment (SEA). Another added value is the parallel development of a Drought & Water

Scarcity Management Plan (DMP) for each RBD. In most cases the specific sub-units or

specific river basins are looked at separately. Quantity issues are discussed in the RBMPs and

some measures related to quantity management have been identified in the PoMs. The links

between the RBMPs and the DMPs should be further strengthened and the DMPs should be

further developed into fully operational plans complementing the RBMPs.

RBD RBMP Date of Adoption RBMP Date of

Reporting*

GR01 08/04/2013 13/09/2013

GR02 08/04/2013 13/09/2013

GR03 08/04/2013 13/09/2013

GR04 18/09/2014 05/12/2014

GR05 04/09/2013 28/01/2014

GR06 08/04/2013 05/09/2013

GR07 08/04/2013 05/09/2013

GR08 18/09/2014 05/12/2014

GR09 30/01/2014 25/09/2014

GR10 30/01/2014 25/09/2014

GR11 04/09/2013 19/03/2014

GR12 04/09/2013 12/02/2014

GR13 Pending

GR14 Pending

Table 2.1: Adoption and reporting to the Commission of Greece’s RBMPs.

Source: RBMPs and CDR. *Latest date of WISE reporting including all annexes and background documents.

9

3. GOVERNANCE

3.1 Timeline of implementation

The dates of publication of RBMP preparatory documents are provided in Table 3.1.1 below;

these are behind the due dates set in Art. 14 of the WFD.

RBD Timetable Work

programme

Statement on

consultation

Significant water

management

issues

Draft RBMP Final

RBMP

Due dates 22/06/2006 22/06/2006 22/06/2006 22/12/2007 22/12/2008 22/12/2009

GR01 05/04/2013 05/04/2013 05/04/2013 05/04/2013 05/04/2013 08/04/2013

GR02 05/04/2013 05/04/2013 05/04/2013 05/04/2013 05/04/2013 08/04/2013

GR03 05/04/2013 05/04/2013 05/04/2013 05/04/2013 05/04/2013 08/04/2013

GR04 01/11/2011 01/02/2012 05/04/2013 04/09/2013 30/10/2013 18/09/2014

GR05 01/11/2011 01/02/2012 05/04/2013 04/09/2013 04/09/2013 04/09/2013

GR06 30/08/2010 13/04/2011 03/05/2012 13/01/2012 03/05/2012 08/04/2013

GR07 30/08/2010 13/04/2011 03/05/2012 13/01/2012 03/05/2012 08/04/2013

GR08 01/11/2011 01/02/2012 05/04/2013 04/09/2013 30/10/2013 18/09/2014

GR09 15/06/2011 27/04/2012 30/07/2012 30/07/2012 01/02/2013 30/01/2014

GR10 15/06/2011 27/04/2012 30/07/2012 30/07/2012 01/02/2013 30/01/2014

GR11 30/08/2010 09/08/2010 15/10/2011 18/11/2011 07/05/2012 04/09/2013

GR12 30/08/2010 09/08/2010 15/10/2011 18/11/2011 07/05/2012 04/09/2013

GR13 - - - - - Pending

GR14 - - - - - Pending

Table 3.1.1: Timeline of the different steps of the implementation process

Source: WISE (for all columns except “Final RBMP”) and DG Environment web page:

http://ec.europa.eu/environment/water/participation/map_mc/countries/greece_en.htm (for “Final RBMP”

column).

3.2 Administrative arrangements - river basin districts and competent authorities

At a decentralised level, Greece is managed by 7 Decentralised Administrations, 13 self-

governed Regions, and 325 Municipalities. This restructuring of the decentralised state

structure in Greece (called “Kallikratis”) was implemented in 2010 and has created some

confusion regarding the roles and functioning of various state institutions and difficulties on

various topics including water management.

With regard to the development of the RBMPs, the national competent authority is the

"Special Secretariat for Water" (under the Ministry of Environment, Energy and Climate

Change), based on the Presidential Decree 24/2010 OJ A 56/15.04.2010 and Law 3199/2003,

which has the following responsibilities: coordination of water management issues;

implementation of the WFD; monitoring of water quality and quantity; management and reuse

of wastewater; floods management. Furthermore, the main competencies of the Secretariat are

described in WISE 1.1. The decentralised administrations (Regional Water Directorates) are

responsible for the river basin districts. However, for the first round of the RBMPs they

signed off their responsibility for the drafting of the plans to the EGY, but they were involved

and contributed to the final formulation of the PoMs at the regional level; they are the ones

responsible for implementing the plans. The RBMPs specifically state that “the RBMPs of

Greece are developed under the responsibility of the competent authorities for each RBD.

Based on a request by their Secretaries, the Special Secretariat for Water took over the

development of the RBMPs, which then were commissioned to consultants”. Nevertheless,

10

other authorities including regional, municipal, and local authorities from other sectors have

contributed under topics of their expertise and interest.

Finally, in the relevant Annexes on those “responsible for specific aspects of water

management”, long lists of additional authorities are presented showing how complex the

overall setup is. With regard to the main next steps and difficulties, the RBMPs mention that

many of the “responsible authorities” at the regional level are not sufficiently staffed, so they

are in danger of not fully covering their responsibilities. Additionally, the fact that the RBMPs

were commissioned to consultants may have limited the Regional Water Directorates’

opportunities to gain further insight into WFD issues and experience. Capacity building has

nevertheless been undertaken through seminars organised by the EGY.

As mentioned above, the drafting of the RBMPs was commissioned to different consultants

and coordinated by the EGY. A general national approach has been followed. There are some

differences in terms of the methodologies and available data that were used among the

different groups of the consultants e.g. the GR01/02/03 plans were compiled by one team, the

GR04/05/08 plans by another, GR06/07 plans by a third team, GR09/10 plans by a fourth and

GR11/12 plans by a fifth. However, as the Special Secretariat for Water coordinated all the

teams there are several common specifications. There were no main changes announced or

implemented after the submission of the RBMPs (corrections dealt with clarifications or

typos).

3.3 RBMPs - Structure, completeness, legal status

In general the structure of the RBMPs follows the specifications of the WFD. In terms of

clarity there are certain issues regarding the implementation of the methodology that is

described in the relevant chapters of the RBMPs. In some cases it is not very clear whether

and how a specific methodology, e.g. for assessing the water bodies, is applied. The different

RBMPs have the same structure and content, but are accompanied by numerous Annexes, and

harmonisation of structure and content is missing across them, thus confusing the assessment.

In terms of completeness, it is explicitly mentioned on several occasions that there was

insufficiency of available data and supporting studies/surveys for the assessment of water

bodies. It is mentioned that in cases where no data were available, the assessment was done

through expert judgment and/or through grouping of water bodies with similar types and

levels of pressures, and thus the level of uncertainty was characterised as large. An

improvement of the data quality and the water bodies’ assessment can only be addressed

through the implementation of the National Monitoring Program that was defined with the

Common Ministerial Decree 140384/9-9-2011. It was originally foreseen that the new

network programme would provide the first monitoring results at the end of 2013. This new

data would be used to improve the knowledge of the water bodies’ status and thus the

completeness of the RBMPs in the next cycle. No links to any international plans are

referenced within the RBMPs.

Out of the 14 RBMPs, 12 of them have been approved and embedded into the National Law,

while the remaining 2 are in the process of compilation and consultation. For the approved

RBMPs the relevant Strategic Environmental Assessments/Environmental Impact

Assessments (SEA/EIAs) have been approved as well and are publicly available. The 12

officially approved RBMPs should implement the Programmes of Measures in the following

very short period as the second round of revised Plans should be submitted by 2015,

according to the WFD, taking into account the implementation of the first RBMPs.

11

3.4 Consultation of the public, engagement of interested parties

Regarding the RBMPs of GR01/02/03/09/10 there was a critical assessment expressed in a

rather “positive” way about most consultation activities (in WISE 1.3.6), mentioning that:

“Unprecedented for the Greek situation was the less than expected participation of the

public”. A “results of the participation” document was submitted along with the relevant

RBMPs. Regarding the consultation procedures, in the RBMPs of GR04/05/06/07/08/11/12,

the consultation document does not refer to the activities that took place, but is a “planning

document” for the activities that should/would take place. According to WISE 1.3.6, the main

activities include: (a) publication and commenting of the public participation plan, involved

stakeholders, Significant Water Management Issues report; (b) publication and commenting

of the RBMP; (c) publication and commenting of the SEA/EIA; (d) informational meetings

and (e) 39 stakeholder conferences/workshops (attended by 3,500 participants in total as

stated by the EGY). Moreover the EGY has set up an interactive internet site

http://wfd.ypeka.gr where the full content of the RBMPs is available and which facilitated the

submission of comments by interested stakeholders. The consultation can be assessed as

adequate but “improvable” in terms of stakeholders’ participation (almost 450 written

comments/interventions were received through questionnaires and the consultation website)

and input.

It is difficult to describe the impact of the consultation on the final plans, since the document

“results of the participation” was not submitted (however it is reported by EL as available in

the EGY). A “general list of comments was received” during the consultation workshops but

it cannot be inferred from the RBMP itself whether these comments were actually taken under

consideration and were incorporated in the newer RBMPs version. It is stated by the EGY that

they have been considered and incorporated. Most of the comments originated either from the

scientific community or from other institutions, organisations, etc.

There was no active continuous involvement of stakeholders and the general public but rather

limited participation in certain consultation workshops. In general the consultation can be

assessed as not very successful in terms of stakeholder participation and input.

3.5 Cooperation and coordination with third countries

For GR05 there has not been international coordination on public participation and active

involvement of interested parties. In practice, in Albania (where the Aoos River Basin

extends), the decisions of the National Water Council (NWC) and the respective local

authorities have not been implemented; thus the competent national and local authorities do

not fully operate. Both in WISE and in the RBMP there is no specific reference to existing or

planned coordination on public participation5.

For GR09, one part of the Prespa Basin and a sub-basin of Axios River extend geographically

in the neighboring countries of FYROM and Albania; thus these basins are transboundary.

However, there are no International RBMPs, as these countries are not EU MS; and thus not

obligated to submit these Plans. Regarding the Axios River Basin, there is no border co-

operation established for the integrated water resources management. Regarding the Prespa

Basin there has been an international agreement between the three countries (Greece, Albania

& FYROM) on the protection and sustainable development of the Prespa National Park.

5 According to Greece, the Albanian authorities have been invited during the RBMP consultation process.

12

Additionally, a Coordination Commission was formed for the protection of the Park on

27/11/2009 and an International Agreement was signed on 02/02/2010 among the Ministers of

Environment of the three countries and the EC Commissioner for the Environment.

Furthermore, there has been recent mobility in international cooperation regarding the

integrated water resources management in cross-border areas on 25/01/2012, followed by

further meetings in June 2012 and May 2013 (both for Prespa and Axios Basin). Several

actions and programmes have been implemented in the sub-basin of Prespa with the

cooperation of Albania and FYROM. Also a working group has been established from 2006

for the monitoring and protection of the Prespa Basin. This group has organised four (4)

meetings so far.

For GR10, one part of the Strimonas River Basin extends geographically in the neighboring

country of Bulgaria, thus this basin is a transboundary one. However, there has not been an

International RBMP, as Bulgaria had already submitted its RBMP to the EC before Greece.

Thus, for the first round of the Plans, these are separate for the two countries. However, since

27th

July 2010, there has been a common Announcement of the two responsible Ministries

(i.e. the Hellenic Ministry of Environment, Energy and Climate Change and the Bulgarian

Ministry of Environment and Water Resources). The Announcement confirmed the intention

of the two countries to cooperate in the water resources management issues in the

transboundary basins. For this purpose, the Joint Expert Working Group was established. The

Group initially met in Drama on 16th

May 2011, in Sofia on 12th

October 2011 and in

Thessaloniki on 23rd

April 2013. Recently there has been a Joint Declaration of the competent

Ministers of Greece and Bulgaria regarding the intention of cooperation between the two

countries on issues of transboundary basin management.

For GR11 and GR12 there has been no international coordination on public participation and

active involvement of interested parties, as Bulgaria submitted its RBMP to the EC before

Greece, while Turkey is not a MS and thus not obligated to submit Plans. For GR05/11/12

there have not been any international RBDs designated and no international RBMPs adopted.

For GR11, in spite of the fact that there has not been full international coordination between

Greece and Bulgaria, from 27th

July 2010, there has been a Joint Declaration between the

Hellenic Ministry of Environment, Energy and Climate Change and the Bulgarian Ministry of

Environment and Water Resources regarding the use of water resources in the territories of

shared river basins. The Joint Declaration confirmed the intention of the two countries to

cooperate in the water resources management issues in the transboundary basins. For this

purpose, the Joint Expert Working Group was established; the Group initially met in Drama

on 16th

May 2011, then in Sofia on 12th

October 2011, in Thessaloniki on 23rd

April 2013 and

in Athens on 8th

May 2014. As regards the public participation there has been no international

coordination between the two countries. For GR12, in spite of the fact that there has not been

full international coordination between Greece, Bulgaria and Turkey, regarding the

cooperation with Bulgaria, there has been a series of negotiations that started in 1965 and

resulted in an Agreement between Greece and Bulgaria that was signed in 1995, certified with

the Greek Law 2402/96, Government Gazette (GG/A/98) and has 8 Articles. As with GR11,

the cooperation of the two countries was enhanced on 27th

July 2010 with the Joint

Declaration of the two responsible Ministries (see further details above). Additionally,

regarding the cooperation with Turkey, an Ad Hoc Joint Committee has been established in

November 2010 in respect to cooperation issues for the Evros River Basin. The Committee

initially met on 30th

May 2011. In this framework, the Joint Expert Working Group was

established in order to exchange data and information for the Evros River and the relevant

sub-basins in Greece and Turkey. The Joint Expert Working Group has met twice, in

13

Adrianoupolis on 24th

June 2011 and in Alexandroupolis on 8th

September 2011. It should

also be mentioned that both the Greek and the Turkish sides give a great deal of emphasis on

a common management response to the flood issues of Evros, a subject of Greek terms

associated with the implementation of the corresponding Directive 2007/60/EC on flood risk

management in the EU. As regards the public participation there has been no international

coordination between the interested countries.

3.6 Integration with other sectors

The links with 10 national sectoral plans were analysed in the SEAs which accompanied the

RBMPs (e.g. National Plan for Rural Development 2007-2013). The Directorate for Spatial

Planning and the Ministry of Rural Development were among the stakeholders that have sent

written comments on RBMPs and the respective SEAs. There are some cases, such as the

regional development plans, which are in the process of compilation and might have been

linked or used information from the approved RBMPs but this is not currently established, as

these plans are not fully completed yet. No links with agricultural plans are apparent in the

RBMPs.

14

4. CHARACTERISATION OF RIVER BASIN DISTRICTS

4.1 Water categories in the RBD

The RBDs reviewed in the current report include all water systems and their classification

into four categories according to the requirements of the WFD (rivers, lakes, transitional and

coastal waters, groundwater). According to Annex II of the WFD, categorisation of surface

water bodies apart from the four above categories include the identification of Heavily

Modified Water Bodies (HMWB) as well as artificial water bodies (AWB).

4.2 Typology of surface waters

The Presidential Decree 51/2007 “Establishment of measures and procedures for integrated

protection and management of water in compliance with the provisions of the Water

Framework Directive 2000/60/EC” defines in Annex II that both systems A and B could be

used in the characterisation of surface water bodies. In the Greek RBMPs, system B has been

applied for all the water categories. It is to be noticed that previously, in 2009, in response to

the obligations of Art. 8 of the WFD, system A was used. In the current RBMPs there was a

switch to system B (all obligatory descriptors for system B have been used), which resulted in

the modification of the number, boundaries and characteristics of the surface water bodies.

Overall the surface water typology has been validated with biological data. For river water

bodies it was based solely on benthic macroinvertebrates, for lakes on phytoplankton and for

coastal and transitional water bodies on macroinvertebrates, phytoplankton and macroalgae.

In general, reference conditions have been established for each of the surface water types with

the exception of the transitional waters where the work on reference conditions is at an early

stage and the information provided so far is indicative until intercalibration is finalised. The

methodology used was based both on spatially based methods, as well as on expert

judgement. It is unclear from the RBMPs and Annexes (provided as background documents)

how much expert judgement was used. In terms of a national Guidance Document, guidelines

were formulated by the coordinator consultant and the General Secretariat for Water to guide

and harmonise the work and methodological approach of all other consultants who were

commissioned with the drafting of the RBMPs, but these were not organised into a detailed

guidance document.

The number of surface water types that have been defined in different water categories is

summarised in Table 4.2.1.

15

RBD Rivers Lakes Transitional Coastal

GR01 6 1 2 1

GR02 6 4 2 1

GR03 5 1 2 1

GR04 8* 3* 2* 1*

GR05 8 3 2 1

GR06 1 1 0 1

GR07 5 1 1 1

GR08 8* 2* 0* 1*

GR09 10 4 2 1

GR10 7 4 2 1

GR11 6 2 1 1

GR12 7 2 2 1

GR13 No data reported in WISE

GR14 No data reported in WISE

Table 4.2.1: Surface water body types at RBD level Source: WISE; * corrections/additions provided by EL late 2014.

4.3 Delineation of surface water bodies

The river delineation process excluded from the first step ephemeral streams, where 95% of

the time there is no presence of water in them and neither is any aquatic environment present.

After this exclusion the initial water bodies selection was performed on the basis of the

Strahler stream classification index. Only streams of the 4th

order and above are initially

included in the set. This initial set is considered by definition to be comprised of “important

and discrete” elements of surface water, but not including all such elements. Additional water

bodies (which were initially excluded due to their ephemeral flow) were then added to this

initial set if deemed important elements in terms of aquatic ecosystem and fish population.

This assessment of importance of these small water bodies was made almost exclusively

based on expert judgment of scientists from the Hellenic Centre for Marine Research

(HCMR) taking into account biological data (fish and benthic invertebrates) where available.

In the RBMPs it is mentioned that an investigation was undertaken into whether small water

bodies can be aggregated with adjacent water bodies (aggregation was performed where

feasible and essential). Finally, further additions were made during the consultation process

where some additional streams to be included were indicated by local officials and scientists.

For example, in the RBMP of GR11 it is stated that during the public consultation, objections

were raised with regards to the inclusion of some small water bodies with ephemeral flow in

the sub-catchment of the Aggitis River, and thus the necessary adjustments were then

performed to exclude them.

The above clarifications were provided by EL since it does not clearly appear from the

RBMPs’ Annexes how the inclusion/exclusion of small water bodies has actually been

implemented (i.e. the specific criteria for defining what is termed as an “important” element

of water/ aquatic ecosystem are not clear in the RBMPs; the information on which small water

bodies have been joined with adjacent ones, or not joined, and/or not considered is not

obvious).

16

In the case of lakes, all lakes with a size greater than 0.5 km2 have been considered as surface

water bodies.

RBD

Surface Water Groundwater

Rivers Lakes Transitional Coastal

Number

Average

Length

(km)

Number

Average

Area

(sq km)

Number

Average

Area

(sq km)

Number

Average

Area

(sq km)

Number

Average

Area

(sq km)

GR01 110 8 2 2 5 1 11 95 26 262

GR02 63 11 6 5 9 2 19 127 26 284

GR03 80 7 1 1 6 1 13 206 27 299*

GR04 102* 10* 5* 26* 4* 68* 8* 273* 25* 410*

GR05 85 13 1 19 7 59 13 81 26 349

GR06 14 9 1 3 0 - 14 288 24 129

GR07 81 13 3 12 1 18 19 339 46 268

GR08 74* 19* 1* 35* 0* 0* 7* 134* 32* 392*

GR09 150 10 14 39 2 20 2 564 62 275

GR10 104 11 6 28 3 23 11 350 39 348

GR11 91 9 2 24 1 7 4 183 15 456

GR12 188 10 6 4 5 56 12 61 18 578

GR13 - - - - - - - - - -

GR14 - - - - - - - - - -

Total 1142 11 48 17 43 23 133 225 366 338

Table 4.3.1: Surface water bodies, groundwater bodies and their dimensions Source: WISE; * corrections/additions provided by EL late 2014.

4.4 Identification of significant pressures and impacts

Even though in certain RBDs limited information on methods for defining significant

pressures is available, the WISE summary report shows that determination of significant

pressures has been made for all of the RBDs. Table 4.4.1 gives an overall picture of the

significance of the different pressures within the country. These data indicate that diffuse

pollution is assessed as the most significant pressure in Greece, affecting 63% of surface

water bodies (802 SWBs) followed by point source pollution which affects 45% (520 SWBs).

“Other pressures” affect 17% (228 SWBs), and surface water abstraction affects 6% (74

SWBs) of surface water bodies. Additionally, pressures such as water flow regulations and

morphological alterations, other morphological alterations and river management are

allocated smaller percentages, i.e. 3% (42 SWBs), 0.3% (4 SWBs), and 1% (14 SWBs)

respectively.

An explicit identification of the criteria used to determine the significance of pressures is not

apparent in all the RBMPs, yet EL clarified that criteria (and the related thresholds) for

individual pressures (point and diffuse pollution, and water abstraction) were identified from

the limits contained in other relevant Directives, studies and research results found in

literature, and expert judgement as being likely to impact on water status.

Regarding point source pollution, some RBMPs (such as GR11/12) refer to the use of both

numerical tools and expert judgement in pressure analysis; however, they do not provide

details on the specific methods or criteria used. On the other hand,

GR01/02/03/05/06/07/09/10 identify specific thresholds that define significant pressures from

17

point source pollution (e.g. in GR05 the significance of pressure from industrial units was

based on the criterion of the type, size and number of units that relate to discharges of priority

substances and were classified as follows: N≥5 (high), 1≤N<5 (medium), N=0 (low)).

Regarding diffuse source pollution most RBDs (e.g. GR01/02/03/04/05/06/07/08/09/10) give

a summary table of criteria (related to type, size and pollution load) for all pressures, defining

specific levels of N, P and BOD concentrations as thresholds connected to diffuse pollution

(e.g. when BOD>10 mg/l, N>10mg/l and P >1mg/l the pressure is defined as significant).

Regarding abstraction pressures, generally in all RBDs a description of the pressures

considered and the methodology followed is mentioned (a mixture of actual numbers and

expert judgement). Criteria for assessing the significance of the pressure are available in

GR01, GR02, GR03, GR04, GR06 (only relevant for groundwater abstractions), GR07, GR08

GR09 and GR10. These criteria relate to the assessment of water exploitation, abstraction

volumes as percentage the natural annual and summer runoff volumes.

Regarding water flow regulation and hydromorphological alterations, overall all RBMPs

describe these pressures and a relevant analysis (a mixture of actual numbers and expert

judgement), but specific criteria to judge significance were not found in the background

documents. The most common hydromorphological pressures mentioned and analysed among

RBDs are: flood defence structures/dams, water reservoirs, modifications and diversions,

water transfers.

Further information provided by Greek authorities indicate that the criteria used are far from

comprehensive because, to a large extent, only main dams (higher than 15 m and considering

also the abstractions and the regulating capacity in relation to the river flow) have been

considered as significant hydromorphological pressure. It appears also that the main impact

that has been assessed is downstream of the dam, not necessarily considering the water bodies

where the dams are located and the upstream effects. This approach potentially overlooks

many smaller but significant hydromorphological pressures. This is likely the reason for the

very low percentages of water bodies reported as affected by hydromorphological pressures.

As regards pollution loads, the main conclusions for each RBD are summarised below:

GR01: the greatest individual point source pollution load comes from industrial units.

Important pollution is also produced from urban waste water, and notable BOD load is

produced by aquaculture.

GR02/03: the greatest point source pollution burden comes from industrial units.

Regarding diffuse pressures, livestock produces the largest amount of pollutants.

GR04: it is evident from the available data collected for point source pollution that the

increased pressure on water bodies comes from the Acheloos basin (GR15).

Significant point source pollution loads are mainly generated by the industrial units

and the stabled livestock. The greatest effect from non-point source pollution seems to

be related to the intense livestock activity in the region, as the organic load, the

nitrogen and phosphorus load is estimated to contribute over 90%, 80% and 50%

respectively, of the total load.

GR05: Significant point source pollution loads are mainly generated by industrial units

and stabled livestock. One of the major sources of non-point source pollution in the

area relates to livestock and agriculture. In particular, the greatest effect is associated

with intense livestock activity in the region, as the organic load, the nitrogen and

18

phosphorus load is estimated to contribute more than 90%, 80% and 60% of the total

load respectively.

GR06: it was concluded that the main pollution load is generated by the intense

industrial activity. Moreover, from the evaluation of quantitative estimates of diffuse

sources of pollution it was concluded that surface runoff from cropland and livestock

contribute significantly to pollution loads. The organic load due to untreated urban

sewage contributes more than 60% of the total organic load (BOD t/year), while the

effect of nitrogen and phosphorus load due to agricultural activity is greater (75% and

90% respectively).

GR07: the main pressures on surface water bodies come from the sectors of

agriculture, industry and livestock. From the assessment of quantitative estimates of

diffuse sources of pollution it can be concluded that surface runoff from agriculture

and livestock contributes significantly to pollution loads. The organic load due to

livestock contributes more than 78% of the total organic load, while the effect of

nitrogen and phosphorus load due to agricultural activity is greater (84% and 95%

respectively).

GR08: the increased pressure on the water bodies comes mainly from the river basin

of Pinios from various activities (urban waste water treatment plants, livestock

activity, industry, mining activities and uncontrolled dumpsites). Regarding the

pollution load from diffuse sources (mainly from agriculture and stable livestock

activity), the organic load and the nitrogen load resulting from livestock is over 90%

and 60% respectively, while greater is the influence of phosphorus load due to

agricultural activity (about 70%).

GR09/GR10: industrial activity together with livestock and agriculture are the greater

pressures within the water district. Quantitative estimates of diffuse sources show that

the surface runoff from cropland and livestock contribute significantly to pollutant

loads. The effect of nitrogen and phosphorus load due to agricultural activity is

significant. It is worth mentioning that the concentration of organic load is generated

mostly due to livestock activities, while nitrogen and phosphorus arise in farming and

agriculture. The mining activity that relates to water pollution is located mainly in the

region of Jerrissou, in the southeast of the water districts.

GR11/12: most of the pollution loads come from agriculture, livestock and urban

waste.

19

RBD No pressures Point source Diffuse source

Water

abstraction

Water flow

regulations

and

morphological

alterations

River

management

Transitional

and coastal

water

management

Other

morphological

alterations

Other

pressures

No. % No. % No. % No. % No % No. % No. % No. % No. %

GR01 - 0 88 69 128 100 10 8 0 0 0 0 0 0 0 0 32 25

GR02 - 0 48 49 97 100 18 19 0 0 0 0 0 0 0 0 39 40

GR03 2 2 63 63 98 98 4 4 0 0 0 0 0 0 0 0 37 37

GR04 53* 44* 54* 45* 41* 34* 11* 9* 17* 14* 5* 4* 4* 3* 0* 0 53 44

GR05 44 42 46* 42 44* 41 11* 9 8 8 0 0 5* 5* 0* 0* 44* 42*

GR06 5 17 23 79 19 66 0 0 0 0 0 0 0 0 0 0 0 0

GR07 20 19 67 64 74 71 5 5 0 0 0 0 0 0 4 4 0 0

GR08 13* 16* 55* 67* 62* 76* 2* 2* 2* 2* 7* 9* 0* 0* 0* 0* 13* 16*

GR09 115 68 28 17 25 15 0 0 0 0 0 0 0 0 0 0 0 0

GR10 51 41 26 21 67 54 1 1 0 0 0 0 0 0 0 0 0 0

GR11 40 41 17 17 52 53 10 10 6 6 0 0 0 0 0 0 0 0

GR12 114 54 5 2 95 45 2 1 9 4.27 2 1 0 0 0 0 10 5

GR13 - - - - - - - - - - - - - - - - - -

GR14 - - - - - - - - - - - - - - - - - -

Total 457 29 520 45 802 63 74 6 42 3 14 1 9 1 4 0,3 228 17

Table 4.4.1: Number and percentage of surface water bodies affected by significant pressures Source: WISE; * corrections/additions provided by EL late 2014.

20

Figure 4.4.1: Graph of percentage of surface water bodies affected by significant pressures

1 = No pressures

2 = Point source

3 = Diffuse source

4 = Water abstraction

5 = Water flow regulations and morphological alterations

6 = River management

7 = Transitional and coastal water management

8 = Other morphological alterations

9 = Other pressures Source: WISE

21

4.5 Protected areas

In Greece 1,615 protected areas have been designated, according to information provided to

WISE (see Table 4.5.1). Just over half of these areas (57%) are for bathing water, while 8% are

for drinking water abstraction under Art. 7 of the WFD. Another 10% are for habitats, birds and

fish altogether, 6.5% are for UWWTPs. With regard to the protected areas under Art. 7

abstraction for drinking water, out of the total 131 protected areas 85 are for groundwater (i.e.

65%) and the remaining 35% are for surface water.

RBD

Number of PAs

Art

icle

7

Ab

stra

ctio

n f

or

dri

nk

ing

wa

ter

Ba

thin

g

Bir

ds

Eu

rop

ean

Oth

er

Fis

h

Ha

bit

ats

Lo

cal

Na

tio

na

l

Nit

rate

s

Sh

ellf

ish

UW

WT

GR01 5 50 2 4 8 8

GR02 9 114 4 6 15 5 1

GR03 3 88 3 4 7 8 1

GR04 21* 60* 15* 22* 9* 25* 2* 12*

GR05 10 87 21 23 33 23 2 6

GR06 4 125 4 5 3 4

GR07 16 170 14 16 4 11

GR08 7* 67* 16* 13* 5* 1* 2*

GR09 17 11 11 6 22 2 2 23

GR10 4 84 9 15 1 4 6

GR11 15 23* 5 2 7 1 4 14

GR12 20 36 14 5 12 3 7 27

GR13 - - - - - - - - - - -

GR14 - - - - - - - - - - -

Total 131 915 118 0 27 165 42 74 21 17 105

Table 4.5.1: Number of protected areas of all types in each RBD and for the whole country, for surface and

groundwater6 Source: WISE; * corrections/additions provided by EL late 2014.

5. MONITORING

5.1 General description of the monitoring network

The monitoring programme for Greece has been defined in the Common Ministerial Decree

ΚΥΑ 140384/9-9-2011 while the standards and minimum performance criteria of the

analytical methods for the chemical analysis and monitoring have been defined in the

Common Ministerial Decree 38317/1621/Ε103/2011. According to the Ministerial Decree

6 This information corresponds to the reporting of protected areas under the WFD. More/other information

may have been reported under the obligations of other Directives.

22

140384/9-9-2011, the EGY is responsible for: i) the submission of the annual budget for the

operation of the NMP to the Ministry, ii) the monitoring at national level of the quantity and

quality of surface and groundwaters in cooperation with the Regional Water Directorates of

the Decentralised Administrations, iii) the development and operation of the national network/

grid. At the time that the RBMPs were being drafted, the new WFD monitoring programme

was not operational. Thus, the monitoring data used for the characterisation of the water

bodies in the RBMPs were based on the old fragmented monitoring network which had

significant data gaps with regard to the WFD-required assessment parameters.

The new National Monitoring Programme - NMP (established with the above mentioned

Ministerial Decree in 2011 and currently implemented from 2012 onwards) follows a

common national approach in terms of objectives, standards, definition of monitoring points,

responsible authorities, etc. The number, type and location of monitoring stations per water

body and the number, type and frequency of the sampling parameters are listed in the

Ministerial Decree. All these were originally defined in 2009 in response to the obligations of

Article 8 of the WFD, considering the state-of-the-art knowledge at that time and the results

of a relevant study commissioned by the General Secretariat for Water (which also defined

the water bodies, pressures and impacts) and were updated and finalised in 2010 in the

framework of the national project “Development and application of methods and software for

the assessment of the water quality related data of the Greek water bodies”. A total of 616

monitoring stations for surface water bodies are defined in the new programme for the whole

territory, and 1,387 for groundwater bodies. It is foreseen that the new network programme

will be updated periodically in order to better meet the systems’ needs based on the first

monitoring results (originally expected at the end of 2013) and the findings of the current

RBMPs.

In the RBMPs the typology used for the characterisation of the water bodies changed with

regard to the system that was used back in 2008-2009 (shifting from system A to system B).

This resulted in the modification of the number, boundaries and characteristics of the water

bodies, and the subsequent need to perform a new matching between the established

monitoring points of the Ministerial Decree and the latest defined water bodies (in the

RBMPs). The matching has been performed, but also additional information from the

neighbouring RBDs, the water bodies’ grouping and the identified pressures and impacts has

been integrated and led to suggestions on modification of the new monitoring programme to

better serve its purpose. These suggestions are presented in all the RBMPs and are basically

grouped under three main categories: (i) reallocation of the monitoring stations to

neighbouring sites (e.g. upstream or downstream in rivers); (ii) switching of monitoring

stations from the surveillance to the operational programme and vice-versa; (iii)

inclusion/exclusion of the sampling elements and/or changes in the frequency of sampling. It

is acknowledged in some RBMPs that these modifications (especially category ii - additional

sites) may be difficult to implement since they would require additional funding, but

categories i and iii are deemed feasible.

23

Figure 5.1: Maps of surface water (left) and groundwater (right) monitoring stations

• River monitoring stations

• Lake monitoring stations

• Transitional water monitoring stations

• Coastal water monitoring stations

• Unclassified surface water monitoring stations

• Groundwater monitoring stations

River Basin Districts

Countries outside EU

Source: WISE, Eurostat (country borders)

5.2 Monitoring of surface waters

As explained above, the data used in the RBMPs originated from the old monitoring network,

which was not compliant with WFD requirements. The available data were fragmented, with

many gaps in parameters and time-series which restricted the corresponding assessments in

the RBMPs. The data of the old monitoring network were provided by different agencies,

mainly the Ministry for the Environment, Energy and Climate Change, the Ministry of Rural

Development and Food and the General Chemical State Laboratory. Data from regional

authorities and sample monitoring from various existing surveys were also available in some

cases. As a result, based on quality assurance, completeness, accuracy, etc. the following

quality elements of the old monitoring system have been considered overall for the

classification of surface water bodies (yet not in all cases, and not with continuous long time-

series) in the current RBMPs:

BQEs: benthic macroinvertebrates (for rivers); phytoplankton (lakes);

macroinvertebrates, phytoplankton and macroalgae (coastal and transitional) –more

details in section 7.

Physico-chemical elements: transparency, thermal conditions, oxygen conditions,

salinity, acidification conditions and nutrient conditions –more details in section 7.

Hydromorphological elements: not clear if they have been considered –more details in

section 7.

24

Priority substances and other specific pollutants: Ni, Pb, Hg, Cd, Brominated

diphenylether, Di(2-ethylhexyl)phthalate (DEHP), Endosulfan,

Hexachlorocyclohexane, Chlorfenvinphos, Anthracene, Hexachlorobenzene,

considered on a case-by-case basis –more details in section 9.

In assessing the river water bodies (in the current RBMPs), grouping was performed when

there was no monitoring station within a certain river water body (of the old network). Groups

have been formulated so that each group contains at least one river water body which is being

monitored. The grouping was based on the hydromorphological characteristics of the rivers

(biogeographical regions, annual discharge, slope, altitude) as reflected in the water bodies’

typology, as well as on the type and intensity of pressures that are identified in the sub-

catchment of the water body. The heavily modified and artificial water bodies have been

excluded from grouping and are considered individually even when monitoring stations are

not present in them.

With regard to the New Monitoring Programme (established by the Ministerial Decree in

2011) it includes both surveillance and operational monitoring programmes including all

relevant quality elements. A total of 616 monitoring stations for surface water bodies are

defined in the NMP for the whole territory, of which 377 are for surveillance and 239 for

operational monitoring. Biological, physico-chemical and hydromorphological QEs are

defined to be monitored in all of them, priority substances in 326, specific pollutants in 282

and other substances in 29 of them. The relevant elements that are monitored per RBD are

shown in Table 5.1 below as reported in the WISE Summary Reports 4.1.7 and 4.1.8 and

further corrected by EL in late 2014.

Few of the monitoring stations are part of the International Network Barcelona

Convention/Mediterranean Action Plan (MEDPOL). A detailed view of the programmes

(surveillance & operational), station locations, elements and frequencies foreseen to be

monitored at each water body is provided in the Annexes of the Ministerial Decree, and also

on WISE - CDR under the Art. 8 reporting (submitted 26.08.2009), and have been defined in

the document “Updated Report of Article 8 of the WFD including the catalogue of elements

and parameters to be monitored in each station of the NMP”. The sampling and frequency

methodologies are also mentioned there. With regard to the methodologies for selecting the

BQEs of the operational programme, the priority substances and other pollutants, it is

mentioned that these are developed within the guidance documents of the research project

“Development of network and monitoring of the internal, transitional and coastal water bodies

of the country – Assessment/Classification of their ecological status” undertaken by the

HCMR-EKBY, 2008 (Hellenic Centre for the Marine Research – Greek Biotope/Wetland

Centre). As mentioned above, upon the establishment of the RBMPs and their findings

additional suggestions were made in the RBMPs regarding modifications to the NMP

(inclusion/exclusion of monitoring stations and/or elements) to better accommodate the

identified needs.

5.3 Monitoring of groundwater

As explained above, the data used in the RBMPs originated from the old monitoring network,

which was not compliant with the WFD requirements. The available data was fragmented,

with gaps in parameters and time-series which restricted the corresponding assessments in the

RBMPs. The data of the old monitoring network were provided by different agencies, mainly

the Institute of Geology and Mineral Exploration, the Ministry for the Environment, Energy

and Climate Change, the Ministry of Development. Data from regional authorities and sample

monitoring from various existing surveys were also available in some cases. As a result, based

25

on quality assurance, completeness, accuracy, etc. the following elements and parameters of

the old monitoring programme have been considered overall for the assessment of

groundwater bodies (yet not in all cases, and not with continuous long time-series) in the

current RBMPs:

Quantitative status: abstraction per sector (mostly estimated from water demands);

water balance (comparison between available groundwater resource by the long-term

annual average rate of abstraction), groundwater levels, spring discharges –more

details in section 10.

Chemical status: pH, conductivity, chloride, nitrates, nitrogen dioxide, ammonium,

sulphate. Pb, Cr, Ni, Al, Fe, Mg, Mn, B were assessed in a subset of the groundwater

bodies. The data series of heavy metals (Pb, Cd, As, Hg) were not systematic – more

details in section 10.

No data were available for trichloroethylene and tetrachloroethylene. Thus, these

parameters have not been considered in the assessments – more details in section 10.

Quantitative, surveillance and operational monitoring programmes are included in the new

monitoring network (established with the Ministerial Decree in 2011). It includes monitoring

of quantitative status and the all chemical elements considered relevant by the Greek

authorities. A total of 1,387 monitoring stations for groundwater bodies are defined in the

NMP for the whole territory, of which 294 are for surveillance and 1093 for operational

monitoring. Quantity and physico-chemical parameters are defined to be monitored in all

stations, nitrates in 867, heavy metals in 844, pesticides in 502, and composite compounds in

284 of them. A detailed view of the programmes (quantitative, surveillance & operational),

station locations, elements and frequencies foreseen to be monitored at each groundwater

body are provided in the Annexes of the Ministerial Decree, and have been defined in the

document “Updated Report of Article 8 of the WFD including the catalogue of elements and

parameters to be monitored in each station of the NMP”. The sampling and frequency

methodologies are also mentioned there.

With regard to the criteria for defining the monitoring stations of the operational programme

the following are listed:

(i) Availability of existing monitoring stations (of the old networks) for which

representative samples can be retrieved;

(ii) Possibility to support different programmes and requirements of the Water Framework,

Groundwater and Nitrates Directives (e.g. monitoring of both quantitative and chemical

elements, monitoring of nitrates pollution, monitoring of drinking water areas);

(iii) Accessibility and capacity to achieve/support the measurement of parameters on a long-

term basis.

With regard to the methodologies for selecting the parameters or elements of the operational

programme, it is mentioned that these are developed within the guidance documents of the

research project “Development of network and monitoring of the internal, transitional and

coastal water bodies of the country – Assessment/Classification of their ecological status”

undertaken by the HCMR-EKBY, 2008 (Hellenic Centre for Marine Research – Greek

Biotope/Wetland Centre). As mentioned above, upon the establishment of the RBMPs and

their findings, additional suggestions were made in the RBMPs regarding modifications to the

NMP (inclusion/exclusion of monitoring stations and/or elements) to better accommodate the

identified need.

26

BD

Rivers Lakes Q

E1

.1 P

hy

top

lan

kto

n

QE

1.2

Oth

er a

qu

ati

c fl

ora

QE

1.2

.3 M

acr

op

hy

tes

QE

1.2

.4 P

hy

tob

enth

os

QE

1.3

Ben

thic

in

ver

teb

rate

s

QE

1.4

Fis

h

QE

1.5

Oth

er s

pec

ies

QE

2 H

yd

rom

orp

ho

log

ica

l

QE

s

QE

3.1

Gen

era

l P

ara

met

ers

QE

3.3

N

on

pri

ori

ty s

pec

ific

po

llu

tan

ts

QE

3.4

Oth

er n

ati

on

al

po

llu

tan

ts

QE

1.1

Ph

yto

pla

nk

ton

QE

1.2

Oth

er a

qu

ati

c fl

ora

QE

1.2

.3 M

acr

op

hy

tes

QE

1.2

.4 P

hy

tob

enth

os

QE

1.3

Ben

thic

in

ver

teb

rate

s

QE

1.4

Fis

h

QE

1.5

Oth

er s

pec

ies

QE

2 H

yd

rom

orp

ho

log

ica

l

QE

s

QE

3.1

Gen

era

l P

ara

met

ers

QE

3.3

No

n p

rio

rity

sp

ecif

ic

po

llu

tan

ts

QE

3.4

Oth

er n

ati

on

al

po

llu

tan

ts

GR01

GR02

GR03

GR04

GR05

GR06

GR07

GR08

GR09

GR10

GR11

GR12

GR13 - - - - - - - - - - - - - - - - - - - - - -

GR14 - - - - - - - - - - - - - - - - - - - - - -

27

RBD

Transitional Coastal

QE

1.1

Ph

yto

pla

nk

ton

QE

1.2

Oth

er a

qu

ati

c f

lora

QE

1.2

.1 M

icro

alg

ae

QE

1.2

.2 A

ngio

sper

ms

QE

1.3

Ben

thic

in

ver

teb

rate

s

QE

1.4

Fis

h

QE

1.5

Oth

er s

pec

ies

QE

2 H

yd

rom

orp

holo

gic

al

QE

s

QE

3.1

Gen

eral

Param

eter

s

QE

3.3

Non

pri

ori

ty s

pec

ific

poll

uta

nts

QE

3.4

Oth

er n

ati

on

al

poll

uta

nts

QE

1.1

Ph

yto

pla

nk

ton

QE

1.2

Oth

er a

qu

ati

c f

lora

QE

1.2

.1 M

icro

alg

ae

QE

1.2

.2 A

ngio

sper

ms

QE

1.3

Ben

thic

in

ver

teb

rate

s

QE

1.4

Fis

h

QE

1.5

Oth

er s

pec

ies

QE

2 H

yd

rom

orp

holo

gic

al

QE

s

QE

3.1

Gen

eral

Param

eter

s

QE

3.3

Non

pri

ori

ty s

pec

ific

poll

uta

nts

QE

3.4

Oth

er n

ati

on

al

poll

uta

nts

GR01

GR02

GR03

GR04

GR05

GR06 - - - - - - - - - - -

GR07

GR08 - - - - - - - - - - -

GR09

GR10

GR11

GR12

GR13 - - - - - - - - - - - - - - - - - - - - - -

GR14 - - - - - - - - - - - - - - - - - - - - - -

Table 5.1: Quality elements monitored7

7 This table refers to the New National Monitoring Programme, which was established with the Common Ministerial Decree ΚΥΑ 140384/9-9-2011, but was not used during

the 1st cycle of the RBMPs.

28

QE Monitored

QE Not monitored

- Not Relevant

Source: WISE Summary Reports: 4.1.7 and 4.1.8. Note: EL provided an alternative formulation of this Table, but the output from the Annexes and WISE have been used here.

D Rivers Lakes Transitional Coastal Groundwater

Surv Op Surv Op Surv Op Surv Op Surv Op Quant

GR01 17 19 1 0 0 2 4 0 27* 59* 86*

GR02 25 11 2 1 0 4 4 5 10 95* 105*

GR03 12 10 0* 0* 0* 0* 3 2 13 113* 126*

GR04 15* 26* 10* 2* 0* 5* 1* 1* 23* 42* 65*

GR05 32 5* 3 1* 0* 6 2 5* 19* 71* 90*

GR06 4 4 0 1 0* 0* 3 6 6 74 80

GR07 37 6 2 1 0 1 3 6 11 154* 165*

GR08 24* 33* 2* 0* 0* 0* 4* 1* 33* 61* 94*

GR09 19 11 2 10 0 2 1 0 45* 44 89*

GR10 22 4 1 4 0 2 3 2 5 108 113

GR11 26 10 1 1 0 1 1 0 16 35 51

GR12 36 4 2 3 0 8 3 1 26 53 79

GR13 21* 5* 1* 2* 0* 0* 5* 1* 36* 76* 112*

GR14 10* 0* 0* 0* 0* 4* 13* 0* 24* 108* 132*

Total by type

of site 300 148 27 26 0 35 50 30 294 1093 1387

Total number

of monitoring

sites

448* 53* 35* 80* 1387*

Table 5.2: Number of monitoring sites by water category, in accordance with JMD 140384/09-09-2011

Surv = Surveillance, Op = Operational, Quant = Quantitative Source: WISE

*corrections/additions provided by EL in late 2014. Some discrepancies between this information and the RBMPs/their Annexes are observed.

29

5.4 Monitoring of protected areas

Figure 5.2: Map of monitoring stations for protected areas

Source: WISE

In the NMP there are monitoring stations located within protected areas and drinking water

protected areas (of the Birds, Habitats and Drinking Water Directives). Upon the

establishment of the RBMPs and their findings, suggestions were made to place additional

stations in more protected areas which are explicitly mentioned. There is no detailed

information in the RBMPs on specific monitoring programmes (e.g. drinking water, bathing

water) for the protected areas (i.e. name and code of protected area, number and location of

monitoring sites, specific monitored parameters, etc.).

30

RBD

Surface waters Ground-

water

drinking

water

Surface

drinking

water

abstraction

Quality

of

drinking

water

Bathing

water

Birds

sites Fish

Habitats

sites Nitrates

Shell-

Fish UWWT

GR01 1* 0 6* 1* 4* 13* 0 0 0 9*

GR02 3* 0 5* 10* 4* 13* 0 0 0 12*

GR03 0 0 4* 4* 3* 6* 0 0 0 17*

GR04 7* 0* 3* 28* 6* 25* 0* 0* 61* 4*

GR05 0 0 0 0 0 0 0 0 0 20

GR06 1 0 8 3 0 6 0 0 2 13*

GR07 3 0 8 23 0 34 15 0 5 69*

GR08 0* 0* 5* 35* 0* 12* 58* 0* 64* 12*

GR09 1* 1* 0 14 2* 15* 16* 0 5* 9*

GR10 0 0 0 16* 0 11* 27* 4 4* 3*

GR11 0 0 1* 4* 1* 6* 26* 1 6* 51*

GR12 1* 0 3* 26* 1* 17* 21* 3 12* 79*

GR13 - - - - - - - - - -

GR14 - - - - - - - - - -

Total 17 1 43 164 21 158 163 8 159 298

Table 5.3.1: Number of monitoring stations in protected areas8.

Source: WISE

*corrections/additions provided by EL in late 2014

8 Number of sites calculated from data reported at site level. If no data reported at site level, then table

supplemented with data reported at programme level. The reported information refers to the new National

Monitoring Programme

31

6. OVERVIEW OF STATUS (ECOLOGICAL, CHEMICAL, GROUNDWATER)

The ecological status of natural surface water bodies presented in the RBMPs shows that

49 % are in high or good status (7% and 42% respectively). Another 18% are in moderate

status, 11% in poor and bad status (10% and 1% respectively) while 21% remain unknown.

GR04 presents the lowest percentage of water bodies with unknown status (2%) while GR02

the highest (40%). Variations are observed across the RBDs (see Table 6.1): GR04 and GR05

have the highest percentage of water bodies in high and good status (84% of their surface

water bodies), while GR08 and GR09 has the highest percentage of water bodies in poor and

bad status (40% and 25% respectively). With regard to the ecological potential of artificial

and heavily modified water bodies (see Table 6.2), 6% across the RBDs are in good status,

24% in moderate, 25% in poor, 2% in bad and 43% in unknown status. In GR01/02/03/10

more than 60% are in unknown status. It should be taken into consideration that in these

classifications, not all relevant quality elements have necessarily been evaluated or

considered, and that the available data were limited in many cases. As such the confidence in

the classification is not high.

RBD Total High Good Moderate Poor Bad Unknown

No. (%) No. (%) No. (%) No. (%) No. (%) No. (%)

GR01 109 9 8% 51 47% 10 9% 4 4% 0 0% 35 32%

GR02 88 13 15% 27 31% 8 9% 5 6% 0 0% 35 40%

GR03 89 10 11% 20 22% 23 26% 6 7% 0 0% 30 34%

GR04 101* 3* 3%* 82* 81%* 13* 13%* 1* 1%* 0* 0%* 2* 2%*

GR05 90 10 11% 66* 73%* 10 11% 0 0% 0 0% 4* 5%*

GR06 25 2 8% 6 24% 7 28% 4 16% 1 4% 5 20%

GR07 96 12 13% 38 40% 17 18% 7 7% 3 3% 19 20%

GR08 70* 5* 7%* 11* 16%* 19* 27%* 28* 40%* 0* 0%* 7* 10%*

GR09 128* 3 2% 47 37%* 20 16% 27* 21%* 5 4% 26 20%*

GR10 108 7 6% 38 35% 7 6% 20 19% 1 1% 35 32%

GR11 66 0 0% 13 20% 31 47% 3 5% 0 0% 19 29%

GR12 166 4 2% 81 49% 45 27% 11 7% 0 0% 25 15%

GR13 - - - - - - - - - - - - -

GR14 - - - - - - - - - - - - -

Total 1136 78 7% 480 42% 210 18% 116 10% 10 1% 242 21%

Table 6.1: Ecological status of natural surface water bodies. Source: WISE; *corrections/additions provided by EL in late 2014

32

RBD Total High Good Moderate Poor Bad Unknown

No. (%) No. (%) No. (%) No. (%) No. (%) No. (%)

GR01 19 0 0% 1 5% 3 16% 3 16% 0 0% 12 63%

GR02 9 0 0% 0 0% 2 22% 0 0% 0 0% 7 78%

GR03 11 0 0% 0 0% 4 36% 0 0% 0 0% 7 64%

GR04 19* 0* 0%* 7* 37%* 2* 11%* 0* 0%* 0* 0%* 10* 52%*

GR05 16 0 0% 3 19% 4 25% 1 6% 0 0% 8 50%

GR06 4 0 0% 0 0% 1 25% 2 50% 0 0% 1 25%

GR07 8 0 0% 0 0% 4 50% 2 25% 2 25% 0 0%

GR08 12* 0* 0%* 2* 17%* 2* 17%* 3* 25%* 0* 0%* 5* 41%*

GR09 40* 0 0% 0 0% 1 2% 13* 33%* 3 7% 23 52%

GR10 16 0 0% 0 0% 1 6% 4 25% 0 0% 11 69%

GR11 32 0 0% 0 0% 12 38% 12 38% 0 0% 8 25%

GR12 45 0 0% 1 2% 19 42% 18 40% 0 0% 7 16%

GR13 - - - - - - - - - - - - -

GR14 - - - - - - - - - - - - -

Total 231 0 0% 14 6% 55 24% 58 25% 5 2% 99 43%

Table 6.2: Ecological potential of artificial and heavily modified water bodies. Source: WISE; *corrections/additions provided by EL in late 2014

The chemical status of natural surface water bodies presented in the RBMPs shows that 44%

are good status, 6% in poor status, while 51% remain unknown. GR04 presents the lowest

percentage of water bodies with unknown status (yet it reached 29%) while GR02 the highest

(91%). Variations are observed across the RBDs (see Table 6.3): among the classified surface

water bodies GR04 has the highest percentage of water bodies in good status (72% of its

surface water bodies). With regard to the chemical status of artificial and heavily modified

water bodies (see Table 6.4), 13% across the RBDs are in good status, 27% in poor, and 60%

in unknown status. It should be taken into consideration that in these classifications not all

relevant quality elements have necessarily been evaluated or considered (refer to section 9),

and that the available data were limited in many cases.

33

RBD Total Good Poor Unknown

No. % No. % No. %

GR01 109 10 9% 5 5% 94 86%

GR02 88 5 6% 3 3% 80 91%

GR03 89 6 7% 18 20% 65 73%

GR04 101* 72* 71%* 0* 0%* 29* 29%*

GR05 90 54 60% 0 0% 36 40%

GR06 25 6 24% 0 0% 19 76%

GR07 96 34 35% 2 2% 60 63%

GR08 70* 25* 36%* 5* 7%* 40* 57%*

GR09 128* 50* 39%* 9 7% 69* 54%*

GR10 108 43 40% 12 11% 53 49%

GR11 66 8 12% 9 14% 49 74%

GR12 166 4 2% 22 13% 140 84%

GR13 - - - - - - -

GR14 - - - - - - -

Total 1453 634 44% 85 6% 734 51%

Table 6.3: Chemical status of natural surface water bodies.

Source: WISE

*corrections/additions provided by EL in late 2014

RBD Total Good Poor Unknown

No. % No. % No. %

GR01 19 5 26% 2 11% 12 63%

GR02 9 1 11% 0 0% 8 89%

GR03 11 0 0% 4 36% 7 64%

GR04 19* 9* 47%* 4* 21%* 6* 32%*

GR05 16 8 50% 1 6% 7 44%

GR06 4 1 25% 0 0% 3 75%

GR07 8 1 13% 1 13% 6 75%

GR08 12* 3* 25%* 2* 17%* 7* 58%*

GR09 40* 0* 0%* 12 30%* 28* 70%

GR10 16 0 0% 4 25% 12 75%

GR11 32 2 6% 12 38% 18 56%

GR12 45 0 0% 20 44% 25 56%

GR13

GR14 - - - - - - -

Total 231 30 13% 62 27% 139 60%

Table 6.4: Chemical status of artificial and heavily modified surface water bodies.

Source: WISE,

*corrections/additions provided by EL in late 2014

The chemical status of groundwater bodies presented in the RBMPs shows that 83.8 % are in

good status, 16.2% in poor, while none remain unknown. Variations are observed across the

RBDs (see Table 6.5): GR05 has the highest percentage of water bodies in good status (96.2%

of its groundwater bodies), while GR06 has the highest percentage of water bodies in poor

status (45.8% of its groundwater bodies).

34

With regard to the quantitative status of the groundwater bodies, 83.1 % are in good status,

16.9% in poor, while none remain unknown. Variations are observed across the RBDs (see

Table 6.6): GR05 has the highest percentage of water bodies in good status (96.2% of its

groundwater bodies), while GR06 has the highest percentage of water bodies in poor status

(37.5% of its groundwater bodies). It should be taken into consideration that in these

classifications the available data were limited in many cases.

RBD Good Poor Unknown

No. % No. % No. %

GR01 24 92.3% 2 7.7% 0 0%

GR02 22 84.6% 4 15.4% 0 0%

GR03 17* 63%* 10* 37%* 0 0%

GR04 24* 96%* 1* 4%* 0** 0%

GR05 25 96.2% 1 3.8% 0 0%

GR06 13 54.2% 11 45.8% 0 0%

GR07 40 87% 6 13% 0 0%

GR08 28* 87,5%* 4* 12,5%* 0* 0%*

GR09 58 93.5% 4 6.5% 0 0%

GR10 31 79.5% 8 20.5% 0 0%

GR11 14 93.3% 1 6.7% 0 0%

GR12 14 77.8% 4 22.2% 0 0%

GR13 - - - - - -

GR14 - - - - - -

Total 311 85% 55 15% 0 0%

Table 6.5: Chemical status of groundwater bodies.

Source: WISE

*corrections/additions provided by EL in late 2014

RBD Good Poor Unknown

No. % No. % No. %

GR01 24 92.3% 2 7.7% 0 0%

GR02 24 92.3% 2 7.7% 0 0%

GR03 22 81.5% 5 18.5% 0 0%

GR04 23* 92%* 2* 8%* 0* 0%*

GR05 25 96.2% 1 3.8% 0 0%

GR06 15 62.5% 9 37.5% 0 0%

GR07 41 89.1% 5 10.9% 0 0%

GR08 22* 68.8%* 10* 31.2%* 0* 0%*

GR09 48 77.4% 14 22.6% 0 0%

GR10 28 71.8% 11 28.2% 0 0%

GR11 14 93.3% 1 6.7% 0 0%

GR12 18 100% 0 0 0 0%

GR13 - - - - - -

GR14 - - - - - -

Total 304 83.1% 62 16.9%

Table 6.6: Quantitative status of groundwater bodies.

Source: WISE

*corrections/additions provided by EL in late 2014

35

A total of 330 surface water bodies (i.e. 24%) are expected to achieve good or better global

status by 2015. The most significant increase is observed in GR03 (25% increase between

2009 and 2015). 25% of the surface water bodies are applying exemptions according to

Article 4.4. No exemptions according to Art. 4.5 are applied, based on the information

provided by EL in late 2014.

36

RBD Total

Global status (ecological and chemical)

Good Global

status 2021

Good Global

status 2027

Global exemptions 2009 (% of

all SWBs)

Good or

better 2009

Good or

better 2015

Increase

2009 -

2015

Art

4.4

Art

4.5

Art

4.6

Art

4.7

No. % No. % % No. % No. % % % % %

GR01 128 4 3.1 20 15.6 12.5 128 100 128 100 4* 0 0* 0*

GR02 97 2 2.1 5 5.2 3.1 95 98 96 99 4* 0 0* 0*

GR03 100 2 2 27 27 25 100 100 100 100 33* 0 0* 0*

GR04 120* 71* 59* 71* 59* 0* 88* 73* 116* 97* 15* 0* 0* 4*

GR05 106 52 49.1 52 49.1 0 67* 63* 105* 99* 14* 0* 0* 0.9*

GR06 29 2 6.9 3 10.3 3.4 10* 34* 17* 58* 48 0

GR07 104 27 26 27 26 0 48* 46* 62* 59* 33 0

GR08 82* 5* 6* 5* 6* 0* 56* 68* 80* 98* 62* 0* 0* 2*

GR09 168 45 26.8 50 29.8 3 14 0 2*

GR10 124 36 29 58* 47* 18* 10 0

GR11 98 5 5.1 8* 8.2* 0 - - 52* 0 1

GR12 211 4 1.9 4 1.9 0 - - 40* 0 4.3*

GR13 - - - - - - - -

GR14 - - - - - - - -

Total 1367 255 19% 330 24% 5%

Table 6.7: Surface water bodies: overview of status in 2009 and expected status in 2015, 2021and 2027;

Waterbodies with good status in 2009 fall into the following category:

1. Ecological status is high or good and the chemical status is good, exemptions are not considered

Waterbodies expected to achieve good status in 2015 fall into the following categories:

1. Ecological status is high or good and the chemical status is good, exemptions are not considered

2. Chemical status is good, and the ecological status is moderate or below but no ecological exemptions

3. Ecological status is high or good, and the chemical status is failing to achieve good but there are no chemical exemptions

4. Ecological status is moderate or below, and chemical status is failing to achieve good but there are no ecological nor chemical exemptions Note: Waterbodies with unknown/unclassified/Not applicable in either ecological or chemical status are not considered

Source: WISE, corrections provided by EL in late 2014. For this and the following tables of this chapter, there are some discrepancies between this information and the RBMPs/their Annexes.

*corrections/additions provided by EL in late 2014

37

RBD Total

Ecological status

Good ecological

status 2021

Good

ecological

status 2027

Ecological exemptions (% of all

SWBs)

Good or better

2009

Good or better

2015

Increase

2009 -

2015

Art

4.4

Art

4.5

Art

4.6 Art 4.7

No. % No. % % No. % No. % % % % %

GR01 109 60 55% 74 68%

13% 109* 100%* 109* 100%

* 0%* 0%* 0%* 0%*

GR02 88 40 45% 53 60%

15% 88* 100%* 88* 100%

* 2%* 0%* 0%* 0%*

GR03 89 30 34% 59 66%

32% 89* 100%* 89* 100%

* 17%* 0%* 0%* 0% *

GR04 101* 85* 84%* 85* 84%* 0%* 92* 91%* 96* 95%* 7%* 5% *

GR05 90 76* 84%* 76* 84%* 0% 86* 96%* 89* 99%* 11% 1%*

GR06 25 8 32% 8 32% 0% 48%

GR07 96 50 52% 50* 52%* 0%* 28%*

GR08 70* 16* 23%* 16* 23%* 0%* 61* 87%* 69* 99%* 64%* 1%*

GR09 128* 50 39%* 92* 72%* 33%* 6%* 2%

GR10 108 45 42% 65* 60%* 18%* 10% 0.02%*

GR11 66 13 20% 19*

29%* 9%* 41%* 2%

GR12 166 85 51% 90*

54%* 3%* 27%* 4%*

GR13 - - - - - - - -

GR14 - - - - - - - -

Total 1136 558 49% 687 60% 11%

Table 6.8: Natural surface water bodies: ecological status in 2009 and expected status in 2015, 2021 and 2027

Source: WISE

*corrections/additions provided by EL in late 2014

38

RBD Total

Chemical status

Good chemical

status 2021

Good chemical

status 2027

Chemical exemptions (% of all

SWBs)

Good or better

2009

Good or better

2015

Increase

2009 -

2015

Art 4.4 Art

4.5

Art

4.6

Art

4.7

No. % No. % % No. % No. % % % % %

GR01 109 10 9% 15 14% 5% 109* 100%* 109* 100%* 0%* 0%* 0%* 0%*

GR02 88 5 6% 8 9% 3% 88* 100%* 88* 100%* 2%* 0%* 0%* 0%*

GR03 89 6 7% 24 27% 20% 89* 100%* 89* 100%* 17%* 0%* 0%* 0% *

GR04 101* 72* 71%* 72* 71%* 0%* 79* 78%* 97* 96%* 5%* 4% *

GR05 90 54 60% 54 60% 0% 54* 60%* 89* 99% * 0%* 1%*

GR06 25 6 24% 6 24% 0%

GR07 96 34 35% 34 35% 0% 2%

GR08 70* 25* 36%* 25* 36%* 0%* 30* 43%* 68* 97%* 7%* 3% *

GR09 128* 50* 40% 51* 40% 0% 5%*

GR10 108 43 40% 48 44% 4% 9%*

GR11 66 8 12% 8 12% 0% 14%

GR12 166 4 2% 4 2% 0% 13%

GR13 - - - - - - -

GR14 - - - - - - -

Total 1136 317 28% 349 31% 3%

Table 6.9: Natural surface water bodies: chemical status in 2009 and expected status in 2015, 2012 and 2027

Source: WISE

*corrections/additions provided by EL in late 2014

39

RBD Total

GW chemical status

Good chemical

status 2021

Good chemical

status 2027

GW chemical exemptions (% of

all GWBs)

Good or better

2009

Good or better

2015

Increase

2009 -

2015

Art 4.4 Art

4.5

Art

4.6

Art

4.7

No. % No. % % No. % No. % % % % %

GR01 26 24 92.3 24 92.3 0 24* 92.3* 26 100% 7.7%* 0%*

GR02 26 22 84.6 22 84.6 0 22* 84.6* 26 100% 15.4%* 0%*

GR03 27 17* 63* 17* 63* 0 17* 63* 27 100% 37%* 0%*

GR04 25* 24* 96* 24* 96* 0* 24* 96* 4%* 0%* 0%* 0%*

GR05 26 25 96.2 26 100 3.8 25 96 4% 0% 0%* 0%*

GR06 24 13 54.2 13 54.2 0 24 100% 46% 0%

GR07 46 40 87 40 87 0 46 100% 13% 0%

GR08 32* 28* 87.5* 28* 87.5* 0* 28* 87.5* 28* 87.5* 12.5* - 0%* 0% *

GR09 62 58 93.5 58 93.5 0 6% 0%

GR10 39 31 79.5 31 79.5 0 18% 0% 3%

GR11 15 14 93.3 14 93.3 0 14 93 15 100 7% 0%

GR12 18 14 77.8 14 77.8 0 14 78 17 94 28% 0%

GR13 - - - - - - - -

GR14 - - - - - - - -

Total 366 310 85% 311 85% 0.3%

Table 6.10: Groundwater bodies: chemical status in 2009 and expected status in 2015, 2012 and 2027

Source: WISE

*corrections/additions provided by EL in late 2014

40

RBD Total

Groundwater quantitative status Good

quantitative

status 2021

Good

quantitative

status 2027

GW quantitative exemptions (%

of all GWBs)

Good or better

2009

Good or better

2015

Increase

2009 -

2015

Art 4.4 Art

4.5

Art

4.6

Art

4.7

No. % No. % % No. % No. % % % % %

GR01 26 24 92.3 24 92.3 0 24* 92.3* 26 100% 7.7%* 0%

GR02 26 24 92.3 24 92.3 0 24* 92.3* 26 100% 11.5%* 0%*

GR03 27 22 81.5 22 81.5 0 22* 81.5* 27 100% 33.3%* 0%

GR04 25* 23* 92* 23* 92* 0* 25* 100%* 8%* 0%* 0%* 0%*

GR05 26 25 96.2 25 96.2 0 25 26* 100%* 4% 0% 0%* 0%*

GR06 24 15 62.5 15 62.5 0 19* 79* 24 100% 38% 0%

GR07 46 41 89.1 41 89.1 0 46 100% 11% 0%

GR08 32* 22* 68.87

* 22* 68.87* 0* 32* 100%* 31%* 0%* 0%* 0%*

GR09 62 48 77.4 48 77.4 0 23% 0%

GR10 39 28 71.8 28 71.8 0 28% 0% 5%

GR11 15 14 93.3 14 93.3 0 14 93 15 100 7% 0%

GR12 18 18 100 18 100 0 0% 0%

GR13 - - - - - - - - - - - -

GR14 - - - - - - - - - - - -

Total 366 304 83.1 304 83.1 0

Table 6.11: Groundwater bodies: quantitative status in 2009 and expected status in 2015, 2012 and 2027

Source: WISE

*corrections/additions provided by EL in late 2014

41

RBD

Total

HMWB

and

AWB

Ecological potential

Good ecological

potential 2021

Good

ecological

potential 2027

Ecological exemptions (% of all

HMWB/AWB)

Good or better

2009

Good or better

2015

Increase

2009 -

2015

Art 4.4 Art

4.5

Art

4.6

Art

4.7

No. % No. % % No. % No. % % % % %

GR01 19 1 5% 7 37% 32% 19* 100%* 19* 100%* 16%* 0%* 0% * 0% *

GR02 9 0 0% 2 22% 22% 7* 78%* 8* 89%* 22%* 0%* 0% * 0% *

GR03 11 0 0% 4 36% 36% 11* 100%* 11* 100%* 55%* 0%* 0% * 0% *

GR04 19* 7* 37%* 7* 37%* 0%* 9* 47%* 19* 100%* 10%* - -

GR05 16 3 19% 3 19% 0% 8* 50%* 16* 100%* 31%*

GR06 4 0 0% 1 25% 25% 50%

GR07 8 0 0% 0 0% 0% 100%

GR08 12* 2* 17%* 2* 17%* 0%* 7* 58%* 12* 100* 42%* - -

GR09 40* 0* 0%* 5* 12%* 12%* 30%*

GR10 16 0 0% 0 0% 0% 31%*

GR11 32 0 0% 0 0% 0% 75%

GR12 45 1 2% 1 2% 0% 80% 2%

GR13 - - - - - - - - -

GR14 - - - - - - - - -

Total 231 14 6% 32 14% 8%

Table 6.12: Heavily modified and artificial water bodies: ecological potential in 2009 and expected ecological potential in 2015, 2021 and 2027

Source: WISE

*corrections/additions provided by EL in late 2014

42

RBD

Total

HMWB

and

AWB

Chemical status

Good chemical

status 2021

Good chemical

status 2027

Chemical exemptions (% of all

HMWB/AWB)

Good or better

2009

Good or better

2015

Increase

2009 -

2015

Art 4.4 Art

4.5

Art

4.6

Art

4.7

No. % No. % % No. % No. % % % % %

GR01 19 5 26% 7 37% 11% 19* 100%* 19* 100%* 16%* 0%* 0%* 0%*

GR02 9 1 11% 1 11% 0% 7* 78%* 8* 89%* 22%* 0%* 0%* 0%*

GR03 11 0% 4 36% 36% 11* 100%* 11* 100%* 55%* 0%* 0%* 0%*

GR04 19* 9* 47%* 9* 47%* 0%* 21%* 0%* 0%* 0%*

GR05 16 8 50% 8 50% 0% 6% 0%* 0%* 0%*

GR06 4 1 25% 1 25% 0%

GR07 8 1 13% 1 13% 0% 13%

GR08 12* 3* 25%* 3* 25%* 0%* 17%* 0%* 0%* 0%*

GR09 40* 0* 0%* 1* 3%* 3%* 27%*

GR10 16 0% 0 0% 0% 25%

GR11 32 2 6% 2 6% 0% 38%

GR12 45 0% 0 0% 0% 44%

GR13 - - - - - - -

GR14 - - - - - - -

Total 231 30 13% 37 16% 3%

Table 6.13: Heavily modified and artificial water bodies: chemical status in 2009 and expected status in 2015, 2021 and 2027

Source: WISE

*corrections/additions provided by EL in late 2014

43

Figure 6.1: Map of ecological status of natural surface water bodies 2009

Figure 6.2: Map of ecological status of natural surface water bodies 2015

Good or better

Less than good

Unknown

River Basin Districts

Countries outside EU

Source: WISE, Eurostat and corrections/additions provided by EL in late 2014

44

Figure 6.3: Map of ecological potential of artificial and heavily modified water bodies 2009

Figure 6.4: Map of ecological potential of artificial and heavily modified water bodies 2015

Good or better

Less than good

Unknown

River Basin Districts

Countries outside EU

Source: WISE, Eurostat and corrections/additions provided by EL in late 2014

45

Figure 6.5: Map of chemical status of natural surface water bodies 2009

Figure 6.6: Map of chemical status of natural surface water bodies 2015

Good

Failing to achieve good

Unknown

River Basin Districts

Countries outside EU

Note: Standard colours based on WFD Annex V, Article 1.4.3.

Source: WISE, Eurostat and corrections/additions provided by EL in late 2014

46

Figure 6.7: Map of chemical status of artificial and heavily modified water bodies 2009

Figure 6.8: Map of chemical status of artificial and heavily modified water bodies 2015

Good

Failing to achieve good

Unknown

River Basin Districts

Countries outside EU

Note: Standard colours based on WFD Annex V, Article 1.4.3.

Source: WISE, Eurostat (country borders) and corrections/additions provided by EL in late 2014

47

Figure 6.9: Map of chemical status of groundwater bodies 2009

Figure 6.10: Map of chemical status of groundwater bodies 2015

Good

Poor

Unknown

River Basin Districts

Countries outside EU

Note: Standard colours based on WFD Annex V, Article 2.4.5.

Source: WISE, Eurostat (country borders) and corrections/additions provided by EL in late 2014

0 100 200

km

GR01

GR02

GR03

GR04

GR05

GR06

GR07

GR08

GR09

GR10 GR11

GR12

GR13

GR14

EL

0 100 200

km

GR01

GR02

GR03

GR04

GR05

GR06

GR07

GR08

GR09

GR10 GR11

GR12

GR13

GR14

EL

48

Figure 6.11: Map of quantitative status of groundwater bodies 2009

Figure 6.12: Map of quantitative status of groundwater bodies 2015

Good

Poor

Unknown

River Basin Districts

Countries outside EU

Note: Standard colours based on WFD Annex V, Article 2.2.4.

Source: WISE, Eurostat (country borders) and corrections/additions provided by EL in late 2014

0 100 200

km

GR01

GR02

GR03

GR04

GR05

GR06

GR07

GR08

GR09

GR10 GR11

GR12

GR13

GR14

EL

0 100 200

km

GR01

GR02

GR03

GR04

GR05

GR06

GR07

GR08

GR09

GR10 GR11

GR12

GR13

GR14

EL

49

7. ASSESSMENT OF ECOLOGICAL STATUS OF SURFACE WATERS

It seems that the different projects commissioned for the development of the different

RBMPs were centrally coordinated by the Special Secretarial for Water; thus, generally a

national approach is followed. At the same time, for GR01/02/03 the actual classification was

done (partly) based on a specific sampling study. For the different RBMPs the information is

provided in a very different way, so it remains unclear if a national approach is transparently

used for all RBDs (it is also unclear due to the lack of national published guidance on

different issues, although EL has stated that internal guidelines have been provided to the

different consultants). Out of the 14 RBMPs that should have been approved by 2009, only

12 RBMPs have been approved so far. The 12 RBMPs that have recently become official

should implement the Programmes of Measures in the following very short period as the

second round of revised Plans should be submitted by 2015, according to the WFD, taking

into account the implementation of the first RBMPs. A PoM-Implementation Progress Report

(national level) has been submitted by EL to the Commission as a reply to an EU enquiry in

December 2014, and was uploaded on WISE on 22.01.2015. It has not been assessed by the

Commission to date.

7.1 Ecological status assessment methods

The assessment methods for the classification of ecological status are only partly developed

for some BQEs and are explicitly described in the Annexes A/6 (Reference conditions of

SWBs). For rivers only the benthic fauna was used; it is stated that "in agreement with the

managing authority, for the classification of rivers in the current RBMPs cycle it was decided

to rely only on the biological quality element (BQE) of benthic macroinvertebrates”.

Accordingly, phytoplankton is the only BQE that is able to produce reliable assessment

methods of the ecological status in lakes. For most of the BQEs specified in the WFD,

national methods for assessing ecological status have not been developed. This is due to the

insufficiency of available data to describe reference conditions, due to the lack of

development of indicators for the parameters estimation for each BQE, or due to inadequate

experience and knowledge on the biology of specific BQEs to link the status of the habitats

with the condition of the water bodies. There are therefore important gaps in the assessment

system.

The overall approach of classification according to the WFD is described, and was principally

based on the One-Out-All-Out principle. It is clearly mentioned that “for water bodies where

there are measurements of priority substances, the One-Out-All-Out principle was followed

among the qualitative data, regardless of the number of parameters for which data have been

available; that is, if a priority substance exceeded the boundaries set, the water body was

classified in a lower than good status”. Similarly, in cases where, based on the available data,

the BQEs resulted a good status but physicochemical parameters failed, the ecological status

has been classified as moderate. In cases where correlation in the monitoring data was not

evident, at the time and the position of the sampling for physicochemical parameters, and the

BQEs exhibited discrepancies, the physicochemical data were not used for the classification

of the water bodies (mainly in the RBDs GR06 and GR07). At the same time, and based on

the way the classification was done, it is not possible to say if this principle was followed in

practice.

It is highly questionable whether the classification system is responsive to all pressures as

relevant information is insufficient. In some RBMPs there is a brief mention of the different

pressures addressed by the classification system (e.g. the phytoplankton increases

eutrophication in a lake system), but not sufficient information on which BQEs are detecting

50

which pressures. For GR09 the same applies for the information from the Prespa plan as well.

In the case of GR11/12, it is explicitly mentioned that at this stage the system is not using

calibrated measurements of the BQE to determine whether there is a correlation between the

abstraction levels from rivers and their ecological status assessed by the measurements of the

BQE. In the case of river water bodies for which no data are available from monitoring

programmes, a process of grouping of the water bodies was followed for GR04/05/08/09/10

in relation to the different pressures. The main idea of grouping is that water bodies of the

same type which are subject to similar levels of anthropogenic pressures are likely to have the

same ecological quality. The purpose was to minimise the number of water bodies that would

be characterised as of unknown ecological status. As this approach is indirect, this type of

assessment has a low level of confidence.

In general, it is mentioned that the classification of water bodies in terms of physico-chemical

QEs was supplementary to the assessment of the BQEs (respecting the One-Out-All-Out

(OOAO) principle); that is these QEs are used to assist in determining the ecological status of

surface water bodies. The elements that are assessed include the transparency, thermal

conditions, oxygen conditions, salinity, acidification conditions and nutrient conditions. For

the RBMPs of GR01/02/03, regarding the classification, there was very limited monitoring

information available. One specification regarding the way the physico-chemical QEs were

dealt with in practice is the sampling study used for some water bodies. The study collected

samples and measurements concerning the biodiversity and carrying capacity of rivers such

as for macroinvertebrates. In this case, the physico-chemical parameters were determined in

situ with a portable multi-parameter instrument. For the RBMPs of GR06/07 it is clearly

stated that physico-chemcial QEs were not used for the classification of the ecological status

for surface water bodies. For the RBMPs of GR04/05/08/09/10/11/12, the assessment is

conducted through measured data (limited years) of the General Chemical State Laboratory,

the Ministry of Rural Development and Food, Universities, and the Decentralised

Administrations, Water Directorates. These are then compared to the relevant environmental

quality standards (EQS) for each water body category. When the value of the parameters

complies with standards, the water body is classified as in good status; in the opposite case

the water body is classified as in a less than good status. The values refer to the boundary

between good and moderate status, which according to the general classification scheme,

determines the possibility of relegation measured by the BQEs of ecological status of a water

body from good to moderate.

Theoretically, EQSs have been established. The relevant Ministerial Decision

(51354/2641/Ε103/2010) establishes Environmental Quality Standards for 101 chemical

compounds or groups of compounds, of which 41 are priority substances and other pollutants,

which have been agreed within the European Union (Directive 2008/105/EC) and 60 relating

to specific pollutants, which either have been detected in water bodies of the country or

identified in previous legislation. Note that the priority substances characterise the chemical

status of water, as defined in the WFD and the specific pollutants are used to assist in

determining ecological status. In the Annexes it is mentioned that “the specific pollutants are

supporting parameters which are also considered for the classification of ecological status;

the classification of a water body is not good if a specific pollutant does not meet the

specified environmental quality standards”. Consequently, it seems that all pollutants referred

to in the WFD-Annexes VIII and X are covered by the Ministerial Decision. No reference is

provided on how the EQSs were established. Additionally, it is noted that only very limited

monitoring information is available regarding these pollutants in the RBDs.

The overall approach of classification according to the WFD is described, including the One-

Out-All-Out principle. It is implied on several occasions that the total ecological status of the

51

water system is determined by the results of the biological, physico-chemical and

hydromorphological quality elements taking into account the worst category (i.e. the part of

the quality most affected by human activity); that is the One-Out-All-Out principle. The

hydromorphological data were taken into account only to rank the “high” status. At the same

time, and based on the way the classification was done, it is not possible to say if this

principle was followed in practice.

Based on the very limited information available for the classification of the surface water

bodies and the common use of expert judgement, etc., the uncertainty is classified in three

categories as follows:

Large Uncertainty: concerns water bodies in which there was no monitoring station;

Medium Uncertainty : where there is one monitoring station (either from the sampling

study, or from the existing monitoring network);

Small Uncertainty: where there is more than one monitoring station. If in a water body

several monitoring results exist and the assessments do not agree, then the uncertainty is

characterised as medium.

Not defined uncertainty: where the situation remains unknown.

Specifically, in the GR04/05/08/11/12, regardless of the parameter for which the analysis was

conducted the level of uncertainty was considered:

Limited Uncertainty for the types with more than 7 samples;

Medium Uncertainty for the types that did not comply with the above condition;

High Uncertainty for the types with less than 4 samples or 4 stations;

Large Uncertainty in cases where no data were available and the determination of the

values was done through the expert judgment.

It has to be noted that regarding the main data gaps and uncertainties relating to surface

waters there are delays in determining the physico-chemical and hydromorphological

standards so it is not possible to set reference conditions and class boundaries between high,

good condition, etc.

All water body types are covered by a classification system. For most of the BQEs specified

in the WFD, national methods for assessing ecological status for the case of Greece have not

been developed. This is due to the insufficiency of available data to describe reference

conditions, due to the lack of development of indicators for the parameters estimation for

each BQE, or due to inadequate experience and knowledge on the biology of specific BQEs

to link the status of the habitats with the condition of the water bodies. For GR05/09/10/11/12

the transitional waters are assessed based on the criteria that are used for the coastal waters

and for the coastal waters there is only one water body type for the whole country in order to

avoid increased fragmentation.

The intercalibration work is mentioned only in general. The class boundaries are in almost all

cases not used for the actual classification of water bodies due to the lack of data. No data is

available to cross-check the intercalibration decision with what is mentioned in the relevant

Annexes. The boundaries used for the case of Greece for the respective types (R-M1, R-M2

and RM-4), referred only to the biological quality element of benthic macroinvertebrates; the

purpose was to evaluate which is the common Intercalibration Common Metrics index

(ICMi), as a national assessment method for the ecological status to be involved in the

exercise was not fully developed. Additionally, Greece’s involvement in the intercalibration

52

exercise of the countries of the Mediterranean eco-region was fragmented. As a result any

national methods that were developed in the context of individual pilot projects implementing

the WFD cannot be matched with the methods developed by other countries. Consequently,

there is a lack of commonly accepted values of reference conditions and class boundaries of

the ecological status classification including national methods that have been used at times in

other Mediterranean countries.

The background documents that have been reported as Annexes to the RBMPs are Annexes

A/6 (Reference conditions for SWBs) and A/9 (Classification of SWBs). In terms of a

national Guidance Document, guidelines were formulated by the coordinator consultant and

the General Secretariat for Water to guide/harmonise the work and methodological approach

of all other consultants who were commissioned with the drafting of the RBMPs, but these

were not organised into a detailed guidance document.

53

RBD

Rivers Lakes Transitional Coastal

Ph

yto

pla

nk

ton

Macro

ph

yte

s

Ph

yto

ben

thos

Ben

thic

in

ver

teb

rate

s

Fis

h

Ph

ysi

co-C

hem

ical

Hyd

rom

orp

holo

gic

al

Ph

yto

pla

nk

ton

Macro

ph

yte

s

Ph

yto

ben

thos

Ben

thic

in

ver

teb

rate

s

Fis

h

Ph

ysi

co-C

hem

ical

Hyd

rom

orp

holo

gic

al

Ph

yto

pla

nk

ton

Macro

alg

ae

An

gio

sper

ms

Ben

thic

in

ver

teb

rate

s

Fis

h

Ph

ysi

co-C

hem

ical

Hyd

rom

orp

holo

gic

al

Ph

yto

pla

nk

ton

Macro

alg

ae

An

gio

sper

ms

Ben

thic

in

ver

teb

rate

s

Ph

ysi

co-C

hem

ical

Hyd

rom

orp

holo

gic

al

GR01

GR02

GR03

GR04

GR05

GR06

GR07

GR08 - - - - - - -

GR09

GR10

GR11

GR12

GR13

GR14

Table 7.1.1: Availability of biological assessment methods as reflected in the RBMPs. Some of the methods marked in red may be under development but the information

available is unclear.

Assessment methods fully developed

Assessment methods partially developed or under development

Assessment methods not developed for BQEs, no information provided on the assessment methods or unclear information provided

- Water category not relevant Source: RBMPs (Annex A/6 Reference Conditions of SWBs). Note: EL provided alternative formulation of this Table, reflecting on-going development of methods).

54

7.2 Application of methods and ecological status results

The national monitoring network (defined by the Common Ministerial Decree 140384/2011)

was not operational by the time of data collection for the purposes of the RBMPs in order to

assess the current status of SWR. Thus, the data for the compilation of the RBMPs were

collected by the Ministry of Environment, Energy and Climate Change, the Ministry of Rural

Development and Food, the Water Directorates of the Regions, etc. as well as through

relevant studies and surveys and were fragmented. The difficulty of the issue to assess the

ecological status, due to lack of data, can only be addressed through the implementation of

the national monitoring program. It is explicitly stated that once this new monitoring

programme is operational and in the revision of the RBMPs, the Special Secretariat for

Water, the competent agencies and the scientific community will undertake further

investigation of the appropriate indicators for the next management period.

Although there is information on which specific pollutants are responsible for failure of

ecological status of the water bodies, uncertainty does remain since data limitation has in

many cases hindered a full scale assessment of all pollutants. It is quite unclear whether the

most sensitive biological quality elements have been selected for ecological status assessment

for operational monitoring sites. The national monitoring network was not operational by the

time of data collection for the purposes of RBMPs. It is highly questionable whether the

classification system is responsive to all pressures as relevant information is insufficient. In

some RBMPs there is a brief mention of the different pressures addressed by the

classification system, but not sufficient information on which BQEs are addressing which

pressures.

There is very limited information regarding the confidence and precision of the different parts

of the classification system for the ecological status. For example in GR05/11/12, in the

calculation of the Bentix indicator, the level of confidence is considered low when the

number of species is 3 or less, the number of items is 6 or less, the percentage of disregarded

species is 7% or more, or the percentage of species that are not calibrated is 20% or more.

This is very fragmented information.

For GR09/10, the water bodies are characterised with low confidence when the classification

is based only on biological elements with a parallel assessment of the nutrient. Water bodies

are also characterised of low confidence when the classification has only been based on

physico-chemical characteristics and specific pollutants. They are characterised as of medium

confidence when their classification is based on biological characteristics, physicochemical

and specific pollutants (from systematic measurements of the General Chemical State

Laboratory and the Region of Central Macedonia.

55

RBD CAS Number Substance Percentage Water Bodies

Failing Status (%)

GR01

Zinc (3 failing out of 128 SWBs) 2.3

Molybdenum (3 failing out of 128

SWBs) 2.3

Sulfonic acid/LAS (4 failing out of

128 SWBs) 3.1

GR02

Zinc (1 failing out of 97 SWBs) 1

Copper (1 failing out of 97 SWBs) 1

Sulfonic acid/LAS (2 failing out of

97 SWBs) 2.1

Cyanide (2 failing out of 97

SWBs) 2.1

GR03

Zinc (2 failing out of 100 SWBs) 2

Sulfonic acid/LAS (1 failing out of

100 SWBs) 1

GR04* Methamidofhos(iso) (3 WBs out of

120)

Monolinuron (ISO) (3 WBs out of

120)

LAS (2 WB out of 120)

Zinc (1 WB out of 120)

5

GR05* Molybdenum (16 WBs out of 106)

Monolinuron (ISO) (1WBs out of

106)

Tin (1WBs out of 106)

15

GR08* Monolinuron (ISO) (6WBs out of

86)

Methamidofhos(iso) (6WBs out of

86)

Copper (1WBs out of 86)

Zinc (1WBs out of 86)

14

GR09* LAS (19 failing out of 150 SWBS) 12,6

GR10* Selinum -Sn (2 failing out of 104

SWBS)

1,9

GR11 Molybdenum (1 WB out of 98) 1

Zinc (1 WB out of 98) 1

GR12

Sn (Tin) (16 WBS out of 211) 7.6

Cu (Copper) (1 WB out of 211) 0.5

Molybdenum (9 WB out of 211) 4.3

As (Arsenic) (3 WBs out of 211) 1.4

Table 7.3.1: River basin specific pollutants causing failure of status

Source: RBMPs (Template 12 (Chemical Measures), question 3)

* corrections/additions provided by EL in late 2014

56

8. DESIGNATION OF HEAVILY MODIFIED WATER BODIES (HMWB) AND ASSESSMENT OF

GOOD ECOLOGICAL POTENTIAL

Figure 8.1: Map of percentage Heavily Modified and Artificial waterbodies by River Basin District

0 – 5 %

5 – 20 %

20 – 40 %

40 – 60%

60 – 100 %

No data reported

River Basin Districts

Countries outside EU

Source: WISE, Eurostat (country borders)

8.1 Designation of HMWBs

Based on the information submitted by EL in late 2014, 235 water bodies are designated as

HMWB/AWB in the 12 RBDs for which the RBMPs are available (189 HMWBs and 46

AWBs). These represent approximately 17.2% of the reported 1366 surface water bodies.

There are some differences between the information submitted by EL in late 2014, the

information reported in WISE and the numbers found in the RBMPs.

The water uses that are linked to the water bodies designated as HMWB as well as the types

of physical modifications leading to the designation are mentioned briefly in most but not all

RBDs, with differences regarding the way relevant information is presented in each group of

RBMPs: GR1/2/3, 4/5/8, 6/7, 9/10 and 11/12.

Aegean Sea

Mediterranean Sea

Black Sea

GR09

GR08

GR12

GR04

GR10

GR11

GR05

GR13

GR07

GR03GR01

GR02GR06

GR14

0 100 200

km

57

In most cases, the starting point for the designation is the list of water bodies “preliminarily

identified” as HMWB/AWB – mostly at the end confirming their final designation.

Exceptions are e.g. GR11/12 where a significantly different list of water bodies is “tested”

regarding the HMWB/AWB-designation as the ones provisionally identified in the past, but

also confirming that all tested water bodies are HMWB/AWB. In GR9/10, there is no

reference to the “preliminarily identified” HMWB/AWB as a starting point for the

designation.

Information on methodologies and the approach to designate HMWB/AWB varies across

RBMPs. It seems that no national legislation or guidance exists on the issue. All plans refer to

the use of the CIS Guidance document N°4. For Greece, the practical approach for

designation is described with varying detail for each RBD, mostly covering the steps as

described in the guidance.

The level of detail for answering each “designation step” is different and generally can be

considered as very brief or not sufficient. In addition, the way to present the designation

process differs significantly: the step-wise approach in some cases is followed more “strictly”

and with the specific results of each step summarised per water body; in others the required

steps are not followed that clearly and the assessment is done in a summary way (e.g. in

GR4/5/8/11/12).

In more detail, criteria (or thresholds) for defining substantial changes in character and

significant adverse effects of restoration measures on the use are not clearly stated and expert

judgment has been used extensively, with only brief information provided on this. Similarly,

the identification of “better environmental options” is very brief and the analytical criteria for

this step are mostly not clear. There is no real consideration of e.g. water demand measures or

reduction of irrigation water demands as an alternative to increasing water supply e.g.

through a dam.

HWMB/AWBs are also designated in relation to new construction works or dams currently

being built. Some RBMPs classify water bodies to be affected by dams currently under

construction as HMWBs, instead of applying Article 4.7 of the WFD.

Uncertainties are mentioned in general in most RBDs concerning the HMWB/AWB

designation process, due to the lack of relevant monitoring data.

Regarding future re-assessment of the HMWB/AWB-designation, GR1/2/3 (but not the other

RBMPs assessed) mention that “during the first revision of management plans the

designation of HMWB/AWB has to be reconsidered, taking into account additional

information and measurements which will then be available as well as developments

regarding the setting of GEP through the intercalibration activities for the whole area of the

RBD and for all types of surface water bodies. All this will then be taken into account in the

PoM that will be proposed in the RBMP of the particular RBD.” GR4/5/8 mention more

specifically that “for water bodies below dams, further analysis is needed (based on better

monitoring results, etc.) regarding the “significance of alteration” and thus if GES can be

reached in these water bodies - giving the final answer if these water bodies are HMWB or

not.” In all RBDs, there is no specific mention of planned improvements to the methodology

applied.

58

HMWB

or

AWB

RBD

Water category

Rivers Lakes Transitional water Coastal water All water bodies

Number % of

category Number

% of

category Number

% of

category Number

% of

category Number %

HMWB

GR01 15 14 2 100 0 0 0 0 17 13%

GR02 4 6 3 50 0 0 1 5 8 8%

GR03 9 11 1 100 0 0 0 0 10 10%

GR04 18* 12* 0* 0* 0* 0* 1* 11* 19* 16%

GR05 10* 13* 1* 100 0 0 2 15 13 12%

GR06 1 7 1 100 0 0 2 14 4 14%

GR07 3 4 0 0 0 0 0 3 3%

GR08 6* 8* 1* 100* 0* 0* 1* 14* 8* 10%

GR09 26 17 8 57 0 0 0 0 34 20%

GR10 2 2 1 17 0 0 1 9 4 3%

GR11 27 30 2 100 0 0 0 0 29 30%

GR12 34 18 5 83 0 0 1 8 40 19%

GR13 - - - - - - - - - -

GR14 - - - - - - - - - -

Total 155 14 25 52 0 0 9 7 189 14

AWB

GR01 2 2 0 0 0 0 0 0 2 2%

GR02 0 0 1 17 0 0 0 0 1 1%

GR03 1 1 0 0 0 0 0 0 1 1%

GR04 0* 0* 0* 0* 0* 0* 0* 0* 0* 0

GR05 3 3 0 0 0 0 0 0 3 3%

GR06 0 0 0 0 0 0 0 0 0 0%

GR07 5 6 0 0 0 0 0 0 5 5%

GR08 4* 5* 0* 0* 0* 0* 0* 0* 4* 5

GR09 10 7 0 0 0 0 0 0 10 6%

GR10 10 10 1 17 0 0 1 9 12 10%

GR11 3 3 0 0 0 0 0 0 3 3%

GR12 5 3 0 0 0 0 0 0 5 2%

GR13 - - - - - - - - - -

59

HMWB

or

AWB

RBD

Water category

Rivers Lakes Transitional water Coastal water All water bodies

Number % of

category Number

% of

category Number

% of

category Number

% of

category Number %

GR14 - - - - - - - - - -

Total 43 4 2 4 0 0 1 1 46 3

Table 8.1.1: Number and percentage of HMWBs and AWBs.

Source: WISE, corrections/additions provided by EL in late 2014 (marked with *). Some discrepancies between this information and the RBMPs/their Annexes.

60

8.2 Methodology for setting good ecological potential (GEP)

While HMWBs/AWBs have been designated, the RBMPs do not define GEP, so the relevant

steps for setting GEP have not been applied, which is not in line with the WFD requirements.

No national guidance exists on the issue, while no specific plans are mentioned in the RBMPs

for setting GEP. According to the Greek authorities a national guidance will be developed in

the future.

According to Greek authorities, given the lack of methodologies, for the first RBMP GEP

was defined as equal to Good Ecological Status (GES). This statement is implausible from

the point of view of the WFD. If the water body is designated as HMWB is because the

physical modification that is necessary to enable the water use does not allow the water body

to achieve GES. The underlying problem is the lack of assessment methods which are

sensitive to hydromorphological modifications. This lack of sensitive methods makes it

impossible to effectively derive and implement GEP and to measure the improvements

achieved to the associated mitigation measures.

8.3 Results of ecological potential assessment in HMWB and AWB

As stated above, no GEP has been defined. At the same time, GR4/5/6/7/8/9/10/11/12

mention that for this implementation cycle, the GEP is defined as the usual “good ecological

status”; at the same time, GR1/2/3 just mention GEP as the objective for HMWB/AWB,

without any further specification.

61

9. ASSESSMENT OF CHEMICAL STATUS OF SURFACE WATERS

9.1 Methodological approach to the assessment

The relevant Ministerial Decree 51354/Ε103/2010 (FΕΚ 1909Β/8-12-2010) includes the

substances listed in Annex I of the Environmental Quality Standards Directive (EQSD). The

Decree calls for the consideration of background concentrations as well as bioavailability

factors of metals, and for the monitoring of biota and sediments. It also presents an approach

for monitoring in mixing zones (Article 4).

It is recognised that only a few priority substances (e.g. in GR05: Cadmium, Nickel, Lead

and Mercury) were measured in most water bodies of the RBDs with an exception of certain

water bodies (e.g. in GR05, Lake Pamvotida) where additional priority substances were

measured. It is not clear whether only specific substances have been assessed (as opposed to

all of them) because expert judgment and/or existing studies ruled out the relevance of others

for the specific surface water body. It appears also that the substances used in the assessment

were not common across the water bodies, i.e. different substances have been used in

different water bodies. The standards used for the all substances follow Annex I of the

EQSD.

Neither the standards in biota or sediment nor the background concentrations that are set in

the relevant decree 51354/Ε103/2010 (FΕΚ 1909Β/8-12-2010) were implemented in the

assessed RBMPs. Bioavailability was also not applied. The same applies for the issue of

mixing zones (Article 4).

Table 9.1.1 lists the substances reported as responsible for exceedances per RBD, mentioning

also the number of water bodies per substance. According to the table, heavy metals (present

in 88 water bodies across the RBDs), other pollutants (present in 40 water bodies across the

RBDs) and pesticides (present in 39 water bodies across the RBDs) are mainly responsible

for those exceedances. It can also be noted that GR12 (96 WBs), GR11 (38 WBs) and GR03

(32 WBs) are the RBDs with the highest number of water bodies with exceedances.

Substance causing

exceedance

Exceedances per RBD

GR

01

GR

02

GR

03

GR

04

GR

05

GR

06

GR

07

GR

08

GR

09

GR

10

GR

11

GR

12

GR

13

GR

14

1 Heavy Metals -

aggregated 4 6 16 11 9 42

1.1 Cadmium 1 5 1* 5* 2

1.2 Lead 3

1.3 Mercury 10 1*

1.4 Nickel 2

2 Pesticides – aggregated 14 25

2.5 Diuron 3* 1 3 4*

2.5 Isopruton 2*

3 Industrial Pollutants -

aggregated 1 13 10

3.3 Brominated

Diphenylether 1 1*

3.8 Di(2-

ethylhexyl)phthalate

(DEHP)

1

4 Other pollutants - 7 3 11 2 2 15

62

Substance causing

exceedance

Exceedances per RBD

GR

01

GR

02

GR

03

GR

04

GR

05

GR

06

GR

07

GR

08

GR

09

GR

10

GR

11

GR

12

GR

13

GR

14

aggregated

4.9 Hexachlorobutadiene 3 1

4.11 Polyaromatic

hydrocarbons 4

4.17 Tributyltin

compounds 3* 1 3 4*

Table 9.1.1: Substances responsible for exceedances

Source: WISE

*corrections/additions provided by EL in late 2014.

63

10. ASSESSMENT OF GROUNDWATER STATUS

The Common Ministerial Decree 39626/2208/ Ε130/2009 sets the measures for the protection

of groundwater against pollution and deterioration, in compliance with the provisions of the

EU Directive 2006/118/EC.

All groundwater bodies (GWBs) (366 in total) have been assessed for both chemical and

quantitative status. There are 15% of GWBs in poor chemical status and 17% are in poor

quantitative status, while 78% are in good status for both chemical and quantitative aspects.

Status

Poor

chemical

status

Poor

quantitative

status

Good

status

GR01 2 2 24

GR02 4 2 22*

GR03 10* 5 17*

GR04 1* 3* 23*

GR05 1 1 25

GR06 11 9 12

GR07 6 5 38

GR08 4* 10* 21*

GR09 4 14 48

GR10 8 11 26

GR11 1 1 14

GR12 4 0 14

GR13 - - -

GR14 - - -

Total 56 63 284

Table 10.1: Number and percentage of groundwater bodies and their status.

Source: WISE

*corrections/additions provided by EL in late 2014

10.1 Quantitative status

In the 12 RBDs reviewed so far in this report, approximately 83% of groundwater bodies are

in good quantitative status and 17% in poor. The main reason for failure to achieve good

quantitative status was reported to be the exceedance of the available groundwater resource

by the long-term annual average rate of abstraction, which may result in a decrease of

groundwater levels and saline intrusion. The significant diminution of the status of surface

waters was reported as an additional reason in one GWB of GR11.

For the assessment of the GW quantitative status the following criteria are mentioned to be

considered in principle:

1) Checking the water balance.

64

2) Checking the impact on surface water flow conditions: the influence of a GWB on SWBs

is considered significant and further investigated when the groundwater abstractions are more

than 50% of the total freshwater abstractions of the River Basin of the respective SWB.

3) Checking the impact on terrestrial ecosystems.

4) Checking saline intrusion: definition of mean annual abstractions in combination with the

long-term annual average change of groundwater levels in order to locate the saline water

front.

The above mentioned Water Framework and Groundwater Directives’ criteria have been

adjusted in practice to the limitations or constraints imposed by the available data during the

implementation process. Thus, in practice, the above checks are not consistently performed in

all of the GWBs due to data limitations in terms of adequacy, continuity, frequency, and

spatiotemporal coverage. The quantitative comparison of the balance between recharge and

abstraction was not always feasible (e.g. in 39% of the GR12 GWBs), the groundwater level

records were sometimes limited to 5 year-long records (e.g. in GR01), impeding trend

detection. In these cases the assessment was based on simplified practical criteria, supportive

evidence and expert knowledge. It seems that the balance between recharge and abstraction,

the groundwater level trends, the impacts of abstractions (considered significant if more than

50% of the total freshwater abstractions of the River Basin with associated SWBs), and the

identification of saline intrusion were the criteria mostly considered in the assessment, and of

course to the extent that they were underpinned by available data. It has to be noted that the

data on abstraction were mostly estimates obtained from water needs and water use data.

10.2 Groundwater chemical status

In the 12 RBDs assessed in this report, approximately 85% of groundwater bodies are in good

chemical status and 15% in poor. The main pollutants causing failure to achieve good

chemical status were most commonly reported to be chloride, nitrates, conductivity and

sulphate, followed by aluminium, lead, chromium, nickel and arsenic. Ammonium was also

reported in some cases. It must be noted that the assessment of chemical status has been

based on the parameters for which data were available for at least two consecutive years.

Thus, in most GWBs these were limited to pH, conductivity, chloride, nitrates, nitrogen

dioxide, ammonium, sulphate. Lead, chromium, nickel and aluminium were assessed in a

subset of the GWBs, while dissolved oxygen, cadmium, arsenic, mercury, trichloroethylene-

tetrachloroethylene and pesticides have not been assessed due to non-availability of data.

Some GWBs have been classified as good chemical status although threshold values (TVs)

were exceeded at one or more monitoring points, as long as these were less than 20% of the

total number of monitoring sites in the whole GWB. Additional criteria are mentioned to be

considered in this case such as the assessment of saline intrusion, the assessment of the

degradation of chemical and ecological status of the SWBs (in case the contribution of

pollutants from a GWB to SWBs is more than 50%, the former is classified as being in poor

chemical status), the assessment of the degradation of terrestrial ecosystems, and the

assessment of the impact on drinking water resources. It seems, however, that the 20%

criterion (maximum allowed number of monitoring sites exceeding GW TVs) was the one

that mostly influenced the assessment, along with the identification of anthropogenic

pressures.

In general, limited data were available on the groundwater chemical parameters, which often

led to the adoption of some simplifications. The diminution of surface water chemistry and

ecology and the damage to groundwater-dependent terrestrial ecosystems due to transfer of

65

pollutants from GWBs has been considered in the assessment of the chemical status of GWBs

in cases where possible and based on simplified and practical criteria (e.g. in case the

contribution of pollutants from a GWB to SWB(s) is more than 50%, the former is classified

as being in poor chemical status).

There is no obvious statement that all pollutants posing a risk of failing environmental

objectives for GWBs have been considered. There are no data available for trichloroethylene

and tetrachloroethylene. Thus, these parameters have not been considered in the assessments

and no relevant maps could be produced. The measurements of heavy metals (Pb, Cd, As,

Hg) have not been systematic. Thus, in many GWBs these data have also not been considered

in the assessment. There are nevertheless additional parameters and indicators which have

been considered in the assessments (additional to the ones proposed by the Annex II Part B of

the GWD) such as pH, NO2, NO3 and in some cases Fe, Mn, Mg, B, and for which there are

indications if TVs are exceeded, which indirectly implies that the actual relevant pollutants

might have been considered.

The TVs used for the assessment of the GWBs’ chemical status are based on the national

values as defined by the Ministerial Decree 1811/30-12-2011. This Ministerial Decree

defines the quality standards (QSs) and TVs at national level based on Art. 3 of the Common

Ministerial Decision 39626/2208/Ε130/2009. According to the latter, these TVs have been

defined following the Guidelines provided in Annex II Part A of the GWD. For nitrates and

active substances in pesticides the QSs are the ones established in Annex I of the GWD. On

top of the Annex II substances, Greece has also set TVs for Ni, Cr, Al, NO2, NO3 and pH.

The national TVs for GWBs are harmonised with the relevant Drinking Water Quality

Standards due to the fact that a majority of the GWBs are used to cover drinking water needs,

but to also allow the cross-comparison across GWBs and in relation to other EU GWBs.

According to the Ministerial Decree 1811 the TVs can be adjusted due to natural background

levels on a case-by-case basis, and this was actually applied in some GWBs where the high

levels were solely due to natural background and not any anthropogenic causes.

Upward trends have been identified in the GWBs with available data (time-series of

significant length). A significant upward trend is defined when the rate of increase of the

concentration of a substance is higher than 10% of the respective TV. The trend of the GWB

is identified when at least 80% of the monitoring sites of the GWB demonstrate a significant

upward trend. The time-series considered were of variable lengths across the GWBs (in some

limited to 4 years, while in others 8-15 years long). For the next cycle of the RBMPs it is

suggested (as depicted in some RBMPs) that the year 2007-2008 is used as a reference, which

is the year benchmarking the beginning of the new Monitoring Programme. All starting

points for trend reversal are defined with 75 % of the GW-QS and TVs, but no methodology

is defined yet (either because upward trends have not been identified in the GWBs with

available data, or due to lack of information). There is no mention of the assessment of

plumes in the RBMPs.

10.3 Protected areas

The status of groundwater drinking water protected areas is presented in Table 10.3.1 below.

In total 89 groundwater drinking water protected areas are identified for the whole territory,

of which 95.5% are classified in good status and 4.5% in unknown.

No information is available on the status of other protected areas such as water-dependent

Natura 2000 protected areas, as the objectives have not been set (see section 11.1).

66

RBD Good Failing to

achieve good Unknown

GR01 4

GR02 5

GR03 3

GR04 4* - -

GR05 8

GR06 3

GR07 10 4

GR08 4* - -

GR09 9

GR10 3

GR11 14

GR12 18

GR13 - - -

GR14 - - -

Total 85 0 4

Table 10.3.1: Status of groundwater drinking water protected areas

Source: WISE

*corrections/additions provided by EL in late 2014

67

11. ENVIRONMENTAL OBJECTIVES AND EXEMPTIONS

Based on the information submitted by EL in late 2014, Greece has set the objective to

achieve good or better status in 330 surface water bodies (24%) by 2015, with a 5.5 %

increase compared with the 2009 figures (Table 6.7). This figure is significantly lower than

the EU average.

The numbers of water bodies at good or better status varies significantly from RBD to RBD

regarding the increase expected (from 0 to 18%) as well as regarding the number of water

bodies in good status in 2015 (1.9% to 59%), even if the number and types of measures taken

does not differ significantly among the RBDs.

The issue of water bodies currently in “unknown” status and when they will reach good or

better status differs between the RBDs: GR11/12 mention that all water bodies currently in

unknown status will reach good or better status by 2015. The other RBDs mention that after

more monitoring information becomes available, the situation will have to be assessed and

potentially more measures taken.

In groundwater bodies, no increase regarding good quantitative status (Table 6.11) is

expected from 2009 to 2015 (while the 2009 number of groundwater bodies in good status is

already high (83.1%)). There is a similar situation regarding chemical status (Table 6.10),

with an increase of 0.3% (from the already high percentage of groundwater bodies in good

chemical status (84.7%)).

11.1 Additional objectives in protected areas

Protected areas (for drinking water, shellfish, bathing water and Natura 2000 sites) have been

designated in all of the RBDs.

No additional objectives going beyond the achievement of good ecological status/potential

are set or defined. For protected areas, the main environmental objectives are the compliance

(by 2015 at the latest) with the specific standards and objectives of Community legislation

under which the individual protected areas have been established, and achieving good status

by 2015.

11.2 Exemptions according to Article 4(4) and 4(5)

There are some discrepancies in the reporting of the numbers of Article 4.4. and Article 4.5

exemptions applied between the corrections provided by EL in late 2014, the WISE data and

the RBMPs/their Annexes. Based on the information provided by EL, there are a total of 430

Article 4.4 exemptions reported, and none for Article 4.5.

Overall, no methodology for the “disproportionality of costs” argument was developed or

found. There is very limited use of the “natural conditions” argument.

Most of the Article 4.4 exemptions (266) are applied with the reason of “technical

infeasibility” given. The general argument behind these exemptions (even if the details of the

argument differ according to the RBD) is that there is insufficient time available for the

measures to be implemented or to “work” (long recovery time of the water bodies, which

seems to be more related to natural conditions), so that the water bodies reach good status in

time. The use of these arguments for exemptions in the Greek RBMPs are therefore not

sufficiently clear.

68

Regarding Article 4.4, indications of which impacts and which drivers are causing the

application of this exemption can be found in most RBDs (but not in GR11/12), but with

varying level of detail. In some RBDs, a summary table is given for each exemption

according to Art. 4.4, in which the “potential reasons for not reaching the environmental

objectives” as well as the impacts of these drivers were indicated.

It needs to be noted that a large number of water bodies in Greece is in “unknown” status. For

these water bodies, no exemption has been applied so far. It is unclear if – after additional

monitoring information becomes available – these water bodies will be in “good status”, so

additional exemptions might then have to be justified.

RBD Article 4(4) Article 4(5)

R L T C GW R L T C GW

GR01 5* 0 0 0 2 0 0 0 0 0

GR02 3* 0 0 1* 4* 0 0 0 0 0*

GR03 32* 0 0 1 10 0 0 0 0 0*

GR04 7* 5* 4* 2* 2* 0* 0* 0* 0* 0*

GR05 6* 1 4 4 1* 0* 0 0 0 0

GR06 7 0 0 7 12 0 0 0 0 0

GR07 28 0 1* 6 8 0 0 0 0 0

GR08 50* 1* 0* 2* 11* 0* 0* 0* 0* 0*

GR09 17 5 1 0 14 0 0 0 0 0

GR10 9 2 1 1 12 0 0 0 0 0

GR11 46* 2 1 2 1 0 0 0 0 0

GR12 74* 4 5 2 4 0 0 0 0 0

GR13 - - - - - - - - - -

GR14 - - - - - - - - - -

Total 284 20 17 28 81 0 0 0 0 0

Table 11.1.1: Number of WBs with Exemptions for Article 4(4) and 4(5)

Source: WISE, corrections/additions provided by EL in late 2014 (marked with *). Some discrepancies between

this information and the RBMPs/their Annexes.

69

RBD

Global9

Technical feasibility Disproportionate

costs Natural conditions

Article

4(4)

Article

4(5)

Article

4(4)

Article

4(5)

Article

4(4)

Article

4(5)

GR01 2* 0* 3* 0* 0* 0*

GR02 3* 0* 1* 0* 0* 0*

GR03 21* 0 12* 0* 0* 0*

GR04 18* 0 0 0 0 0

GR05 15* 0* 0 0 0 0

GR06 14 0 0 0 0 0

GR07 35* 0 0 0 0 0

GR08 53* 0 0 0 0 0

GR09 17 0 0 0 6 0

GR10 5 0 8 0 0 0

GR11 51* 0 0 0 0 0

GR12 85* 0 0 0 0 0

GR13 - - - - - -

GR14 - - - - - -

Total 266 0 24 0 6 0

Table 11.2.1: Number of surface water bodies with Article 4(4) and 4(5) exemptions

Source: WISE, corrections/additions provided by EL in late 2014 (marked with *). Some discrepancies between

this information and the RBMPs/their Annexes.

Figure 11.2.1: Number of WBs with Article 4(4) and 4(5) exemptions

T = Technical feasibility, D = Disproportionate costs; N = Natural conditions

9 Exemptions are combined for ecological and chemical status. Source: WISE, corrections provided by EL in

late 2014

70

11.3 Exemptions according to Article 4(6)

No exemptions according to Art. 4.6 have been applied.

11.4 Exemptions according to Article 4(7)

Overall, the application of article 4(7) for new modifications (in particular for dams) is

unclear and incomplete in the Greek RBMPs.

The way new modifications are presented and grouped varies significantly (similar in each of

the groups of RBMPs GR 1/2/3, GR 4/5/8, GR 6/7, GR9/10 and GR11/12). In addition, the

way these modifications are initially assessed regarding if Article 4.7 needs to be tested, also

varies among the RBDs and cannot be seen as sufficiently clear; there are many

modifications reported for which it appears that an Article 4.7 exemption should have been

justified (or at least tested).

In seven RBDs (GR4/5/8/9/10/11/12), such exemptions have been applied, while there are

differences regarding the number of water bodies exempted due to Article 4.7 (see Table

11.4.1 below). In addition and beyond these, there are another five RBDs where an

Article 4.7 “test” was done, but in the end the exemptions were not applied:

GR01: 6 cases tested;

GR02: 7 cases tested;

GR03: 13 cases tested;

GR04: 3 additional cases tested to the ones where Art. 4.7 was applied;

GR05: 9 additional cases tested to the ones where Art. 4.7 was applied;

GR06: 6 cases tested;

GR07: 1 case tested (while another 6-8 are briefly discussed in the Art. 4.7 context);

GR08: 11 additional cases tested to the ones where Art. 4.7 was applied;

GR09: 3 additional cases tested to the ones where Art. 4.7 was applied;

GR010: no additional cases tested to the ones where Art. 4.7 was applied;

GR012: 1 additional case tested to the ones where Art. 4.7 was applied.

These tested cases mostly relate to the construction of new dams. Given the severe impacts

that dams have on water bodies, it would be expected that article 4.7 would be applied in all

cases, not only "tested". This appears not to be the case. This may be related to the way the

hydromorphological pressures are assessed (see section 4.4). Only large dams above 15 m are

considered "significant" if the regulating capacity in relation to the river flow is beyond

certain threshold. The impacts are then considered significant downstream of the dam. This

approach overlooks the following important issues:

smaller hydromorphological impacts can be severe, e.g. disruption of continuity is

significant for dams smaller than 15 m

the impacts on the water bodies where the dams will be located and the upstream

stretches where the river is converted into a reservoir are not properly assessed; the

approach seems to consider that if the reservoir, once built, would achieve GEP,

article 4.7 is not needed. Quite the contrary, the achievement of GEP is not equivalent

to GES and therefore all river water bodies which are modified into a reservoir should

71

be considered under article 4(7) as the works will prevent the water bodies from

achieving GES.

overlooks the obligation under article 4.7a to incorporate all mitigation measures into

the new modifications, including the necessary ecological flow to ensure that

downstream water bodies achieve good status.

The justification for the dams according to the conditions in article 4.7 should be included in

the RBMPs, including the strategic alternatives to the dams (e.g., other projects which may

achieve the same objective by other means).

It needs to be noted also that small hydropower plants are treated very differently regarding

the Article 4.7 “testing” (aggregated or per plant, etc.).

As an example of a RBD where no Article 4.7 exemption was identified but the issue was

discussed, GR01 first excludes small projects as well as projects that “have generally (at a

higher level) a positive impact on reaching the WFD-objectives”. It should be stressed that if

a project is liable to cause deterioration or prevent the achievement of GES in a water body,

the fact that has beneficial impact on other water bodies does not mean that article 4.7 would

not be applied. The information on impacts and benefits should be used in the assessment

under article 4.7c in a transparent way. GR01 RBMP presents a very long list (119 projects)

of all planned new measures and modifications (at any planning phase) and states that “for

modifications that will not be completed by 2015 or additional modifications, these have to

be analysed regarding their effects on WFD-implementation and be included in the future

revisions of the RBMP”. This long list includes a column “affects reaching the WFD-

objectives”, where for projects that are already constructed, under construction or with

secured financing, a simple “yes/no” answer is given (NB: nothing is indicated for the

projects in the category with environmental permit or in final/preliminary planning phase).

For six specific projects (the “primary list”), including two dams (one of which is under

construction), one programme regarding at least eleven new micro-dams for hydropower (in

addition to the existing four), as well as three projects for water supply, Article 4.7 is

discussed but not applied.

Regarding the way Article 4.7 is “tested”, again significant variation can be found between

the RBDs. Overall, the plans do not provide sufficiently detailed analysis of the application of

Article 4.7 provisions. For example, the way the environmental effects of a new modification

are assessed is brief with arguments used being e.g. “EIA performed”, no deterioration of

status (even if a big dam is planned), no water bodies affected (since smaller than 0.5 km2),

etc. A benefit of the modification that is often mentioned is reducing abstractions from

groundwater bodies. An especially significant element is the “check” of alternatives that

would be better environmental options (e.g. water demand options) which often is very brief

or non-existent. Cumulative effects have not been taken into account for the assessment under

Article 4(7).

It should be stressed that completion of an EIA does not substitute the assessment under

article 4.7. The objectives, requirements and assessments of the EIA and WFD are

complementary but distinct. Therefore the fact that EIA has been performed does not exempt

Member States from applying article 4.7.

72

RBD Number of Water

Bodies acc. to

corrections provided by

EL in late 2014

Number of

Water Bodies

acc. to WISE-

submission

Number of Water

Bodies acc. to the

RBMPs/Annexes

GR01 0 0 0

GR02 0 0 0

GR03 0 0 0

GR04 5 0 11

GR05 1 0 2

GR06 0 0 0

GR07 0 0 0

GR08 2 0 4

GR09 3 3 3

GR10 4 1 4

GR11 1 1 1

GR12 9 5 9

GR13 - - -

GR14 - - -

Total 25 10 34

Table 11.4.1 Number of WBs with Article 4(7) exemptions

Source: WISE, corrections provided by EL in late 2014, RBMPs/Annexes.

11.5 Exemptions to Groundwater Directive

Overall, no information is included in the RBMPs on exemptions under Article 3 of the

Groundwater Directive.

73

12. PROGRAMMES OF MEASURES

According to Annex VII of the WFD, the RBMPs should contain a summary of the

programmes of measures (PoM), including the ways in which Member States expect to

achieve the objectives of Article 4 of the WFD. The programmes should have been

established by 2009, but are required to become operational only by December 2012. Due to

the delayed submission of the Greek RBMPs, this deadline cannot be kept.

The assessment in this section is based on the PoMs as summarised by the Member State in

its RBMPs.

12.1 Programme of measures – general

Most RBMPs report that after results of the new monitoring network are available, the

RBMP/PoMs will be revised or updated by 2015 (with the exception of GR11/12).

There is no clear link between the identified pressures, the status of water bodies, and thus the

specific needs for the measures to be taken. The RBMPs do not indicate that the status

assessments of surface water and groundwater bodies were used to identify their Programmes

of Measures.

All of the RBMPs include a Programme of Measures (PoM), while no sub-basin reports

regarding the RBMP or the PoM have been prepared with the exception of the Prespa sub-

basin management plan (part of GR09). The PoMs are structured in the following way (this

structure and its specification are similar between the different RBDs, but not identical – the

same approach is taken each in GR1/2/3, GR4/5/6/7/8 and GR11/12):

Basic measures and “programmed actions”: first, the existing implementation status

regarding “other Directives” is presented (mainly by indicating the legal transposition

and actions taken to implement them); while all Directives are indicated as

“implemented”, indications are given per Directive on what additional activities are

planned in order to implement the WFD. These “programmed actions” are presented

differently between PoMs and with varying levels of detail or specification (e.g.

sometimes a clear “bullet list” of actions/summary table is given, indication of the

responsible institution for their implementation, inclusion of relevant information in

WISE, which are missing in other cases). For two RBDs (GR011/12), the “programmed

actions” called “proposals” and their specification is less clear. The number of these

“actions” varies in the different RBDs, while the number of Directives considered and

for which additional action is needed varies too, e.g. with fewer Directives in

GR04/5/8.

“Other basic measures”: here, a list of measures is presented for each RBD (according

to categories as required by Article 11(3)(b-i)); these are similar across the RBDs, but

with some differences (some measures not found in some RBDs) or the addition of

“specific” measures to be taken in some RBDs.

Supplementary measures: these are in support of the basic and other basic measures in

order to comply with the WFD-objectives. Some RBDs (e.g. GR1/2/3) include a

specific explanation or analysis for which water bodies supplementary measures are

needed (that is, supplementary measures taken for water bodies which - based on the

current limited knowledge - are in either moderate, poor or bad status as well as for

water bodies that are either in unknown or in good condition but there is clear evidence

through the analysis of pressures that they are at risk of not achieving the

74

environmental objectives; GR09/10 explain that the decision regarding for which WBs

supplementary measures are needed was an assessment on if the basic/other basic

measures are sufficient to reach good status or not). Such an explanation is missing in

other RBDs; a clear indication that supplementary measures are taken also in water

bodies of “unknown” status is only found in GR01/2/3. Overall, it remains unclear how

the need for supplementary measures is identified in practice, since there is no

methodology developed for the assessment of the effects of basic and other basic

measures. GR01/2/3/9/10 also include a distinction of supplementary measures into

horizontal (for the whole RBD) and specific (for specific water bodies), which has not

been done for the other RBDs. Some RBDs indicate which measure is applied in which

water body, others do not. In most cases, “construction works” (new dams, etc.) are

included as supplementary measures in the PoM. There are no measures specifically

oriented towards water bodies that are in “unknown” status, although some of the more

general measures will affect them.

Regarding the timing of measures, in all RBDs a “prioritisation” of measures has been done,

which is similar but not identical among the different plans. In principle, the short-term

measures will be implemented within this management period (i.e. by 2015); measures

implemented 2015-2021 are mid-term, while the appropriate preparation and programming of

activities takes place in the current management period; measures implemented 2021-2027

are long-term, since these need a long preparation time for their implementation. All RBMPs

contain an indication of whether measures are short-, mid- or long-term.

Regarding the indication of the level or scale at which the measures have been established,

this varies greatly among the RBDs. Many measures presented in the RBMPs have a national

or basin-wide scope; at the same time, the information provided in WISE on the geographic

scope varies between the RBDs, even for the same measure (e.g. concerning the “other basic”

measures, GR1/2/3 indicate “national level” while e.g. for GR11/12 the implementation level

is indicated as national, RBD, part of RBD or groundwater body for each measure).

The authorities responsible for the implementation of measures are indicated in most RBDs

(in some they are called: “involved authorities”), with public authorities being responsible for

almost all measures (there is specific mention of private entities also contributing to some

specific measures in GR04/5/7/8/9/10).

Regarding the cost-effectiveness calculation of measures, this is not referred to in any PoM or

RBMP. At the same time, in each RBD a cost-effectiveness calculation was done in a

separate document with diverging methodologies, but all of them seem not to have been used

for the actual “prioritisation” of measures.

Some information regarding costs of individual measures is provided (mostly for

supplementary measures), but is not clearly identified for all measures.10

The summary

information found on total costs of measures is diverging: GR6/7/11/12 indicate summary

figures for each basic/other basic and supplementary measures (with GR11/12 providing

disaggregated figures for basic and other basic measures), GR9/10 provide summary numbers

10 According to information from the Greek authorities provided in late 2014, the PoM-Implementation Progress

Report- submitted by EL as a reply to an EU enquiry in December 2014 contains more information on costs of

individual measures. The PoM-Implementation Progress Report (national level) was provided via WISE on

22.1.15 and has not been assessed to date.

75

only for all basic measures, while GR1/2/3/4/5/8 indicate total costs only for the

supplementary measures.

In most cases, new “construction works” (e.g. WWTP and new dams, some of which are

already under construction) are part of the PoM and their relevant costs are included in the

total costs calculations. For some of them, financing is indicated as secured, including EU-

funds.

Information on financing is available for only a few plans and differs between plans: some

RBDs (GR1/2/3/6/7) mention the “state of funding” when discussing the supplementary

measures (showing that for most measures, no financing is available or secured yet and has to

be found), while some (GR1/2/3) indicate the “available financial resources for water

management measures per RBD” based on an allocation of available funding to the different

RBDs. No systematic indications regarding financing are found in GR4/5/8/910//11/12, yet

fragmentary financing information for some specific measures is indicated. GR06/07 show

explicitly that for most measures, no financing is available yet and has to be found (“the

relevant authorities have included this measure in their planning in order to find funding for

them”).

For the international RBDs, there is no reference found on coordination of the PoM with

neighbouring countries so far; only GR11/12 indicate plans to coordinate the RBMP for the

next implementation cycle with Bulgaria.

12.2 Measures related to agriculture

All RBMPs refer to agriculture as a significant pressure due to diffuse pollution and

abstractions (while for some RBDs the issue of abstractions is seen as relevant for only a

limited number of water bodies). The issue of pressures related to self-abstractions is not

considered in detail. Point source pollution from agriculture is not cited as a significant

pressure. Regarding hydromorphological pressures from agriculture, these are only

mentioned in a general way and as related to “big” construction works for irrigation (e.g.

dams). There is no consideration or discussion of “smaller” hydromorphological pressures

linked to agriculture, such as bank reinforcements, land reclamation, drainage, etc., nor is

there consideration of soil erosion due to agriculture.

The extent of the sector’s involvement in the preparation of the RBMPs is limited; there is no

specific approach regarding this sector for the public participation activities regarding the

RBMP/PoM development (see the general discussion of public participation activities).

Therefore, the extent to which the specific measures have been discussed and agreed with the

agricultural sector cannot be assessed at this point.

There is no further specific indication given regarding the scope of measures as related to

agriculture as well as regarding to their timing (see PoM-general section above on these two

issues). Regarding the costs of measures and financing commitments, also here the general

information provided holds (see PoM-general), so the costs of measures is unclear and in the

majority of cases there is no secured funding. In some RBDs there is fragmentary information

regarding Rural Development Programme (RDP) funds being used. There are no indications

that compensation payments according to Article 31 will be used.

No information was found on how and when the detailed specifications on the

implementation of the measures will be done. Overall, the detailed contribution of each

measure to achieving the objectives is not specified, while no specific information on the

control or inspection of the implementation of agricultural measures is provided.

76

The Programmes of Measures identify a range of measures to address pressures arising from

agriculture, but these are in most cases general measures, mainly referring to legal, licensing

or permitting changes and further information collection.

There are technical measures identified in most RBDs dealing with fertiliser and pesticide

application and changes towards low-input farming, while at the same time remaining quite

general or limited in scope with unclear impacts on the related pollution issues. Regarding

hydromorphological measures, specific measures related to agriculture are limited and mainly

refer to specific “hot spots” (deltas, lagoons, etc.) in some RBDs that refer indirectly to

agriculture (also as part of multi-objective measures). Erosion is mentioned only very

generally in the RBMPs and PoMs, with no specific PoM-measures found relating to this

issue (even though desertification is an issue for Greece). At the same time and according to

information provided by EL in late 2014, the Code for good agricultural practice that has

been implemented with the 125347/568/2004 ministerial decision includes details of legal

requirements for sustainable soil management that farmers must follow to ensure soil

conservation and reduce soil erosion.

All of the PoMs include measures for water savings or increased efficiency of water usage in

agriculture, highlighting the importance of this sector’s abstractions; at the same time, they

focus mostly on irrigation efficiency measures and improving or changing the supply

infrastructure, thus e.g. substituting groundwater abstractions with other water sources (new

dams). It is difficult to estimate if these measures are sufficient to reduce the abstraction

pressures from agriculture to a sufficient degree, especially since no indication could be

found on the expected water savings for each measure.

Regarding economic instruments, in some RBDs the promotion of cooperative measures is

referred to, while the general “other basic” measure regarding revision of the water pricing

policy is stated to be applied for all RBDs. At the same time, it remains unclear if this water

pricing measure is also oriented towards agricultural water pricing (see Article 9 measures

section).

A range of non-technical measures are cited in the PoM: these mainly include measures for

implementing existing relevant EU-Directives, measures related to increased knowledge for

decision-making, measures related to environmental permitting and licencing, and some
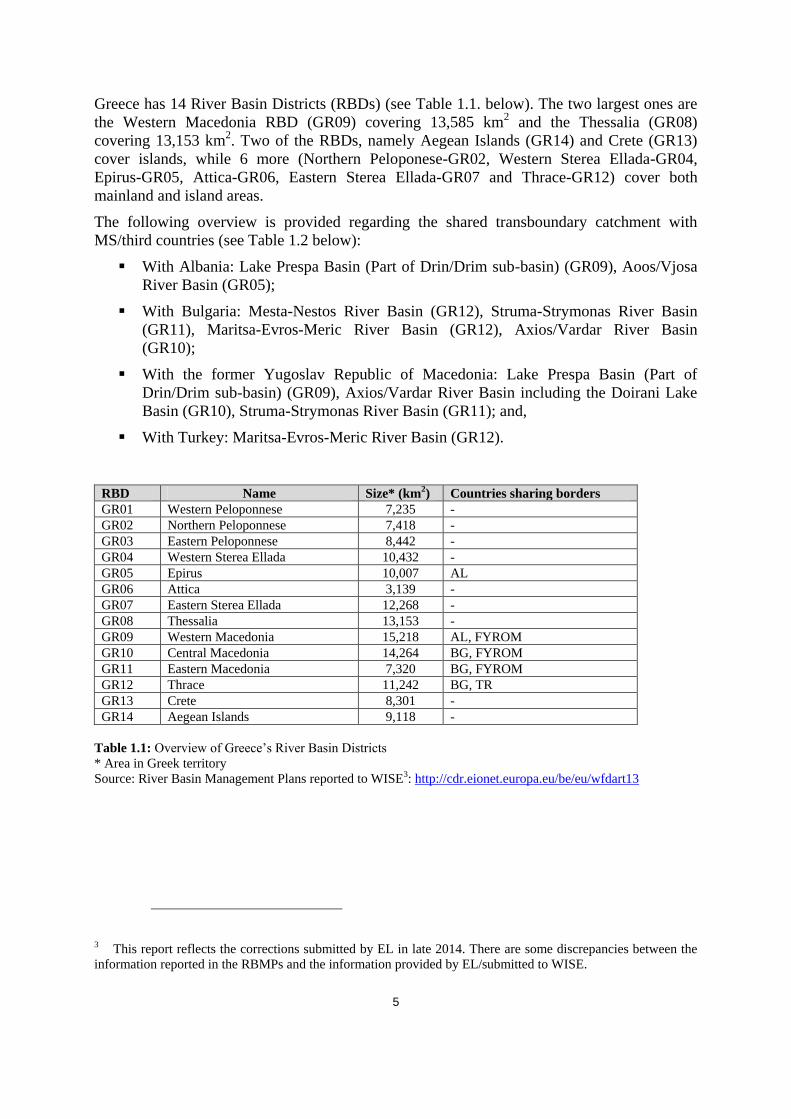
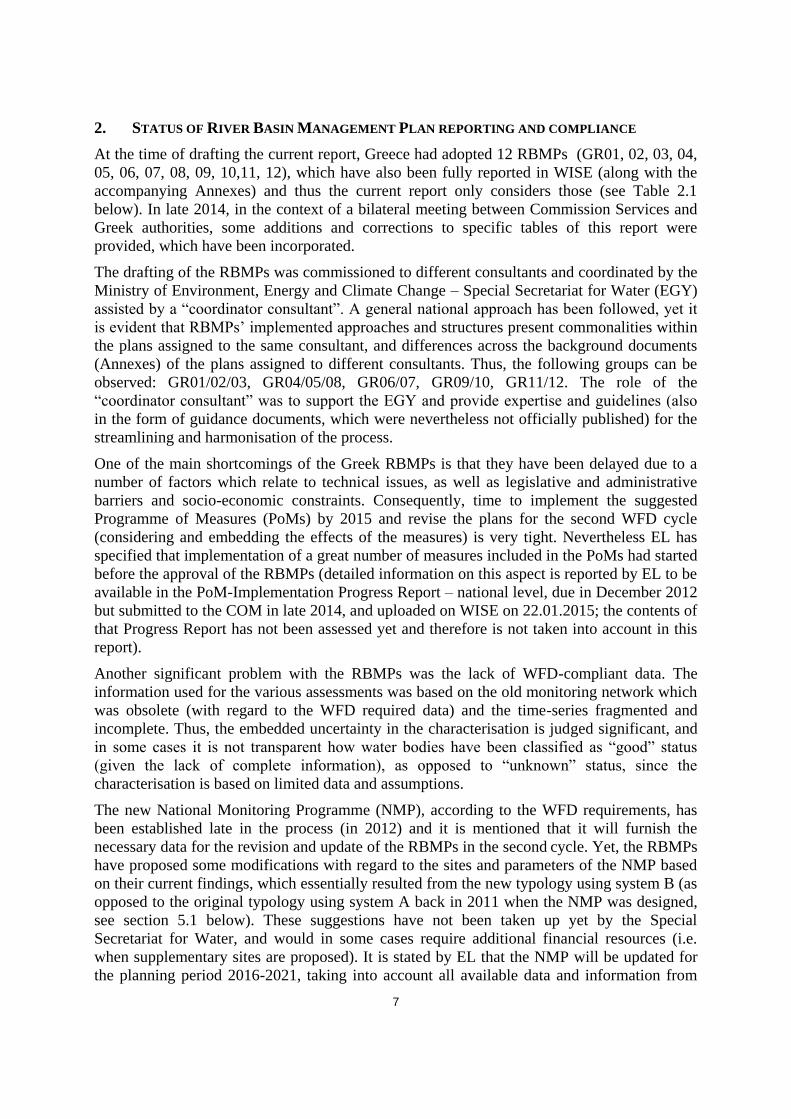
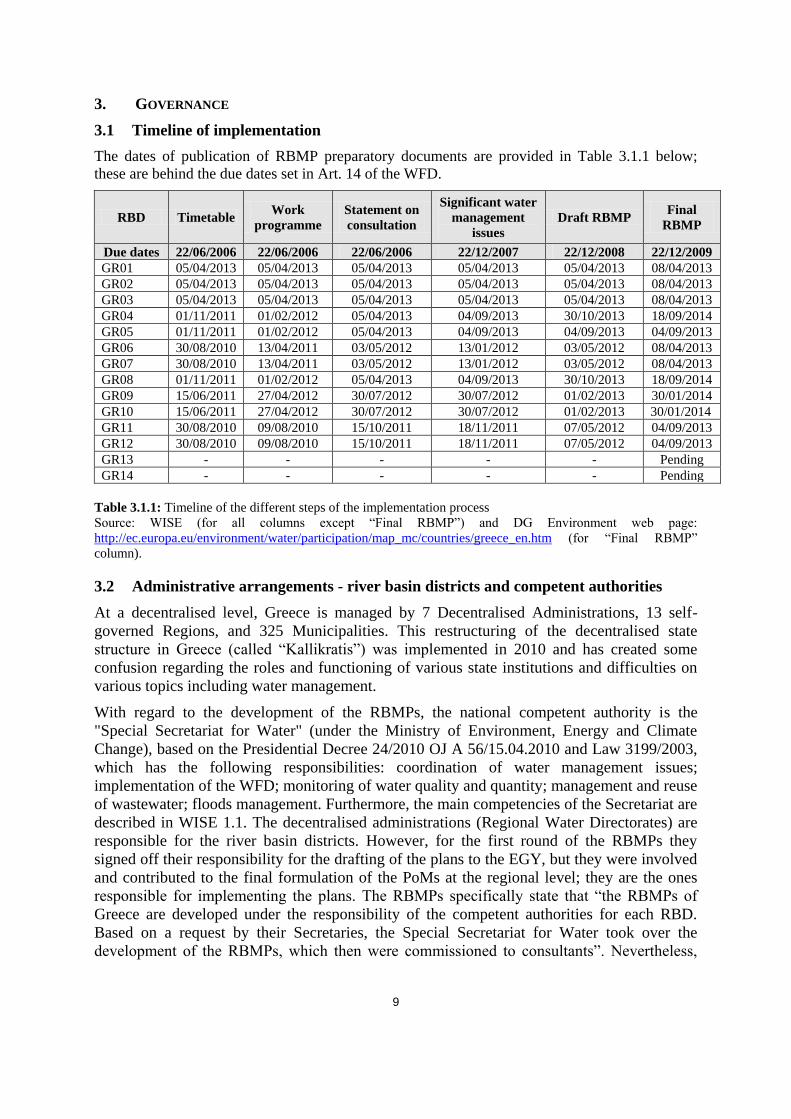
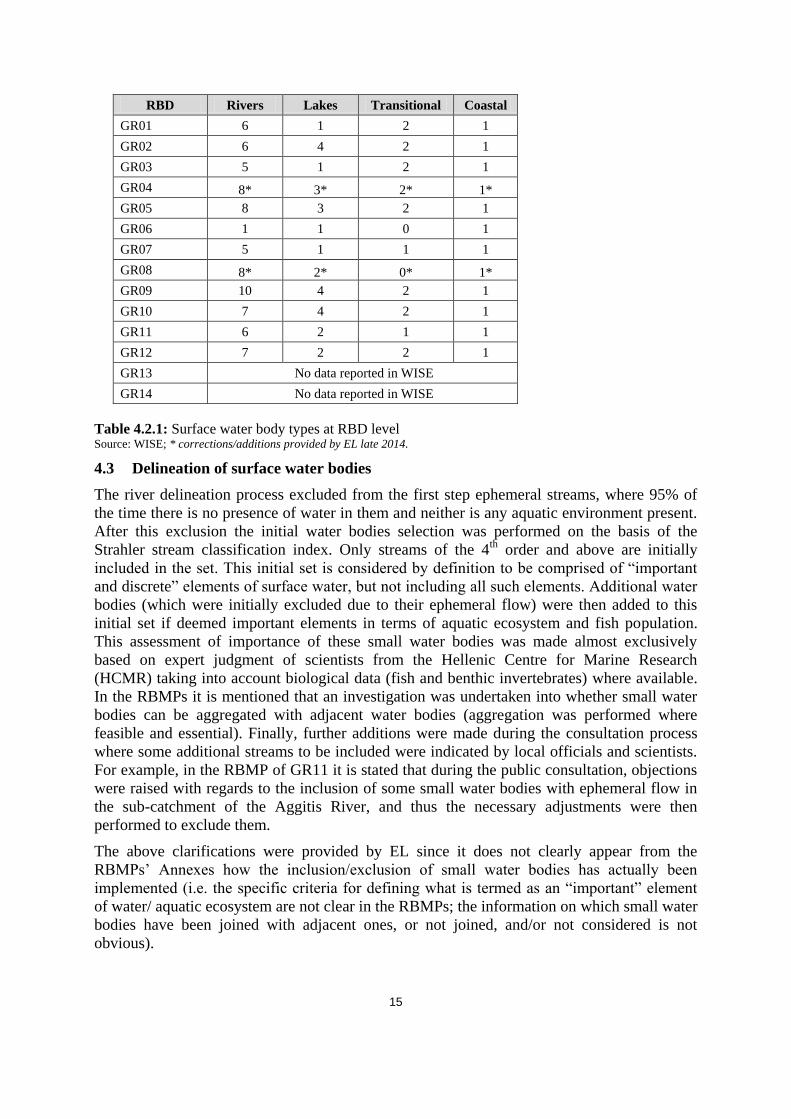
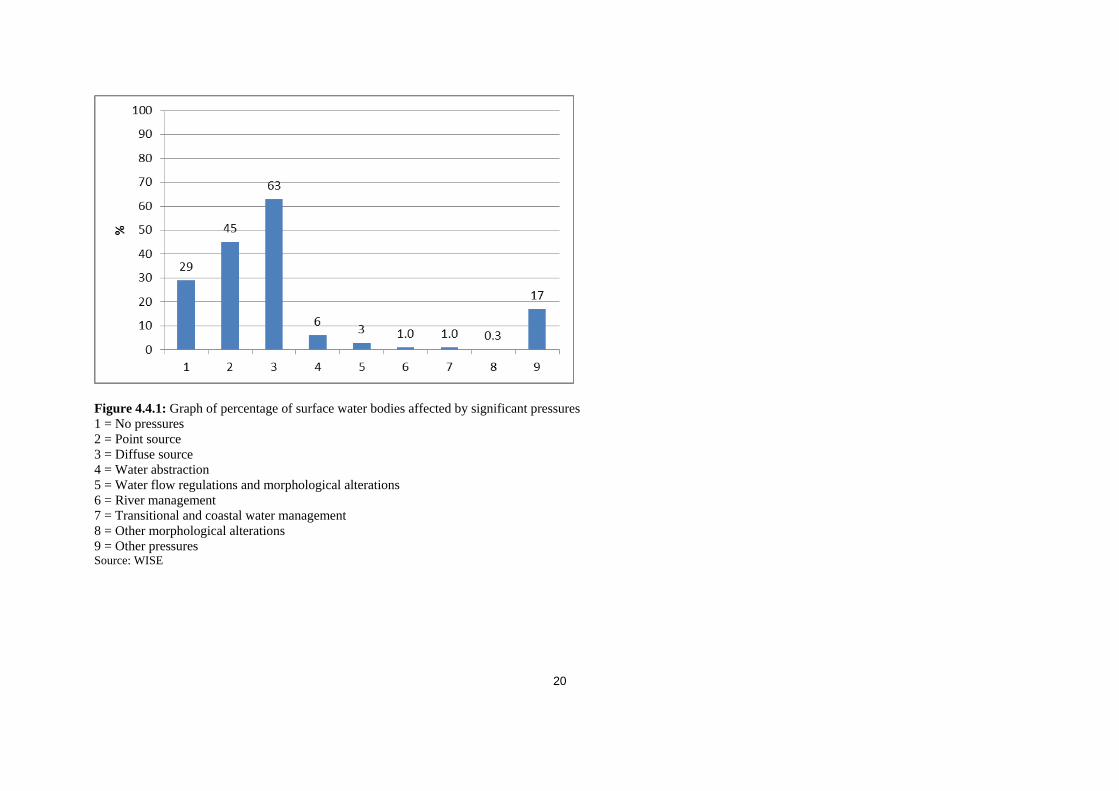
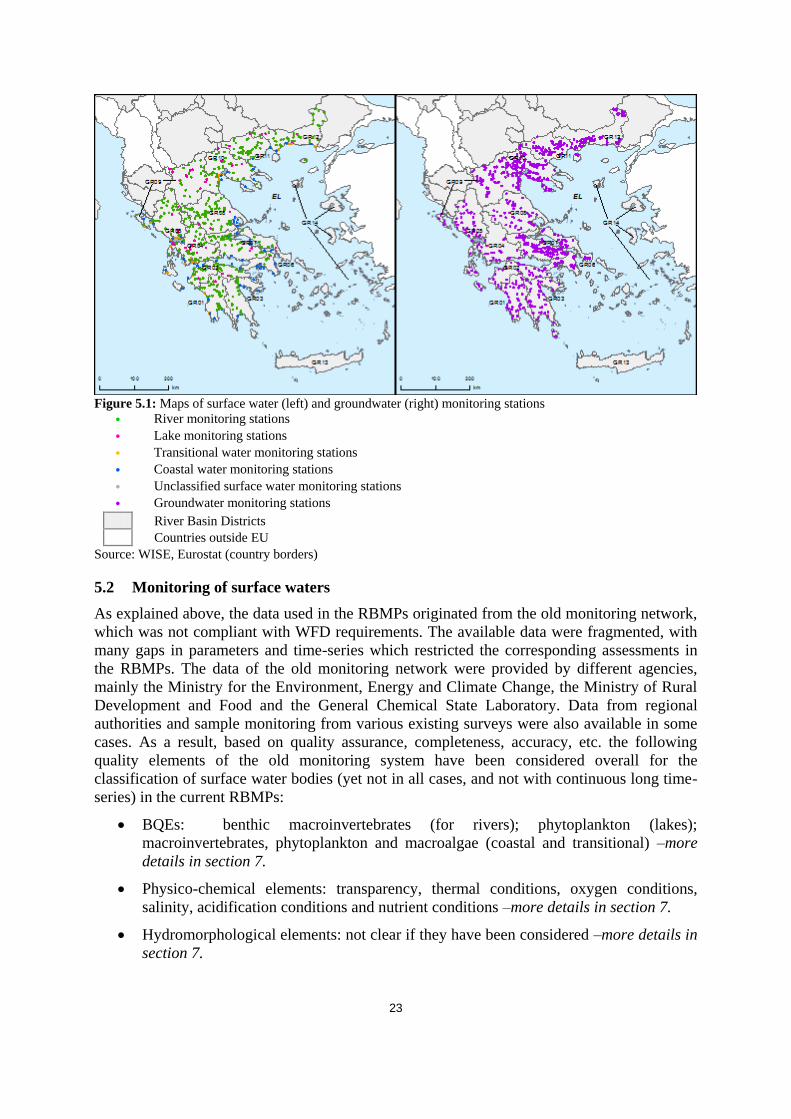
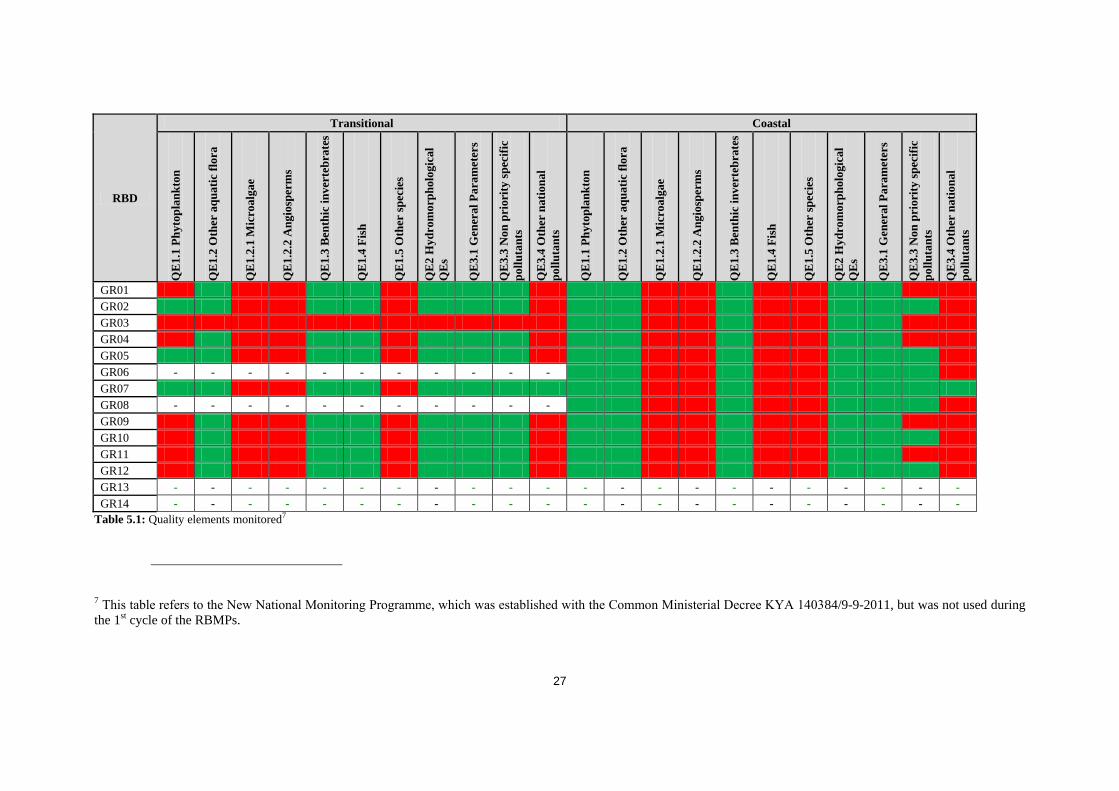
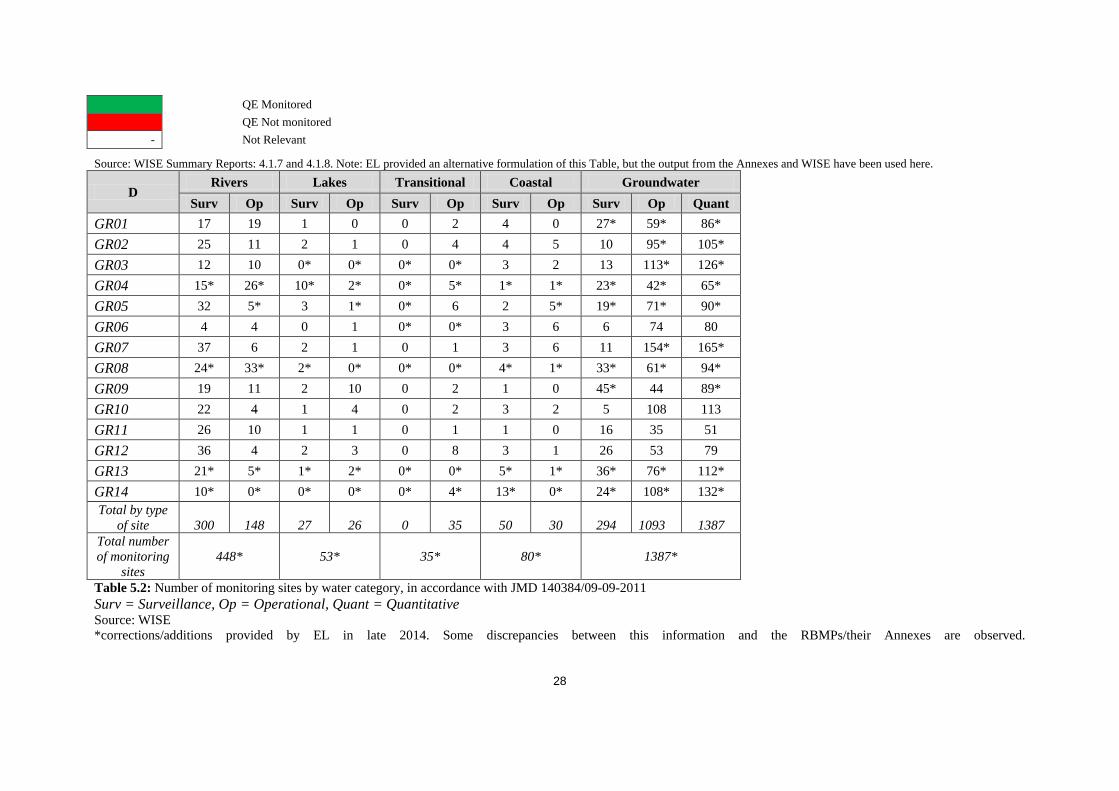
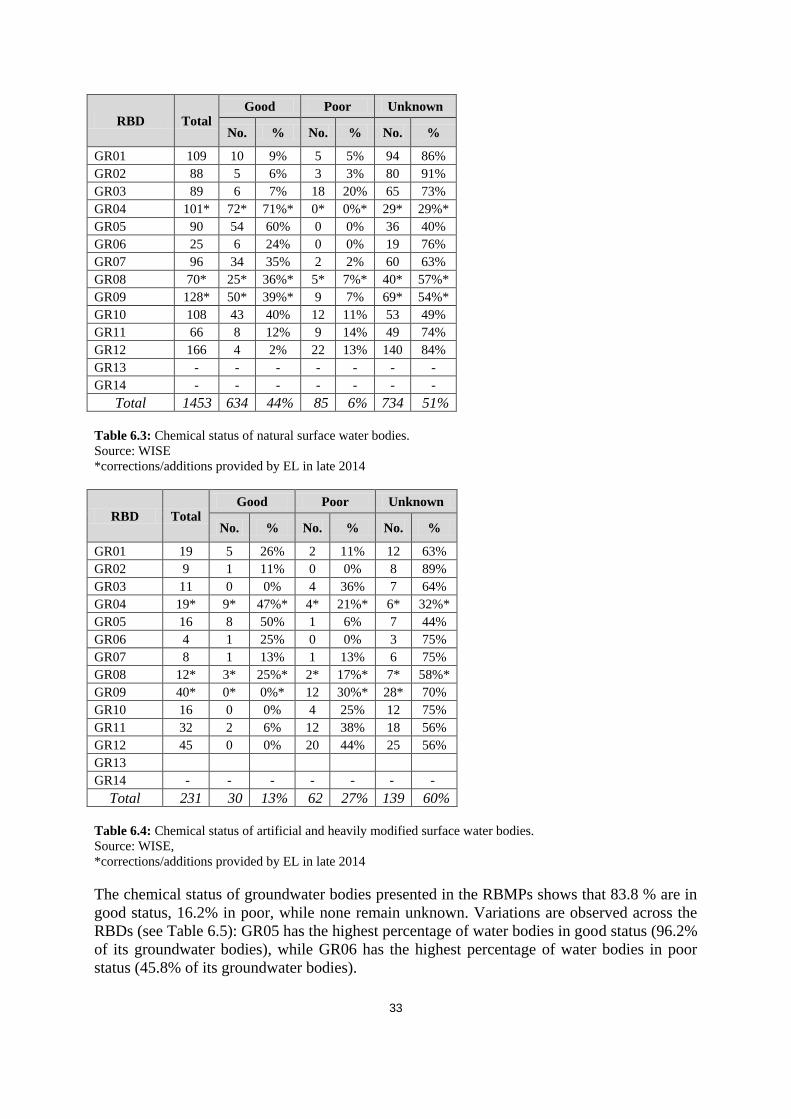
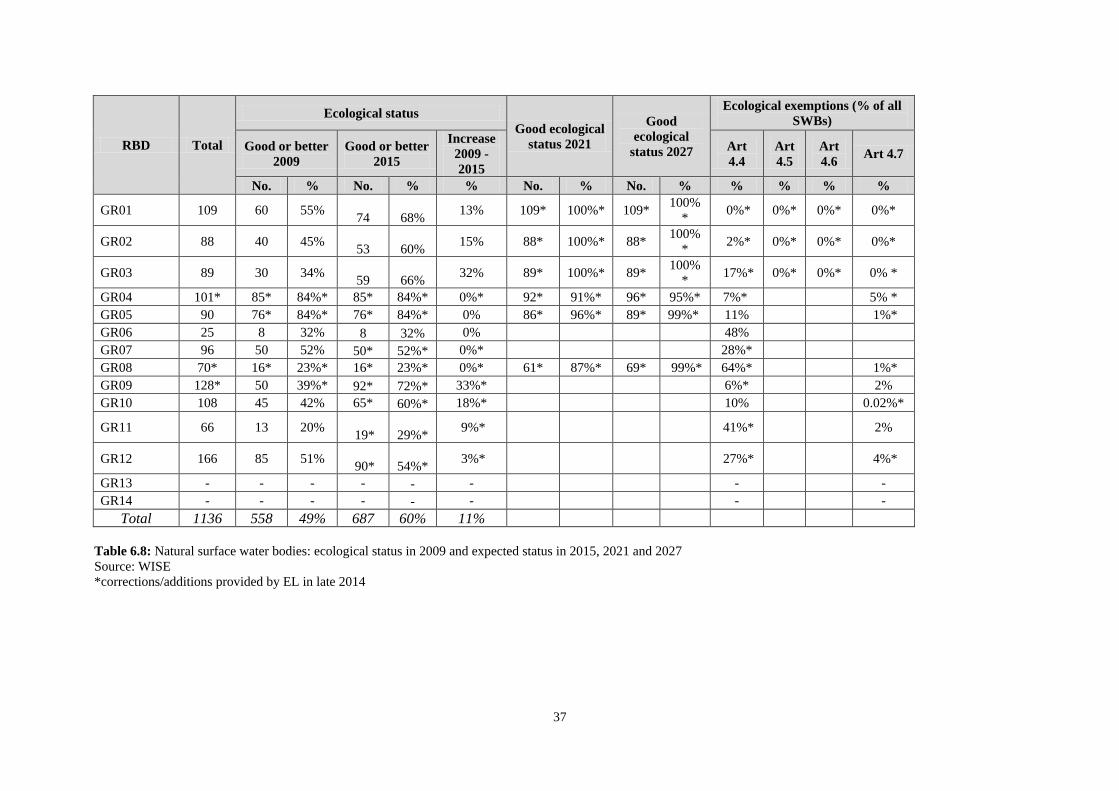
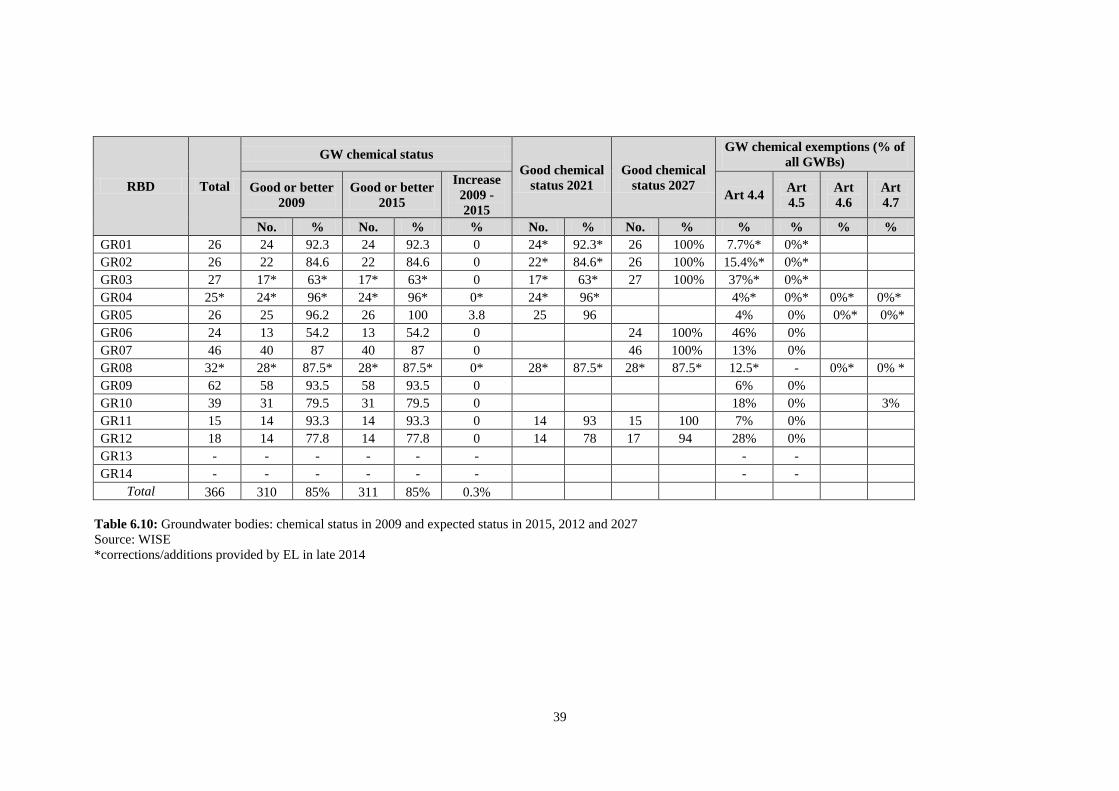
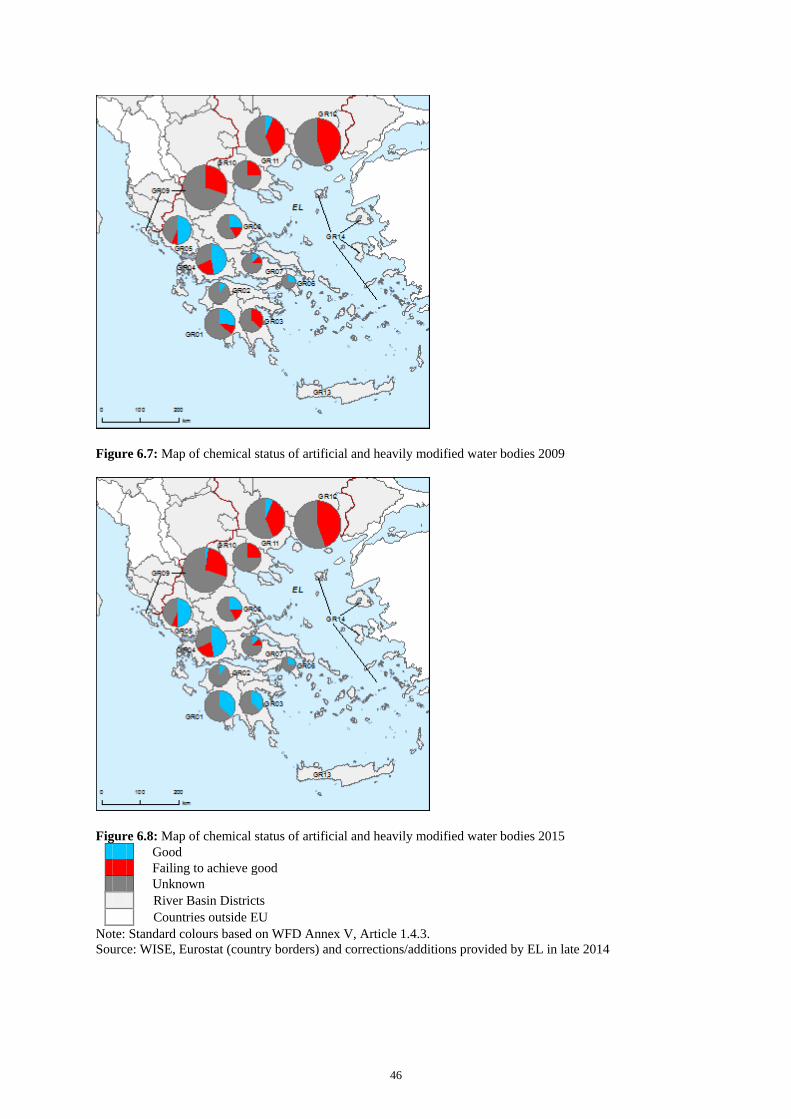
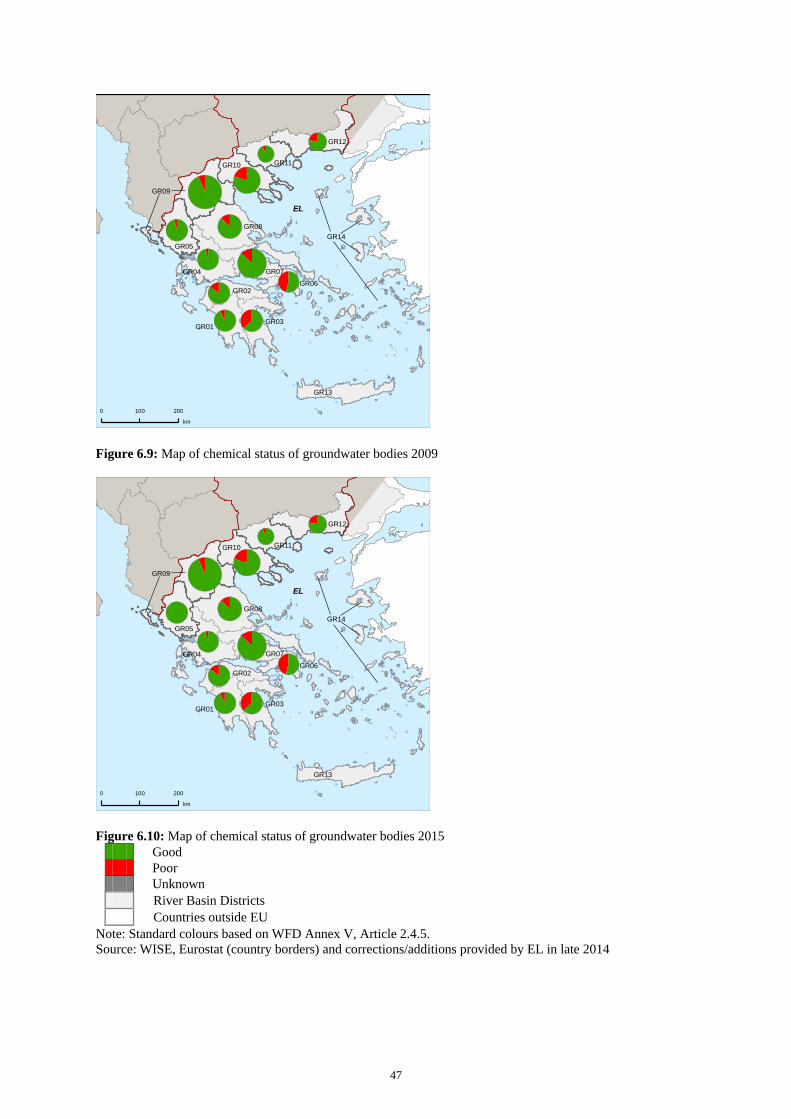
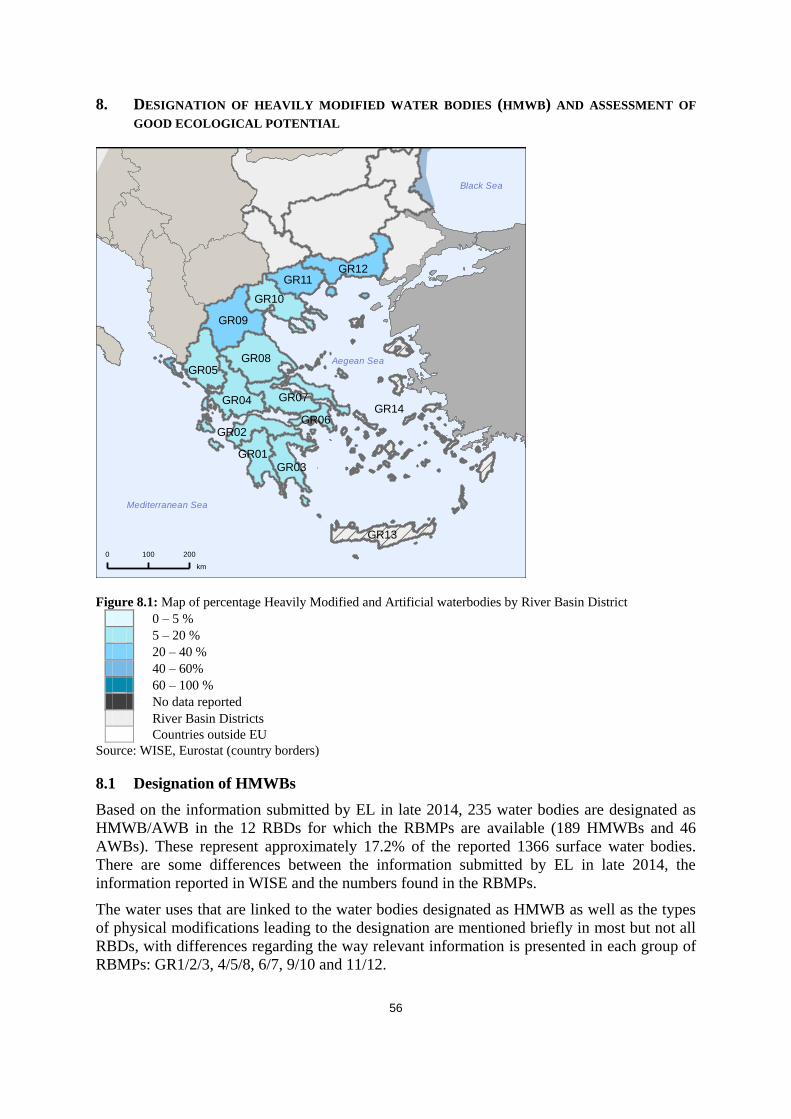
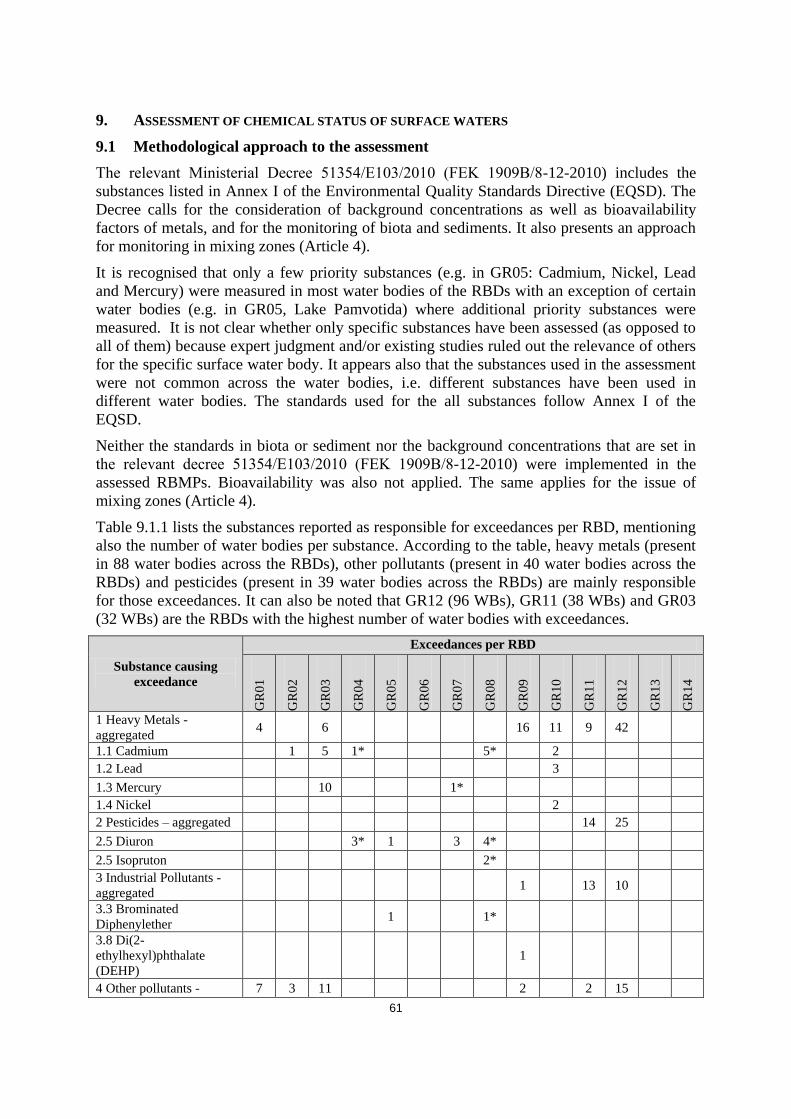
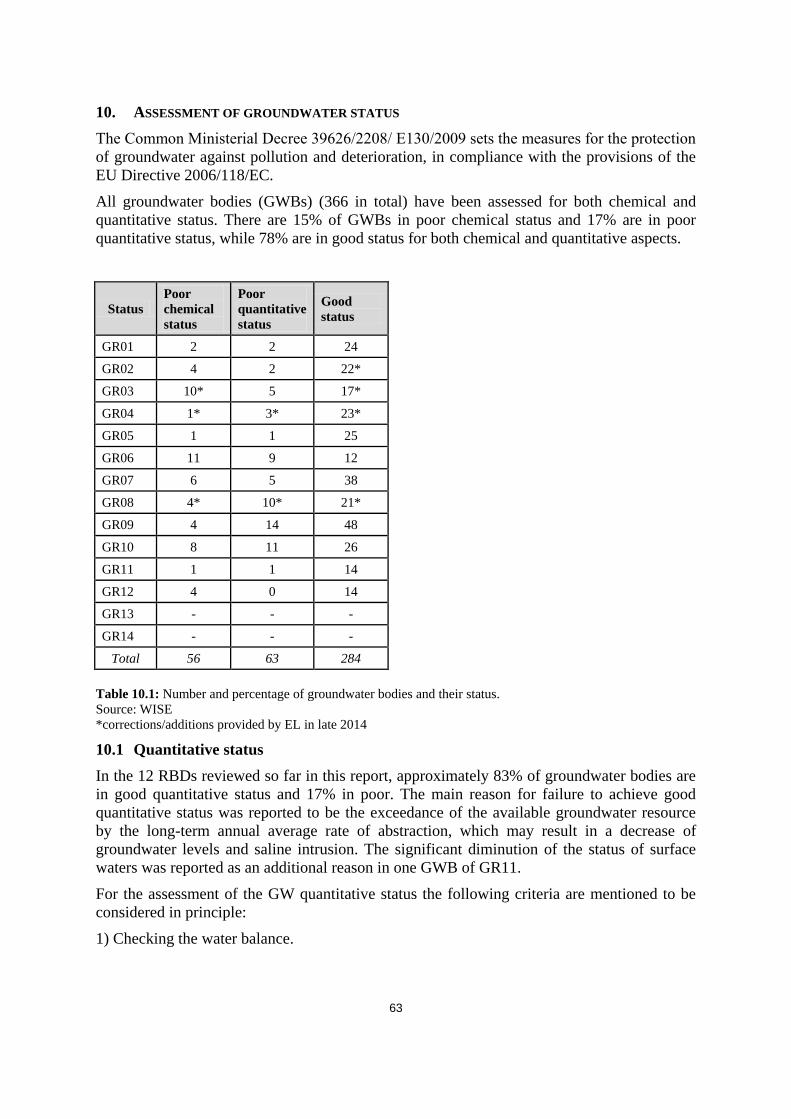
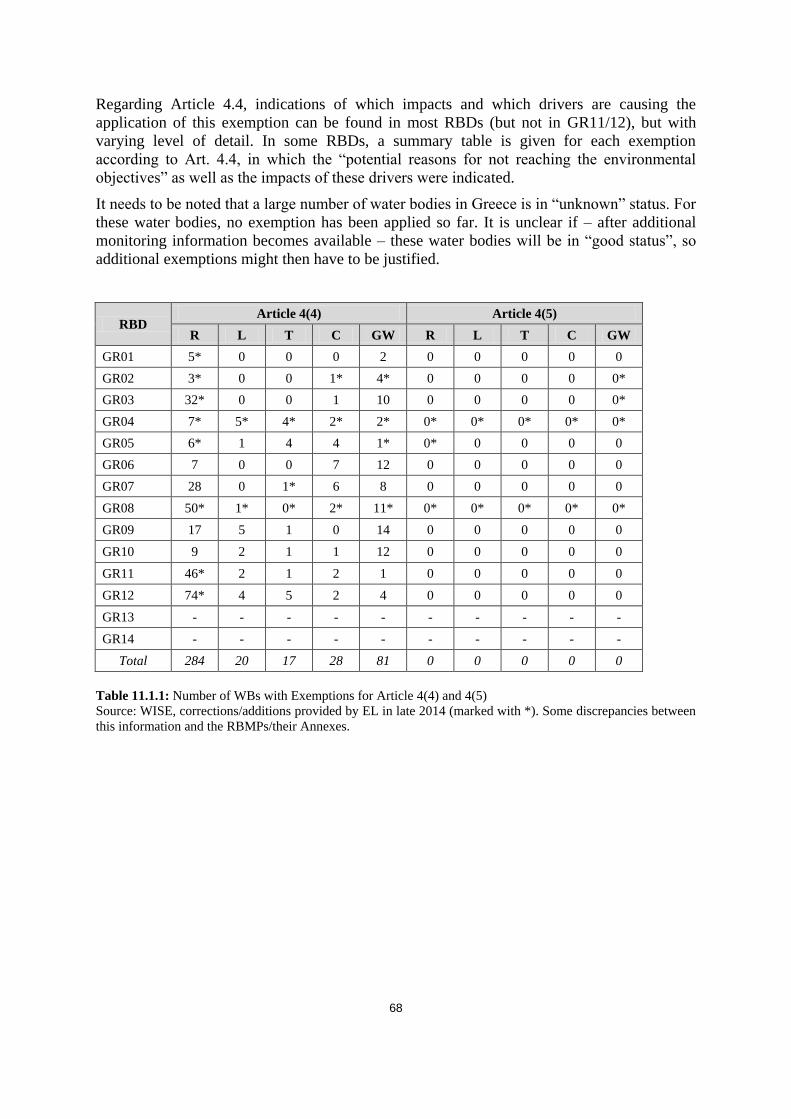
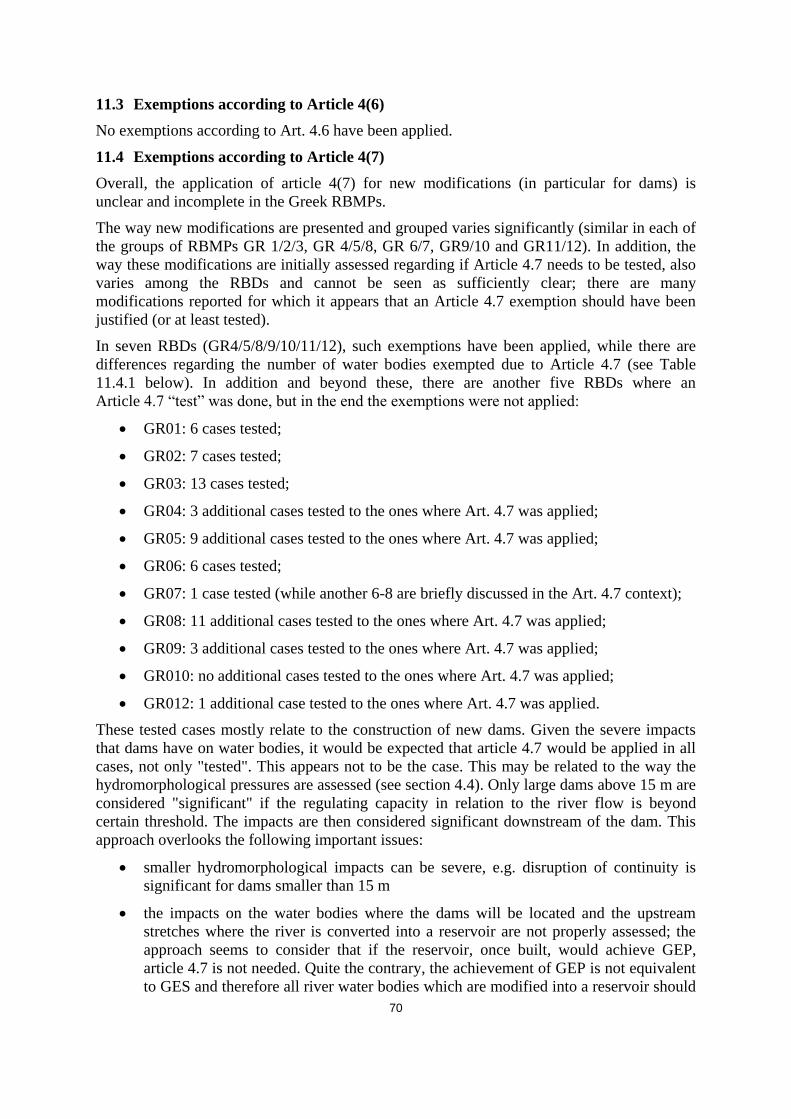
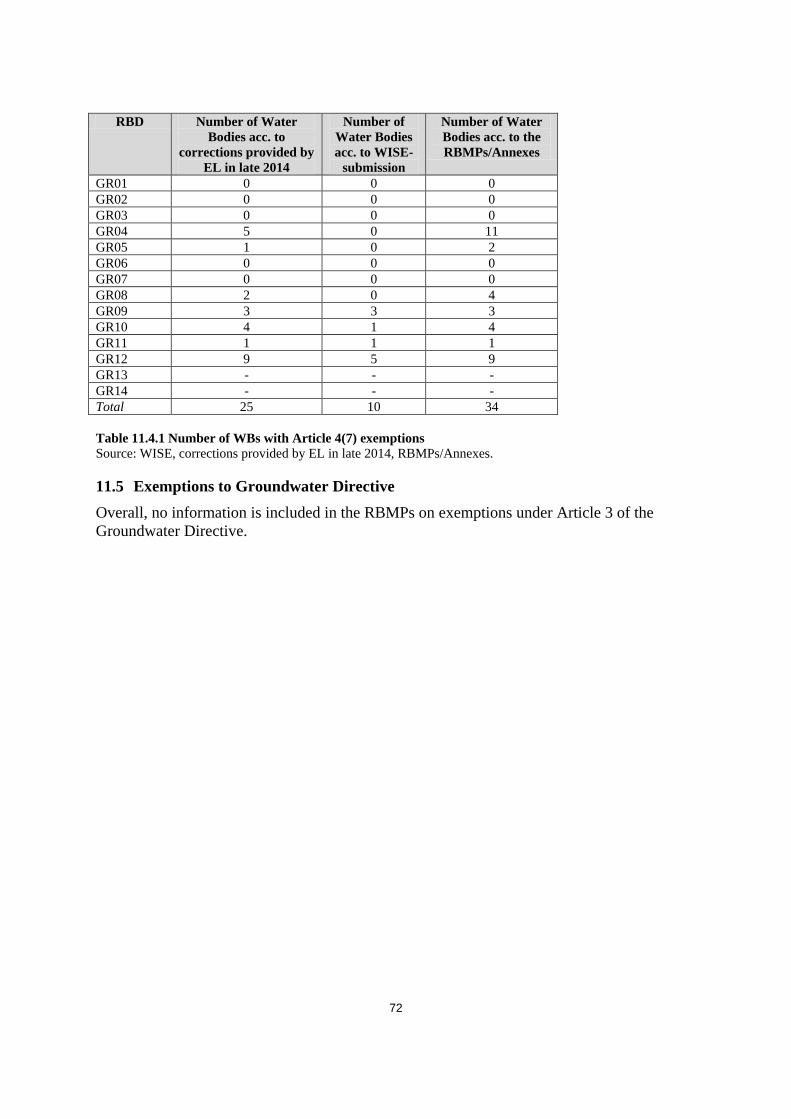
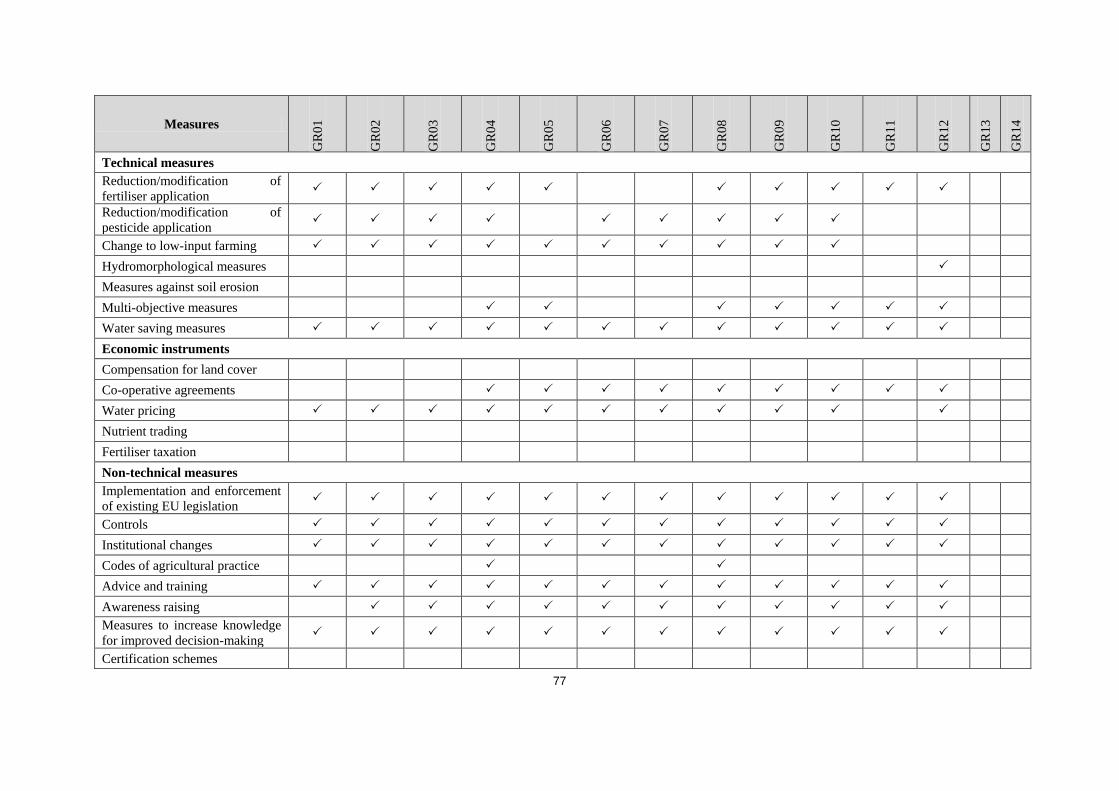
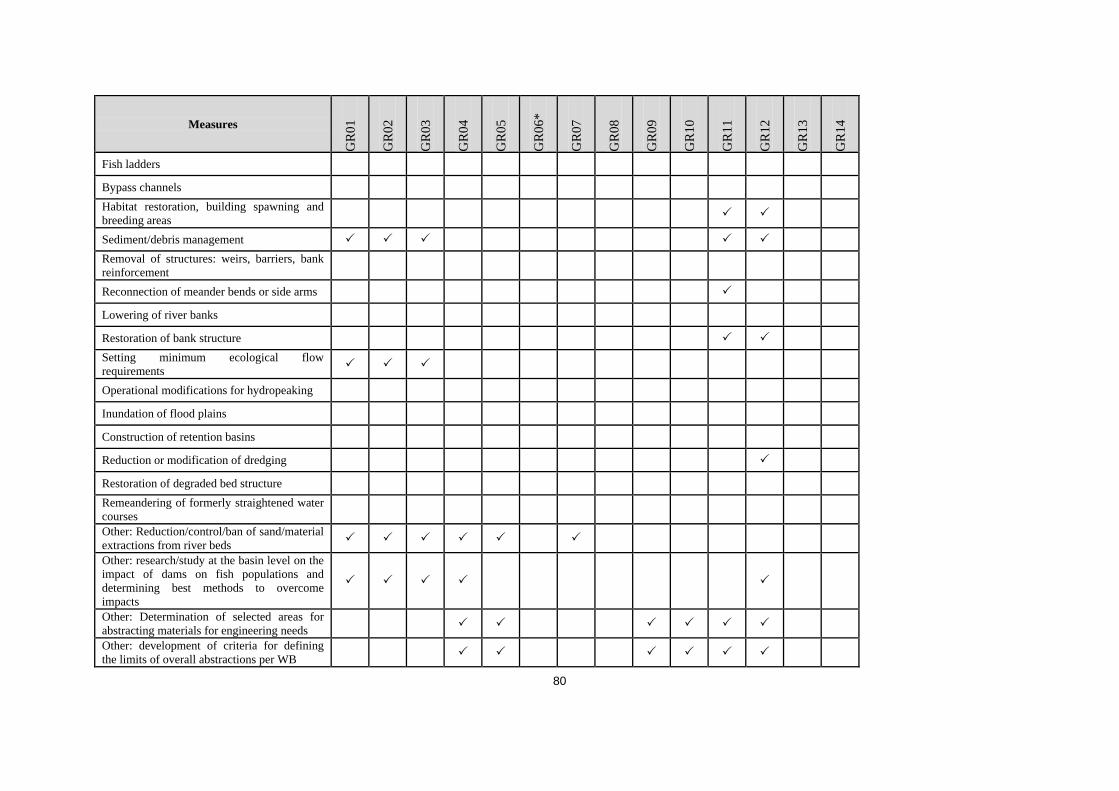
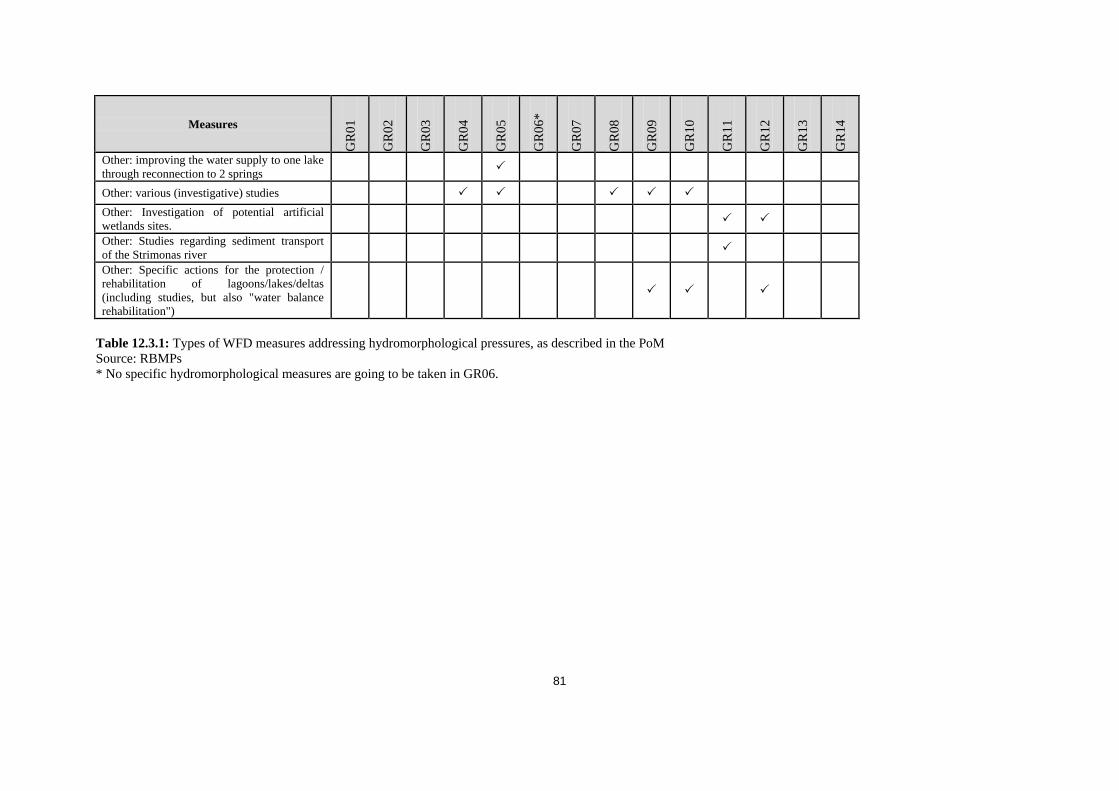
measures regarding improved controls, institutional changes, advice/training/awareness

raising and specific projects are included.

Table 12.2.1 includes an overview of which measures are considered in the RBMPs regarding

agriculture.

77

Measures

GR

01

GR

02

GR

03

GR

04

GR

05

GR

06

GR

07

GR

08

GR

09

GR

10

GR

11

GR

12

GR

13

GR

14

Technical measures

Reduction/modification of

fertiliser application

Reduction/modification of

pesticide application

Change to low-input farming

Hydromorphological measures

Measures against soil erosion

Multi-objective measures

Water saving measures

Economic instruments

Compensation for land cover

Co-operative agreements

Water pricing

Nutrient trading

Fertiliser taxation

Non-technical measures

Implementation and enforcement

of existing EU legislation

Controls

Institutional changes

Codes of agricultural practice

Advice and training

Awareness raising

Measures to increase knowledge

for improved decision-making

Certification schemes

78

Measures

GR

01

GR

02

GR

03

GR

04

GR

05

GR

06

GR

07

GR

08

GR

09

GR

10

GR

11

GR

12

GR

13

GR

14

Zoning

Specific action

plans/programmes

Land use planning

Technical standards

Specific projects related to

agriculture

Environmental permitting and

licensing

Table 12.2.1: Types of WFD measures addressing agricultural pressures, as described in the PoM

Source: RBMPs

79

12.3 Measures related to hydromorphology

Overall, as stated in previous sections, the pressures regarding hydromorphology are

described very generally and with significant differences between RBDs. They mostly refer

to the impacts of “big” construction works (related to dams, hydropower, water supply-

storage), but not of “smaller” modifications like dams smaller than 15 meters, dredging, river

straightening, land reclamation, drainage, bank modifications, etc. In many cases it is

assumed that the existence of the dam does not hinder reaching the WFD-objectives (linked

also to the fact that the relevant water bodies are defined as HMWB/AWB - even if GEP is

not defined yet). The issue of potential impacts of small hydropower dams is not discussed in

detail; the information presented on those (either existing or planned) is fragmentary and

refers mostly to the Environmental Impact Assessment (EIA) studies conducted for them, not

linking to reaching the WFD-objectives in related water bodies.

Very few measures have been included regarding hydromorphology in the Greek RBMPs. No

specific measures are included e.g. regarding river restoration, remeandering, inundation of

floodplains, removal of structures, fish ladders, etc., bank reinforcement and channelisation

for flood protection. Very limited measures are reported regarding habitat restoration (in

specific “hot spots”, see e.g. GR11/12), while some specific actions for the protection or

rehabilitation of specific lagoons, lakes and deltas are reported that should also include

improvements of hydromorphological characteristics.

Measures for sediment and debris management are mentioned in most cases, relating to the

management of gravel extraction. There are some additional measures proposed that are

linked to the development of specific (investigative) studies in order to better understand the

impacts of modifications (e.g. impacts of dams on fish populations), as well as for the

development of criteria for defining limits of overall abstractions for specific water bodies.

Regarding ecological flows and environmental water allocation, no reference could be found

to national legislation or requirements regarding such flows (or national legislation or

guidance regarding other issues related to hydromorphology) as linked to the WFD-

objectives in the RBMPs/Annexes. For some specific (big) dams the establishment or

reconsideration and/or related studies regarding environmental flows (e-flows) are proposed,

but there is no overall plan for establishment of national legislation regarding the e-flows

issue linked to the WFD-objectives. According to information provided by EL in late 2014,

ecological flows are established for small hydropower dams according to existing legislation

(MD 196978/2011); for all other cases the definition of ecological flow is made on an ad hoc

basis though the Environmental Impact Assessment and permitting process. Furthermore, a

medium-term basic measure has been included in the PoMs of the RBMPs for the

development of national guidance on e-flows, which is under development; Greece however

has not specified when the guidance will be ready.

There is no overview given in any of the plans regarding the existing current e-flows

regulation for all dams in place (only fragmentary information found, especially in the

context of dams (potentially to be) considered under Art. 4.7).

The (limited) measures regarding hydromorphology are defined for both natural water bodies

and HMWBs/AWBs. These are summarised in Table 12.3.1.

80

Measures

GR

01

GR

02

GR

03

GR

04

GR

05

GR

06

*

GR

07

GR

08

GR

09

GR

10

GR

11

GR

12

GR

13

GR

14

Fish ladders

Bypass channels

Habitat restoration, building spawning and

breeding areas

Sediment/debris management

Removal of structures: weirs, barriers, bank

reinforcement

Reconnection of meander bends or side arms

Lowering of river banks

Restoration of bank structure

Setting minimum ecological flow

requirements

Operational modifications for hydropeaking

Inundation of flood plains

Construction of retention basins

Reduction or modification of dredging

Restoration of degraded bed structure

Remeandering of formerly straightened water

courses

Other: Reduction/control/ban of sand/material

extractions from river beds

Other: research/study at the basin level on the

impact of dams on fish populations and

determining best methods to overcome

impacts

Other: Determination of selected areas for

abstracting materials for engineering needs

Other: development of criteria for defining

the limits of overall abstractions per WB

81

Measures

GR

01

GR

02

GR

03

GR

04

GR

05

GR

06

*

GR

07

GR

08

GR

09

GR

10

GR

11

GR

12

GR

13

GR

14

Other: improving the water supply to one lake

through reconnection to 2 springs

Other: various (investigative) studies

Other: Investigation of potential artificial

wetlands sites.

Other: Studies regarding sediment transport

of the Strimonas river

Other: Specific actions for the protection /

rehabilitation of lagoons/lakes/deltas

(including studies, but also "water balance

rehabilitation")

Table 12.3.1: Types of WFD measures addressing hydromorphological pressures, as described in the PoM

Source: RBMPs

* No specific hydromorphological measures are going to be taken in GR06.

82

12.4 Measures related to groundwater

Many measures related to groundwater target specific pressures, such as over-exploitation,

and many refer to the sectors driving these pressures: abstraction for irrigation, for example,

is frequently cited. However, detailed links between risks, impacts, pressures and measures

are not provided.

Regarding quantitative status, basic measures mentioned in most RBDs relate to:

A better information basis: e.g. reshaping the monitoring network for groundwater

bodies in accordance with their final delineation and their qualitative and quantitative

status; creating a single register of licensed water abstractions; installation of systems

for recording groundwater abstractions;

Better regulation or licencing: e.g. review of the regulatory framework for water use

licensing and execution of water resources development projects; updating the

regulation regarding the minimum and maximum limits of the necessary quantities of

irrigation water; determination of criteria for setting limits for total abstraction by water

bodies; ban on new construction of water abstraction projects from groundwater

(boreholes, wells, etc.) in certain cases;

Incentives: adjusting the water pricing policy in a flexible and efficient way in order to

serve the primary target of environmental sustainability and avoid water wastage (see

Article 9 section below; it is unclear if this holds also for irrigation water);

Increasing water use efficiency or water saving: e.g. establishment of an institutional

framework and a programme of measures for private user water conservation;

restructuring and rationalisation of the institutional operational framework of collective

management bodies of irrigation networks; and,

Investigation of the conditions for implementing artificial recharge of groundwater

bodies.

Regarding supplementary measures (which are considered to be needed in all RBDs), there is

a greater variety of measures proposed in the different RBDs. Some commonly found are:

installation of functional valves in artesian wells; identification of groundwater areas or

restrictions for coastal groundwater that face saltwater intrusion; promoting voluntary

agreements with big water users and especially the agricultural sector; awareness raising and

information activities.

Beyond that, there are specific supplementary measures regarding, in most cases, specific

groundwater bodies, e.g. regarding the introduction of artificial recharge, specific studies or

monitoring regarding water availability and water needs linked to a specific groundwater

body, etc., investigation of specific water transfers, construction of appropriate drainage

works, modernisation (e.g. to drip or “micro” irrigation) and maintenance of irrigation

networks; subsidies for irrigation systems change; use of treated effluents for supporting

water supply or artificial recharge; total groundwater withdrawals not to exceed a certain

amount for a specific groundwater body; restrictions of new boreholes in specific

groundwater bodies; and, on-site inspections for licensed abstractions (big water consumers)

at least twice per year.

Here, it is important to note that various “construction works” (mainly new dams, but also

improvements or expansions of irrigation networks, sometimes leading to irrigation areas to

be expanded) are proposed in order to reduce quantitative pressure on groundwater bodies

83

(among other objectives) by shifting abstraction to surface water bodies. At the same time,

not all of the planned new dams are mentioned as “WFD-measures” or no criteria could be

found regarding which of these construction works would become part of the WFD-PoM and

which not. According to information provided by the Greek authorities, construction projects

shifting abstraction from groundwater to surface water have been included in the PoM where

the quantitative status of groundwater is below good or exhibits downward trends.

Regarding measures to prevent and limit inputs of pollution to groundwater bodies, for

GR5/6/7/8 basic measures are not considered as sufficient for point and diffuse sources. For

GR1/2/4, basic measures are considered as sufficient for both sources, while for GR3

supplementary measures are seen as needed for point sources and for GR9/10 for diffuse

sources. For GR11, basic measures are not enough regarding point sources, but

supplementary measures are taken also for diffuse sources, with the explanation given that

supplementary measures are taken to maintain good status and to deal with localised quality

issues. For GR12, supplementary measures are taken, even though only one groundwater

body faces quality issues due to saltwater intrusion, with the same explanation given as for

GR11. In all RBDs, measures regarding chemical pollution of groundwater bodies are

provided in the PoM (see section “measures related to chemical pollution” for details).

Specific measures oriented towards groundwater bodies with exceedances were rarely found

(the exceptions are specific studies to further investigate the occurrence of a specific

substance, e.g. in GR01/2/3/5).

In transboundary RBDs, co-ordination with neighbouring countries regarding measures for

groundwater management is not mentioned.

12.5 Measures related to chemical pollution

There is no information regarding an inventory of sources of chemical pollution; however, all

RBDs mention the “establishment of an inventory of pollution sources (emissions, discharges

and losses)” as one of the “other basic measures” (mid-term).

Overall, there is very limited information regarding the existence of chemical pollution, due

to significant gaps in monitoring information.

In general, it is considered that the Greek legislation previous to the WFD implementation

(regarding e.g. authorisation and control of point source discharges) should cover most of the

issues related to chemical pollution. At the same time, a variety of actions or measures on the

issue are planned, mostly linked to legal changes, the development of inventories and

guidelines and voluntary activities.

Some of these main measures (regarding “programmed actions”) include : legislative actions

regarding permitting or licensing as well as the use of sludge; continued and in many cases

better monitoring information, databases and registers; completion of required works for the

collection and processing of urban wastewater or for facilities falling under IPPC; rational

use of plant protection products (putting the legal requirements or measures into practice);

delineation of new nitrate vulnerable areas and developing action plans for them; incentives

for improving livestock facilities.

Regarding “other basic” measures, some found in most RBDs are: better monitoring,

information or management systems (e.g. for pollution accidents; aquaculture; setting up an

inventory of sources of pollution); measures for improving the regulatory framework or

licensing regarding protection of protected areas for drinking water, aquaculture, sludge

management, emission limits for priority substances and other pollutants, industrial waste

84

water and waste and truck transportation of wastewater; protection of surface water

abstraction installations for irrigation; investigations regarding implementing artificial

recharge of groundwater bodies; development and use of specialised tools for the Rational

Use of Fertilisers and Water; and, strengthening the synergy of the water management plans

with the emergency plans of facilities included in the IPPC and SEVESO.

Regarding the main supplementary measures found in many RBDs, these include:

information or capacity building events for agriculture; special protection measures for

groundwater bodies in areas where geothermal or thermal waters exist; additional monitoring

for e.g. areas of existing landfills, systems with high natural background levels (chlorides,

sulphates) and lagoons; investigation of possible sources of pollution associated with

pesticides; definition of restriction zones for new wells or water uses extensions of licenses

linked to coastal groundwater bodies facing salinisation (and defining the groundwater body

areas affected); upgrading WWTP from secondary treatment; and, rational management of

waste water from agglomerations with a population peak < 2000 pe. Beyond that, there are

also specific supplementary measures in some RBDs regarding specific chemical pollution

“hot spots” (e.g. in GR06 regarding the Asopos river and related groundwater bodies and

chemical pollution from industry)

Measures to reduce or phase-out the emissions of specific pollutants have not been identified

in the PoMs, although in some cases there is a specific investigative study planned regarding

the occurrence or exceedance of a certain pollutant (GR1/2/3/5).

12.6 Measures related to Article 9 (water pricing policies)

Overall, the work done on the economic analysis differs significantly between RBDs (with

common approaches each in GR1/2/3, GR4/5/8, GR6/7, GR9/10 and GR11/12). According to

the Greek authorities, this is due to the extensive lack of data and the different RBDs

following the approach deemed most suitable for the data available to them. There seems to

be no clear national guidance on the issue.

For all RBDs, the economic analysis shows gaps regarding the actual information used or

available (e.g. division of costs for public water supply and sewage is not possible; lack of

information regarding assets, (operational) costs and revenues for many water supply

companies/municipalities; there is a lack of metering in agriculture, etc.) and questionable

methodologies and assumptions are used (e.g. regarding the way financial costs are calculated

(using “average values” for many important elements of the calculation), the way (cross-)

subsidies are (not) considered (especially regarding irrigation), for the calculation of

environmental costs (e.g. taking as a basis the “status” of water bodies while many of them

are in “unknown status”, linking the existence of environmental costs to the existence of a

waste water treatment plant which does not cover non internalised environmental and

resource costs, including costs the costs related to water abstraction, assuming in many cases

that irrigation does not entail environmental costs, etc.).

There is no consideration or discussion of the polluter pays principle, the contribution of

water users to the costs of water services and the implementation of incentive pricing.

There is no clear definition of water services. In general, water supply and wastewater

treatment services are treated together as one service, while also “irrigation water services,

mainly from organised irrigation” seem to be considered as a water service (GR01/2/3

explicitly also mention “self-service” for irrigation as a water service). In other cases (e.g.

GR04/5/8), additional water services are identified (e.g. recycled water provision). There is

85

no clear approach to the identification of relevant water uses in the Article 9 context across

the RBDs.

The methodology for calculation of cost recovery rates shows differences depending on the

RBD, but overall it is based on fragmentary data and various assumptions and extrapolations

regarding both the methodology and data.

The information provided on existing cost recovery (CR) levels varies: cost recovery rates

(financial, but additionally including environmental and resource costs (ERC) are calculated

for agricultural water supply and urban water supply and sewage treatment (as one). In some

cases (e.g. GR06/7), more disaggregated CR numbers are given for the financial costs of

“households/state users” and “industry”. In other cases (e.g. GR01/2/3), disaggregated

numbers are given for public water supply and sewage companies and municipalities

providing these services directly. Self-abstractions are included in the ERC calculations of

GR06/07.

Significant gaps are apparent regarding the identification and consideration of subsidies for

organised irrigation (especially investments).

Environmental and resource costs have been calculated and included in the cost recovery

calculations in all RBDs, however they are based on many assumptions and simplifications,

which are not adequately justified.

No information was found on the application of flexibility provisions or provisions of Article

9(4) of the WFD, or on international cooperation regarding the implementation of Article 9.

One “other basic” measure of all the PoMs is “adjusting the water pricing policy in a flexible

and efficient way in order to serve the primary target of environmental sustainability and

avoiding water wastage” (but not referring to pricing regarding pollution or sewage-related

services). It remains unclear if this revision of the water pricing policy will also cover

agricultural water pricing (when describing the measure GR11/12 also refer explicitly to

irrigation water; the other RBMPs do not). Some general principles that this revision will be

based on are given, but without indicating the specific content so far (the measure is indicated

as “short term”, thus to be implemented by 2015). In this context, there is no discussion or

specific measures for dealing with non-metered water consumption in agriculture.

12.7 Additional measures in protected areas

Overall, no specific additional measures in protected areas are part of the WFD-PoMs, since

no specific, additional objectives going beyond the WFD-objectives are included in the

RBMPs (beyond what is required for the implementation of “other” Directives, Natura 2000,

etc.).

The measures to comply with the objectives of other Directives (all of them indicated as

“already implemented”) are mentioned in the PoMs as measures taken for the implementation

of these Directives. Some of the “other basic” measures mentioned in the PoMs also refer to

the Directives related to protected areas.

Regarding the drinking water collection areas, the RBMPs refer to the establishment of

safeguard zones for these; one of the measures described in the PoMs is related to finalising

the establishment of safeguard zones based on hydrological studies. While safeguard zones

have not been finally or specifically established yet, some “other basic measures” have been

mentioned that are linked to safeguarding drinking water quality. These include: the

implementation of Water Safety Plans in large water supply companies; establishing or

updating General Water Supply Plans Water Supply (Masterplan) from the public water and

86

sewage companies; the detailed delineation of protection zones of groundwater abstraction

points (springs, boreholes) for water supply abstractions greater than 1 million cubic metres

per year; the definition of protected areas for abstractions for drinking water; the protection of

groundwater bodies included in the register of protected areas for drinking water; and, setting

an institutional protection framework.

In some cases, specific measures are related to the protection of the water abstractions from

specific dams or reservoirs (e.g. in GR06/7/12).

87

13. CLIMATE CHANGE ADAPTATION, WATER SCARCITY AND DROUGHTS, FLOOD RISK

MANAGEMENT AND OTHER EMERGING AND LINKED ISSUES AS PART OF THE RBMP

13.1 Water Scarcity and Droughts

Water scarcity and droughts are identified as significant issues in most RBDs; for all, there

are specific areas or times of the year where these phenomena are of importance.

For all RBDs, a drought management plan has been established (for GR01/2/3, it is a

combined one); in most cases the specific sub-units or specific river basins are looked at

separately. Quantity issues are discussed in the RBMP and some measures related to quantity

management have been identified in the PoMs, but the links between the two plans are weak.

For the characterisation of Drought & Water Scarcity conditions the Standard Precipitations

Index (SPI) and the Water Exploitation Index (WEI) have been used (in some RBDs

differentiated between surface and groundwater – e.g. GR06/07).

The information used in the Drought Management Plans (DMPs) is based on historical data

for water availability, without consideration of e.g. the impacts of Climate Change on this

availability in all RBDs. For water demands, theoretical data is used since actual information

on water abstractions is fragmentary or missing. The water balances at the catchment scale

are based on modelling carried out in the framework of a previous national project, and thus

they have not been updated. The actual calculation methods, time horizons, etc. differ

between RBDs.

The “proposals” for measures identified in the DMPs are in most cases early warning and

emergency response measures (sometimes called “reactive” measures) to a drought situation,

while some RBDs also list preventive (pro-active) measures. In GR06/07 a methodology for

early warning based on precipitation is developed, and alert levels have been established on

the basis of the observed 3-month and 6-month precipitation (SPI3 and SPI6 respectively)

during the month of March. A list of measures for each alert level are also provided, mainly

focusing on demand management and awareness measures. In GR01/2/3/4/5/9/10 the link is

built to the PoM according to the WFD by identifying the PoM-measures proposed that

support the prevention and mitigation of water scarcity and droughts (not done in

GR06/7/11/12). Most of the PoM-measures linked to combatting water scarcity and droughts

are construction works in order to increase available water to cover demands (e.g. new dams),

but there are few demand-side measures (reduction of water losses, changes in the way

agriculture is using water).

It remains unclear what the next activities are to put the DMPs into practice, since the

measures described in the DMPs are “proposals”, thus not fully decided (evident in the “next

steps” section - in the cases where it exists - of the DMPs). Thus, further work is required to

develop the DMPs into operational plans.

No international coordination has taken place so far on the DMPs, while in GR11/12 some

future activities regarding early drought warning data exchange with neighbouring countries

have been proposed.

13.2 Flood Risk Management

The RBMPs by and large make very few references to floods and flood risk management or

the Floods Directive (FD); there is no reference to the coordination needed for the

implementation of the WFD and the FD.

There is no clear, practical reference or link in the RBMPs to the development of the Flood

Risk Management Plans currently underway. According to information provided by the

88

Greek authorities in late 2014, all data developed and used for the first cycle implementation

of the WFD was available and used for preliminary flood risk assessment (PFRA) and for

Flood Mapping elaboration. Also, more detailed information derived from the PFRA and

from the FD-flood mapping on water bodies' hydromorphological alterations and on

environmental pressures due to flooding will be used in the second cycle of the WFD (for a

better analysis of hydromorphological pressures and for the elaboration of PoMs). The

information and programme of measures contained in each future management plan (WFD or

FD), will consider all the information and measures produced in previous cycles.

Most RBMPs mention floods as a side issue, such that some measures are also being targeted

to provide security against floods (mainly related to dam infrastructure and related to

HMWB/AWB designation and the Art. 4.7 – new modifications issue). At the same time,

there is no specific discussion or chapter building the links of the PoM to floods management.

Overall, no natural water retention measures were found that can serve towards reducing

flood risk.

13.3 Adaptation to Climate Change

Climate change has not been taken into consideration in any of the RBMPs, PoMs or DMPs,

(no specific chapter or discussion), e.g. regarding expected changes in water availability. No

plans or related measures to do so in the future can be found.

The only exceptions to this are GR04/5/8, in the DMP of which a two-page chapter is

dedicated to the issue of climate change. It summarises two studies that are annexed to the

DMPs, dealing with (for GR04, 05 and 08 combined) the “Effects of climate change on

rainfall, temperature and evaporation”, which develops different relevant scenarios, and

another on the “Effects of climate change on agriculture and irrigation”, which describes

changes in irrigation needs and proposes some measures for increasing irrigation water

productivity in order to reduce irrigation water needs and to conserve water. These two

studies use different assumptions and thus reach different results on the climate change

effects and are not taken into further consideration in the relevant DMP/RBMP/PoM. Similar

studies cannot be found for the other RBDs.

A climate check of the Programmes of Measures was not performed. The PoMs do not

include specific adaptation measures.

A national strategy for climate change adaptation was not in place when the RBMPs were in

preparation; however, preparatory steps have recently been taken to establish one

(commissioning a study on the development of a National Climate Change Adaptation

Strategy is underway as of September 2014).

89

14. RECOMMENDATIONS

Greece should:

Urgently adopt and report to the Commission the two outstanding Greek RBMPs.

Improve transboundary cooperation, building on the progress achieved so far; additional

efforts in the context of WFD-implementation are needed, so that the second RBMPs for

international RBDs are developed in close cooperation with neighbouring countries.

Make fully operational the new National Monitoring Programme (NMP). All outstanding

assessment methods should be developed and made operational as soon as possible. All

water bodies should be classified according to WFD compliant methods. The one-out all-

out principle should be used across the board. Data must be collected on a regular basis

for all relevant quality elements. The recommendations of the RBMPs regarding the

proposed modifications to the NMP need to be carefully considered and actions for their

implementation pursued. The data of the new NMP must be quality assured, organised

and archived. It is recommended that these data are made available to all users and the

general public through easily accessible formats.

Develop publicly available WFD compliant National Guidance Documents, addressing

the key implementation steps where significant weaknesses have been identified

(characterisation of pressures, typology, reference conditions, monitoring and grouping

of water bodies, methods for the status classification, HMWB designation, application of

exemptions and in particular regarding Article 4.7, etc.), necessary to ensure WFD

compliance and increased comparability and transparency.

The information obtained regarding chemical pollution needs to be extended by filling

gaps in monitoring, including the monitoring of mercury and other relevant pollutants in

biota, and trend monitoring in biota and/or sediment.

Ensure in the updated RBMPs a better understanding and identification of the main risks

and pressures in each river basin, based on detailed harmonised methodologies, and

underpinned by consolidated and robust data.

Particularly urgent is the development of sound methodologies to address

hydromorphological pressures. The current combination of weak pressure analysis (with

not precautionary enough thresholds of significance), lack of ecological status

assessment methods sensitive to hydromorphological pressures, unclear process for

designation of HMWB and lack of development of GEP makes it very likely that

significant hydromorphological pressures are completely overlooked in the

implementation process. Potential effects of “smaller” modifications such as dams lower

than 15 m, dredging, river straightening, drainage, etc., including impacts to transitional

and coastal waters, should be assessed.

Agriculture is indicated as exerting a significant pressure on the water resource in most

Greek RBDs. There needs to be further investigation regarding the hydromorphological

pressures from agriculture. In addition, the measures taken as regards agriculture need to

be more specific, in order to have more reliable positive results regarding the WFD-

objectives.

Regarding GW quantity issues, very limited information about actual abstractions has

been used. The latter are based on estimates. Even if the revised NMP will provide better

information the issue of illegal abstractions/boreholes, their potential effects and ways to

deal with them needs to be considered most thoroughly.

90

Regarding exemptions: overall and even if a large number of water bodies are in

“unknown” status, there is a limited number of exemptions, linked to the fact that only a

limited number of water bodies “fail” the objectives of the WFD. This needs to be

significantly re-considered after monitoring information becomes available - and

consequently, most probably, more measures will need to be taken.

The application of exemptions needs to be more transparent and the reasons for the

exemptions should be clearly justified in the plans. This especially holds true for a

coherent and complete approach regarding Article 4.7 exemptions. The use of

exemptions under Article 4.7 should be based on a thorough assessment of all the steps

as requested by the WFD, in particular a proper assessment of whether the project will

cause deterioration or prevent the achievement of good status, whether the project is of

overriding public interest, whether the benefits to society outweigh the environmental

degradation, and regarding the absence of alternatives that would be a better

environmental option. Furthermore, these projects may only be carried out when all

possible measures are taken to mitigate the adverse impact on the status of the water.

No clear link between measures and status assessment is made. In order to address this,

the gaps in the steps leading to the Programme of Measures, such as pressure and impact

assessment, monitoring and status classification, should be addressed. This is important

in order to implement measures where they are needed to reach the WFD objectives.

In relation to chemical pressures, the intention to compile inventories of emissions in

accordance with Directive 2008/105/EC needs to be carried out, but does not in itself

count as a measure against chemical pollution. More information on relevant measures

needs to be included in the 2nd

RBMPs.

In relation to hydromorphological pressures, and based on a sound assessment, measures

should be taken to mitigate the impacts (e.g. river restoration, removal of structures,

etc.).

Meaningful information regarding the scope, the timing and the funding of the measures

should be included in the PoM so the approach to achieve the objectives is clear and the

ambition in the PoM is transparent.

PoM in RBMPs: the limited level of ambition, and lack of clarity regarding expected

effects, need to be rectified. The PoM includes mostly administrative acts that may not

make a difference (particularly if implementation is not enforced). Many projects that are

in apparent conflict with the WFD (e.g. new dams not properly justified, new irrigation

network projects) are included in the PoM (e.g. for improving GW quantitative status

since the irrigation water will come from a new reservoir in the future). A thorough

check of such projects that are included in the PoM is needed in order to check if they

really are WFD-relevant measures (linked also to the Article 4.7 issue above). This

inclusion of new dams/irrigation schemes, etc. in most of the PoM also affects the costs

indicated: a part of the costs of the PoM-supplementary measures (as defined up to 2015)

come for such projects (often financed through the EU). Otherwise, there is very limited

financing included for “core” WFD-measures to achieve the environmental objectives

(e.g. restoration/mitigation, etc.) without clear commitments for after 2015. There needs

to be a clear separation of measures designed to achieve WFD environmental objectives

from measures designed to increase water supply and other objectives.

Develop fully the economic analysis of water use (including the polluter pays principle,

including a clear definition of water services, harmonising methodologies and data in all

91

RBMPs) and ensure that the water tariffs/fees lead to adequate recovery of the costs of

water services and provide incentives for users to use water resources efficiently. This is

particularly important for agriculture. The implementation of measures on cost recovery

and water pricing based on a common approach across RBDs is urgent, in order to fulfil

the Article 9 requirements and to achieve economic sustainability.

Up to now, there is no consideration of climate change - no “climate proofing” of the

RBMP/PoMs. These issues need to be dealt with urgently.

The Drought Management Plans (DMP) developed as supplementary to the RBMPs are a

valuable addition. However, they need to be taken a step further, be more harmonised,

and evolve into an operational level with the “measures proposals” being implemented in

areas where relevant.

Ensure that the authorities responsible for water management are fully in charge of the

contents and development of the RBMPs. Support from consultants and researchers is

often necessary, but the authorities' ownership of the RBMP should be ensured to embed

the WFD principles and obligations into practice and avoid the disconnection of the

planning process from the water management reality. Long-term capacity and expertise

building should be ensured in the water administration, based on sufficient resources and

personnel available at all relevant administrative levels.

The consultation process needs to be strengthened. More efforts should be done to ensure

active participation of all relevant stakeholders and the comments should be taken under

consideration in a more transparent way.


Recommended