Combination of PV and central receiver CSP plants for base load power generation in South Africa Christoph Adrian Pan ⇑ , Frank Dinter Solar Thermal Energy Research Group (STERG), University of Stellenbosch, Private Bag X1, Matieland, 7602, South Africa article info Article history: Received 29 June 2016 Received in revised form 22 February 2017 Accepted 27 February 2017 Keywords: PV enhanced CSP Central receiver Solar base load capacity Thermal energy storage abstract This paper introduces a novel concept of a PV enhanced central receiver concentrating solar power (CSP) plant for South Africa that can dispatch solar energy from daytime to the night in order to provide solar base load capacity to the grid. Various simulations of standalone PV and CSP plants were carried out and compared to simulation results of the new CSP/PV hybrid concept. A higher annual energy yield and capacity factors of up to 90% can be expected while, at the same time, system size, thus, costs can be reduced. The levelised costs of electricity (LCOE) vary in the range of 0.133–0.157 $/kW h for base load-capable configurations which can substitute generation capacity from old coal-fired power plants. This replacement approach is backed by the high solar irradiation levels found in South Africa, making CSP/PV power plants a sustainable solution to reduce emissions and increase the share of renewables in South Africa. Ó 2017 Elsevier Ltd. All rights reserved. 1. Introduction South Africa’s electricity generation is heavily dependent on old coal-fired power plants with a total share of 92%, followed by 5% nuclear power, 1.6% hydro and the residual 1.4% being supplied by gas, oil and renewables & waste (IEA, 2015). The state-owned power utility, Eskom, owns and manages 92.1% (42,090 MW) of the installed power plant capacity in South Africa as of 2015 (45,699 MW), whereas the residual 3609 MW are operated by independent power producers (IPPs) which sell their electricity to Eskom (2015). Only approximately 50% of the IPP’s installed capacity (1795 MW) (Eskom, 2015) are from renewable generation including mainly wind, PV and concentrating solar power (CSP) but further generation capacity has been procured through the South African Department of Energy’s (DoE) Renewable Energy Indepen- dent Power Producer Procurement Programme (REIPPPP) and is currently under planning or construction. The total allocation amounts to 2660 MW of wind, followed by 1898.5 MW of PV and 600 MW of CSP (DoE, 2015; WWF, 2014). In order to further increase the national generation capacity, South Africa has to increasingly make use of the world’s largest energy source, the sun. With a GHI of up to 2300 kW h/m 2 a and DNI of up to 3200 kW h/m 2 a(Solargis, 2014a, 2014b), South Africa is one of the best sunspots on Earth and is therefore well-suited for PV and CSP systems. According to Fluri (2009), the total potential for CSP generation capacity in South Africa is 547.6 GW with a net electricity generation of 1861.4 TW h/a considering an average capacity factor of 38.8%. Another study on CSP potential in SA depicts a short-term scenario (2011–2017) with a potential of 262 GW based on parabolic trough plants with seven hours of ther- mal storage (Meyer and van Niekerk, 2011). This significantly lower potential can be explained by the not fully developed trans- mission grid in the Northern Cape, whereby suitable locations are out of proximity of viable substations. A medium-term scenario (2018–2025) takes Eskom’s grid expansion plans into account, enabling an additional 49 GW of potential in the Northern Cape. Additional potential can be unlocked by waterless next generation CSP plants where the proximity to suitable water sources is no longer necessary. Compared to the currently total installed gener- ation capacity of 45.7 GW, there is a vast potential for CSP in South Africa. In order to decarbonize South Africa’s electricity generation, a substitute for coal-fired power plants is needed which can provide base load capacity to the national grid. Although large-scale com- mercial PV power plants are not yet financially viable to provide base load capacity in combination with storage systems, CSP has been found to be a ‘‘baseload-capable technology” (Pfenninger and Gauché, 2014). The researchers showed that 100 CSP power plants at ten geographically dispersed sites in South Africa could provide base load power generation by taking advantage of the spatial concurrence of cloud covers. However, this study takes a http://dx.doi.org/10.1016/j.solener.2017.02.052 0038-092X/Ó 2017 Elsevier Ltd. All rights reserved. ⇑ Corresponding author. E-mail address: [email protected](C.A. Pan). Solar Energy 146 (2017) 379–388 Contents lists available at ScienceDirect Solar Energy journal homepage: www.elsevier.com/locate/solener
Christoph Adrian Pan ⇑, Frank DinterSolar Thermal Energy Research Group (STERG), University of Stellenbosch, Private Bag X1, Matieland, 7602, South Africa
a r t i c l e i n f o
Article history:Received 29 June 2016Received in revised form 22 February 2017Accepted 27 February 2017
Keywords:PV enhanced CSPCentral receiverSolar base load capacityThermal energy storage
a b s t r a c t
This paper introduces a novel concept of a PV enhanced central receiver concentrating solar power (CSP)plant for South Africa that can dispatch solar energy from daytime to the night in order to provide solarbase load capacity to the grid. Various simulations of standalone PV and CSP plants were carried out andcompared to simulation results of the new CSP/PV hybrid concept. A higher annual energy yield andcapacity factors of up to 90% can be expected while, at the same time, system size, thus, costs can bereduced. The levelised costs of electricity (LCOE) vary in the range of 0.133–0.157 $/kW h for baseload-capable configurations which can substitute generation capacity from old coal-fired power plants.This replacement approach is backed by the high solar irradiation levels found in South Africa, makingCSP/PV power plants a sustainable solution to reduce emissions and increase the share of renewablesin South Africa.
� 2017 Elsevier Ltd. All rights reserved.
1. Introduction
South Africa’s electricity generation is heavily dependent on oldcoal-fired power plants with a total share of 92%, followed by 5%nuclear power, 1.6% hydro and the residual 1.4% being suppliedby gas, oil and renewables & waste (IEA, 2015). The state-ownedpower utility, Eskom, owns and manages 92.1% (42,090 MW) ofthe installed power plant capacity in South Africa as of 2015(45,699 MW), whereas the residual 3609 MW are operated byindependent power producers (IPPs) which sell their electricityto Eskom (2015). Only approximately 50% of the IPP’s installedcapacity (1795 MW) (Eskom, 2015) are from renewable generationincluding mainly wind, PV and concentrating solar power (CSP) butfurther generation capacity has been procured through the SouthAfrican Department of Energy’s (DoE) Renewable Energy Indepen-dent Power Producer Procurement Programme (REIPPPP) and iscurrently under planning or construction. The total allocationamounts to 2660 MW of wind, followed by 1898.5 MW of PV and600 MW of CSP (DoE, 2015; WWF, 2014).
In order to further increase the national generation capacity,South Africa has to increasingly make use of the world’s largestenergy source, the sun. With a GHI of up to 2300 kW h/m2 a andDNI of up to 3200 kW h/m2 a (Solargis, 2014a, 2014b), South Africais one of the best sunspots on Earth and is therefore well-suited for
PV and CSP systems. According to Fluri (2009), the total potentialfor CSP generation capacity in South Africa is 547.6 GW with anet electricity generation of 1861.4 TW h/a considering an averagecapacity factor of 38.8%. Another study on CSP potential in SAdepicts a short-term scenario (2011–2017) with a potential of262 GW based on parabolic trough plants with seven hours of ther-mal storage (Meyer and van Niekerk, 2011). This significantlylower potential can be explained by the not fully developed trans-mission grid in the Northern Cape, whereby suitable locations areout of proximity of viable substations. A medium-term scenario(2018–2025) takes Eskom’s grid expansion plans into account,enabling an additional 49 GW of potential in the Northern Cape.Additional potential can be unlocked by waterless next generationCSP plants where the proximity to suitable water sources is nolonger necessary. Compared to the currently total installed gener-ation capacity of 45.7 GW, there is a vast potential for CSP in SouthAfrica.
In order to decarbonize South Africa’s electricity generation, asubstitute for coal-fired power plants is needed which can providebase load capacity to the national grid. Although large-scale com-mercial PV power plants are not yet financially viable to providebase load capacity in combination with storage systems, CSP hasbeen found to be a ‘‘baseload-capable technology” (Pfenningerand Gauché, 2014). The researchers showed that 100 CSP powerplants at ten geographically dispersed sites in South Africa couldprovide base load power generation by taking advantage of thespatial concurrence of cloud covers. However, this study takes a
AC alternating currentCPV concentrating photovoltaicCSP concentrating solar-thermal powerDC direct currentDNI direct normal irradiance in W/m2
LCOE levelised costs of electricity
O&M operation and maintenancePV photovoltaicSM solar multipleTES thermal energy storage
380 C.A. Pan, F. Dinter / Solar Energy 146 (2017) 379–388
different approach by introducing a novel concept of a combinationof PV and CSP power plants (CSP/PV) in order to supply a constantbase load capacity.
A similar concept of enhancing CSP generation with PV hasalready been introduced by Platzer (2014) by combining a50 MW CSP plant (parabolic trough) with 12 h storage with a75 MW concentrating PV (CPV) power plant to increase the opera-tion time of the combined power plant. In another study, Platzer(2016) combined a flat-plate PV as well as a CPV power plant witha linear Fresnel collector plant using molten salt as heat transferfluid. This resulted in higher capacity factors and lower LCOEs.Similar concepts are already in development for commercial useby SolarReserve, Abengoa and ACWA Power (Castillo, 2015). Thefocus of this study, however, is on demonstrating the capabilityof a 100 MW CSP central receiver plant combined with a100 MW PV power plant to supply 100 MW base load capacity tothe grid. This concept is presented in detail in Section 3.3.
2. Methodology
In order to demonstrate the base load-capability of a combinedCSP/PV power plant and its advantages over a conventional CSPplant, a comparison with a standalone PV and CSP plant was madeby simulating different power plant configurations with the Sys-tem Advisor Model (SAM) from the National Renewable EnergyLaboratory (NREL, 2017). The simulation approach was to first sim-ulate a PV power plant with 100 MW nameplate capacity, followedby a CSP molten salt central receiver (100 MW) with various con-figurations, where the effect of different storage sizes and solarmultiples (SM) on the annual energy yield and capacity factorwas analysed. For the CSP/PV simulation, the PV plant from thefirst simulation was combined with a second 100 MW CSP plantin SAM and its power generation pattern was then adapted tothe load profile supplied by the PV power plant in order to fill upthe gap between the PV plant output and the desired 100 MW. Thiscan be achieved by operating the steam turbine in part load. Fig. 1illustrates the simulation concept. It can be seen that the CSP/PVoption is a combination of two 100 MW power plants resultingin 200 MW installed capacity. However, the goal of this studywas to only supply a total base load capacity of 100 MW and tonot take advantage of the additional installed capacity when the
PV100 MW
CSP100 MW
CSP/PV200 MW
PV100 MW
CSP (modified)
100 MW
base load capacity 100 MW
Fig. 1. Power plant simulation concept.
solar resource is high. It should be noted that any other capacityconfiguration of CSP and PV would be possible. The PV plant couldfor example be oversized to provide a 100 MW output during mostof its operation time. However, because a 100 MW PV plant per-forms below its nominal capacity most of the time, there will mostlikely always be a need for the CSP plant to cover the additionalcapacity requirement. This is in favour of the CSP turbine, whichcan therefore be operated at part load, hence avoiding unwantedturbine stops.
Weather data from Upington, Northern Cape was used for thesimulations due to its high solar radiation values and proximityto current CSP plants in operation and construction as well as thepossibility of access to the Eskom grid. The results of the simula-tions were used to demonstrate the advantages of a combinedCSP/PV power plant in terms of annual energy yield, capacity factorand 24/7 solar base load-capability.
Lastly, a parametric study on the effect of solar field size andstorage size on the LCOE has been carried out.
3. PV, CSP and CSP/PV design and simulation assumptions
The first step was to simulate a PV power plant and a CSP plantwith various configurations in order to be able to compare theresults with those from the novel power plant concept in Sec-tion 3.3. The following sections describe the design parameters ofthe power plants and main assumptions.
3.1. PV power plant
The PV power plant was modeled with 110 MWp multi-crystalline silicon modules and a total inverter capacity of100.3 MWAC. The modules were assumed to face direction north(azimuth 0�) with a tilt angle of 28.4�. The resulting module areawas 727,699 m2. The simulation results (Table 1) predict an annualelectricity production of 223.6 GW h (without degradation) and acapacity factor of 23.2%. This PV plant model is later used to matchthe CSP generation to the PV output in the CSP/PV hybrid case.
The hourly electricity generation curve in Fig. 2 shows thatthere is no significant seasonality in the hourly supply from thePV power plant but the peaks are concentrated between 75 and95 MW and never reach the desired capacity of 100 MW. Sincethe PV plant can only operate during sunshine hours, it is not pos-sible to continuously generate electricity over the whole day.
Table 1PV power plant performance.
Item Unit Value
Annual energy generation GW h 223.6Capacity factor % 23.2Specific yield kW hAC/kWDC 2033Performance ratio % 84.0
PV A
C p
ower
gene
ratio
n (M
W)
Fig. 2. Hourly PV power plant supply curve over a year.
C.A. Pan, F. Dinter / Solar Energy 146 (2017) 379–388 381
3.2. CSP molten salt central receiver
The simulation of the CSP plant followed a much more complexapproach than of the PV system due to its numerous input vari-ables and the analysis of the effect of different solar multiplesand thermal energy storage (TES) full load hours on the electricityyield. Table 2 shows the simulated configurations with solar mul-tiples varying from 1.5 to 4 and TES hours from 14 to 20 h. All con-figurations were assumed to have 115 MWe gross turbine capacityand 100 MWe of net capacity.
Table 3 provides the design parameters of the tower and recei-ver. Molten salt (60% NaNO3, 40% KNO3) was used as heat transferfluid (HTF) and the receiver inlet temperature was set to 290 �Cwhereas the outlet temperature was assumed to be 565 �C. Thesetemperatures were also used for the steam generator (inlet:565 �C, outlet: 290 �C). The power cycle features a Rankine-cyclesteam turbine (150 bar live steam pressure) with a gross cycle effi-ciency of 42% and an air-cooled condenser. In order to simulatesystem downtimes for outages or scheduled maintenance, a plantavailability of 96% was assumed. To complete the modelled system,a two-tank molten salt storage with a bypass valve is used to eitherpump the HTF from the receiver directly to the power cycle or tothe storage. The built-in optimisation algorithm in SAM was usedfor sizing the solar field and tower.
3.3. PV enhanced CSP
Considering the study’s goal to demonstrate a base load-capablesolar technology able to replace coal-fired power plants, the above
Table 2Simulated CSP configurations.
Item Unit Value
Turbine capacity, gross MWe 115Turbine capacity, net MWe 100
TES full load hours h 14Solar multiple – 1.5 2 2.5 3
TES full load hours h 18Solar multiple – 1.5 2 2.5 3
CSP plant configurations are large systems resulting in high costs.In order to reduce these costs (and hence, the system size) andimprove the power plant performance and its ability to supply baseload, a combination of a PV and CSP plant is introduced. This con-cept uses the PV power plant from Section 3.1 to enhance thepower generation from a smaller CSP plant of which the operatingstrategy is adapted to the hourly power output of the PV plant inorder to always fill up the gap between the PV output and theset capacity of 100 MW. Hence, if there is no electricity suppliedby the PV plant, the CSP plant covers the missing 100 MW of capac-ity. When the PV plant starts to produce electricity in the morning,on the other hand, the CSP plant reduces its power generationaccordingly. During PV peak hours, the CSP plant reduces thepower output to a minimum in order to just use as much solarenergy as needed to keep the turbine running and residual heatfrom the receiver is stored in the thermal energy storage. Whenthe sun starts to set in the afternoon and the PV power supply sub-sequently decreases, the CSP plant increases its power generationagain to fill up the missing gap to the desired 100 MW. As soonas the PV plant does not deliver any electricity to the grid anymore,the CSP plant is running at full capacity throughout the night untilthe sun rises again by using the stored heat in the storage tank. Bydoing so, the two power plants virtually act together in order tosupply 100 MW base load capacity.
The key of this concept is the TES from the CSP plant, allowingdispatching electricity generation from day to night time, hence,making it suitable for a combination with a PV power plant whichcan only generate electricity during day time. The principle of acombined CSP/PV power plant is outlined in Fig. 3. While an
163.5 4 1.5 2 2.5 3 3.5 4
203.5 4 1.5 2 2.5 3 3.5 4
Table 3Tower and receiver design parameters for SM 1.5–4.
Item Unit Value
Heat transfer fluid – Salt (60% NaNO3, 40% KNO3)Inlet temperature �C 290Outlet temperature �C 565
Solar multiple – 1.5 2 2.5 3 3.5 4Tower height m 170.7 200.6 207.7 227.8 250.4 275.0Receiver height m 20.54 23.04 23.87 25.46 24.32 28.64Receiver diameter m 14.03 16.55 17.44 19.84 27.13 28.86Receiver aperture area m2 905 1198 1307 1587 2073 2596Receiver thermal power MWth 410.7 547.6 684.5 821.4 958.3 1095.2
382 C.A. Pan, F. Dinter / Solar Energy 146 (2017) 379–388
uncoordinated power production of both power plants wouldcause high peaks at noon and no generation capacity in the earlymorning hours, dispatching the thermal energy from hours wherePV generation is available for later use at night, enables acontinuous power generation at a set capacity. This also reducesthe CSP system size (mainly the heliostat field size) because onlya smaller solar multiple is needed to fill the TES due to its priorityloading and only marginal turbine operation during sunshinehours. This decrease in heliostat field size results in drastic costreduction potentials. Due to the expected reduction in system size,the CSP/PV hybrid plant is only simulated with solar multiplesfrom 1.5 to 3.
The operating strategy of the CSP/PV hybrid plants is imple-mented in SAM by adapting the TES dispatch control. This allowsthe CSP plant to adapt its power generation to the PV system out-put. Since it is not possible to provide an hourly load profile inSAM this was done by manipulating the TES dispatch control ona monthly basis with 24 h representing an average day of therespective month. First, the average PV generation profiles foreach month were generated and then subtracted from the desired100 MW power, resulting in a residual load that must be coveredby the CSP plant. This load demand was then converted into apercentage of the turbine output fraction and applies to thedesign turbine thermal input. Fig. 4 shows the resulting monthlyTES dispatch control matrix with eight different periods and theircorresponding turbine output fraction percentage in Table 4. Itcan be seen that during night time the turbine thermal input isonly 95% from its design point due to the average parasitic con-sumption of approx. 8 MW at night and results in a net outputof 101.25 MW, which is close to the desired 100 MW. This mea-sure also assures that the TES is not discharged as quickly as ifthe turbine would run at 100% and thus, there is still thermalenergy available in the early morning. It should be noted that thisis a very simplified integration of the operating strategy and amore sophisticated and dynamic control logic is recommended.However, this workaround allows an initial analysis of a hybridsystem with SAM.
4. Economic analysis
The LCOE is a financial indicator calculated over a whole eco-nomic lifetime of a power plant in order to make it possible tocompare different technologies with different financial parametersand generation structures. It is calculated by dividing a powerplant’s accumulated costs for construction and operation by thesum of the annual energy generated during the power plant’s oper-ational lifetime. This approach follows the method of the net pre-sent value where the amount of money invested today iscompared to the present value of the future cash amounts afterthey are discounted by a set rate of return. The LCOE for all consid-ered options in this paper are calculated following the simplifiedapproach from Fraunhofer ISE (2013):
LCOE ¼Cinvest þ
Pni¼t
CO&M;t
ð1þiÞtPn
i¼tEel;net;tð1þiÞt
ð1Þ
where n is the operational lifetime of the power plant and t the yearof the lifetime (1, 2, . . . ,n). Eel;net;t is the annual electricity generationin year t. For the PV plant Cinvest;PV are the total investment costswith
Cinvest;PV ¼ Ppeak � ðcsm þ cst þ cep þ cinv þ celc þ csi þ ctl þ cssÞ ð2Þwhere Ppeak is the total DC peak power and cx are the specific plantcosts in $/Wp. The total investment costs of the CSP plant Cinvest;CSP
are
Cinvest;CSP ¼ ðCHF þ CTþR þ CTES þ CPB þ CSGÞ � ð1þ f EPCÞ ð3Þwhere Cx are the investment costs of the CSP plant componentsgiven as the specific investment costs per unit times their unitand f EPC is a factor for the surcharge for EPC, project managementand contingencies. The operation and maintenance (O&M) costs ofthe PV plant are calculated as
CO&M;PV ¼ Cinvest;PV � ðf O&M;PV þ f ins;PV Þ ð4Þwhere f O&M;PV and f ins;PV are the annual O&M and insurance costs,respectively. The O&M costs of the CSP plant are
CO&M;CSP ¼ cO&M � Pgross þ ðCinvest;CSP � f ins;CSPÞ ð5Þwith cO&M being the specific O&M costs and Pgross the turbine grosscapacity. f ins;CSP is a factor accounting for the annual insurance costsfor the CSP plant. The annual net electricity generation Eel;net;PV ;t ofthe PV plant is reduced by the factor f degrad which takes an annualdegradation of the modules into account.
Eel;net;PV ;t ¼ Eel;net;PV ;t�1 � ð1� f degradÞ ð6ÞIn order to combine the LCOEs from the CSP and PV system for
the CSP/PV option, the following formula was used:
Lifetime n 25 YearsReal interest rate i 7.5 %Annual insurance costs fins,CSP 1 %/aSurcharge for EPC, project management and
riskfEPC 15 %
a Kolb et al. (2011).
C.A. Pan, F. Dinter / Solar Energy 146 (2017) 379–388 383
The cost assumptions and financial parameters are listed inTable 5 for the PV plant and Table 6 for the CSP plant.
5. Results
The results obtained from the simulations are presented in thefollowing sections. First, the power plant performances in terms ofcapacity factor and base load-capability are discussed and lastlythe LCOEs for the various configurations are presented.
5.1. Power plant performance
The annual net electricity generation from all simulated config-urations (Fig. 6) shows large differences in the annual output.
Generally, the net output of the CSP/PV hybrid option is alwayshigher than from the standalone CSP plants with the same config-urations (due to the additional 223.6 GW h from the PV plant). Thetwo CSP/PV systems with a SM of 2.5 and 3 even generates moreelectricity than the largest CSP-only options with SM 4 for the var-ious storage sizes. Increasing the solar multiple results in a sub-stantially higher annual electricity yield, whereas increasing theTES size has only a marginal effect.
Although the simulated power plants have large TES sizes, mostof these configurations are not capable to provide a 24/7 solarcapacity supply. In the case of standalone CSP, only the optionswith a SM above 3.5 and more than 18 h of TES full load hours werefound to be base load-capable. This can be seen in Fig. 5 where theannual average load profiles of the configurations with a SM of 3.5and 4 are depicted. Configurations with 14 or 16 h of TES can gen-erate electricity throughout the night on some days but they aretoo small to do that constantly on average. The same applies tothe CSP/PV hybrid plants where only the larger configurations witha SM above 2.5 are capable of providing base load capacity on anannual average. However, a TES size of 14 h is too small to main-tain a high level of base load capacity especially in the early morn-ing hours.
The capacity factors of the individual configurations are plottedin Fig. 7. The CSP/PV hybrid power plants offer a substantiallyhigher capacity factor with all configurations. The maximum valueof 92.1% is achieved with the largest CSP/PV option with SM 3 and
14 h16 h18 h20 h
14 h16 h18 h20 h
time of day (h)time of day (h)
net e
lect
ricity
(M
W)
Annual profile Annual profile
14 h16 h18 h20 h
14 h16 h18 h20 h
time of day (h)time of day (h)
net e
lect
ricity
(M
W)
Annual profile Annual profileCSP/PV hybrid
standalone CSP
Fig. 5. Annual average profiles of standalone CSP and CSP/PV hybrid configurations.
0
100
200
300
400
500
600
700
800
900
1.5 2 2.5 3 3.5 4
net e
lect
ricity
gen
erat
ion
(GW
h/a)
SM
14 h
16 h
18 h
20 h
CSP
CSP
CSP
CSPCSP
CSP/PV
CSP/PVCSP/PV CSP/PV
Fig. 6. Effect of storage size and SM on annual net electricity generation for CSP/PV and standalone CSP power plants.
384 C.A. Pan, F. Dinter / Solar Energy 146 (2017) 379–388
20 h TES. Slightly smaller configurations in terms of solar multipleand TES still offer capacity factors in the 90% range. It should benoted that the capacity factor of the CSP/PV power plants is calcu-lated based on the assumption that the CSP/PV power plant has100 MW installed capacity although technically there are200.3 MW installed (CSP plus PV capacity). However, because ofthe scope of this study to have a ‘‘virtual” power plant that has
100 MW as actual capacity it is assumed that the combined capac-ity is also 100 MW instead of 200.3 MW.
Fig. 8 shows the hourly load profile of the CSP/PV plant with SM3 and 20 h TES during a typical winter. In the upper graph, the PVsupply is depicted in blue and complemented by the CSP capacityin orange. The combined net output is fluctuating around 100 MWover several days, but with some generation drops of up to 15 MW
40
50
60
70
80
90
100
1.5 2 2.5 3 3.5 4
capa
city
fact
or [%
]
SM
14 h CSP
16 h CSP
18 h CSP
20 h CSP
14 h CSP/PV
16 h CSP/PV
18 h CSP/PV
20 h CSP/PV
CSP/PV
CSP
Fig. 7. Capacity factors for CSP standalone and CSP/PV hybrid plants.
Fig. 8. Hourly combined CSP/PV load profile (SM 3, 20 h TES) over a year and close-up of individual PV and CSP generation capacity during a typical winter period (23rd June–11th July).
C.A. Pan, F. Dinter / Solar Energy 146 (2017) 379–388 385
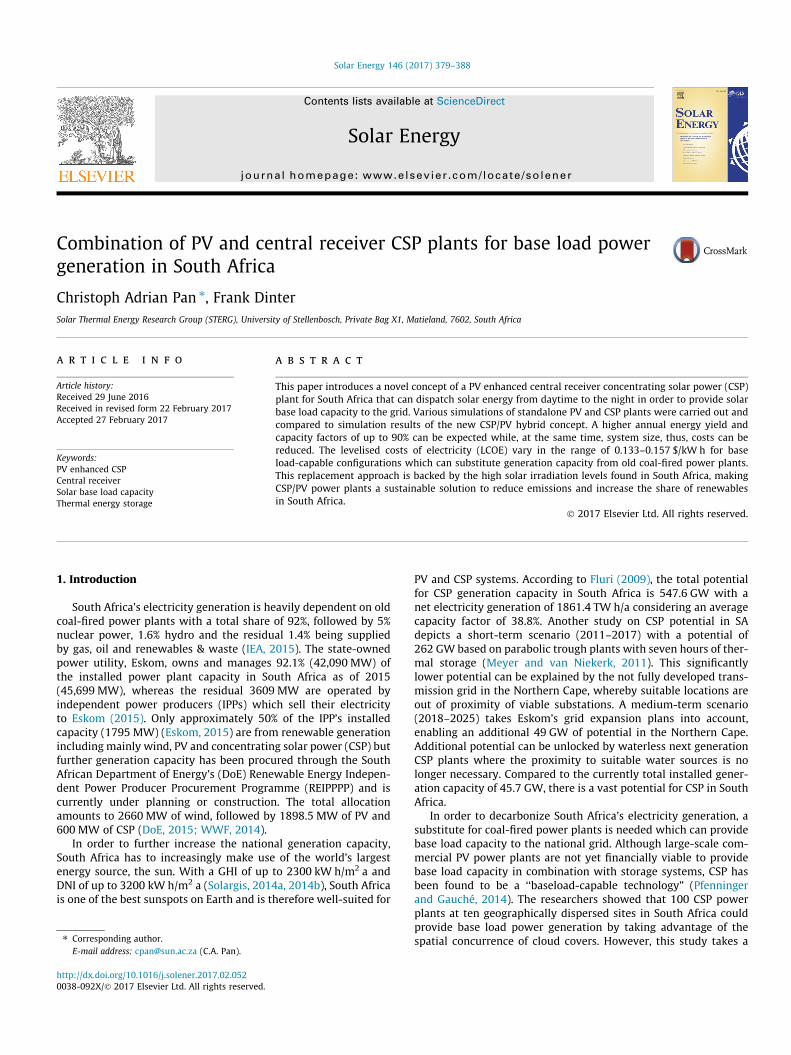
during daytime. This is due to the simplified and static CSP controlstrategy implemented in the simulations which controls the tur-bine output fraction based on a monthly average PV load profile.This results in deviations on days with higher or lower PV genera-tion than the average of the respective month. However, the loadcurve could be smoothened to a more constant power supply witha more advanced and dynamic control strategy which reactsdirectly to the power output supplied by the PV plant. The graphalso shows when times of no power generation occur. This can alsobe seen in Fig. 9 where the probability distribution of the power
output of the largest configurations of both the CSP (SM 4 and20 h TES) and CSP/PV (SM 3 and 20 h TES) option are depicted.The desired base load of 100 MW is only supplied during 2% ofthe time with the CSP option, whereas the CSP/PV option suppliesa base load of 100 MW at 24% of the time. During the residualtimes, the capacity ranges between 90 and 110 MW for the CSP/PV option. Alternatively, the standalone CSP option has a moreuneven distribution and more times of an oversupply of 105 MW.Furthermore, the CSP option has a system down time of 6%,whereas the CSP/PV option is not generating any electricity during
SM 4 20 h (MW) SM 3 20 h (MW)
CSP standaloneSM 4, 20 h TES
CSP/PVSM 3, 20 h TES
% o
f dat
a poi
nts
% o
f dat
a po
ints
CDF %
CD
F %
Fig. 9. Probability distribution of CSP (left) and CSP/PV (right) power output.
386 C.A. Pan, F. Dinter / Solar Energy 146 (2017) 379–388
only 3% of the year (11 days). Such a small fraction of systemdowntime makes the concept of a CSP/PV power plant suitable asa base load power plant for 24/7 solar electricity generation.
5.2. LCOE analysis
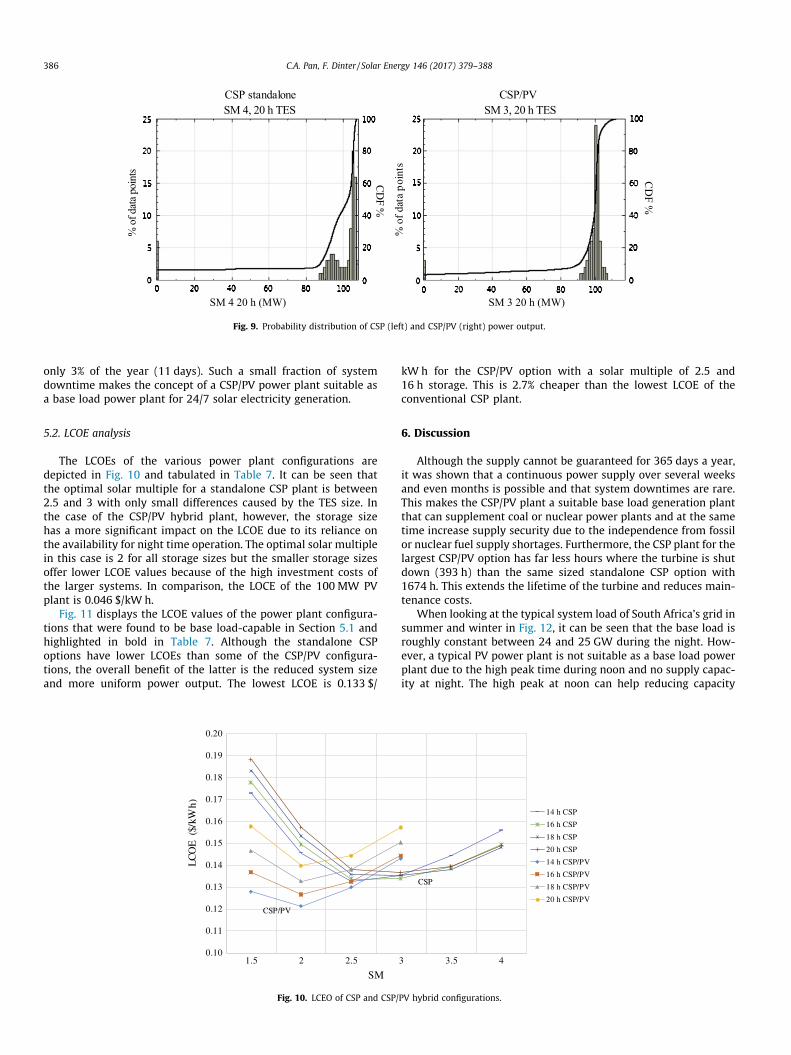
The LCOEs of the various power plant configurations aredepicted in Fig. 10 and tabulated in Table 7. It can be seen thatthe optimal solar multiple for a standalone CSP plant is between2.5 and 3 with only small differences caused by the TES size. Inthe case of the CSP/PV hybrid plant, however, the storage sizehas a more significant impact on the LCOE due to its reliance onthe availability for night time operation. The optimal solar multiplein this case is 2 for all storage sizes but the smaller storage sizesoffer lower LCOE values because of the high investment costs ofthe larger systems. In comparison, the LOCE of the 100 MW PVplant is 0.046 $/kW h.
Fig. 11 displays the LCOE values of the power plant configura-tions that were found to be base load-capable in Section 5.1 andhighlighted in bold in Table 7. Although the standalone CSPoptions have lower LCOEs than some of the CSP/PV configura-tions, the overall benefit of the latter is the reduced system sizeand more uniform power output. The lowest LCOE is 0.133 $/
0.10
0.11
0.12
0.13
0.14
0.15
0.16
0.17
0.18
0.19
0.20
1.5 2 2.5
LCO
E ($
/kW
h)
SM
CSP/PV
Fig. 10. LCEO of CSP and CSP/
kW h for the CSP/PV option with a solar multiple of 2.5 and16 h storage. This is 2.7% cheaper than the lowest LCOE of theconventional CSP plant.
6. Discussion
Although the supply cannot be guaranteed for 365 days a year,it was shown that a continuous power supply over several weeksand even months is possible and that system downtimes are rare.This makes the CSP/PV plant a suitable base load generation plantthat can supplement coal or nuclear power plants and at the sametime increase supply security due to the independence from fossilor nuclear fuel supply shortages. Furthermore, the CSP plant for thelargest CSP/PV option has far less hours where the turbine is shutdown (393 h) than the same sized standalone CSP option with1674 h. This extends the lifetime of the turbine and reduces main-tenance costs.
When looking at the typical system load of South Africa’s grid insummer and winter in Fig. 12, it can be seen that the base load isroughly constant between 24 and 25 GW during the night. How-ever, a typical PV power plant is not suitable as a base load powerplant due to the high peak time during noon and no supply capac-ity at night. The high peak at noon can help reducing capacity
3 3.5 4
14 h CSP
16 h CSP
18 h CSP
20 h CSP
14 h CSP/PV
16 h CSP/PV
18 h CSP/PV
20 h CSP/PV
CSP
PV hybrid configurations.
Table 7LCOE of CSP and CSP/PV power plants with varying SM and TES size (with base load-capable configurations in bold).
Fig. 11. LCOE of base load-capable power plant configurations.
0
20
40
60
80
100
120
140
160
180
0
5
10
15
20
25
30
35
40
PV, C
SP &
CSP
/PV
supp
ly c
apac
ity (M
W)
syst
em lo
ad (G
W)
time of day
system load winter system load summer PV
CSP (SM 2.5, 14 h TES) CSP (SM 3, 16 h TES) CSP/PV (SM 3, 16 h TES)
Fig. 12. Typical system load in South Africa in July (winter) and January (summer) and PV, CSP & CSP/PV supply capacity.
C.A. Pan, F. Dinter / Solar Energy 146 (2017) 379–388 387
shortfalls in the grid at peak demand hours but the low generationcapacity in the early morning and late afternoon hours does notcontribute significantly to the system supply. Furthermore, thereis no electricity generation at night, especially during the peak sys-tem load at 7 pm.
A CSP plant, however, ramps up electricity generation in themorning as soon as the solar irradiation is strong enough to gener-ate steam and can run at a constant power output throughout theday due to its thermal energy storage (TES). A large storage allowscontinuous power generation even after sunset. This is illustratedby the simulated CSP plant with a solar multiple of 2.5 and 14 fullload hours of TES where electricity generation is constant until1 am or 2 am on a typical winter day by using energy from theTES after sunset. A higher solar multiple of 3 and a larger TES of16 h is able to provide continuous power generation until 6 am.A CSP/PV power plant with the same sized CSP system (SM 3 and16 h TES) can generate electricity continuously throughout thenight due to the additional PV system which allows to dispatch
the energy to the night time. CSP/PV plants can therefore graduallysubstitute base load coal or nuclear electricity generation with24/7 solar energy. However, potential locations for the powerplants are restricted to certain areas due to water availability andvicinity to transmission lines.
An additional advantage of the CSP/PV option is that technicallythere are 200.3 MW installed, but only 100 MW are needed to pro-vide the defined base load capacity. This means that in specialcases with high electricity demand from the demand side thepower plant could provide additional capacity to the grid givingit an additional ability to provide balancing energy rather than justacting as a base load power plant.
Although this study used weather data for a South African loca-tion, it can be expected that this concept is also able to providessolar base load capacity in other regions in the world with a similaror higher solar resource. However, a more advanced control logicshould be implemented in order to smoothen the electricitygeneration.
388 C.A. Pan, F. Dinter / Solar Energy 146 (2017) 379–388
7. Conclusions
This study introduced a novel concept of a PV enhanced CSPpower plant to supply solar base load capacity to the South Africangrid. It was shown that a combination of a PV and a central receiverCSP power plant allows dispatching energy from daytime to thenight in order to supply a constant capacity. However, this is highlydependent on the CSP plant size in terms of solar multiple and TES.
It has been shown that a smaller CSP system is needed if com-bined with PV to supply a constant power generation and obtain asimilar or even higher energy yield than with a conventional CSPplant. This results in cost reductions for the heliostat field andTES, leading to lower LCOE values in the range of 0.133–0.157 $/kW h than a same-sized conventional CSP plant. Furthermore, aCSP/PV power plant generates more electricity per year and hashigher capacity factors of up to 90% compared to a standaloneCSP plant of the same size or larger.
In addition to those advantages, a CSP/PV power plant is baseload-capable, making it a good option for replacing South Africa’saging coal-fired power plants which have to be substituted witha clean energy source in the future. South Africa has an excellentsolar resource, thus making solar technologies like combinedCSP/PV power plants a viable solution for a replacementprogramme.
Funding
This research did not receive any specific grant from fundingagencies in the public, commercial, or not-for-profit sectors.
Acknowledgements
The authors would like to thank Francine Simon for proof read-ing and editing this article.
References
Castillo, Á., 2015. Integration of CSP and PV: The Way Forward? [WWWDocument].CSP Today. <http://beta.csptoday.com/technology/integration-csp-and-pv-way-forward> (accessed 2.21.17).
Eskom, 2015. Integrated Report 2015. Johannesburg, South Africa.Fluri, T.P., 2009. The potential of concentrating solar power in South Africa. Energy
Policy 37, 5075–5080. http://dx.doi.org/10.1016/j.enpol.2009.07.017.Fraunhofer ISE, 2013. Levelized Cost of Electricity Renewable Energy Technologies.
Freiburg, Germany.IEA, 2015. Electricity & Heat Statistics South Africa [WWW Document]. <http://
www.iea.org/statistics/statisticssearch/> (accessed 3.18.15).Kolb, G., Ho, C., Mancini, T., Gary, J., 2011. Power Tower Technology Roadmap and
Cost Reduction Plan. Sandia National Laboratories, Albuquerque, New Mexico.http://dx.doi.org/10.2172/1011644.
Meyer, A.J., van Niekerk, J.L., 2011. Roadmap for the Deployment of ConcentratingSolar Power in South Africa. In: Proceedings of Solar Power and ChemicalEnergy Systems Conference (SolarPACES 2011). Stellenbosch, South Africa.
Pfenninger, S., Gauché, P., 2014. Potential for concentrating solar power to providebaseload and dispatchable power. Nat. Clim. Chang. http://dx.doi.org/10.1038/NCLIMATE2276.
Platzer, W., 2014. PV–Enhanced Solar Thermal Power. Energy Proc. 57, 477–486.http://dx.doi.org/10.1016/j.egypro.2014.10.201.
Platzer, W.J., 2016. Combined Solar Thermal and Photovoltaic Power Plants – AnApproach to 24 h Solar Electricity? 1734. http://dx.doi.org/10.1063/1.4949173.
Solargis, 2014a. Solargis Global Horizontal Irradiation Map for South Africa, Lesothoand Swaziland [WWW Document]. <http://www.sauran.net/Docs/SolarGIS_GHI_South_Africa_width15cm_300dpi.png> (accessed 5.4.15).
Solargis, 2014b. Solargis Direct Normal Irradiation Map for South Africa, Lesothoand Swaziland [WWW Document]. <http://www.sauran.net/Docs/SolarGIS_DNI_South_Africa_width15cm_300dpi.png> (accessed 5.4.15).
Terblanche, U., 2015. Large Scale Solar PV Costs in South Africa. Research Engineerat CRSES (Center for Renewable and Sustainable Energy Studies), E-mailCorrespondence, Stellenbosch, South Africa.
WWF, 2014. Enabling Renewable Energy in South Africa: Assessing the RenewableEnergy Independent Power Producer Procurement Programme [WWWDocument]. <http://awsassets.wwf.org.za/downloads/enabling_re_in_sa.pdf>(accessed 8.6.15).