22
combined analysis of the spectrum and anisotropies of UHECRs Daniel De Marco Bartol Research Institute University of Delaware
| Date post: | 19-Dec-2015 |
| Category: |
Documents |
| View: | 217 times |
| Download: | 4 times |

combined analysis of the spectrum and
anisotropies of UHECRs
combined analysis of the spectrum and
anisotropies of UHECRs
Daniel De MarcoDaniel De MarcoBartol Research InstituteUniversity of Delaware

2
planplan
AGASA vs HiResAGASA: spectrum vs
ssaexpectations for
Auger
AGASA vs HiResAGASA: spectrum vs
ssaexpectations for
Auger

3
AGASA & HiResAGASA & HiRes
a facto
r 2 in
the flux
HiRes: GZK
AGASA: no GZK

5DDM, Blasi, Olinto 2003
systematic errors (?)systematic errors (?)
AGASA +15%HiRes -15%
agreement
@ low energy
less
disagreement
@ high energy
how much
?
6
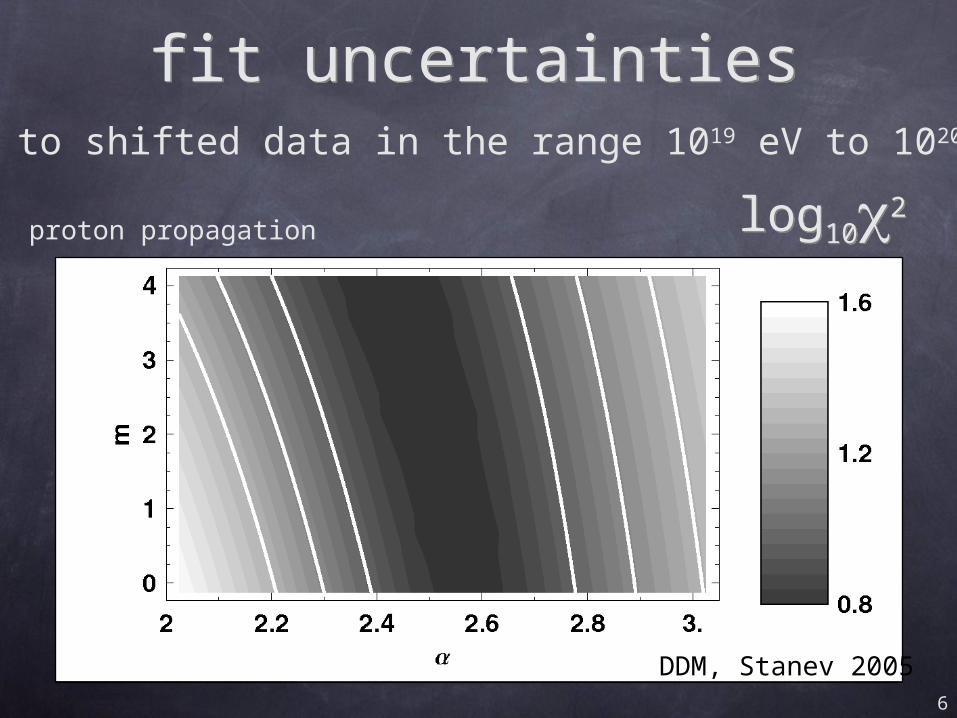
fit uncertaintiesfit uncertainties
DDM, Stanev 2005
log102log102
fit to shifted data in the range 1019 eV to 1020 eV
proton propagation

7
fit uncertaintiesfit uncertainties
DDM, Stanev 2005
m=0, ±1

8
statistical error in the energy reconstruction
statistical error in the energy reconstruction
<n20> forAGASA is increased
by 1
energy resolution: ±30%

9
high energy: AGASAhigh energy: AGASAwe simulated 30000 realizations of the AGASA statistics above 4·1019 eV (72 events) and we counted the number of events with energy above 1020 eV.18 realizations produced 11 or more events above 1020 eVprobab.: 6·10-4 — 3.2
the same procedure applied to the AGASA-15% statistics resulted in a probability of about
1% — 2.3 accounting for the
sys. errors, the AGASA result
doesn’t have a high statistical
significance
histogram of the number of events
recorded with energy above 1020
eV
AGASA result (11)
propagation simulation (=2.6)
GZK suppression
DDM, Blasi, Olinto 2005

10
som
e A
GA
SA
sp
ect
raso
me A
GA
SA
sp
ect
ra
DDM, Blasi, Olinto 2005

11
high energy: HiReshigh energy: HiReswe simulated 10000 realizations of the HiRes statistics above 4·1019 eV (27 events) and we counted the number of events with energy above 1020 eV.
HiRes result (1)
no propagation, we used as template the AGASA measured spectrum, but for the HiRes statistics
301 realizations produced 1 or less events above 1020 eV
prob.: 3% — 2 the HiRes result
as well does not have a high
statistical significance
histogram of the number of events
recorded with energy above 1020
eV

12
no strong discrepancy
between AGASA and HiRes spectra
no strong discrepancy
between AGASA and HiRes spectra

13
Small Scale Anisotropies: what can
they tell us?
simulation of the propagation from
astrophysical point sources
Small Scale Anisotropies: what can
they tell us?
simulation of the propagation from
astrophysical point sources

14
AGASA 2pcf
AGASA 2pcf point sources (?)
see also Finley and Westerhoff 2003
DDM, Blasi, Olinto 2005

15
AGASA multipletsAGASA multiplets
B~<10-10 G resol.=2.5º
=2.6 m=0E > 4 1019 eV - 57 events
10-6 Mpc-3
10-5 Mpc-3 10-4 Mpc-3
DDM, Blasi 2004

16
sources characteristicssources characteristics
LCR = 6 1044 erg/yr/Mpc3 (E>1019 eV - from spectrum fits)
n0 = 10-5 Mpc-3 (from ssa)
Lsrc = 2 1042 erg/s (E>1019 eV)
are these ssa for real?•the significance of the AGASA result is not clear
•HiRes doesn’t see them•some internal inconsistency

17
P: 6 10-4 2 10-4
: 3.2 3.7
AGASA spectrumdiscrete sources
AGASA spectrumdiscrete sources
DDM, Blasi, Olinto 2005

18
arr
ival
dir
ect
ion
sarr
ival
dir
ect
ion
sP~2 10-5
DD
M, B
lasi
, O
linto
2005

19
both the ssa and the spectrum measurement
need more statistics to beconclusive and reliable
both the ssa and the spectrum measurement
need more statistics to beconclusive and reliable

20
Auger 2pcf
E>4 1019 eV
Auger 2pcf
E>4 1019 eV
10-6 Mpc-3
10-5 Mpc-3
10-4 Mpc-3
10-3 Mpc-3
cont.
DDM, Blasi, Olinto

21
Auger2pcfE>1020
eV
Auger2pcfE>1020
eV
10-6 Mpc-3
10-5 Mpc-3
10-4 Mpc-3
10-3 Mpc-3
cont.
DD
M,
Bla
si,
Olin
to

22
Auger spectrum
Auger spectrum
DDM, Blasi, Olinto

23
conclusionsconclusions
• AGASA & HiRes: statistics too low to reach conclusions on spectrum & ssa
• m & degeneracy: we need good composition measurements or other method to determine where the galcatic CRs end (ex: anisotropy)
• Auger should be able to shed light on some of these issues
• AGASA & HiRes: statistics too low to reach conclusions on spectrum & ssa
• m & degeneracy: we need good composition measurements or other method to determine where the galcatic CRs end (ex: anisotropy)
• Auger should be able to shed light on some of these issues


