Combined Effects of Persistent Organic Pollutants and Biological Variables on Vitamin D in Polar Bears Hege Mentzoni Grønning Environmental Toxicology and Chemistry Supervisor: Bjørn Munro Jenssen, IBI Department of Biology Submission date: February 2013 Norwegian University of Science and Technology
Transcript
Combined Effects of Persistent Organic Pollutants and Biological Variables on Vitamin D in Polar Bears
Hege Mentzoni Grønning
Environmental Toxicology and Chemistry
Supervisor: Bjørn Munro Jenssen, IBI
Department of Biology
Submission date: February 2013
Norwegian University of Science and Technology
III
Acknowledgements This master thesis was conducted at Department of Biology at the Norwegian University of Science and Technology (NTNU), and is part of the International Master Program in Environmental Toxicology and Chemistry. The thesis was written under supervision of Prof. Bjørn Munro Jenssen and Dr. Tomasz Ciesielski, both at the Department of Biology, NTNU. The thesis is a part of the International project BearHealth, and is financed by the Norwegian Research Council. The field work was carried out at Spitsbergen and Edgeøya, at Svalbard in 2008, by former PhD candidate Jenny Bytingsvik. The analysis of vitamin D and thyroid hormones (THs) were performed at NTNU, and the analysis of environmental contaminants at Laboratory of Environmental Toxicology at the Norwegian School of Veterinary Science (Oslo, Norway). First, I would like to thank my supervisors for their contribution of guidance, proofreading and enthusiasm, which has been greatly appreciated. Jenny Bytingsvik deserves special thanks for all her help with the data, and Bjørn Munro Jenssen for being supportive all the way. I am forever grateful for all his support and positivity. I would also like to thank the ”Ring of Fire”. Cathrine, Ingunn, Kari, Siri, Ingun, Thea, Amanda, Tone, Cathrine, Marianne and Kjersti: You have been great, and deeply missed the last months. My family deserves a big thanks for all their support and for helping with the kids in those times when exams were the most important things in my life. Finally I want to thank Petter. You have always been there for me and believed in me. Without you this would not have been possible. Thank you. Trondheim, February 2013
Hege Mentzoni Grønning
IV
Abstract
Because of long-range transport, the Arctic is chronically exposed to persistent organic
pollutants (POPs), such as polychlorinated biphenyls (PCBs), pesticides and brominated
flame retardants, such as polybrominated flame retardants (PBDEs). Because of POPs are
persistent and lipofilic, they are bioaccumulated in lipids and biomagnified in the food
chains. The structures of some POPs resemble endogenous hormones, and have been shown
to disrupt the TH homeostasis in animals. It has also been reported that POPs may affect the
levels of vitamin D in seals, and thereby possibly disturb the calcium homeostasis and bone
metabolism. The polar bear (Ursus maritimus) is a top predator in the Arctic and is exposed
to high levels of POPs through its diet. However, the polar bear has a very good capacity to
biotransform (metabolize) POPs, and because of the restrictions in the use of industrial
chemicals and pesticides, the levels of POPs in polar bears from Svalbard have decreased
during the last ten years. Still, polar bears have the potential to accumulate high levels of the
most persistent congeners of PCBs.
The aim of this study was to investigate the combined interactive influences of POPs and
thyroid hormones (THs: free T4 [FT4], total T4 [TT4], free T3 [FT3], total T3 [TT3]) on
1,25-dihydroxyvitamin D3 (1,25(OH)2D) in two groups of female polar bears in different
physiologic status, (females with cubs of the year [FWCOY] and females without cubs of the
year [FWOCOY]) and in males. Blood samples from eight FWCOY, 15 FWOCOY and 20
males were obtained from the population at Svalbard, Norway, in April and May of 2008.
Plasma concentrations of 1,25(OH)2D and THs were analysed by radioimmunoassay. Plasma
concentrations of POPs were analysed using gas chromatography-mass spectrophotometry
(GC-MS). Levels of 1,25(OH)2D, was examined in relation to contaminant load, biological
and environmental factors by the use of principle component analysis (PCA), orthogonal
projections to latent structures (OPLS) analysis, analysis of variance (ANOVA) and
Pearson´s and Spearman´s rank correlation tests.
V
Levels of 1,25(OH)2D did not differ significantly between the three groups of adult polar
bears. In FWCOY, both multivariate data analysis and bivariate correlation tests indicated
positive relationships between plasma levels of 1,25(OH)2D and plasma levels of THs (FT3,
FT3:TT3, FT4 and TT4), age and biometric variables (zygomatic width). Negative
relationships were indicated between levels of 1,25(OH)2D and two POPs (HCB and BDE-
153). For FWOCOY, there were indicated positive relationships between 1,25(OH)2D and
mainly OH-PCBs, but also PCBs, PBDEs and pesticides seemed to be positively related to
1,25(OH)2D levels. In contrast, one PBDE was negatively related to 1,25(OH)2D, but this
compund was suspected to have high background levels. Thus, this particular relationship
should be considered weak/semi-quantitative. None of the THs or the biometric variables
were related to 1,25(OH)2D levels in FWOCOY. However, it should be noted that in
FWOCOY, the OPLS model was relatively weak, with fairly low explained variance. In
males, both multivariate data analysis and bivariate correlation tests indicated positive
relationships between 1,25(OH)2D levels and THs (TT3 and TT4). Although in males the
multivariate data analysis indicated that several of the contaminant compounds and some of
the biometric variables were related to 1,25(OH)2D levels, the bivariate correlation tests did
not support that. It should also be noted that the OPLS model for males was weak, with low
explained variance and low predictability. Thus, for males, no final conclusion can be drawn
based on the model.
The results suggests possible vitamin D endocrine disrupting effects of mainly OH-PCBs on
the most active metabolite of vitamin D3, 1,25(OH)2D. The results also indicate that there
may be combined (interactive) effects of POPs and THs on plasma levels of 1,25(OH)2D in
polar bears. Because of the dominance of OH-PCBs in the plasma of both female and male
polar bears, and their known thyroid hormone disrupting effects, the potential disrupting
effects of OH-PCBs on the vitamin D endocrine system indicated in this thesis, suggest the
need for further research.
VI
Abbreviations AG Axillary girth ANOVA Analysis of variance BCI Body condition index BM Body mass CV Coefficient of Variation CV-ANOVA Cross validated analysis of variance DDE Dichlorodiphenyldichloroethylene DDT Dichlorodiphenyltrichloroethane df Degrees of freedom EDC Endocrine disrupting chemicals FT3 Free triiodothyronine FT4 Free thyroxine FWCOY Females with cubs of the year FWOCOY Females without cubs of the year GC Gas chromatograph HCB Hexachlorobenzene HCH Hexachlorocyclohexane HL Head length HPT Hypothalamic-pituitary-thyroid axis ID Identification number IUPAC International Union of Pure and Applied Chemistry LOD Limit of detection MS Mass spectrometer N Number of observations NTNU Norwegian University of Science and Technology OH-PCBs Hydroxylated polychlorinated biphenyls OPLS Orthogonal projection to latent structures
VII
p Probability of rejecting the hypothesis PBDEs Polybrominated diphenyl ethers PC Principal component PCA Principal component analysis PCBs Polychlorinated biphenyls PLS Projection to latent structures POPs Persistent organic pollutants Q2 Goodness of prediction coefficient r Correlation coefficient RIA Radioimmunoassay R2X Explained variance R2Y Goodness of fit, correlation coefficient RPM Rounds per minute SD Standard deviation SL Straight length TBM Total body mass TH Thyroid hormone TT3 Total triiodothyronine TT4 Total thyroxine TSH Thyroid stimulating hormone UV Unit variance VIP Variables importance in projections w.w Wet weight ZW Zygomatic width 1,25(OH)2D 1,25-dihydroxyvitamin D3 (calcitriol) 25(OH)D3 25-hydroxyvitamin D3 (calcifediol)
2.3.1. Vitamin D analysis…………………...……………………………………...10. 2.3.2. TH analysis……………………………………………………………..……11.
2.4. Statistical methods…………………………………………….……………………11. 2.4.1. Principal component analysis (PCA)………………………………………..12. 2.4.2. Orthogonal projections to latent structures regression (OPLS)…..………....13.
3. Results………………………………………………………………………….…….…15.
3.1. Biological variables……………………………………………….……..…………15. 3.2. Vitamin D and thyroid hormone levels……..………...……………………………16. 3.3. Prevalence and levels of contaminants…..……………………………….….…......20. 3.4. Relationships between vitamin D levels, biometric variables,
THs and POPs………………………………………………………………………25. 3.4.1. Females with cubs of the year, FWCOY…………………………………….25. 3.4.2. Females without cubs of the year, FWOCOY………...………………….….31. 3.4.3. Males………………………………………………………………………...37.
IX
4. Discussion……………………………………………………………………………….42. 4.1. Levels of vitamin D…………………………………………………………..……..42. 4.2. Thyroid hormone levels……………………………………………………….……43. 4.3. Prevalence and patterns of POPs…………………………………………………...45. 4.4. Effects of POPs, THs and biometric variables on vitamin D….……………………47.
5. Conclusion………………………………………………………………………………51. Appendices 58. A Sampling information 59. B Individual biometric measurement 60. C Individual 1,25(OH)2D concentrations 61. D Individual Thyroid hormone concentrations 62. E Thyroid concentrations with significant differences between groups 63. F Contaminant concentrations with significant differences between groups 64.
1
1. Introduction Due to long-range transportation with air and ocean currents, persistent organic pollutants
(POPs) such as polychlorinated biphenyls (PCBs) and others, biomagnify in the Arctic
marine foodweb (Bustnes et al., 2010). As a result of their physiochemical properties, the
POPs are resistant to biodegradation and will accumulate in wildlife (AMAP, 1998, Wania &
Mackay, 1995). The Arctic wildlife is exposed to varying levels of natural stress due to the
fluctuating external conditions (e.g. temperature, food-availability, sea-ice contidions). There
has been detected high levels of POPs in the polar bear (Ursus maritimus) at Svalbard
(Bernhoft et al., 1997). Thus, in addition to natural stress, polar bears are affected by
anthropogenic stressors, such as POPs (Bustnes et al., 2008, Jenssen, 2006).
1.1 Persistent organic pollutants
POPs are mainly manufactured chemicals (e.g. PCBs), byproducts of industrial processes
(e.g. hexachlorobenzene (HCB)), or pesticides (e.g. dichlorodiphenyltrichloroethanes (DDT),
chlordane) (de March et al., 1998). There have been a decreasing trend in levels of legacy
POPs in the Arctic biota during the last decade, a result of restrictions in production and use
of industrial chemicals and pesticides from the 1970s up to now (Braune et al., 2005, Bustnes
et al., 2010). However, it should be noted that several novel classes of POPs, such as
brominated flame retardants (BFRs) and perflouralkyl substances (PFASs), are detected in
increasing levels in Arctic biota (de Wit et al., 2010). Since POPs have toxic and endocrine
disruptive effects (Jones & De Voogt, 1999, Letcher et al., 2010), there is an increasing
concern about the effects of these compounds on the health of Arctic wildlife.
Although POPs are diverse with respect to their chemical structures, most of them have some
elements in common, such as halogenated aromatic or aliphatic rings. They also share some
typical physiochemical properties, like that they are highly lipophile, have relatively low
2
vapor pressure, that means they are semi-volatile, and they are resistant to biodegradation
(AMAP, 1998, Borgå et al., 2004, Diamanti-Kandarakis et al., 2009). This explains why
POPs are found in the Arctic, far away from the production or emission sources. Their
lipophilicity and resistance to biodegradation make them bioaccumulate in Arctic animals,
that generally have high lipid contents, such as seals, and POPs follow the lipid transfer from
prey to consumer, a process called biomagnification (Borgå et al., 2004, de March et al.,
1998). This, in addition to several biological factors such as trophic position, age, condition,
body size, and seasonality, which also may affect the bioaccumulation and trophic transfer of
POPs in the Arctic marine food web, leads to high concentrations in long-lived animals on
top of the food chain, such as polar bears and glaucous gulls (Larus hyperboreus) (Borgå et
al., 2004, Hop et al., 2002, Kelly et al., 2007, Letcher et al., 2010).
Polar bears are particularly vulnerable because their diet consist mainly of seal blubber, and
especially the highly chlorinated PCBs are found to accumulate in polar bears and
particularly in males (Bernhoft et al., 1997, Letcher et al., 1998). However, food web
magnification depends on the individual species ability to biotransform POPs to more
hydrophilic compounds, which are more readily eliminated (Hop et al., 2002, Kelly et al.,
2007). Adult polar bears have an effective cytochrome P450 system and can therefore
metabolize many of the POPs they ingest from their diet, such as most of the PCB congeners
and DDT and its metabolites. The most persistent congeners of PCB can nevertheless reach
very high concentrations (Bernhoft et al., 1997, Letcher et al., 1998).
1.2 Endocrine disruption
The ability that some POPs have to interfere with the endogenous hormone system in
organisms is a process called endocrine disruption. Especially the conflict between POPs and
the sex hormones or the thyroid hormones (THs) has received considerable attention the
recent years (Diamanti-Kandarakis et al., 2009). Endocrine disrupting chemicals (EDCs) are
chemicals that may bind to, or block, hormone receptors, alter synthesis, transport, or the
metabolism of hormones, or interfere with signalling pathways of the hypothalamus-
pituitary-endocrine gland axis (Dawson, 2000). The result of EDC activity is a change in the
hormonal system that may disrupt the organisms ability to communicate with, and respond to
its environment (Diamanti-Kandarakis et al., 2009).
3
It is also suggested that POPs can cause adverse effects on vitamin status, immune system,
organ morphology and behaviour (Haave et al., 2003, Murvoll et al., 2005, Olsen et al., 2003,
Routti et al., 2008, Skaare et al., 2001, Wiig et al., 1998).
1.2.1 Vitamin D
The vitamin D endocrine system plays an essential role in calcium homeostasis and bone
metabolism. Cholecalciferol, or vitamin D3, which is categorized as a hormone rather than a
vitamin (Horst et al., 2005), is either absorbed in the intestine from dietary uptake, or
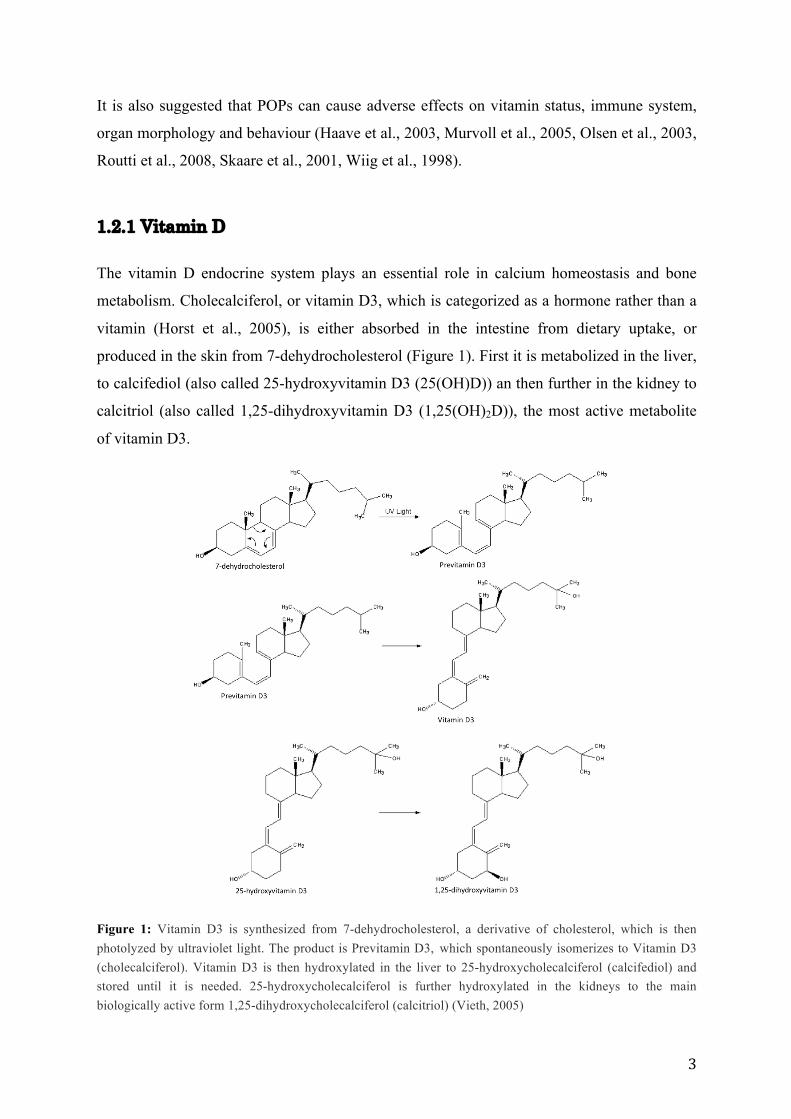
produced in the skin from 7-dehydrocholesterol (Figure 1). First it is metabolized in the liver,
to calcifediol (also called 25-hydroxyvitamin D3 (25(OH)D)) an then further in the kidney to
calcitriol (also called 1,25-dihydroxyvitamin D3 (1,25(OH)2D)), the most active metabolite
of vitamin D3.
Figure 1: Vitamin D3 is synthesized from 7-dehydrocholesterol, a derivative of cholesterol, which is then photolyzed by ultraviolet light. The product is Previtamin D3, which spontaneously isomerizes to Vitamin D3 (cholecalciferol). Vitamin D3 is then hydroxylated in the liver to 25-hydroxycholecalciferol (calcifediol) and stored until it is needed. 25-hydroxycholecalciferol is further hydroxylated in the kidneys to the main biologically active form 1,25-dihydroxycholecalciferol (calcitriol) (Vieth, 2005)
4
Together with parathyroid hormone and calcitonin, 1,25(OH)2D plays a major role in
regulating serum calcium homeostasis (Vieth, 2005). A physiological level of 1,25(OH)2D
stimulates intestinal absorption and renal reabsorption of calcium and phosphate, which
further stimulates bone mineralization (Yasuda et al., 2005). Low levels of 1,25(OH)2D may
therefore cause disruption of bone mineralization (Baylink et al., 1970, Faibish & Boskey,
2005). In a study conducted on Baltic grey seals (Halichoerus grypus), high levels of POPs
were associated with deficiencies in bone structure, such as scull lesions (Bergman et al.,
1992) and decreased bone density (Lind et al., 2003). Sonne et al (2006) also reported
negative relationships between POPs and testis lenght and baculum bone mineral densities in
male polar bears from East Greenland, and also between POPs and ovary lenght/weight and
uterine horn lenght in females, which might pose a risk to the population regarding
reproduction. Few studies have investigated contaminant effects on the vitamin D status, but
in one study conducted with PCB-exposed rodents (Lilienthal et al., 2000), decreased levels
of vitamin D3 metabolites were detected. Therefore it is possible that the bone disorders
observed in seals and polar bears may be related to POP-induced effects on vitamin D
homeostasis. According to another study by Routti et al. (2008), bone-related parameters and
thyroid homeostasis may be disturbed by contaminants, because they might depress
circulating 1,25(OH)2D levels; however 1,25(OH)2D deficiency could be compensated for by
elevated TH levels to maintain serum calcium concentration (Mohan et al., 2004, Routti et
al., 2008).
1.2.2 Thyroid hormones
All vertebrates are dependent on an appropriate production and function of thyroid hormones
(THs) to achieve a normal development and physiological function (Yen & Chin, 1994). In
mammals the THs control the thermoregulation, body mass, growth, lipid metabolism,
reproduction, and secondary sex characteristics (Merryman & Buckles, 1998). The structure
and mechanism by which THs are synthesized are the same among vertebrate species. The
thyroid gland which is part of the hypothalamic-pituitary-thyroid axis (HPT), produces and
releases thyroxine (T4), when stimulated by thyroid stimulating hormone (TSH), released
from the pituitary. Further T4 is deiodinized mainly in the liver to triiodothyronine (T3), the
most active TH (McNabb, 1992). Most of the circulating THs are associated with binding
proteins. Several environmental contaminants have a high degree of structural similarity to
the THs, and may interfere with the binding of THs to receptors or transport proteins, the
5
metabolism of THs, or affect the biosynthesis (Boas et al., 2006, Diamanti-Kandarakis et al.,
2009, Routti et al., 2008, Zoeller, 2007). Several interactions have been discovered among
toxic chemicals and the thyroid hormone system. The reported effects have been abnormal
thyroid gland structure and altered levels of THs after exposure to POPs or their metabolites.
The effects have been observed in a number of species (e.g. glaucous gulls (Verreault et al.,
2004, Verreault et al., 2007), polar bears (Braathen et al., 2004, Skaare et al., 2001), gray seal
pups (Sørmo et al., 2005) and rodents (Kato et al., 2010)).
1.3 The polar bears
The polar bear is the top predator in the Arctic food web. Their diet consist mainly of ringed
seal (Phoca hispida), but also of bearded seal (Erignathus barbatus) and harp seal (Phoca
groenlandicus) (Derocher et al., 2002). As their diet is lipid rich because of their large
consumption of seal blubber, concern exist of potential health effects due to long-life
exposure to high concentrations of POPs (Braathen et al., 2004, Bytingsvik et al., 2012,
Oskam et al., 2003). Possible disturbances in thyroid hormone homeostasis have been
reported in polar bears from Svalbard (Braathen et al., 2004). There is also concern about the
possible reproductive effects in polar bears, due to reported negative correlations between
environmental contaminants and sex hormones found in both male (Oskam et al., 2003) and
female polar bears (Haave et al., 2003) at Svalbard. Furthermore possible effects on polar
bears immune and vitamin system have been reported (Lie et al., 2004, Skaare et al., 2001). It
is reasonable to believe that male polar bears will achieve higher levels of persistent
contaminants than females with age, due to maternal transfer of lipophilic compounds from
mother to offspring during lactation (Bernhoft et al., 1997, Bytingsvik et al., 2012).
1.4 Objectives
The main objectives of the study was to examine if the levels and prevalence of POPs (PCBs,
hydroxylated PCB metabolites, pesticides and PBDEs), biometric variables, environmental
(capture location) variables and TH variables were associated with levels of 1,25(OH)2D in
three groups of adult polar bears; females with cubs of the year (FWCOY), females without
cubs of the year (FWOCOY) and males. It is hypothesized that there are associations between
plasma concentrations of POPs and that there are interactions between plasma concentrations
6
of POPs, biometric variables, environmental variables and THs, and 1,25(OH)2D. Thus, the
aim was to examine effects on 1,25(OH)2D, caused by either single POP compounds, or by
their combined effects, or by interactions between POPs, biometric and environmental factors
and THs.
7
2. Materials and methods 2.1 Sampling
In April 2008, blood samples were collected from 43 polar bears at Spitsbergen and Edgeøya
(76.72 – 80.62° N, 12.10 – 23.70° E) at Svalbard, Norway. Blood were sampled from the
femoral vein of eight females with cubs of the year (FWCOY), 15 females without cubs of
the year (FWOCOY) and 20 male polar bears.
The polar bears were sedated by the remote injection of a dart (Palmer Cap-Chur Equipment,
Douglasville, Georgia) filled with Zoletil® (200 mg/mL; Virbac Laboratories, Carros,
France), fired from a helicopter. The individual amount of drug was determined based on an
estimation of the bears bodyweight observed from the helicopter (5-10 mg/kg body mass).
The blood was collected into heparinised Venoject® tubes (10 mL, Thermo Electron
Corporation, Belgium) and separated into plasma and blood cells by centrifugation (3500
rpm, 10 min) within 8 h after sampling. Plasma samples were transferred to cryogenic vials
and stored at – 20 °C in the field and then (after approximately four weeks) at – 70 °C in the
lab freezer until analysis. Capture and handling procedures followed standard protocols
(Derocher & Wiig, 2002, Stirling et al., 1989) and were approved by the National Animal
Research Authority (The National Animal Research Authority (NARA), Oslo, Norway).
After sedation, a selection of morphometric variabes, representing the bears body size and
head size were collected. Straight lenght (SL), head lenght (HL), zygomatic width (ZW) and
axillary girth (AG) were measured in all bears. Body mass (BM) was estimated based on SL
and AG using a morphometric equation (Derocher & Wiig, 2002) before further recalculation
into body condition index (BCI) using a BCI equation developed for polar bears (Cattet et al.,
2002). For some of the bears, age was known because they had been caught previously. For
the remaining ones, age was estimated by counting annual growth layers in the cementum of
an extracted vestigial premolar (Calvert & Ramsay, 1998, Christensen-Dalsgaard et al.,
2010).
8
Detailed information on sampling coordinates and age for the three groups are listed in Table
A.1 (Appendix A).
2.2 Contaminant analysis
The analysis of organochlorinated and brominated compounds: chlorinated pesticides,
PCBs, OH-PCBs and PBDEs, were performed at the Laboratory of Environmental
Toxicology at the Norwegian School of Veterinary Science (Oslo, Norway) using gas
chromatography-mass spectrophotometry (GC-MS).
The polar bear plasma samples were quantified for the compounds presented in Table 1. The
method used for extraction, clean up, analyses and information on quality assurance of PCBs
and OH-PCBs is described by Bytingsvik et al. (2012) based on the method originally
described by Brevik (1978). It should be noted that 4´OH-CB130 and 4´OH-CB-172 were
detected in > 60 and 70 % of the individuals, respectively, but they both co-eluted with other
OH-PCB isomers. Nevertheless, the results on these two compounds were included in the
analysis. Methods used for extraction, clean up, analyses and quality control of PBDEs and
chlorinated pesticides are described elsewere (Murvoll et al., 2005, Murvoll et al., 2006,
Sørmo et al., 2006, Villanger, 2011). Briefly, the extracted samples were analysed for five
PBDEs (i.e. BDE-47, -153, -154, -183 and -209) using a GC-MS. Limits of detection (LOD)
for individual compounds were determined as three times the noise level. The detection limit
for PBDEs were 0.02 ng/g wet weight (w.w). The concentrations of BDE-153, -183 and -209
were suspected to have high background levels, but results on these were nevertheless
included in the analysis. Methods used for extraction, clean up, analyses and quality control
of chlorinated pesticides are described elsewere (Miljeteig et al., 2009). Briefly, the extract
samples were analysed for eight chlorinated pesticides (i.e. oxychlordane, trans-nonachlor,
mirex, HCB, α-HCH, β-HCH, p,p,´-DDT and p,p,´-DDE) using a GC-MS. Limit of detection
for individual compounds were determined as three times the baseline noise level. The
detection limit for chlorinated pesticides ranged from 0.12-0.68 ng/g w.w. Plasma levels of
contaminants are expressed as nmol/L.
9
Table 1: The organochlorinated and brominated contaminants and chlorinated pesticides analysed in plasma from polar bear (Ursus maritimus) at Svalbard. The abbreviation and IUPAC nomenclature are given.
ANOVA was used to test for between-group differences in contaminant compounds and
groups, TH, 1,25(OH)2D, cholesterol and lipid content (%). Correlations between
1,25(OH)2D, THs, POPs and biometric variables were tested using Pearson`s correlation test
(two-tailed) and Spearman`s rank correlation test (two-tailed), depending on whether the data
was normally distributed or not, respectively. In the variables analysed, some of the non-
detected values were replaced with random values below the limit of detection (LOD) of the
chemical. This was applied for the following variables: α-HCH, p,p´-DDT, PCB-74, -101, -
114, -128, -167, TT4 and FT3.
2.4.1 Principal component analysis (PCA)
In Simca P12+ (Umetrics, Umeå, Sweden) intercorrelations between variables were
investigated using principle component analysis (PCA). The main goal was to investigate if
the plasma 1,25(OH)2D levels in the three groups of polar bears were correlated to biometric
variables, THs or POP concentrations. In a PCA plot, the included variables are transformed
to a dataset of uncorrelated variables orthogonally projected on each other, termed principle
components (PCs), that explains the variance in the dataset. R2 describes the degree of fit in
the model (explained variance) and Q2 describes the predictive ability of the model (predicted
variance) (Eriksson et al., 2006). The variables were unit variance (UV) scaled, so that their
13
contribution to the final model is equal, independent of their original values. This is
important in datasets were the numerical values for variables vary on a great scale. Mean-
centering was also performed on the data to increase the models interpretability (the mean-
value is substracted) (Eriksson et al., 2006). A critical validation of the PCA is essential. This
is performed with respect to explained variance of each of the PCs and the models goodness
of prediction. Significant PCs have eigenvalues > 1. Σconcentrations of the contaminant
groups were not included in the PCA, this to avoid strong covariations.
2.4.2 Orthogonal projection to latent structures regression (OPLS)
Orthogonal projections to latent structures (OPLS) regression can be performed when the
explanatory variables show a high degree of multicolinearity, such as in the present dataset,
by using Simca P12+. OPLS is a statistical tool designed to perform multiple regression
when somehow the number of observations are limited and when there is a high degree of
colinearity.
The OPLS method can assess the relationship (positive or negative) between 1,25(OH)2D and
the most important predictor variables, and may thus identify combined effects of different
POP compounds and biometric, environmental and TH variables on 1,25(OH)2D. Therefore,
the OPLS complements the statistical series and may detect relationships when several
explanatory variables affect the models, which is not displayed by PCA or a bivariate test.
The indications from the PCA and correlation test were used to optimize the OPLS model.
This, by removing some of the variables of low importance, i.e., with small regression
coefficients and low VIP values, to see if significant OPLS regression models could be
obtained for 1,25(OH)2D (Wold et al., 2001).
The OPLS and PLS is a better tool than multiple regression when handling data with a high
degree of colinearity and noise in X and Y matrix, according to Trygg and Wold (2002). The
OPLS differs from its precursor PLS, in that an OPLS separates the variation in predictor
variable X into variation which is correlating and non-correlating (orthogonal[90°]) with the
variation in response variable Y. An OPLS is critical validated with respect to R2X (explained
variance) and R2Y (goodness of fit), and a high goodness of prediction (Q2) is essential. R2Y
> 0.7 and a Q2 > 0.4 denote highly significant models when analyzing biological data
14
(Lundstedt et al., 1998). “Variable importance in projection” (VIP) plots denote the
importance of each X variable in the predicted model and rank them in their explanatory
power of Y. Combined with coefficient plots with jack-knifed confidence intervals, one can
identify both the important and significant model predictors. VIP values > 1 is the most
relevant variables explaining the Y. An “Analysis of variance of the cross-validated residuals”
(CV-ANOVA) tests the significance of the OPLS regression.
A multiple linear regression was performed between 1,25(OH)2D and some of the most
correlated variables. This was performed in the default enter method in SPSS to examine the
possible multicolinearity. The aim for the OPLS and multiple regressions was to investigate
the combined effects from POPs, biometric, environmental and TH variables on 1,25(OH)2D.
15
3. Results
3.1 Biometric variables
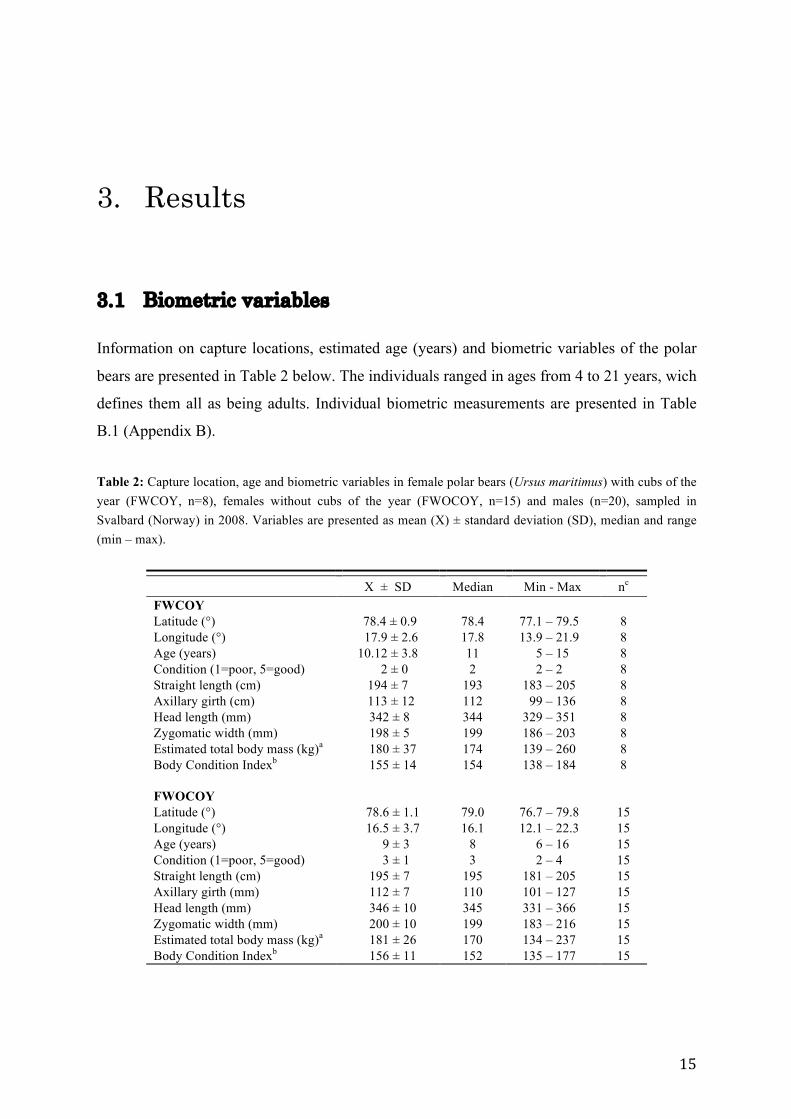
Information on capture locations, estimated age (years) and biometric variables of the polar
bears are presented in Table 2 below. The individuals ranged in ages from 4 to 21 years, wich
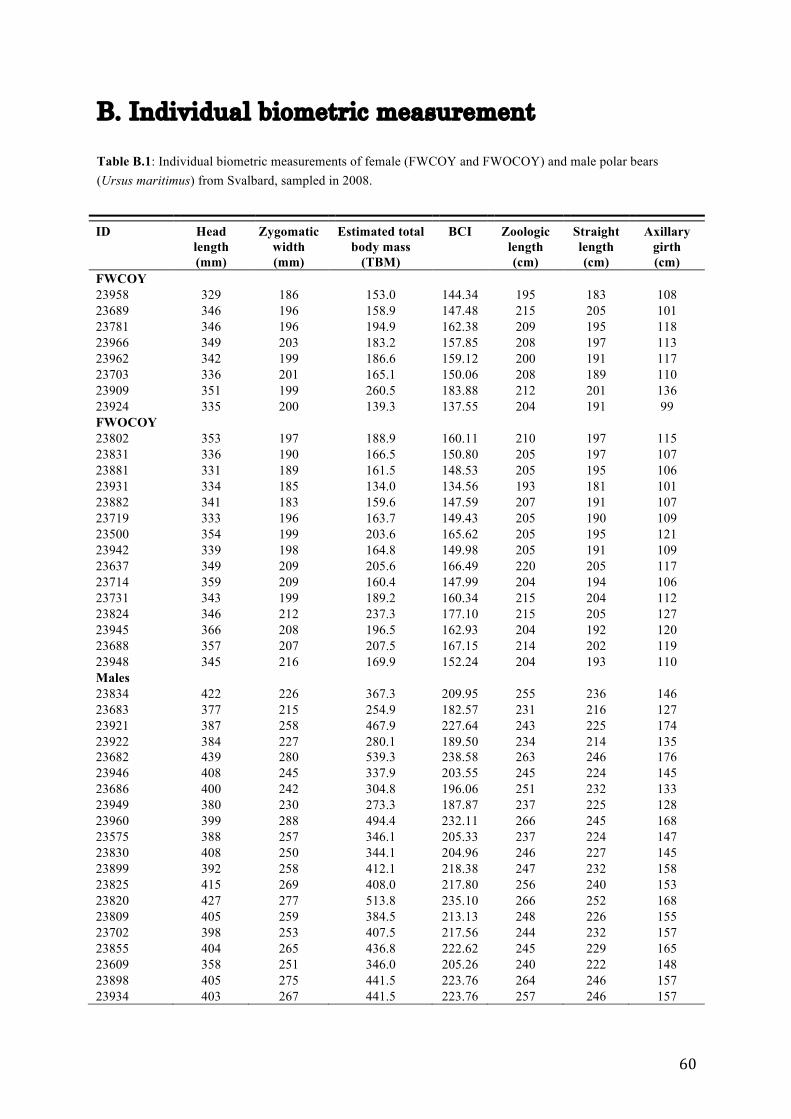
defines them all as being adults. Individual biometric measurements are presented in Table
B.1 (Appendix B).
Table 2: Capture location, age and biometric variables in female polar bears (Ursus maritimus) with cubs of the year (FWCOY, n=8), females without cubs of the year (FWOCOY, n=15) and males (n=20), sampled in Svalbard (Norway) in 2008. Variables are presented as mean (X) ± standard deviation (SD), median and range (min – max).
a Estimated total body mass (BM) of the polar bears is based on the following equation: BM = 0.00003377 * axillary girth1.7515 * straight length1.3678 (Derocher & Wiig, 2002). b Body Condition Index (BCI) of the polar bears were estimated based on the following equation: BCI = (ln body mass – 3.07 * ln straight length + 10.76)/(0.17 + 0.009 * ln straight length= (Cattet et al., 2002). ln = natural logarithm. c Number of observations
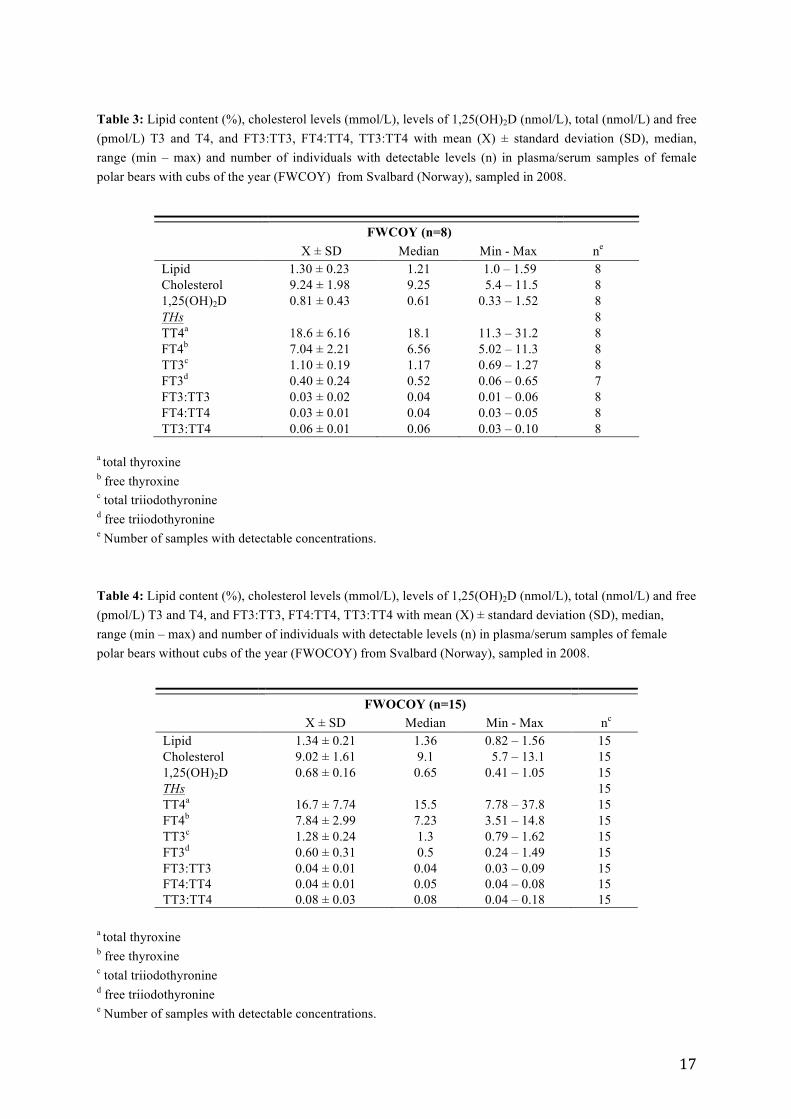
3.2 Vitamin D and thyroid hormone levels
The serum levels of 1,25(OH)2D, thyroid hormones, cholesterol and lipid content in the three
groups are presented in Table 3 (FWCOY), Table 4 (FWOCOY) and Table 5 (males).
There were no significant difference in the 1,25(OH)2D levels between the three groups
(Table 6: ANOVA; p > 0.05). The average 1,25(OH)2D levels found in the current study was
0.81 nmol/L in FWCOY, 0.68 nmol/L in FWOCOY and 0.56 nmol/L in males, with a
standard deviation of 0.43 nmol/L, 0.16 nmol/L and 0.23 nmol/L, respectively (Table 3, 4
and 5). Individual levels of serum 1,25(OH)2D are presented in Table C.1 (Appendix C).
For thyroid hormones, levels of T4 dominated over levels of T3 in all individuals, both for
the bound and free fractions (Table 3, 4 and 5). Individual thyroid hormone levels are
presented in Table D.1 (Appendix D).
17
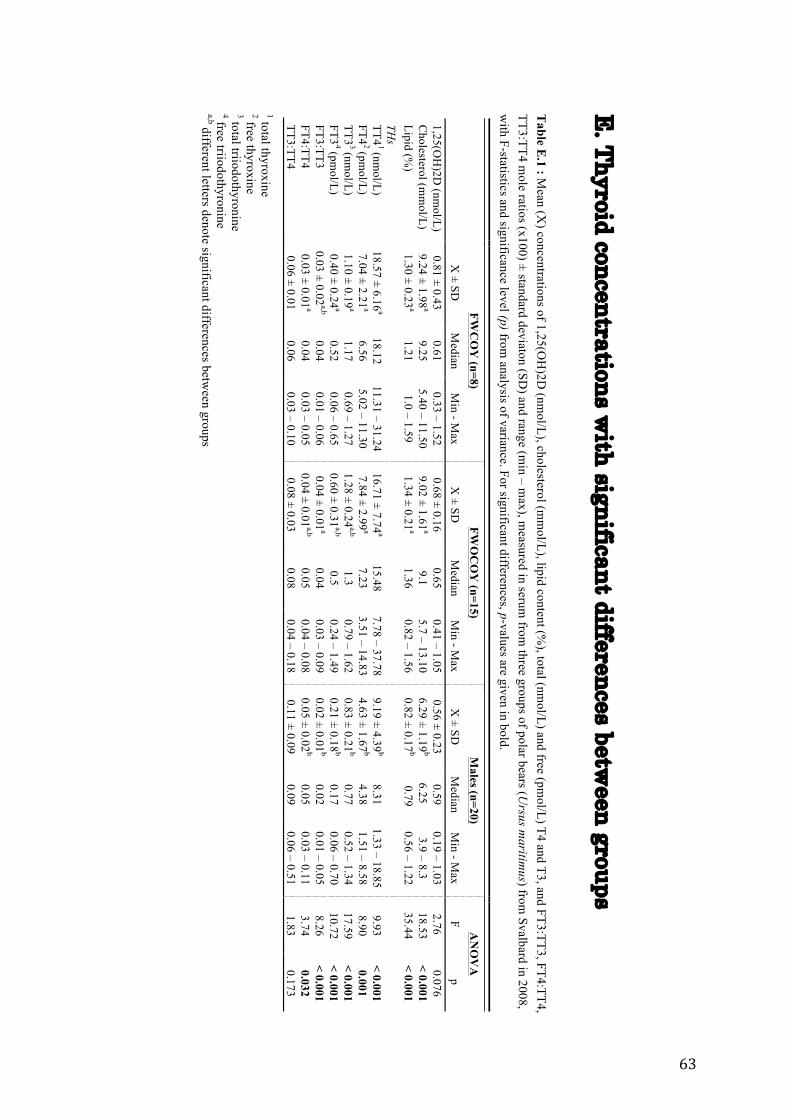
Table 3: Lipid content (%), cholesterol levels (mmol/L), levels of 1,25(OH)2D (nmol/L), total (nmol/L) and free (pmol/L) T3 and T4, and FT3:TT3, FT4:TT4, TT3:TT4 with mean (X) ± standard deviation (SD), median, range (min – max) and number of individuals with detectable levels (n) in plasma/serum samples of female polar bears with cubs of the year (FWCOY) from Svalbard (Norway), sampled in 2008.
a total thyroxine b free thyroxine c total triiodothyronine d free triiodothyronine e Number of samples with detectable concentrations. Table 4: Lipid content (%), cholesterol levels (mmol/L), levels of 1,25(OH)2D (nmol/L), total (nmol/L) and free (pmol/L) T3 and T4, and FT3:TT3, FT4:TT4, TT3:TT4 with mean (X) ± standard deviation (SD), median, range (min – max) and number of individuals with detectable levels (n) in plasma/serum samples of female polar bears without cubs of the year (FWOCOY) from Svalbard (Norway), sampled in 2008.
a total thyroxine b free thyroxine c total triiodothyronine d free triiodothyronine e Number of samples with detectable concentrations.
18
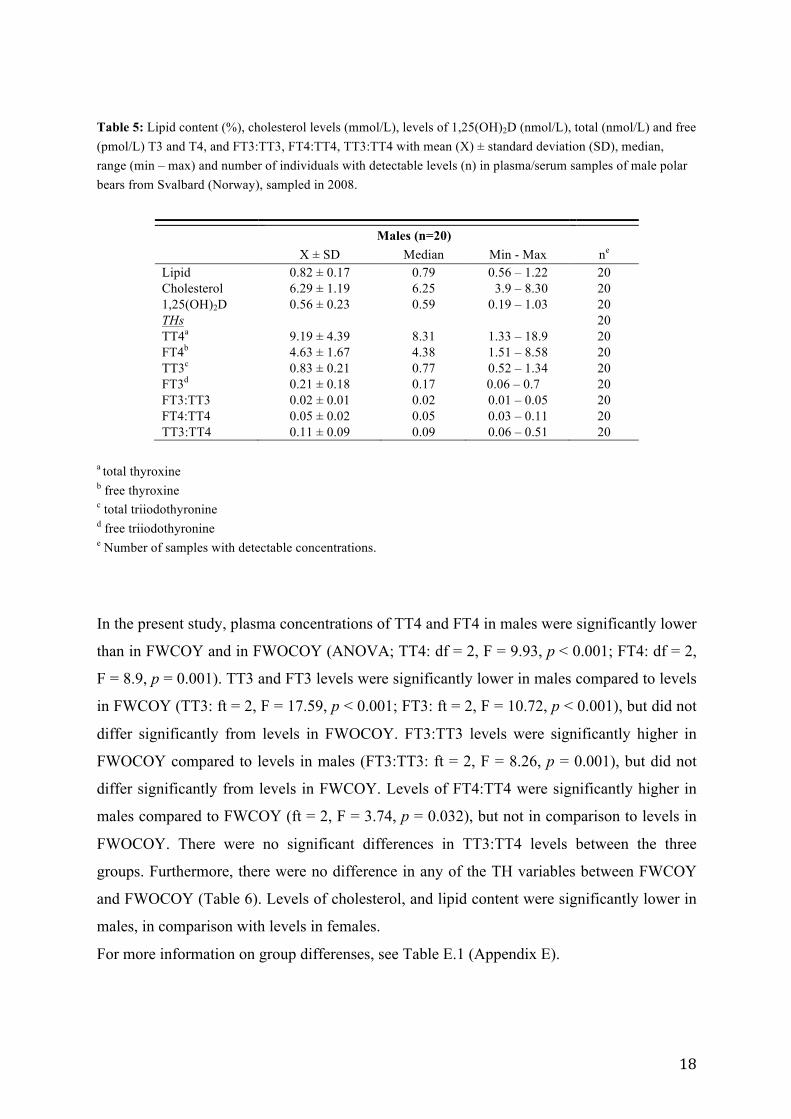
Table 5: Lipid content (%), cholesterol levels (mmol/L), levels of 1,25(OH)2D (nmol/L), total (nmol/L) and free (pmol/L) T3 and T4, and FT3:TT3, FT4:TT4, TT3:TT4 with mean (X) ± standard deviation (SD), median, range (min – max) and number of individuals with detectable levels (n) in plasma/serum samples of male polar bears from Svalbard (Norway), sampled in 2008.
a total thyroxine b free thyroxine c total triiodothyronine d free triiodothyronine e Number of samples with detectable concentrations.
In the present study, plasma concentrations of TT4 and FT4 in males were significantly lower
than in FWCOY and in FWOCOY (ANOVA; TT4: df = 2, F = 9.93, p < 0.001; FT4: df = 2,
F = 8.9, p = 0.001). TT3 and FT3 levels were significantly lower in males compared to levels
in FWCOY (TT3: ft = 2, F = 17.59, p < 0.001; FT3: ft = 2, F = 10.72, p < 0.001), but did not
differ significantly from levels in FWOCOY. FT3:TT3 levels were significantly higher in
FWOCOY compared to levels in males (FT3:TT3: ft = 2, F = 8.26, p = 0.001), but did not
differ significantly from levels in FWCOY. Levels of FT4:TT4 were significantly higher in
males compared to FWCOY (ft = 2, F = 3.74, p = 0.032), but not in comparison to levels in
FWOCOY. There were no significant differences in TT3:TT4 levels between the three
groups. Furthermore, there were no difference in any of the TH variables between FWCOY
and FWOCOY (Table 6). Levels of cholesterol, and lipid content were significantly lower in
males, in comparison with levels in females.
For more information on group differenses, see Table E.1 (Appendix E).
19
Table 6. Statistical differences between levels of 1,25(OH)2D (nmol/L), cholesterol (mmol/L), lipid content (%), and total (nmol/L) and free (pmol/L) T4 and T3 in plasma of polar bears (FWCOY, FWOCOY and males) sampled in Svalbard (Norway) in 2008, given as F-statistics and significance level (p) from analysis of variance. For significant differences p-values are given in bold.
a total thyroxine b free thyroxine c total triiodothyronine d free triiodothyronine
20
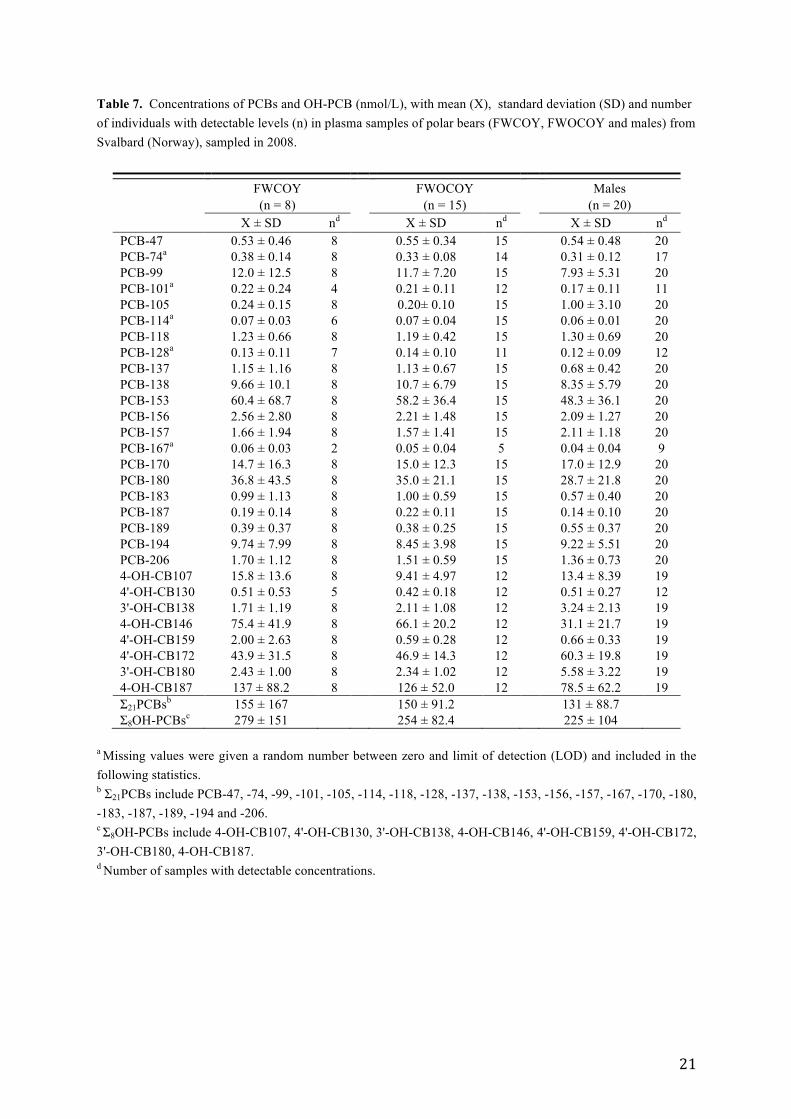
3.3 Prevalence and levels of contaminants
The results of analysis are given in Table 7 (PCBs, OH-PCBs), Table 8 (chlorinated
pesticides) and Table 9 (PBDEs). Forty-two contaminants were analysed, and PCBs and
chlorinated pesticides were quantified in 100 % of the individuals. OH-PCBs and PBDEs
were quantified in 60 % or more, of the individuals in the three groups of polar bears. 4'-OH-
CB130 were not detected in 3 (37.5 %) of FWCOY, and was only detected in 12 (60 %) of
the male individuals. For the PBDEs, BDE-47 and BDE-153 were detected in 7 (87.5 %) and
6 (75 %) of FWCOY, respectively. BDE-153 was detected in 14 (93.3 %) of the FWOCOY.
For males, BDE-153, BDE-183 and BDE-209 were all detected in 19 (95 %) of the male
individuals. The contaminant group that were present in the highest concentration in the
plasma samples of female and male polar bears were, in decreasing order, Σ8OH-PCBs >
Σ21PCBs > Σ8pesticides > Σ5PBDEs. Σ8OH-PCBs was almost 2 times higher than Σ21PCBs,
and amost 7 times higher than Σ8pesticides (FWCOY and FWOCOY), while Σ8OH-PCBs
was 17 times higher than Σ8pesticides in males. The most prevalent congener of Σ8OH-PCBs
in plasma of all three polar bear groups were 4-OH-CB187, which constituted 49.6 %, 49.3
%, and 35.0 % of the total Σ8OH-PCBs in FWOCOY, FWCOY and males, respectively. The
Σ21PCBs was the second largest contaminant group, of which PCB-153 was the most
prevalent congener, constituting 39.0 %, 38.8 %, and 37.0 % of the Σ21PCBs in FWCOY,
FWOCOY and males, respectively. The plasma concentrations of pesticides and PBDEs (i.e
Σ8pesticides, Σ5PBDEs) were low as compared to the concentrations of Σ8OH-PCBs and
Σ21PCBs, and contributed in sum with < 1.6 % of the total contaminant burden, for all three
polar bear groups.
21
Table 7. Concentrations of PCBs and OH-PCB (nmol/L), with mean (X), standard deviation (SD) and number of individuals with detectable levels (n) in plasma samples of polar bears (FWCOY, FWOCOY and males) from Svalbard (Norway), sampled in 2008.
a Missing values were given a random number between zero and limit of detection (LOD) and included in the following statistics. b Σ21PCBs include PCB-47, -74, -99, -101, -105, -114, -118, -128, -137, -138, -153, -156, -157, -167, -170, -180, -183, -187, -189, -194 and -206. c Σ8OH-PCBs include 4-OH-CB107, 4'-OH-CB130, 3'-OH-CB138, 4-OH-CB146, 4'-OH-CB159, 4'-OH-CB172, 3'-OH-CB180, 4-OH-CB187. d Number of samples with detectable concentrations.
22
Table 8. Concentrations of chlorinated pesticides (nmol/L), with mean (X), standard deviation (SD) and number of individuals with detectable levels (n) in plasma samples of polar bears (FWCOY, FWOCOY and males) from Svalbard (Norway), sampled in 2008.
a Pesticides with missing values were given a random number between zero and limit of detection (LOD) and included in the following statistics. b Σ8 pesticides include HCB, α-HCH, β-HCH, oxychlordane, trans-nonachlor, mirex, p,p'-DDE and p,p'-DDT. c Number of samples with detectable concentrations.
Table 9. Concentrations of polybrominated diphenyl ethers (PBDEs) (nmol/L), with mean (X), standard deviation (SD) and number of individuals with detectable levels (n) in plasma samples of polar bears (FWCOY, FWOCOY and males) from Svalbard (Norway), sampled in 2008.
FWCOY FWOCOY Males (n = 8) (n = 15) (n = 20) Mean ± SD nc Mean ± SD nc Mean ± SD nc BDE-47 0.49 ± 0.31 7
a Detected concentrations are close to the detection limit. b Σ5PBDEs include BDE-47, BDE-153, BDE-154, BDE-183 and BDE-209. c Number of samples with detectable concentrations.
23
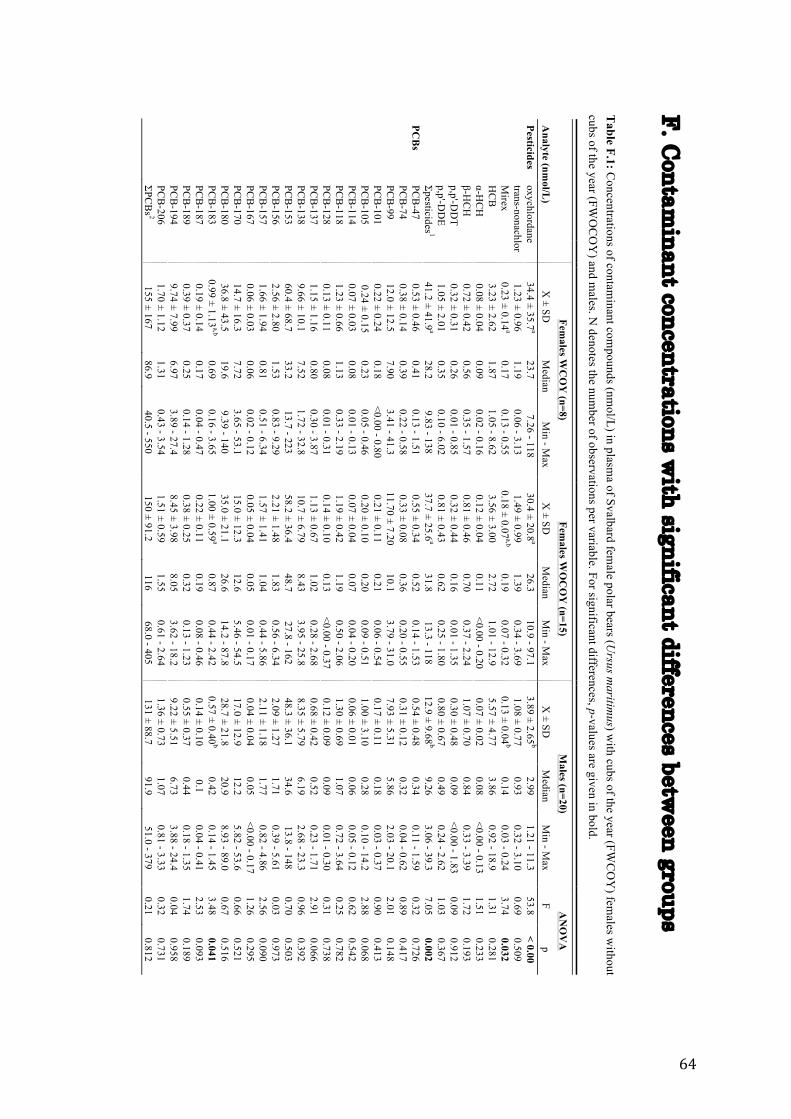
Plasma concentrations of oxychlordane, 4-OH-CB146 and BDE-47 in males were
significantly lower than in FWCOY and FWOCOY (ANOVA; oxychlordane: df = 2, F =
53.84, p < 0.001; 4-OH-CB146: df = 2, F = 11.37, p < 0.001; BDE-47: ft = 2, F = 11.07, p <
0.001). PCB-183 levels were significantly lower in males, compared to FWOCOY (ft = 2, F
= 3.48, p = 0.041) but did not differ significantly in comparison to levels in FWCOY. Levels
of 4'-OH-CB159 and mirex were significantly lower in males compared to FWCOY (4'-OH-
CB159: ft = 2, F = 5.03, p = 0.012; mirex: ft = 2, F = 3.74, p = 0.032) but were not
significantly lower compared to levels in FWOCOY. Levels of 3'-OH-CB138 were
significantly higher in males compared to FWCOY (ft = 2, F = 4.72, p = 0.015), but did not
differ significantly from levels in FWOCOY. There were no significant differences in the
other compound levels between the three groups (Table 10).
24
Table 10. Statistical differences between levels of PCBs (nmol/L), OH-PCBs (nmol/L), pesticides (nmol/L), PBDEs (nmol/L), Σ21PCBs, Σ8OH-PCBs, Σ8pesticides and Σ5PBDEs in plasma of polar bears (FWCOY, FWOCOY and males) sampled in Svalbard (Norway) in 2008, given as F-statistics and significance level (p) from analysis of variance. For significant correlations p-values are given in bold.
a Missing values were given a random number between zero and limit of detection (LOD) and included in the following statistics. b Detected concentrations are close to the detection limit.
25
3.4 Relationships between vitamin D levels, biometric variables, THs and POPs 3.4.1 Females with cubs of the year, FWCOY
Principal component analysis
The analysis resulted in a PCA model (Figure 2) with 2 significant principal components.
PC1 and PC2 explained 49.1 and 15.5 % of the variation, respectively (R2X = 0.647, Q2 =
0.144). Since all observations were within the Hotellings T2 range, no outliers were present.
The loadings of PCA indicated that several of the contaminants were clustered together along
PC1 (PC1 = 0.145 – 0.185), and were distinctly separated from 1,25(OH)2D. The plasma
levels of 1,25(OH)2D were positively associated with thyroid hormones (FT3, FT3:TT3, TT4,
FT4), longitude and age. In addition, 1,25(OH)2D was negatively associated with HCB,
BDE-153, PCB-128, straight length, 4-OH-CB187 and lipid%. FT4:TT4 was oriented
towards the center of the plot, indicating that it was less important to the model. TT3:TT4
were located along PC2 and thus negatively associated with p,p´-DDE. The levels of TT3
was oriented along PC1 and thus negatively associated with several PCBs (PCB-167, -187, -
194 and -206), BDE-47, β-HCH and mirex.
26
Figure 2: PCA loading plot of the relationships among the observations and the variables in female polar bears (Ursus maritimus) with cubs of the year (FWCOY) (n = 8), from Svalbard. A total of 62 variables were included in the model; latitude, longitude, age, condition, straight length, axillary girth, head length, zygomatic width, total body mass, body condition index, lipid content, cholesterol, 8 pesticides, 21 PCBs, 8 OH-PCBs, 5 PBDEs, THs and 1,25(OH)2D.
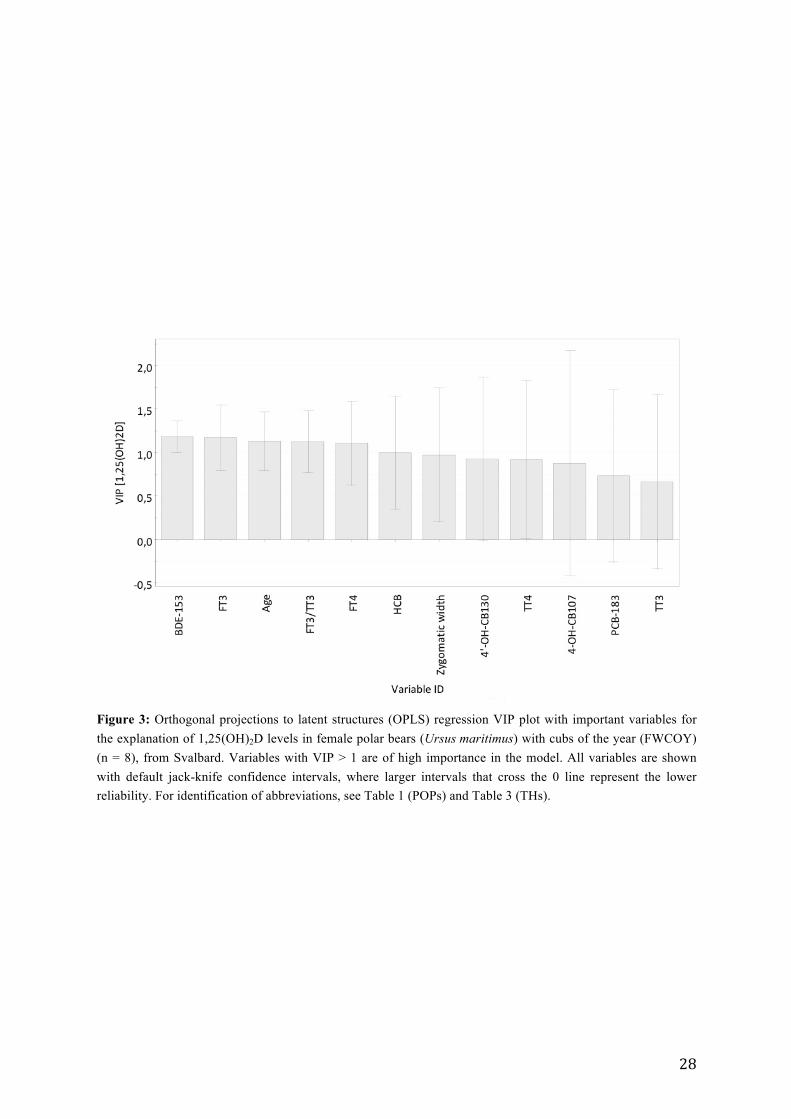
Orthogonal Projections to Latent Structures (OPLS)
To explore further the relations observed from the PCA-model, a single Y OPLS-model was
applied to investigate the relationships between predictor variables (THs, contaminants,
biological and environmental factors) and 1,25(OH)2D (Y) (Figure 3). Stepwise removal of
the variables of least importance resulted in a significant model (Wold et al., 2001). The
OPLS model predicted that the variation in 1,25(OH)2D was significantly explained by 12
variables (R2X = 0.55, R2Y = 0.84 and Q2 = 0.73, CV-ANOVA; p = 0.042). In PLS models,
R2Y > 0.7 and a Q2 > 0.4 denote highly significant models when analyzing biological data
(Lundstedt et al., 1998). The highest VIP (variable importance in projection) value was
27
shown by BDE-153, followed by FT3, age, FT3:TT3 ratio, FT4 and HCB (VIP > 1). Hence,
these variables were considered to be the most important for explaining the variation in
1,25(OH)2D. The information from the variable importance plot (VIP) (Figure 3) is
complemented with a coefficient plot (Figure 4). These two plots summarize the overall
contribution from each X variable, indicating which are correlated with Y (1,25(OH)2D), and
identifies if the direction of the relationship (between Y and the X variables) is positive or
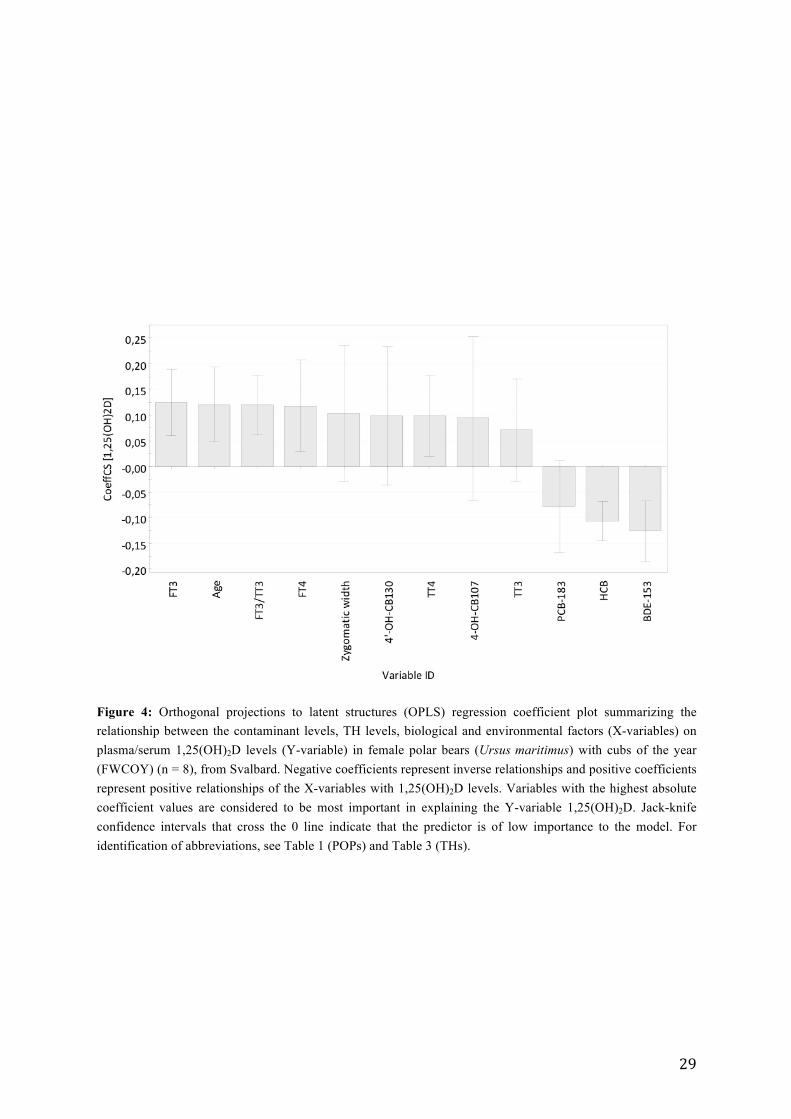
negative. The coefficient plot showed that FT3, age, FT3:TT3 ratio and FT4 were positively
correlated to 1,25(OH)2D. In contrast BDE-153 and HCB were inversely associated with
1,25(OH)2D levels in FWCOY (Figure 4). Further testing, using bivariate correlations,
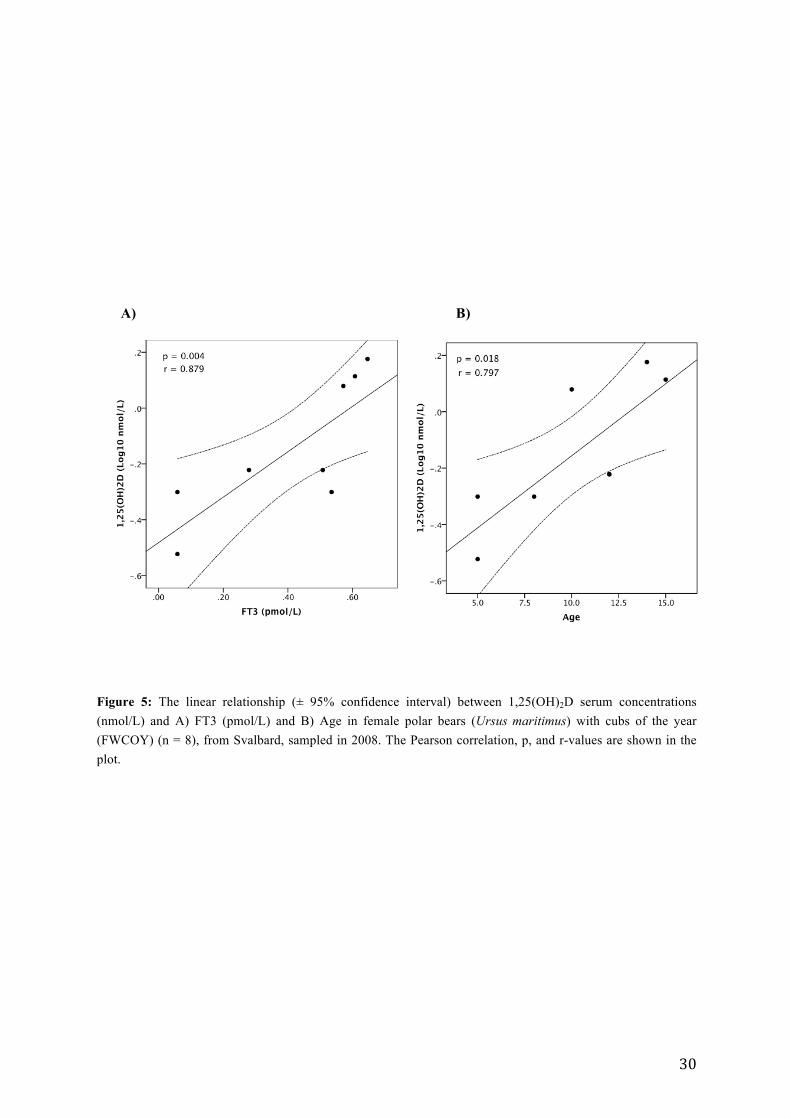
confirmed that FT3 (p = 0.004, rs = 0.879, n = 8), age (p = 0.018, rp = 0.797, n = 8), FT3:TT3
(p = 0.022, rs = 0.783, n = 8), FT4 (p = 0.048, rs = 0.711, n = 8), and also zygomatic width (p
= 0.000, rs = 0.945, n = 8) and TT4 (p = 0.036, rp = 0.739, n = 8) were positively correlated
with 1,25(OH)2D levels. In contrast, BDE-153 (p = 0.005, rp = -0.941, n = 6) and HCB (p =
0.033, rs = -0.747, n = 8) were inversely correlated with 1,25(OH)2D levels in FWCOY. It
should, however, be noted that the BDE-153 concentrations were suspected to have high
background levels (see discussion). The PCA plot (Figure 2) indicated negative relationships
between PCBs and 1,25(OH)2D. However, further correlation tests showed that none of the
PCBs correlated with 1,25(OH)2D.
The linear relationships between 1,25(OH)2D, FT3 and age are presented graphically in
Figure 5.
28
Figure 3: Orthogonal projections to latent structures (OPLS) regression VIP plot with important variables for the explanation of 1,25(OH)2D levels in female polar bears (Ursus maritimus) with cubs of the year (FWCOY) (n = 8), from Svalbard. Variables with VIP > 1 are of high importance in the model. All variables are shown with default jack-knife confidence intervals, where larger intervals that cross the 0 line represent the lower reliability. For identification of abbreviations, see Table 1 (POPs) and Table 3 (THs).
29
Figure 4: Orthogonal projections to latent structures (OPLS) regression coefficient plot summarizing the relationship between the contaminant levels, TH levels, biological and environmental factors (X-variables) on plasma/serum 1,25(OH)2D levels (Y-variable) in female polar bears (Ursus maritimus) with cubs of the year (FWCOY) (n = 8), from Svalbard. Negative coefficients represent inverse relationships and positive coefficients represent positive relationships of the X-variables with 1,25(OH)2D levels. Variables with the highest absolute coefficient values are considered to be most important in explaining the Y-variable 1,25(OH)2D. Jack-knife confidence intervals that cross the 0 line indicate that the predictor is of low importance to the model. For identification of abbreviations, see Table 1 (POPs) and Table 3 (THs).
30
A) B)
Figure 5: The linear relationship (± 95% confidence interval) between 1,25(OH)2D serum concentrations (nmol/L) and A) FT3 (pmol/L) and B) Age in female polar bears (Ursus maritimus) with cubs of the year (FWCOY) (n = 8), from Svalbard, sampled in 2008. The Pearson correlation, p, and r-values are shown in the plot.
31
3.4.2 Females without cubs of the year, FWOCOY
Principal Component Analysis
The analysis resulted in a PCA model (Figure 6) with 3 significant principal components.
PC1 and PC2 explained 35.1 and 14.7 % of the variation, respectively (R2X = 0.618, Q2 =
0.052). PC3 explained 1.2 % of the variation. Since all observations were within the
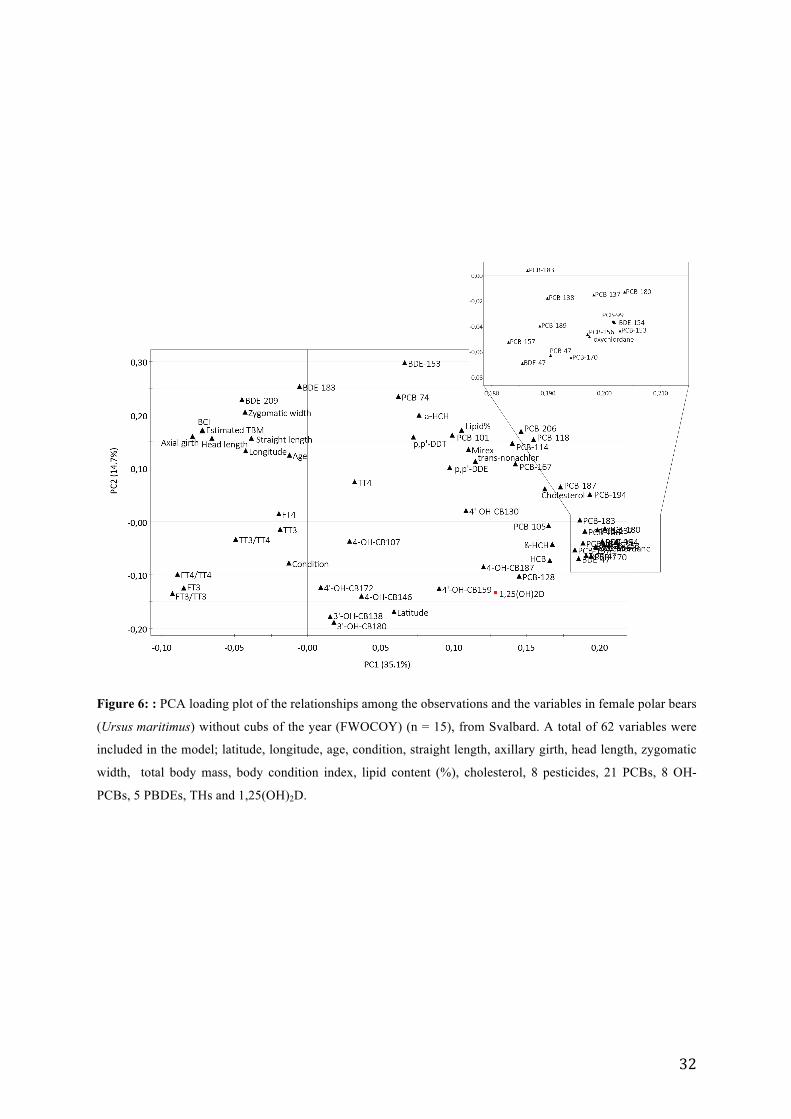
Hotellings T2 range, no outliers were present. The loadings of PCA indicated that several of
the contaminants were clustered together along PC1 (PC1 = 0.180 – 0.205), and thus, seemed
to be associated to the plasma levels of 1,25(OH)2D. 1,25(OH)2D grouped closely together
with PCB-128, 4-OH-CB187 and 4´OH-CB159, thus indicated a positive relationship
between these. In addition, 1,25(OH)2D was negatively associated with BDE-209 and
zygomatic width. FT4, TT3 and TT4 were oriented towards the center of the plot, indicating
that these were less important to the model. TT3:TT4 was located along PC1 and thus
negatively associated with p,p´-DDE. The levels of FT3, FT4:TT4 and FT3:TT3 were
clustered together along PC2 and thus negatively associated with PCB-74, BDE-153 and α-
HCH.
32
Figure 6: : PCA loading plot of the relationships among the observations and the variables in female polar bears
(Ursus maritimus) without cubs of the year (FWOCOY) (n = 15), from Svalbard. A total of 62 variables were
included in the model; latitude, longitude, age, condition, straight length, axillary girth, head length, zygomatic
width, total body mass, body condition index, lipid content (%), cholesterol, 8 pesticides, 21 PCBs, 8 OH-
PCBs, 5 PBDEs, THs and 1,25(OH)2D.
33
Orthogonal Projections to Latent Structures (OPLS)
To explore further the relations observed from the PCA-model, a single Y OPLS-model was
applied to investigate the relationships between predictor variables (THs, contaminants,
biological and environmental factors) and 1,25(OH)2D (Y) (Figure 7). Stepwise removal of
the variables of least importance resulted in a significant model (Wold et al., 2001). The
OPLS model predicted that the variation in 1,25(OH)2D was significantly explained by 25
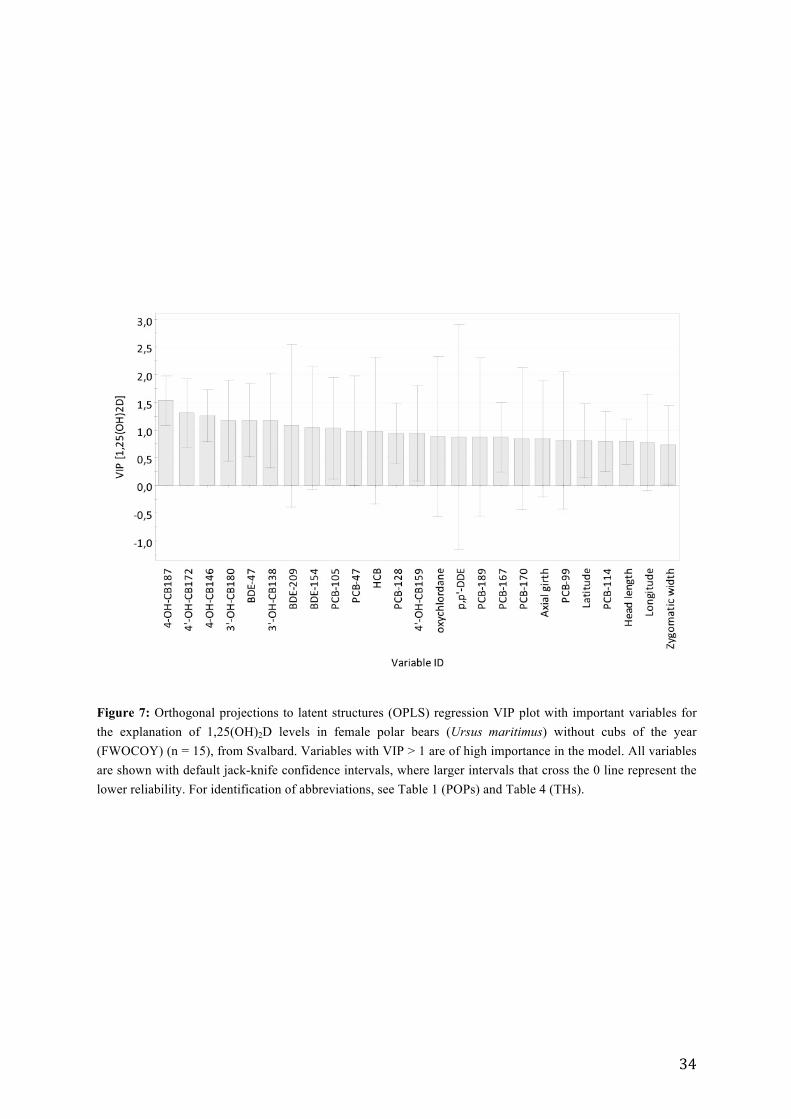
variables (R2X = 0.43, R2Y = 0.64 and Q2 = 0.55, CV-ANOVA; p = 0.013). The highest VIP
(variable importance in projection) values were shown by 4´OH-CB187, followed by 4´OH-
CB172, 4-OH-CB146, 3´OH-CB180, BDE-47, 3´OH-CB138, BDE-209, BDE-154 and PCB-
105 (VIP > 1). Hence, these variables were considered to be the most important for
explaining the variation in 1,25(OH)2D. The coefficient plot showed that 4´OH-CB187,
4´OH-CB172, 4-OH-CB146, 3´OH-CB180, BDE-47, 3´OH-CB138, BDE-154 and PCB-105
were positively correlated to 1,25(OH)2D. In contrast BDE-209 was inversely associated with
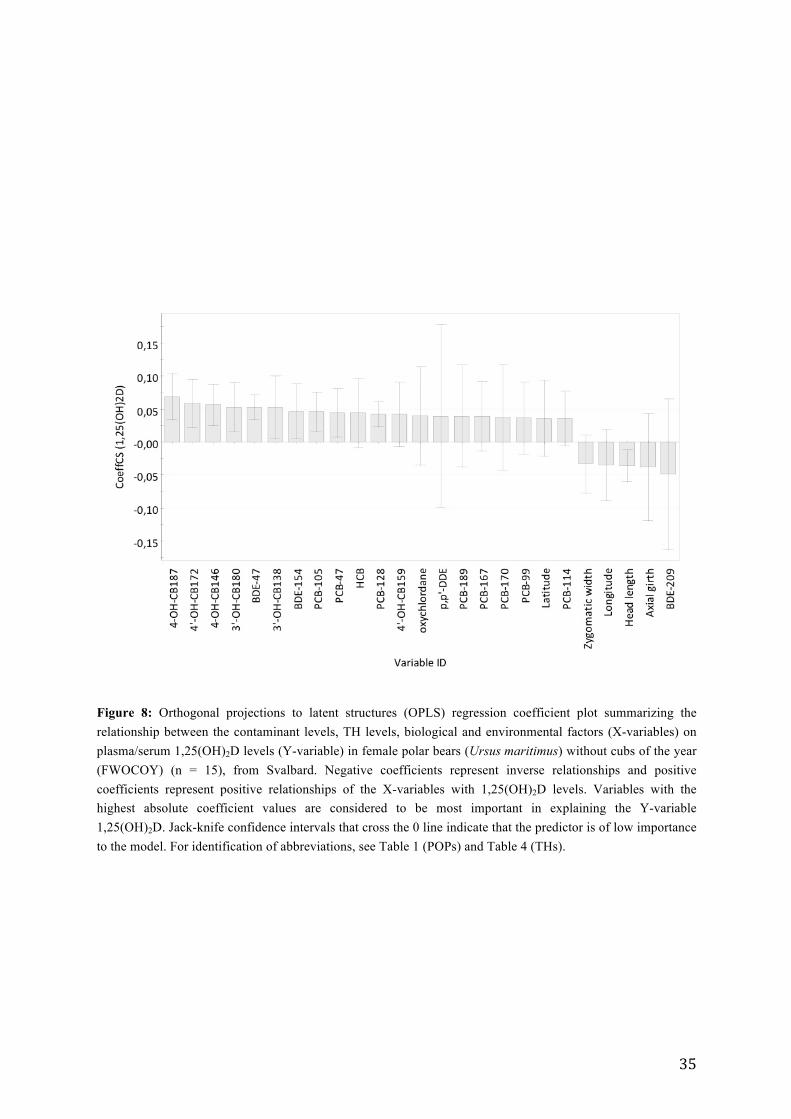
1,25(OH)2D levels in FWOCOY (Figure 8). It should be noted that the validation parameter
R2X was below the value that defines a good model using biological data; R2X > 0.7.
However, the criteria of predictability were met; Q2 > 0.4 (Lundstedt et al., 1998).
Further testing, using bivariate correlations, confirmed that 4-OH-CB187 (p = 0,049, rs =
0.578, n = 12), 4´OH-CB172 (p = 0.048, rp = 0.580, n = 12), BDE-47 (p = 0.012, rp = 0.631, n
= 15), 3´OH-CB138 (p = 0.047, rs = 0.582, n = 12), BDE-154 (p = 0.021, rp = 0.590, n = 15),
and also PCB-47 (p = 0.025, rp = 0.575, n = 15), PCB-128 (p = 0.034, rp = 0.549, n = 15),
oxychlordane (p = 0.040, rp = 0.534, n = 15), p,p´DDE (p = 0.028, rs = 0.567, n = 15) and
PCB-189 (p = 0.041, rp = 0.532, n = 15) were positively correlated with 1,25(OH)2D levels.
In contrast, BDE-209 (p = 0.013, rs = -0.623, n = 15) was inversely correlated with
1,25(OH)2D levels in FWOCOY. It should be noted that 4´OH-CB172 co-eluted with another
OH-PCB isomer, and that BDE-209 concentrations were suspected to have high background
levels. Hence, these results should be considered as semi-quantitative.
The linear relationships between 1,25(OH)2D, 4-OH-CB187, and BDE-47 are presented
graphically in Figure 9.
34
Figure 7: Orthogonal projections to latent structures (OPLS) regression VIP plot with important variables for the explanation of 1,25(OH)2D levels in female polar bears (Ursus maritimus) without cubs of the year (FWOCOY) (n = 15), from Svalbard. Variables with VIP > 1 are of high importance in the model. All variables are shown with default jack-knife confidence intervals, where larger intervals that cross the 0 line represent the lower reliability. For identification of abbreviations, see Table 1 (POPs) and Table 4 (THs).
35
Figure 8: Orthogonal projections to latent structures (OPLS) regression coefficient plot summarizing the relationship between the contaminant levels, TH levels, biological and environmental factors (X-variables) on plasma/serum 1,25(OH)2D levels (Y-variable) in female polar bears (Ursus maritimus) without cubs of the year (FWOCOY) (n = 15), from Svalbard. Negative coefficients represent inverse relationships and positive coefficients represent positive relationships of the X-variables with 1,25(OH)2D levels. Variables with the highest absolute coefficient values are considered to be most important in explaining the Y-variable 1,25(OH)2D. Jack-knife confidence intervals that cross the 0 line indicate that the predictor is of low importance to the model. For identification of abbreviations, see Table 1 (POPs) and Table 4 (THs).
36
A) B)
Figure 9: The linear relationship (± 95% confidence interval) between 1,25(OH)2D serum concentrations (nmol/L) and A) 4-OH-CB187 (nmol/L) and B) BDE-47 (nmol/L) in female polar bears (Ursus maritimus) without cubs of the year (FWOCOY) (n = 15), from Svalbard, sampled in 2008. The Pearson correlation, p, and r-values are shown in the plot.
37
3.4.3 Males
Principal Component analysis
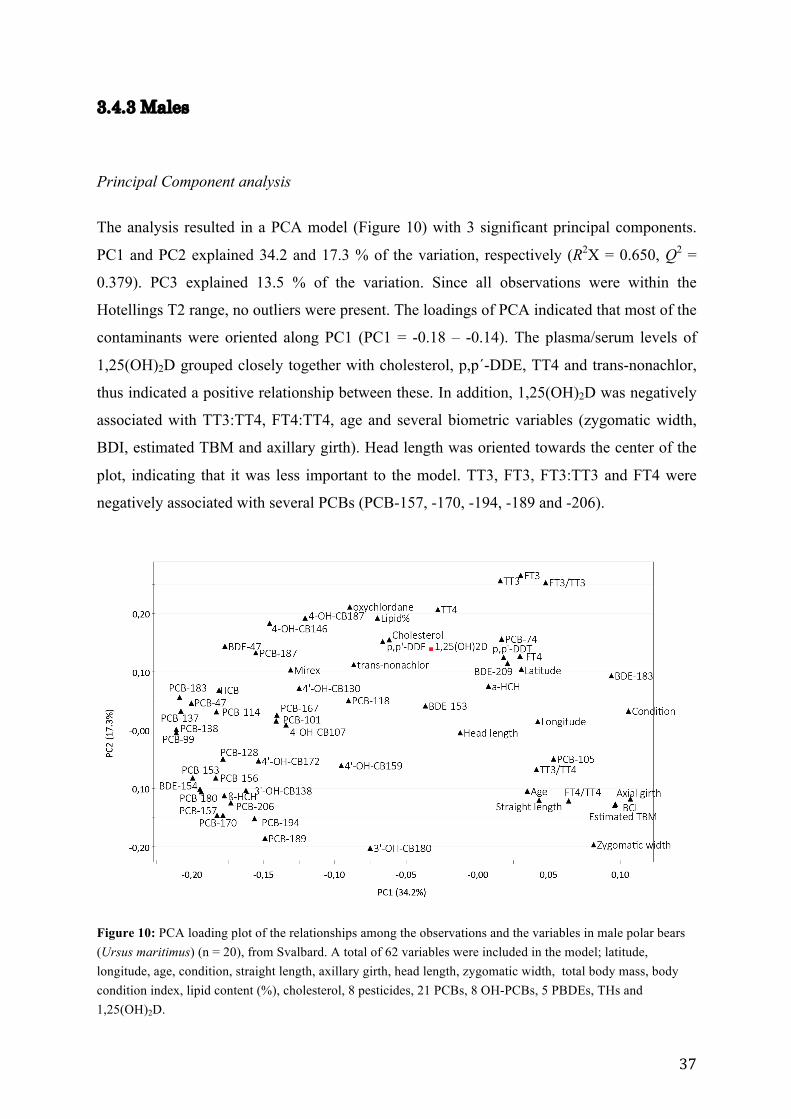
The analysis resulted in a PCA model (Figure 10) with 3 significant principal components.
PC1 and PC2 explained 34.2 and 17.3 % of the variation, respectively (R2X = 0.650, Q2 =
0.379). PC3 explained 13.5 % of the variation. Since all observations were within the
Hotellings T2 range, no outliers were present. The loadings of PCA indicated that most of the
contaminants were oriented along PC1 (PC1 = -0.18 – -0.14). The plasma/serum levels of
1,25(OH)2D grouped closely together with cholesterol, p,p´-DDE, TT4 and trans-nonachlor,
thus indicated a positive relationship between these. In addition, 1,25(OH)2D was negatively
associated with TT3:TT4, FT4:TT4, age and several biometric variables (zygomatic width,
BDI, estimated TBM and axillary girth). Head length was oriented towards the center of the
plot, indicating that it was less important to the model. TT3, FT3, FT3:TT3 and FT4 were
negatively associated with several PCBs (PCB-157, -170, -194, -189 and -206).
Figure 10: PCA loading plot of the relationships among the observations and the variables in male polar bears (Ursus maritimus) (n = 20), from Svalbard. A total of 62 variables were included in the model; latitude, longitude, age, condition, straight length, axillary girth, head length, zygomatic width, total body mass, body condition index, lipid content (%), cholesterol, 8 pesticides, 21 PCBs, 8 OH-PCBs, 5 PBDEs, THs and 1,25(OH)2D.
38
Orthogonal Projections to Latent Structures (OPLS)
To explore further the relations observed from the PCA-model, a single Y OPLS-model was
applied to investigate the relationships between predictor variables (THs, contaminants,
biological and environmental factors) and 1,25(OH)2D (Y) (Figure 11). Stepwise removal of
the variables of least importance resulted in a significant model (Wold et al., 2001). The
OPLS model predicted that the variation in 1,25(OH)2D was significantly explained by 20
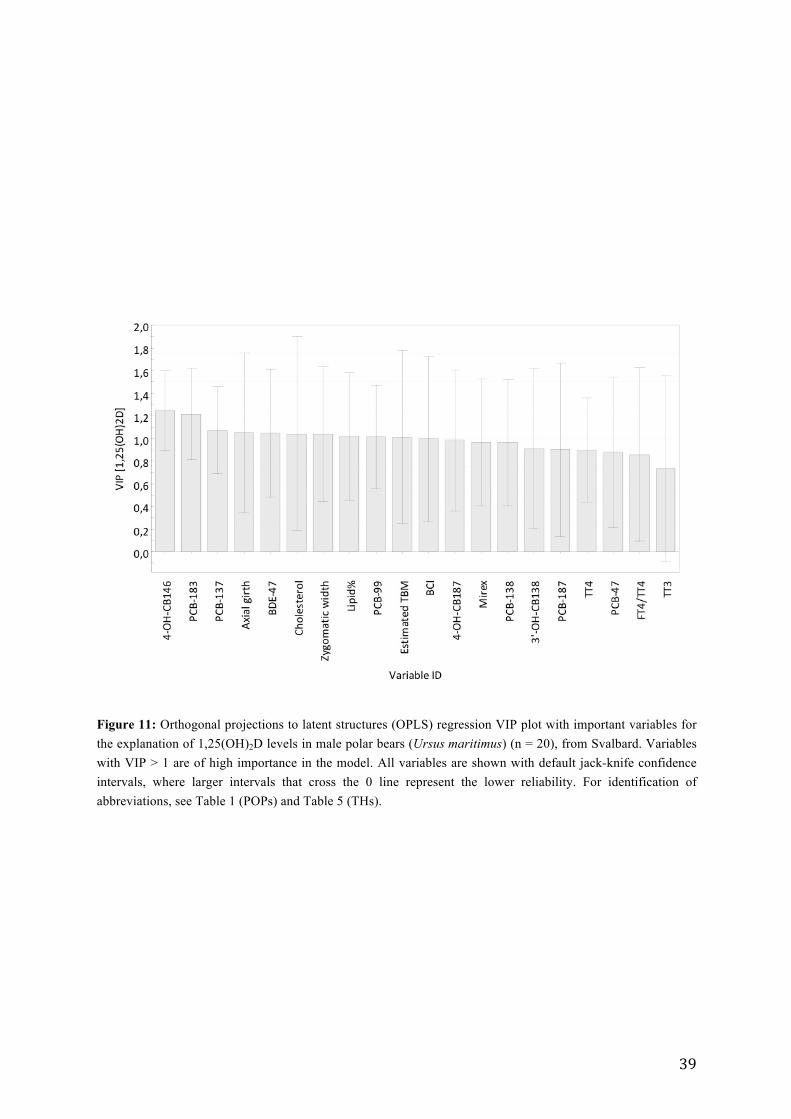
variables (R2X = 0.52, R2Y = 0.30 and Q2 = 0.19 , CV-ANOVA; p = 0.016). The highest VIP
(variable importance in projection) values were shown by 4-OH-CB146, followed by PCB-
estimated total body mass (TBM) and body condition index (BCI) (VIP > 1). Hence, these
variables were considered to be the most important for explaining the variation in
1,25(OH)2D. The coefficient plot showed that 4OH-CB146, PCB-183, PCB-137, BDE-47,
cholesterol, lipid % and PCB-99 were positively correlated to 1,25(OH)2D. In contrast
axillary girth, zygomatic width, estimated total body mass (TBM) and body condition index
(BCI ) were inversely associated with 1,25(OH)2D levels in males (Figure 12). It should be
noted that the validation parameters R2X and Q2 were below the value that defines a good
model when using biological data; R2X > 0.7, Q2 > 0.4 (Lundstedt et al., 1998).
Further testing, using bivariate correlations, showed that the only statistically significant
correlations were between 1,25(OH)2D and TT3 (p = 0.013, rp = 0.545, n = 20) and between
1,25(OH)2D and TT4 (p = 0.028, rp = 0.492, n = 20).
The linear relationships between 1,25(OH)2D, TT3 and TT4 are presented graphically in
figure 13.
39
Figure 11: Orthogonal projections to latent structures (OPLS) regression VIP plot with important variables for the explanation of 1,25(OH)2D levels in male polar bears (Ursus maritimus) (n = 20), from Svalbard. Variables with VIP > 1 are of high importance in the model. All variables are shown with default jack-knife confidence intervals, where larger intervals that cross the 0 line represent the lower reliability. For identification of abbreviations, see Table 1 (POPs) and Table 5 (THs).
40
Figure 12: Orthogonal projections to latent structures (OPLS) regression coefficient plot summarizing the relationship between the contaminant levels, TH levels, biological and environmental factors (X-variables) on plasma/serum 1,25(OH)2D levels (Y-variable) in male polar bears (Ursus maritimus) (n = 20), from Svalbard. Negative coefficients represent inverse relationships and positive coefficients represent positive relationships of the X-variables with 1,25(OH)2D levels. Variables with the highest absolute coefficient values are considered to be most important in explaining the Y-variable 1,25(OH)2D. Jack-knife confidence intervals that cross the 0 line indicate that the predictor is of low importance to the model. For identification of abbreviations, see Table 1 (POPs) and Table 5 (THs).
41
A) B)
Figure 13: The linear relationship (± 95% confidence interval) between 1,25(OH)2D serum concentrations (nmol/L) and A) TT3 (nmol/L) and B) TT4 (nmol/L) in male polar bears (Ursus maritimus) (n = 20) from Svalbard, sampled in 2008. The Pearson correlation, p, and r-values are shown in the plot.
42
4. Discussion
The results of the present study show that circulating levels of 1,25(OH)2D did not differ
significantly between the three groups of polar bears (Table 6). In addition, the study also
shows that circulating concentrations of 1,25(OH)2D in polar bears may be disturbed by
contaminants, and relationships between 1,25(OH)2D and THs were observed: POPs affected
1,25(OH)2D levels in both FWCOY and FWOCOY, but not in males, while levels of THs
affected 1,25(OH)2D levels in both FWCOY and males, but not in FWOCOY.
4.1 Levels of vitamin D
To my knowledge, this is the first study to examine circulating levels of 1,25(OH)2D in free-
ranging polar bears. Only a few studies have examined the plasma levels of vitamin D in
polar bears (Crissey et al., 2001, Kenny et al., 1998, Kenny et al., 2004, Lin et al., 2005), and
to my knowledge, none have investigated differences in vitamin D levels among females with
and without cubs, and males. Only one previous study appear to have reported the serum
levels of 1,25(OH)2D in (captive) polar bears (Crissey et al., 2001). The other studies have
analyzed milk, serum or blubber levels of 25-OH vitamin D3 (25-OHD3) in polar bears.
(Kenny et al., 1998, Kenny et al., 2004, Lin et al., 2005). 25-OHD3 is metabolized in the liver
from 7-dehydrocholesterol, before further metabolized in the kidneys to the active compound
1,25(OH)2D (Vieth, 2005). Lin et al (2005) investigated associations between serum levels of
25-OHD3 in captive polar bears and antebrachial fractures, and reported subnormal vitamin D
concentrations in 2 of 3 polar bears with fractures. Kenny et al (1998) reported 25-OHD3
levels in milk from captive and free-ranging polar bears, and later they investigated the 25-
OHD3 content in polar bear blubber (Kenny et al., 2004). Due to the lack of a reliable
kidney/milk/blubber-to-blood conversion factor for 25-OHD3 to 1,25(OH)2D in polar bears, a
direct comparison of levels between the present study (plasma 1,25(OH)2D) and previous
studies (blubber/milk/plasma 25-OHD3) is not possible. In the present study, the plasma
43
concentrations of 1,25(OH)2D (Table 3, 4 and 5) were higher (mean = 0.68 nmol/L) than
and Assessment Programme, 859 pp. Baylink D, Stauffer M, Wergedal J, Rich C, 1970. Formation, mineralization, and resorption of bone
in vitamin D-deficient rats. Journal of Clinical Investigation, 49: 1122-1134. Bergman A, Olsson M, Reiland S, 1992. Skull-bone lesions in the Baltic grey seal (Halichoerus
grypus). Ambio, 21: 517-519. Bernhoft A, Wiig O, Skaare JU, 1997. Organochlorines in polar bears (Ursus maritimus) at Svalbard.
Environmental Pollution, 95: 159-175. Berson SA, Yalow RS, 1968. General principles of radioimmunoassay. Clinica Chimica Acta, 22: 51-
69. Bertinussen HO, 2009. Effects of hydroxylated PCBs on thyroid hormone levels in mother-cub pairs
of polar bears (Ursus maritimus) from Svalbard. MSc Thesis, Norwegian University of Science and Technology.
Boas M, Feldt-Rasmussen U, Skakkebæk NE, Main KM, 2006. Environmental chemicals and thyroid
function. European Journal of Endocrinology, 154: 599-611. Borgå K, Fisk AT, Hoekstra PF, Muir DCG, 2004. Biological and chemical factors of importance in
the bioaccumulation and trophic transfer of persistent organochlorine contaminants in Arctic marine food webs. Environmental Toxicology and Chemistry, 23: 2367-2385.
Braathen M, Derocher AE, Wiig O, Sormo EG, Lie E, et al., 2004. Relationships between PCBs and
thyroid hormones and retinol in female and male polar bears. Environmental Health Perspectives, 112: 826-833.
and mercury in marine biota of the Canadian Arctic: An overview of spatial and temporal trends. The Science of the Total Environment, 351-352: 4-56.
Brevik EM, 1978. Gas chromatograhic method for the determination of organochlorine pesticides in
human milk. Bulletin of Environmental Contamination and Toxicology, 19: 281-286. Bustnes JO, Fauchald P, Tveraa T, Helberg M, Skaare JU, 2008. The potential impact of
environmental variation on the concentrations and ecological effects of pollutants in a marine avian top predator. Environment International, 34: 193-201.
Bustnes JO, Gabrielsen GW, Verreault J, 2010. Climate variability and temporal trends of persistent
organic pollutants in the Arctic: A study of glaucous gulls. Environmental Science & Technology, 44: 3155-3161.
Bytingsvik J, Lie E, Aars J, Derocher AE, Wiig Ø, Jenssen BM, 2012. PCBs and OH-PCBs in polar
bear mother-cub pairs: A comparative study based on plasma levels in 1998 and 2008. The Science of the Total Environment, 417-418: 117-128.
53
Calvert W, Ramsay MA, 1998. Evaluation of age determination of polar bears by counts of cementum growth layer groups. Ursus, 10: 449-453.
Cattet MRL, Caulkett NA, Obbard ME, Stenhouse GB, 2002. A body-condition index for ursids.
Canadian Journal of Zoology, 80: 1156-1161. Chiovato L, Lapi P, Fiore E, Tonacchera M, Pinchera A, 1993. Thyroid autoimmunity and female
gender. Journal of Endocrinological Investigation, 16: 384-391. Christensen-Dalsgaard SN, Aars J, Andersen M, Lockyer C, Yoccoz NG, 2010. Accuracy and
precision in estimation of age of Norwegian Arctic polar bears (Ursus maritimus) using dental cementum layers from known-age individuals. Polar Biology, 33: 589-597.
Crissey S, Ange K, Slifka K, Bowen P, Stacewicz-Sapuntzakis M, et al., 2001. Serum concentrations
of vitamin D metabolites, vitamins A and E, and carotenoids in six canid and four ursid species at four zoos. Comparative Biochemistry and Physiology, Part A: Molecular & Integrative Physiology, 128: 155-165.
Dawson A, 2000. Mechanisms of endocrine disruption with particular reference to occurrence in
avian wildlife: A review. Ecotoxicology, 9: 59-69. de March B, de Wit C, Muir D, Braune B, Gregor D, et al., 1998. Persistent organic pollutants. In:
AMAP Assessment Report: Arctic Pollution Issues. Arctic Monitoring and Assessment Programme. Oslo, Norway, 183-373 pp.
de Wit CA, Herzke D, Vorkamp K, 2010. Brominated flame retardants in the Arctic environment-
trends and new candidates. Science of the Total Environment, 408: 2885-2918. de Wit CA, Fisk AT, Hobbs KE, Muir DCG, Gabrielsen GW, et al., 2004. AMAP Assessment 2002:
Persistent organic pollutants in the Arctic. Arctic Monitoring and Assessment Programme. Oslo, Norway.
Derocher AE, Wiig Ø, 2002. Postnatal growth in body length and mass of polar bears (Ursus
maritimus) at Svalbard. Journal of Zoology, 256: 343-349. Derocher AE, Wiig Ø, Andersen M, 2002. Diet composition of polar bears in Svalbard and the
western Barents Sea. Polar Biology, 25: 448-452. Diamanti-Kandarakis E, Bourguignon JP, Giudice LC, Hauser R, Prins GS, et al., 2009. Endocrine-
disrupting chemicals: An endocrine society scientific statement. Endocrine Reviews, 30: 293-342.
Epstein S, Schneider A, 2005. Drug and hormone effects on vitamin D metabolism. In: Feldman D,
Pike JW, Glorieux FH, eds. Vitamin D. Elsevier Academic Press, San Diego, CA, USA, 1253-1291 pp.
Eriksson L, Johansson E, Kettaneh-Wold N, Wold S, 2006. Multi-and megavariate data analysis.
Part I: Basic Principles and applications. 2nd edition. Umeå: Umetrics. Faibish D, Boskey AL, 2005. Mineralization. In: Feldman D, Pike JW, Glorieux FH, eds. Vitamin D.
Elsevier Academic Press, San Diego, CA, USA, 477-495 pp. Haave M, Ropstad E, Derocher AE, Lie E, Dahl E, et al., 2003. Polychlorinated biphenyls and
reproductive hormones in female polar bears at Svalbard. Environmental Health Perspectives, 111: 431-436.
Hall AJ, Kalantzi OI, Thomas GO, 2003. Polybrominated diphenyl ethers (PBDEs) in grey seals
during their first year of life-are they thyroid hormone endocrine disrupters? Environmental Pollution, 126: 29-37.
54
Hop H, Borgå K, Gabrielsen GW, Kleivane L, Skaare JU, 2002. Food web magnification of persistent organic pollutants in poikilotherms and homeotherms from the Barents Sea. Environmental Science & Technology, 36: 2589-2597.
Horst RL, Reinhardt TA, Reddy GS, 2005. Vitamin D Metabolism. In Feldman D, Pike JW, Glorieux
FH, eds. Vitamin D. Elsevier Academic Press, London, United Kingdom, 15-36 pp. Jenssen BM, 2006. Endocrine-disrupting chemicals and climate change: A worst-case combination
for Arctic marine mammals and seabirds? Environmental Health Perspectives, 114: 76-80. Jones KC, De Voogt P, 1999. Persistent organic pollutants (POPs): State of the science.
Environmental Pollution, 100: 209-221. Kato Y, Haraguchi K, Ito Y, Fujii A, Yamazaki T, et al., 2010. Polychlorinated biphenyl-mediated
decrease in serum thyroxine level in rodents. Drug Metabolism and Disposition, 38: 697-704. Keiver KM, Draper H, Ronald K, 1988. Vitamin D metabolism in the hooded seal (Cystophora
cristata). The Journal of Nutrition, 118: 332-341. Kelly BC, Ikonomou MG, Blair JD, Morin AE, Gobas FA, 2007. Food web-specific biomagnification
of persistent organic pollutants. Science, 317: 236-239. Kenny DE, Irlbeck NA, Chen TC, Lu Z, Holick MF, 1998. Determination of vitamins D, A, and E in
sera and vitamin D in milk from captive and free‐ranging polar bears (Ursus maritimus), and 7‐dehydrocholesterol levels in skin from captive polar bears. Zoo Biology, 17: 285-293.
Kenny DE, O'Hara TM, Chen TC, Lu Z, Tian X, Holick MF, 2004. Vitamin D content in Alaskan
Arctic zooplankton, fishes, and marine mammals. Zoo Biology, 23: 33-43. Krueger PD, Raina P, Braun EA, Patterson C, Chambers LW, 2001. Prevalence and risk factors of
hypothyroidism: Findings from the Canadian study of health and aging. Canadian Journal on Aging, 20: 127-135.
Lakatos P, 2003. Thyroid hormones: Beneficial or deleterious for bone? Calcified Tissue
International, 73: 205-209. Legler J, Brouwer A, 2003. Are brominated flame retardants endocrine disruptors? Environment
International, 29: 879-885. Letcher RJ, Norstrom RJ, Muir DCG, 1998. Biotransformation versus bioaccumulation: Sources of
methyl sulfone PCB and 4,4'-DDE metabolites in the polar bear food chain. Environmental Science & Technology, 32: 1656-1661.
Letcher RJ, Bustnes JO, Dietz R, Jenssen BM, Jørgensen EH, et al., 2010. Exposure and effects
assessment of persistent organohalogen contaminants in Arctic wildlife and fish. The Science of the Total Environment, 408: 2995-3043.
Lie E, Larsen HJrS, Larsen S, Johansen GM, Derocher AE, et al., 2004. Does high organochlorine
(OC) exposure impair the resistance to infection in polar bears (Ursus maritimus)? Part I: Effect of OCs on the humoral immunity. Journal of Toxicology and Environmental health, Part A, 67: 555-582.
Lilienthal H, Fastabend A, Hany J, Kaya H, Roth-Härer A, et al., 2000. Reduced levels of 1,25-
dihydroxyvitamin D3 in rat dams and offspring after exposure to a reconstituted PCB mixture. Toxicological Sciences, 57: 292-301.
Lin RC, Engeli E, Prowten AW, Erb HN, Ducharme NG, Goodrich LR, 2005. Antebrachial fractures
in four captive polar bears (Ursus maritimus). Veterinary Surgery, 34: 358-365.
55
Lind PM, Bergman A, Olsson M, Örberg J, 2003. Bone mineral density in male Baltic grey seal (Halichoerus grypus). Ambio, 32: 385-388.
Lundstedt T, Seifert E, Abramo L, Thelin B, Nyström Å, et al., 1998. Experimental design and
optimization. Chemometrics and Intelligent Laboratory Systems, 42: 3-40. McKinney MA, Peacock E, Letcher RJ, 2009. Sea ice-associated diet change increases the levels of
chlorinated and brominated contaminants in polar bears. Environmental Science & Technology, 43: 4334-4339.
McNabb FMA, 1992. Thyroid hormones: production, storage, and release by the thyroid gland. In:
Academic Press, 461-471 pp. Meerts I, Letcher RJ, Hoving S, Marsh G, Bergman A, et al., 2001. In vitro estrogenicity of
polybrominated diphenyl ethers, hydroxylated PDBEs, and polybrominated bisphenol A compounds. Environmental Health Perspectives, 109: 399-407.
Merryman JI, Buckles EL, 1998. The avian thyroid gland. Part two: A review of function and
pathophysiology. Journal of Avian Medicine and Surgery: 12: 238-242. Miljeteig C, Strøm H, Gavrilo MV, Volkov A, Jenssen BM, Gabrielsen GW, 2009. High levels of
contaminants in ivory gull (Pagophila eburnea) eggs from the Russian and Norwegian Arctic. Environmental Science & Technology, 43: 5521-5528.
Mohan HK, Groves AM, Fogelman I, Clarke SE, 2004. Thyroid hormone and parathyroid hormone
competing to maintain calcium levels in the presence of vitamin D deficiency. Thyroid, 14: 789-791.
Murvoll KM, Jenssen BM, Skaare JU, 2005. Effects of pentabrominated diphenyl ether (PBDE-99)
on vitamin status in domestic duck (Anas platyrhynchos) hatchlings. Journal of Toxicology and Environmental Health, Part A, 68: 515-533.
Murvoll KM, Skaare JU, Anderssen E, Jenssen BM, 2006. Exposure and effects of persistent organic
pollutants in European shag (Phalacrocorax aristotelis) hatchlings from the coast of Norway. Environmental Toxicology and Chemistry, 25: 190-198.
Nilsen EME, 2011. Temporal change and effects of perfluoroalkyl substanses (PFASs) on thyroid
hormone levels in mother-cub pairs of polar bear (Ursus maritimus) from Svalbard in 1998 and 2008. MSc Thesis, Norwegian University of Science and Technology.
Olsen GH, Mauritzen M, Derocher AE, Sørmo EG, Skaare JU, et al., 2003. Space-use strategy is an
important determinant of PCB concentrations in female polar bears in the Barents Sea. Environmental Science & Technology, 37: 4919-4924.
Oskam IC, Ropstad E, Dahl E, Lie E, Derocher AE, et al., 2003. Organochlorines affect the major
androgenic hormone, testosterone, in male polar bears (Ursus maritimus) at Svalbard. Journal of Toxicology and Environmental Health, Part A, 66: 2119-2139.
effects of contaminants in seals may be associated with vitamin D and thyroid hormones. Environmental Toxicology and Chemistry, 27: 873-880.
Sandala G, Sonne-Hansen C, Dietz R, Muir D, Valters K, et al., 2004. Hydroxylated and methyl
sulfone PCB metabolites in adipose and whole blood of polar bear (Ursus maritimus) from East Greenland. The Science of the Total Environment, 331: 125-141.
56
Sandau CD, Meerts IATM, Letcher RJ, McAlees AJ, Chittim B, et al., 2000. Identification of 4-hydroxyheptachlorostyrene in polar bear plasma and its binding affinity to transthyretin: A metabolite of octachlorostyrene? Environmental Science & Technology, 34: 3871-3877.
Skaare JU, Bernhoft A, Wiig Ø, Norum KR, Haug E, et al., 2001. Relationships between plasma
levels of organochlorines, retinol and thyroid hormones from polar bears (Ursus maritimus) at Svalbard. Journal of Toxicology and Environmental Health, Part A, 62: 227-241.
Sonne C, Leifsson PS, Dietz R, Erik W, Letcher RJ, et al., 2006. Xenoendocrine pollutants may
reduce size of sexual organs in East Greenland polar bears (Ursus maritimus). Environmental Science & Technology, 40: 5668-5674.
Sørmo EG, Jussi I, Jussi M, Braathen M, Skaare JU, Jenssen BJM, 2005. Thyroid hormone status in
gray seal (Halichoerus grypus) pups from the Baltic Sea and the Atlantic Ocean in relation to organochlorine pollutants. Environmental Toxicology and Chemistry, 24: 610-616.
Sørmo EG, Salmer MP, Jenssen BM, Hop H, Baek K, et al., 2006. Biomagnification of
polybrominated diphenyl ether and hexabromocyclododecane flame retardants in the polar bear food chain in Svalbard, Norway. Environmental Toxicology and Chemistry, 25: 2502-2511.
Stirling I, Spencer C, Andriashek D, 1989. Immobilization of polar bears (Ursus maritimus) with
Telazol in the Canadian Arctic. Journal of Wildlife Diseases, 25: 159-168. Trygg J, Wold S, 2002. Orthogonal projections to latent structures (O‐PLS). Journal of
on thyroid hormone levels in Arctic breeding glaucous gulls (Larus hyperboreus). Environmental Health Perspectives, 112: 532-537.
Verreault J, Gabrielsen GW, Chu S, Muir DCG, Andersen M, et al., 2005a. Flame retardants and
methoxylated and hydroxylated polybrominated diphenyl ethers in two Norwegian Arctic top predators: glaucous gulls and polar bears. Environmental Science & Technology, 39: 6021-6028.
Verreault J, Muir DCG, Norstrom RJ, Stirling I, Fisk AT, et al., 2005b. Chlorinated hydrocarbon
contaminants and metabolites in polar bears (Ursus maritimus) from Alaska, Canada, East Greenland, and Svalbard: 1996-2002. The Science of the Total Environment, 351: 369-390.
Verreault J, Bech C, Letcher RJ, Ropstad E, Dahl E, Gabrielsen GW, 2007. Organohalogen
contamination in breeding glaucous gulls from the Norwegian Arctic: Associations with basal metabolism and circulating thyroid hormones. Environmental Pollution, 145: 138-145.
Vieth R, 2005. The pharmacology of vitamin D, including fortification strategies. In Feldman D, Pike
JW, Glorieux FH, eds. Vitamin D. Elsevier Academic Press, San Diego, CA, USA, 2: 995-1015 pp.
Villanger GD, 2011. Effects of complex organohalogen contaminant mixtures on thyroid hormone
homeostasis in selected arctic marine mammals. PhD Thesis, Norwegian University of Science and Technology.
Wania F, Mackay D, 1995. A global distribution model for persistent organic chemicals. The Science
of the Total Environment, 160: 211-232. Wiig O, Derocher AE, Cronin MM, Skaare JU, 1998. Female pseudohermaphrodite polar bears at
Svalbard. Journal of Wildlife Diseases, 34: 792-796.
57
Wilske J, Arnbom T, 1996. Seasonal variation in vitamin D metabolites in southern elephant seal (Mirounga leonina) females at south Georgia. Comparative Biochemistry and Physiology, Part A: Physiology, 114: 9-14.
Wold S, Sjöström M, Eriksson L, 2001. PLS-regression: A basic tool of chemometrics. Chemometrics
and Intelligent Laboratory Systems, 58: 109-130. Yasuda H, Higashio K, Suda T, 2005. Vitamin D and osteoclastogenesis. In Feldman D, Pike JW,
Glorieux FH, eds. Vitamin D. Elsevier Academic Press, San Diego, CA, USA, 665-685 pp. Yen PM, Chin WW, 1994. New advances in understanding the molecular mechanisms of thyroid
hormone action. Trends in Endocrinology & Metabolism, 5: 65-72. Zoeller RT, 2007. Environmental chemicals impacting the thyroid: Targets and consequences.
Thyroid, 17: 811-817.
58
Appendices
59
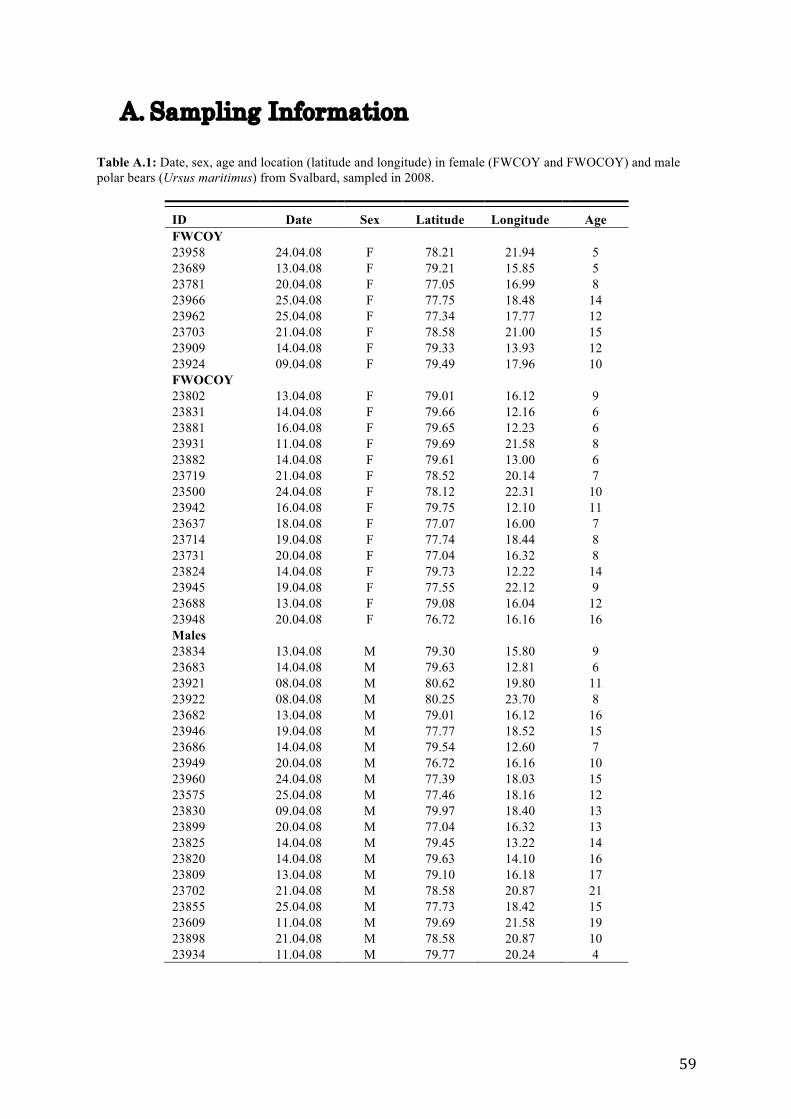
A. Sampling Information Table A.1: Date, sex, age and location (latitude and longitude) in female (FWCOY and FWOCOY) and male polar bears (Ursus maritimus) from Svalbard, sampled in 2008.
ID Date Sex Latitude Longitude Age FWCOY
23958 24.04.08 F 78.21 21.94 5 23689 13.04.08 F 79.21 15.85 5 23781 20.04.08 F 77.05 16.99 8 23966 25.04.08 F 77.75 18.48 14 23962 25.04.08 F 77.34 17.77 12 23703 21.04.08 F 78.58 21.00 15 23909 14.04.08 F 79.33 13.93 12 23924 09.04.08 F 79.49 17.96 10 FWOCOY
23802 13.04.08 F 79.01 16.12 9 23831 14.04.08 F 79.66 12.16 6 23881 16.04.08 F 79.65 12.23 6 23931 11.04.08 F 79.69 21.58 8 23882 14.04.08 F 79.61 13.00 6 23719 21.04.08 F 78.52 20.14 7 23500 24.04.08 F 78.12 22.31 10 23942 16.04.08 F 79.75 12.10 11 23637 18.04.08 F 77.07 16.00 7 23714 19.04.08 F 77.74 18.44 8 23731 20.04.08 F 77.04 16.32 8 23824 14.04.08 F 79.73 12.22 14 23945 19.04.08 F 77.55 22.12 9 23688 13.04.08 F 79.08 16.04 12 23948 20.04.08 F 76.72 16.16 16 Males
23834 13.04.08 M 79.30 15.80 9 23683 14.04.08 M 79.63 12.81 6 23921 08.04.08 M 80.62 19.80 11 23922 08.04.08 M 80.25 23.70 8 23682 13.04.08 M 79.01 16.12 16 23946 19.04.08 M 77.77 18.52 15 23686 14.04.08 M 79.54 12.60 7 23949 20.04.08 M 76.72 16.16 10 23960 24.04.08 M 77.39 18.03 15 23575 25.04.08 M 77.46 18.16 12 23830 09.04.08 M 79.97 18.40 13 23899 20.04.08 M 77.04 16.32 13 23825 14.04.08 M 79.45 13.22 14 23820 14.04.08 M 79.63 14.10 16 23809 13.04.08 M 79.10 16.18 17 23702 21.04.08 M 78.58 20.87 21 23855 25.04.08 M 77.73 18.42 15 23609 11.04.08 M 79.69 21.58 19 23898 21.04.08 M 78.58 20.87 10 23934 11.04.08 M 79.77 20.24 4
60
B. Individual biometric measurement
Table B.1: Individual biometric measurements of female (FWCOY and FWOCOY) and male polar bears (Ursus maritimus) from Svalbard, sampled in 2008.
Table C.1: Individual serum 1,25(OH)2D measurements of female (FWCOY and FWOCOY) and male polar bears (Ursus maritimus) from Svalbard, sampled in 2008.
Table D.1: Individual concentrations of Thyroid hormones of female (FWCOY and FWOCOY) and male polar bears (Ursus maritimus) from Svalbard, sampled in 2008.