COMBINED QI NETWORK October 15, 2013 at 2:00 p.m. Ryan White Part A Program Office 115 S. Andrews Ave., Ft. Lauderdale, FL 33301 AGENDA I. Call to Order II. Welcome/Introductions III. Review October 15, 2013 Meeting Agenda and July 16, 2013 Meeting Minutes IV. Health Literacy Quality Improvement Project Development ACTION ITEM: Review findings from health literacy pilot and discuss next steps. I. NQC In+Care Campaign Measures Report ACTION ITEM: Review summary of retention rates and continue discussion of role of Support Services in retention. II. Checklist for Patient Understanding ACTION ITEM: Review and discuss Network recommendations to modify checklist for each service category. III. Viral Load Analysis ACTION ITEM: Review viral load analysis to identify any correlation between viral load suppression and service category. IV. Old/New Business V. Resource Sharing VI. Review Agenda Items for Next Meeting VII. Adjournment Next Meeting Date: January 21, 2013 Broward Regional Health Planning Council, Inc. 200 Oakwood Lane, Suite 100 Hollywood, Florida 33020 T: (954) 561-9681 F: (954) 561-9685
Transcript
Broward Regional Health Planning Council, Inc. 200 Oakwood Lane, Suite 100 Hollywood, Florida 33020 T: (954) 561-9681 F: (954) 561-9685
T
(
9
5
4
)
5
6
1
.
9
6
8
1
F
(
9
5
4
)
5
6
3
4
.
9
6
8
5
COMBINED QI NETWORK October 15, 2013 at 2:00 p.m.
Ryan White Part A Program Office 115 S. Andrews Ave., Ft. Lauderdale, FL 33301
AGENDA
I. Call to Order
II. Welcome/Introductions
III. Review October 15, 2013 Meeting Agenda and July 16, 2013 Meeting Minutes
IV. Health Literacy Quality Improvement Project Development ACTION ITEM: Review findings from health literacy pilot and discuss next steps.
I. NQC In+Care Campaign Measures Report
ACTION ITEM: Review summary of retention rates and continue discussion of role of Support Services in retention.
II. Checklist for Patient Understanding
ACTION ITEM: Review and discuss Network recommendations to modify checklist for each service category.
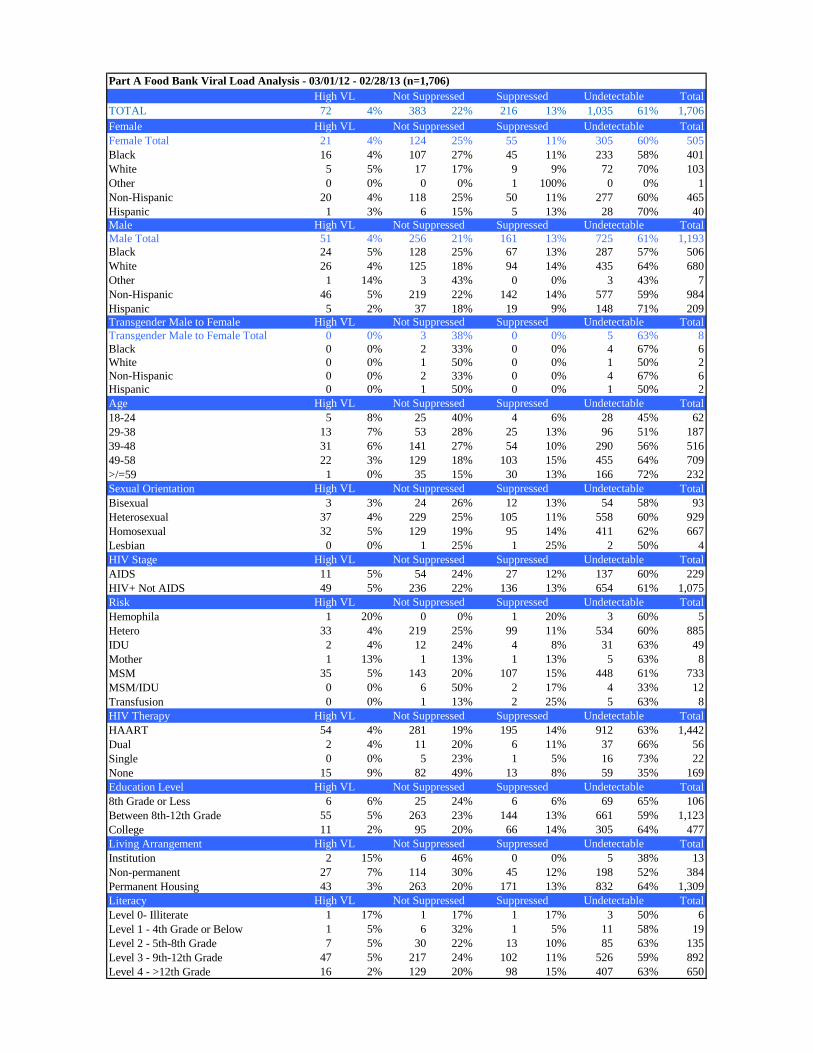
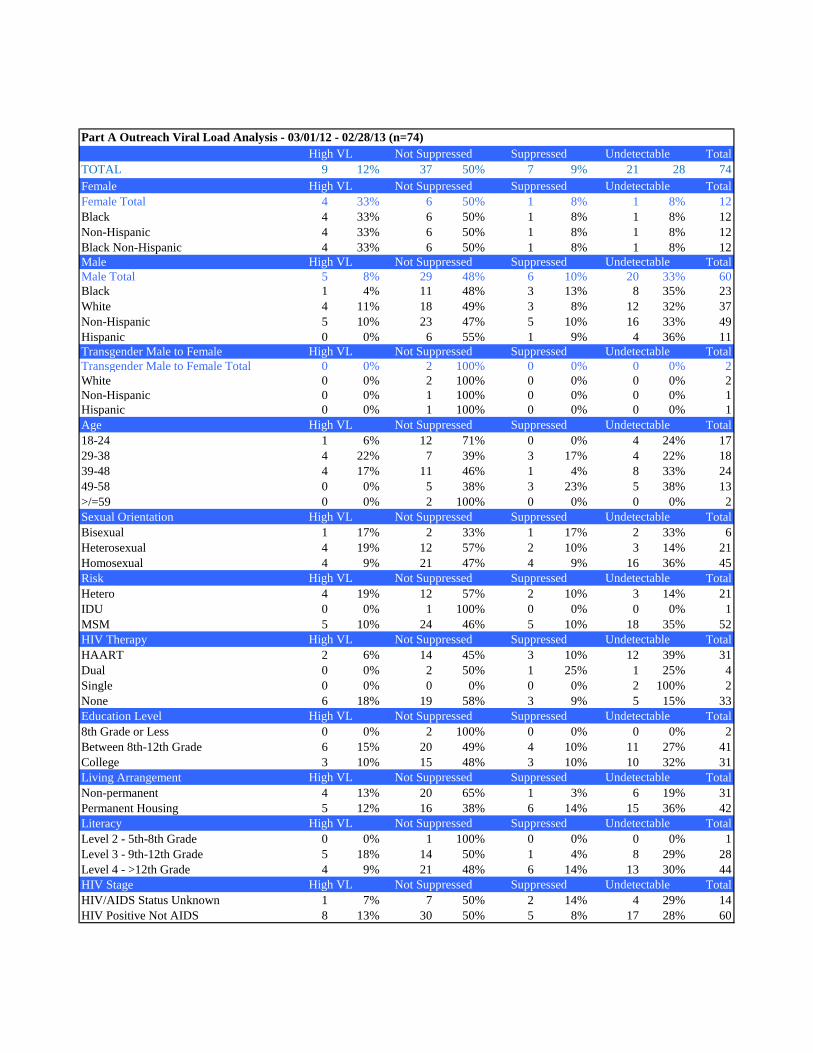
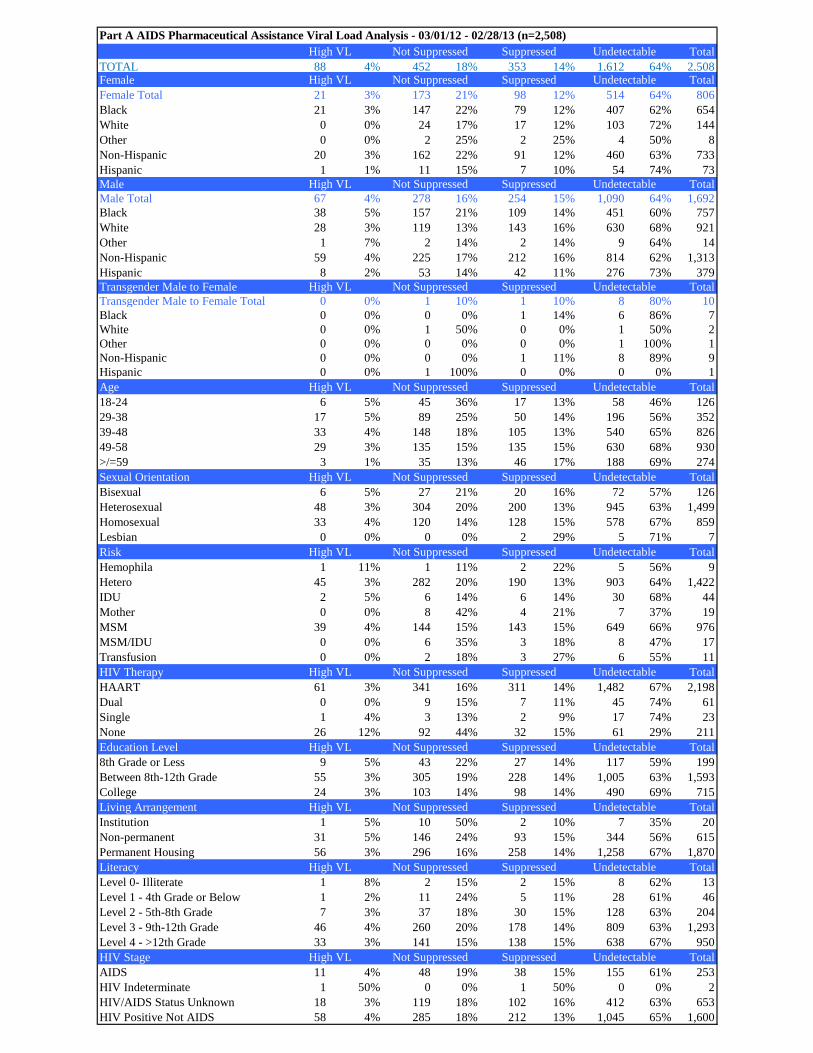
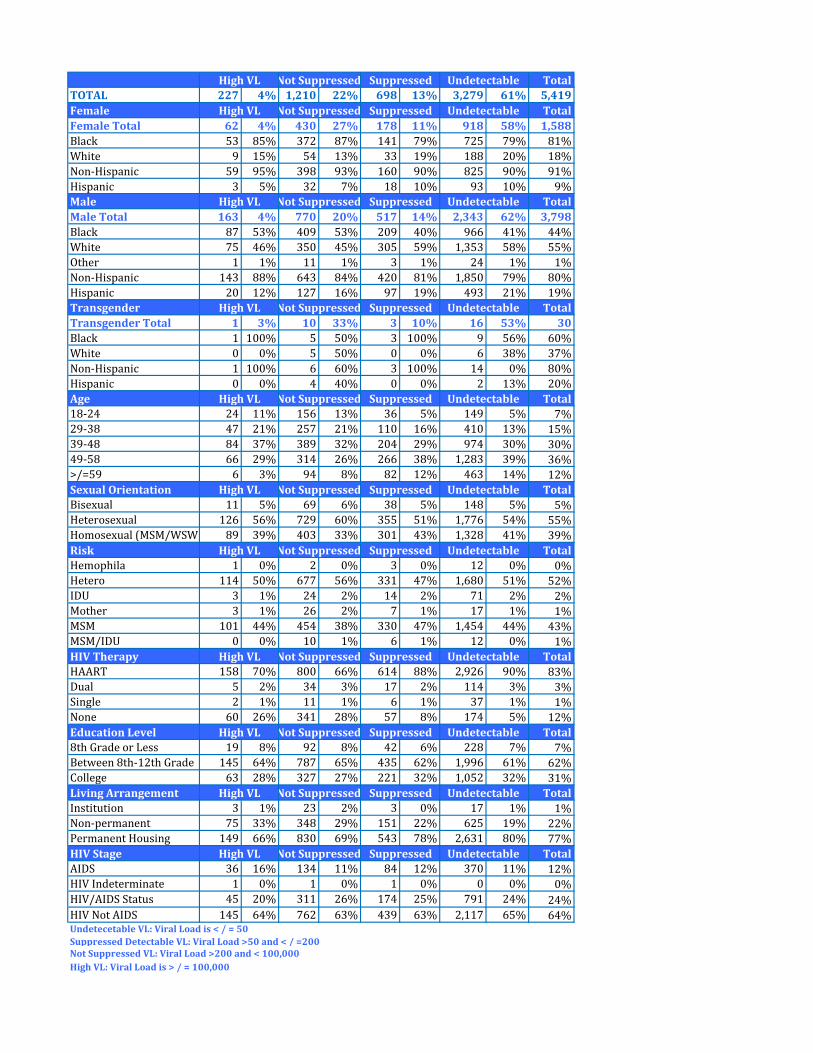
III. Viral Load Analysis
ACTION ITEM: Review viral load analysis to identify any correlation between viral load suppression and service category.
IV. Old/New Business
V. Resource Sharing
VI. Review Agenda Items for Next Meeting
VII. Adjournment
Next Meeting Date: January 21, 2013
Broward Regional Health Planning Council, Inc. 200 Oakwood Lane, Suite 100 Hollywood, Florida 33020 T: (954) 561-9681 F: (954) 561-9685
T
(
9
5
4
)
5
6
1
.
9
6
8
1
F
(
9
5
4
)
5
6
3
4
.
9
6
8
5
COMMUNITY PARTNERSHIPS DIVISION Health Care Services Section 115 S Andrews Avenue, Room A300 • Fort Lauderdale, Florida 33301 • 954-357-5390 • FAX 954-357-5897
Broward County Board of County Commissioners Sue Gunzburger • Dale V.C. Holness • Kristin Jacobs • Chip LaMarca • Ilene Lieberman • Stacy Ritter • John E. Rodstrom, Jr. •Barbara Sharief • Lois Wexler
www.broward.org•
COMBINED QI NETWORK MEETING
July 16, 2013 at 2:00 P.M.
BRHPC, Conference Room
MEETING MINUTES
NETWORK MEMBERS PRESENT
Brad Gammell, Poverello
Kara Schickowski, Legal Aid
Madhurie Angie Maharaj, NBHD
Mike Ehren, BCHD
Natasha Markman, CIED
MEMBERS ABSENT
Mario DeSantis (HOPWA)
CLINICAL QUALITY
MANAGEMENT (CQM)
STAFF
Ariela Eshel
Rachele Solomon
GUESTS
Bonnie Majcher, BCHD
PART A GRANTEE
Kim Strong
Mary Beth Swanson
I. Call to Order
The meeting was called to order at 2:17 PM.
II. Welcome/Introductions
CQM Staff welcomed everyone and individual introductions were made.
III. Review and Approve Agenda
The Network reviewed and approved the July 16, 2013 Meeting Agenda and April 16, 2013 Meeting
Minutes via consensus.
IV. Health Literacy Quality Improvement Project (QIP) Development The Network completed the Network Activity “I Scream, You Scream We All Scream for Ice Cream”, a
short, validated tool for assessing Health Literacy. Members discussed their feelings about completing
the survey and its potential usefulness for assessing client Health Literacy. Members expressed concern
that clients may become frustrated if they are unable to read or do basic math. Members inquired if the
Health Literacy exercise is available in other languages; noted that the assessment is available in English
and Spanish. The Network suggested not translating the label to see how clients adapt when labels are
not in their native language. There was discussion on whether using an over the counter medicine label
would be more effective than the ice cream label. Members noted that the ice cream tool is a validated
tool that focuses on both health literacy and health numeracy.
The Network agreed to pilot the activity at their respective agencies. Members to pilot activity to 20
clients and agency staff beginning August 1, 2013 and ending September 2, 2013. There was a
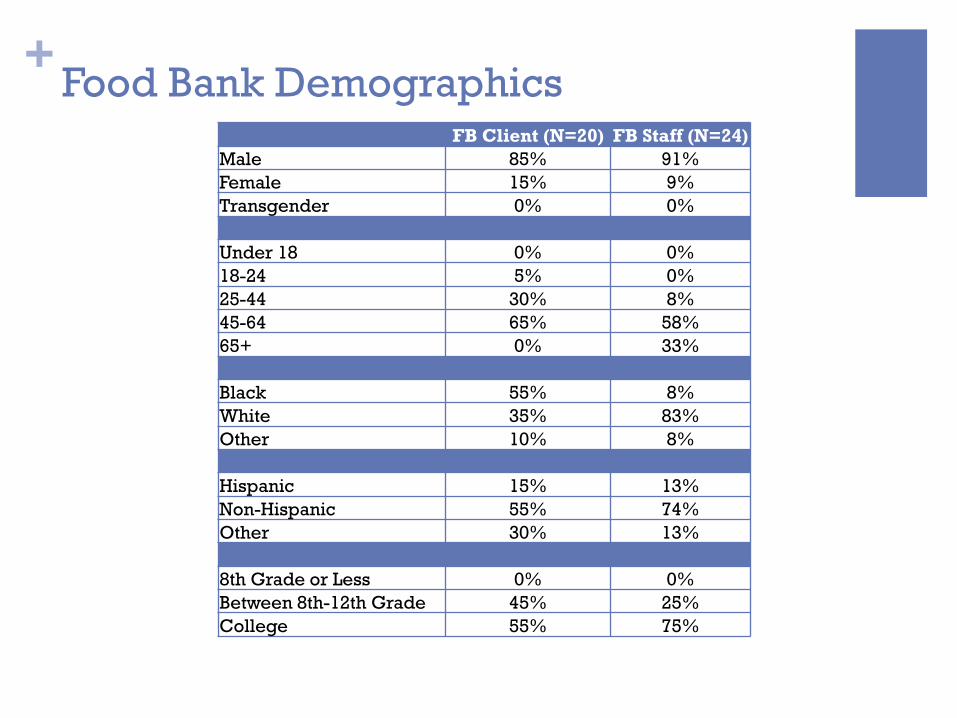
discussion about collecting demographic information from participants. Staff to add demographics: age,
gender, race, ethnicity, and education level to the activity. Members suggested adding a question at the
end of the activity to gauge participants’ comfort level while participating in the activity. Staff to add
Page 2 of 2
the question “How comfortable did you feel doing this exercise?” at the end of the activity as well as a
drop down menu for participants to select agency affiliation for both staff and clients.
There was discussion on ways to introduce the health literacy assessment to clients; Members agreed
that a small introduction would be beneficial. Agency to provide questions and correct answers to
participants following the assessment. Once assessment is complete, report to be provided for each
service category. Staff to send ice cream label, instructions, and questions electronically to Network by
Friday July 19, 2013.
The Network reviewed the handout: Checklist for Patient Understanding (copy on file). There was a
discussion about possibly modifying the handout for each service category. Members were asked to
review the document and determine how they would recommend modifying the checklist for their
service category. Network to review handout and be prepared to discuss possible modifications at the
next meeting.
V. Data Review In+Care Campaign The Network reviewed the In+Care Campaign Measures Report (copy on file). Members were informed
of the Medical Case Management QIP to review data and identify clients at risk of being lost to care.
VI. Old/New Business
There was a discussion on how service category specific viral loads are run in Provide Enterprise (PE);
noted that service category specific viral loads will not be unduplicated. There was discussion on the
importance of establishing a community viral load. Staff to bring service category specific viral loads to
the next meeting.
VII. Resource Sharing
Network provided with a copy of PROACT’s modified DOT referral program information (copy on
file); Members asked to consider any clients that could benefit from this program. Staff to send
information to all QI Networks.
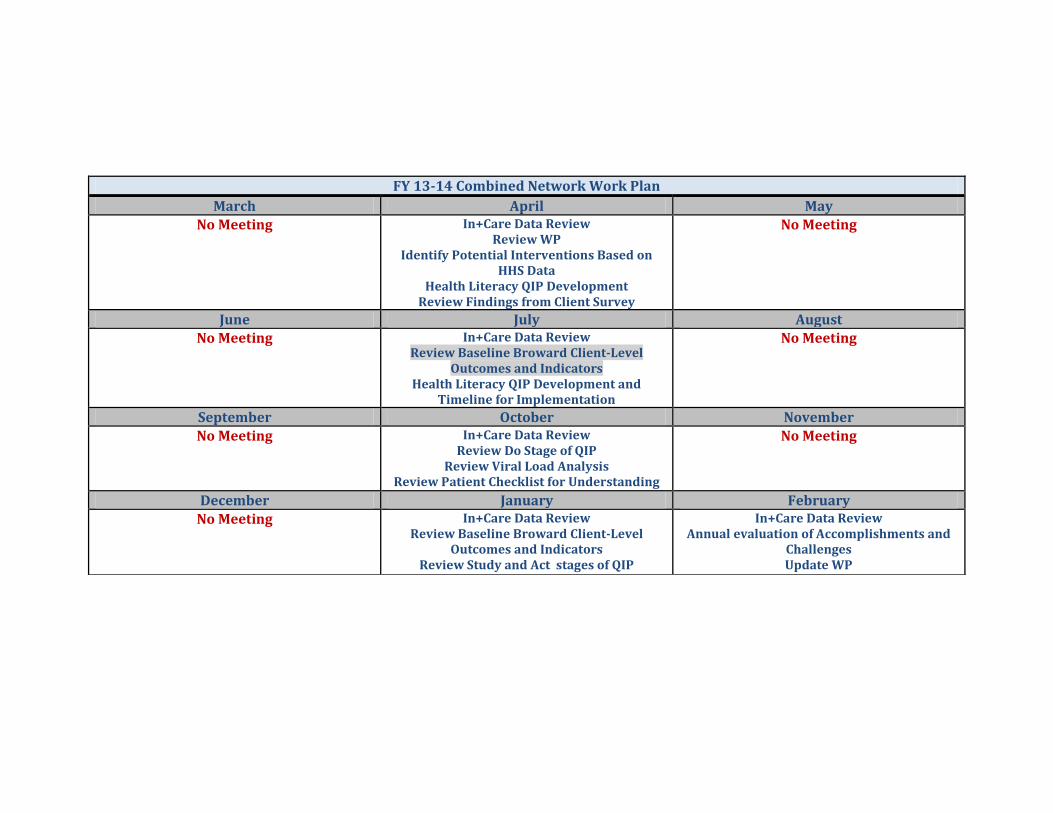
VIII. Review Agenda Items for Next Meeting
Standing Agenda Items
Health Literacy QIP Development
Viral Load Analysis
Checklist for Patient Understanding
IX. Next Meeting: October 15, 2013 at 2:00 PM
X. Adjournment: Meeting was adjourned at 3:45 PM
+
I Scream, You Scream, We All Scream
for Ice Cream
RESULTS
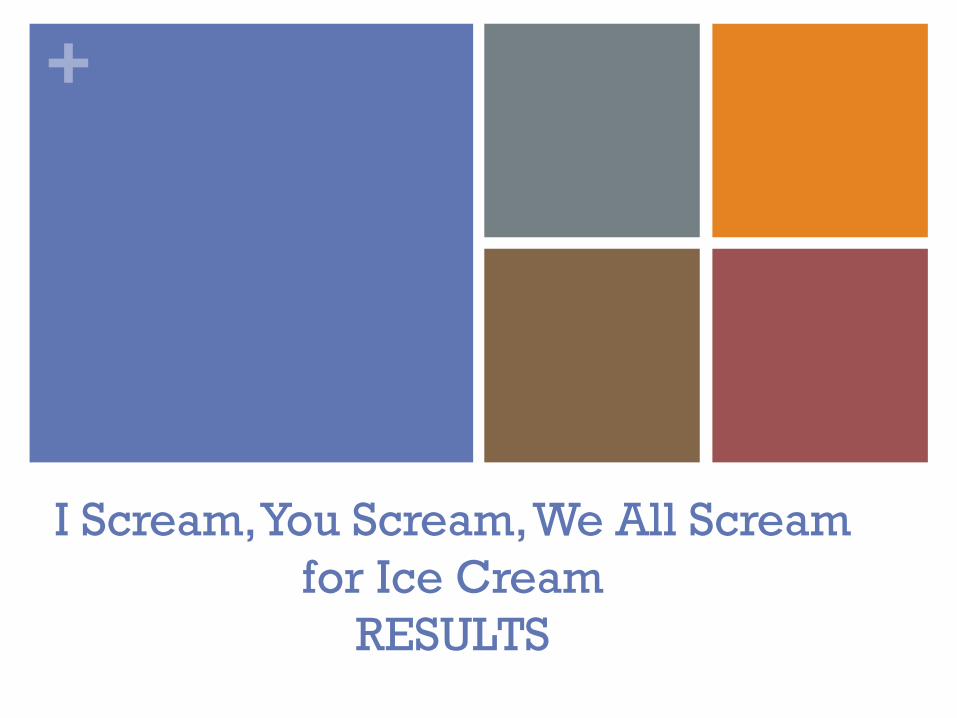
+ Health Literacy - The Newest Vital Sign
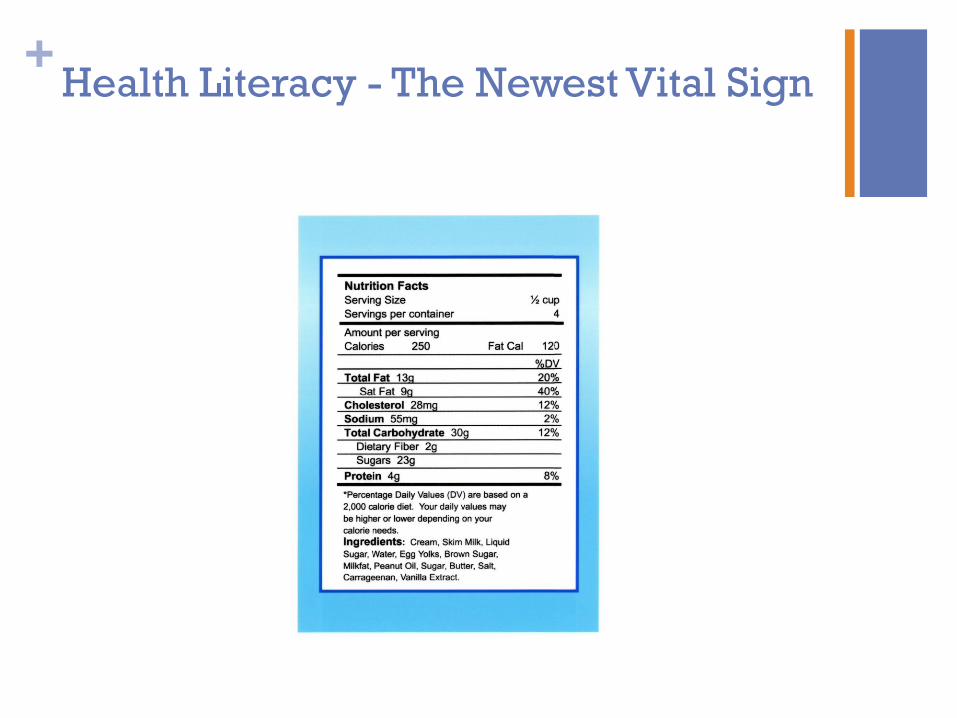
+ Score Sheet for the Newest Vital Sign
1. If you eat the entire container, how many calories will you eat?
Answer: 1,000 is the only correct answer
2. If you are allowed to eat 60 grams of carbohydrates as a snack, how much ice cream could you have?
Answer: Any of the following is correct: 1 cup (or any amount up to 1 cup), half the container. Note: If patient answers “two servings,” ask “How much ice cream would that be if you were to measure it into a bowl?”
3. Your doctor advises you to reduce the amount of saturated fat in your diet. You usually have 42 g of saturated fat each day, which includes one serving of ice cream. If you stop eating ice cream, how many grams of saturated fat would you be consuming each day?
Answer: 33 is the only correct answer
4. If you usually eat 2,500 calories in a day, what percentage of your daily value of calories will you be eating if you eat one serving?
Answer: 10% is the only correct answer
READ TO SUBJECT: Pretend that you are allergic to the following substances: penicillin, peanuts, latex gloves, and bee stings.
5. Is it safe for you to eat this ice cream?
Answer: No
6. (Ask only if the patient responds “no” to question 5): Why not?
Answer: Because it has peanut oil.
+ Score Interpretation
Number of correct answers: Tally up ‘Yes’ answers
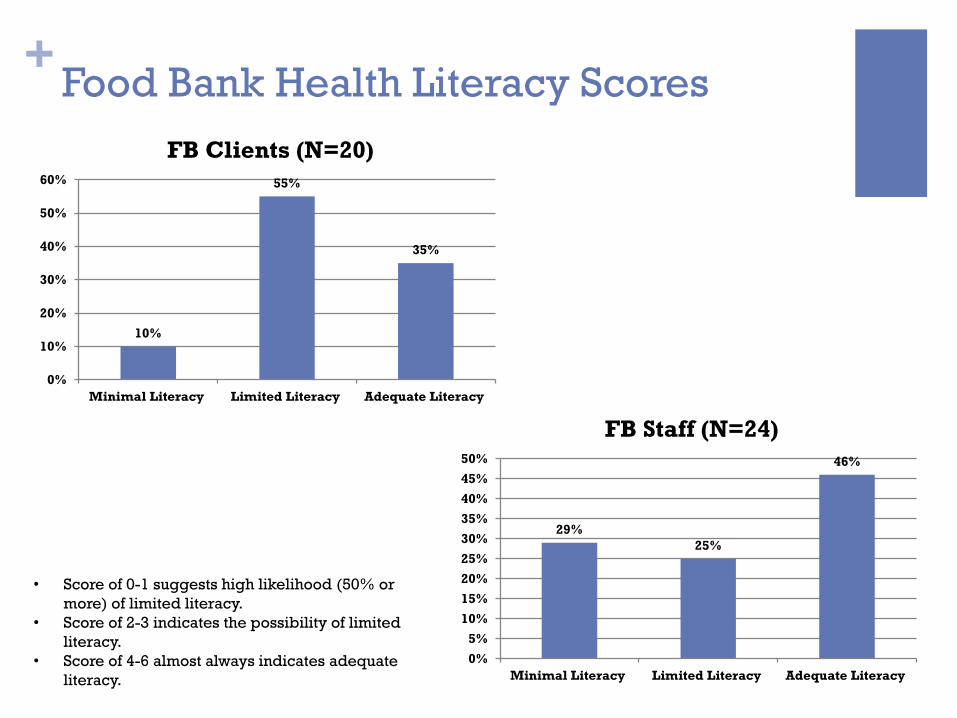
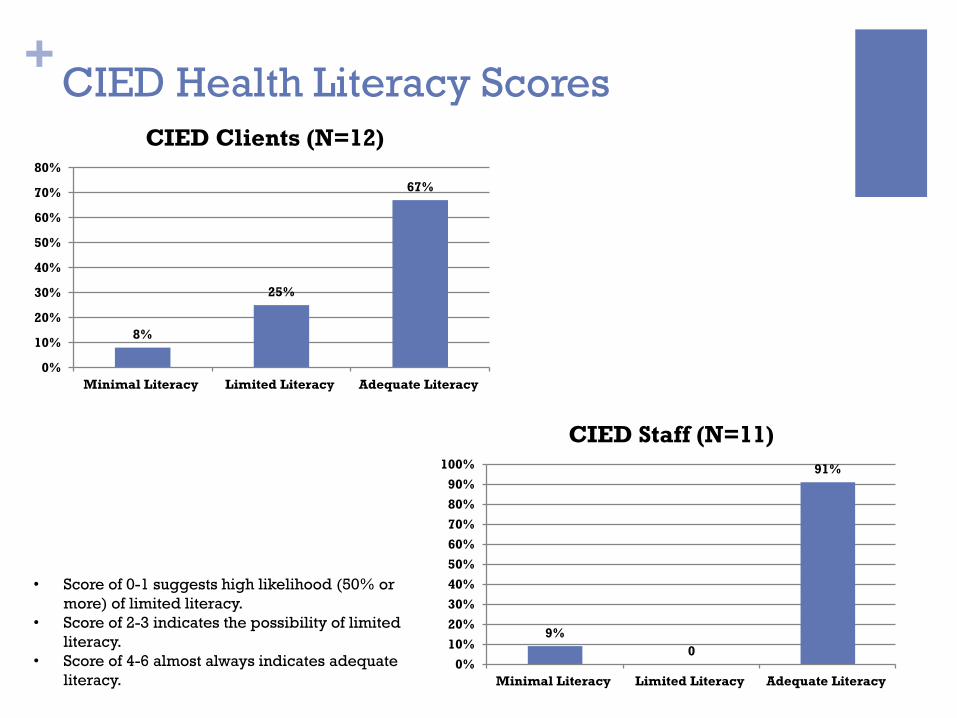
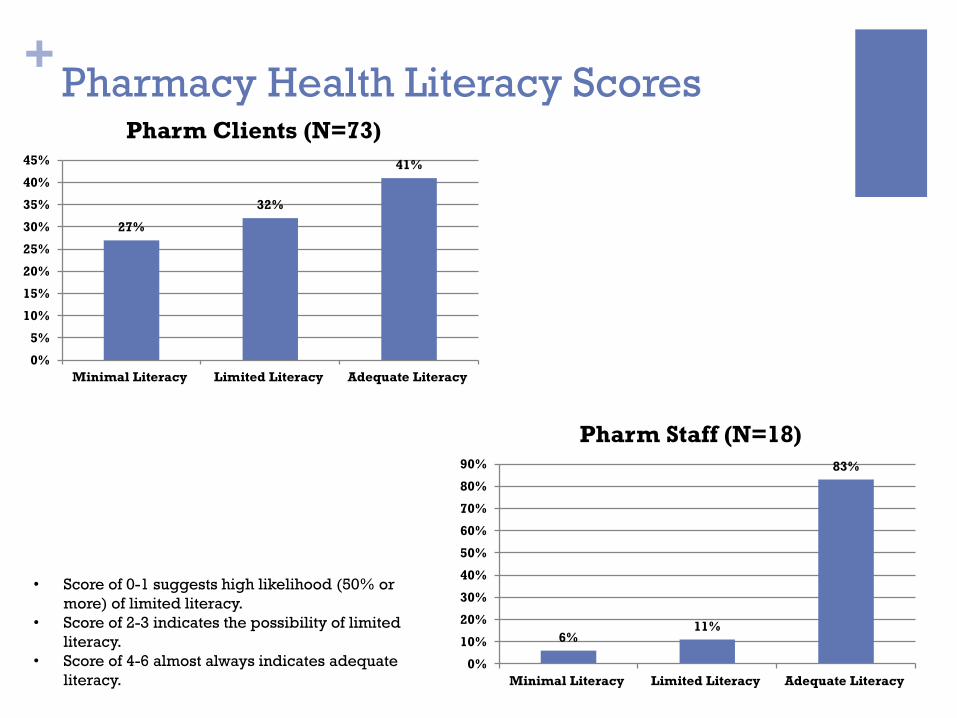
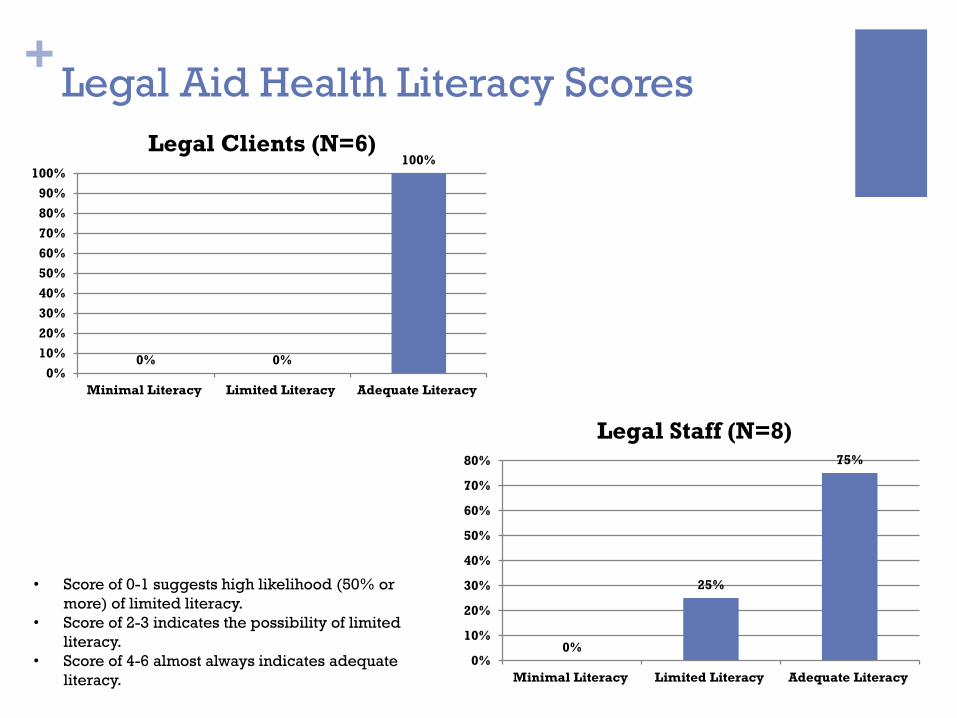
Score of 0-1 suggests high likelihood (50% or more) of
limited literacy.
Score of 2-3 indicates the possibility of limited literacy.
Score of 4-6 almost always indicates adequate literacy.
+ All Respondents - % Correct
69.20%
68.70%
63.90%
64.90%
66.30%
Overall (N=172)
Question 1
Question 2
Question 3
Question 4
Question 5
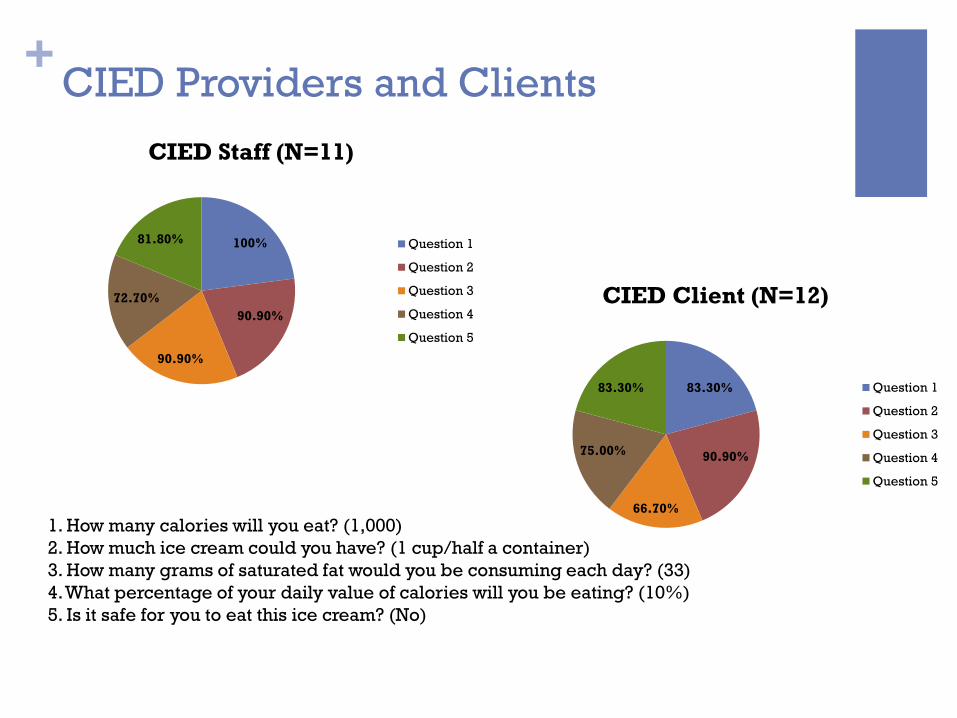
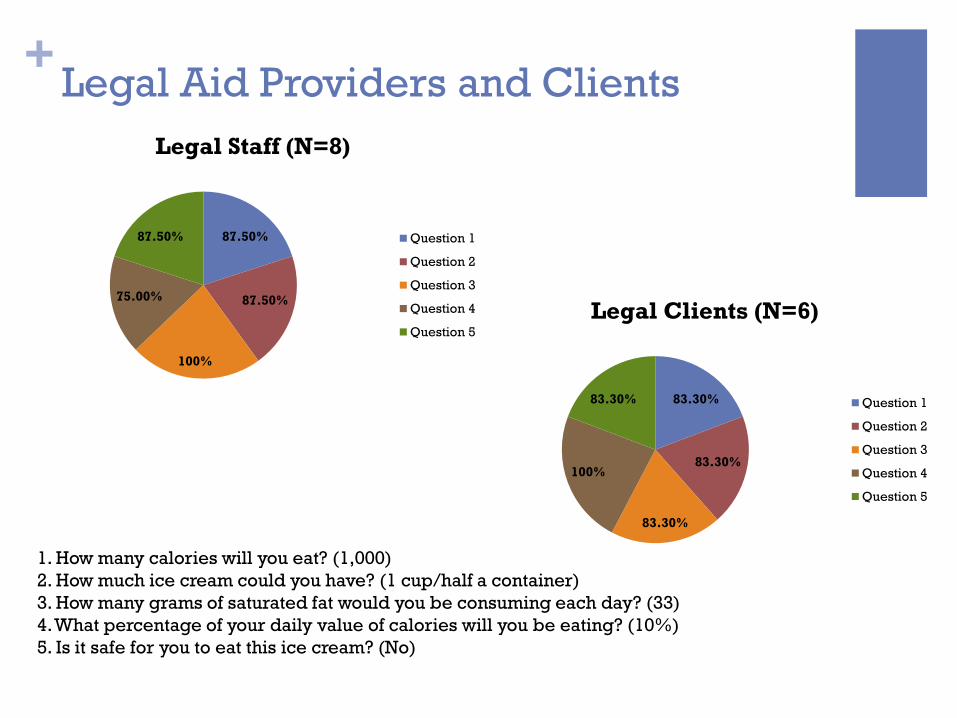
1. How many calories will you eat? (1,000)
2. How much ice cream could you have? (1 cup/half a container)
3. How many grams of saturated fat would you be consuming each day? (33)
4. What percentage of your daily value of calories will you be eating? (10%)
5. Is it safe for you to eat this ice cream? (No)
+ Demographics
All Respondents (N=172)
Male 57%
Female 40%
Transgender 2%
Under 18 2%
18-24 7%
25-44 34%
45-64 51%
65+ 6%
Black 42%
White 44%
Other 14%
Hispanic 14%
Non-Hispanic 60%
Other 27%
8th Grade or Less 2%
Between 8th-12th Grade 40%
College 58%
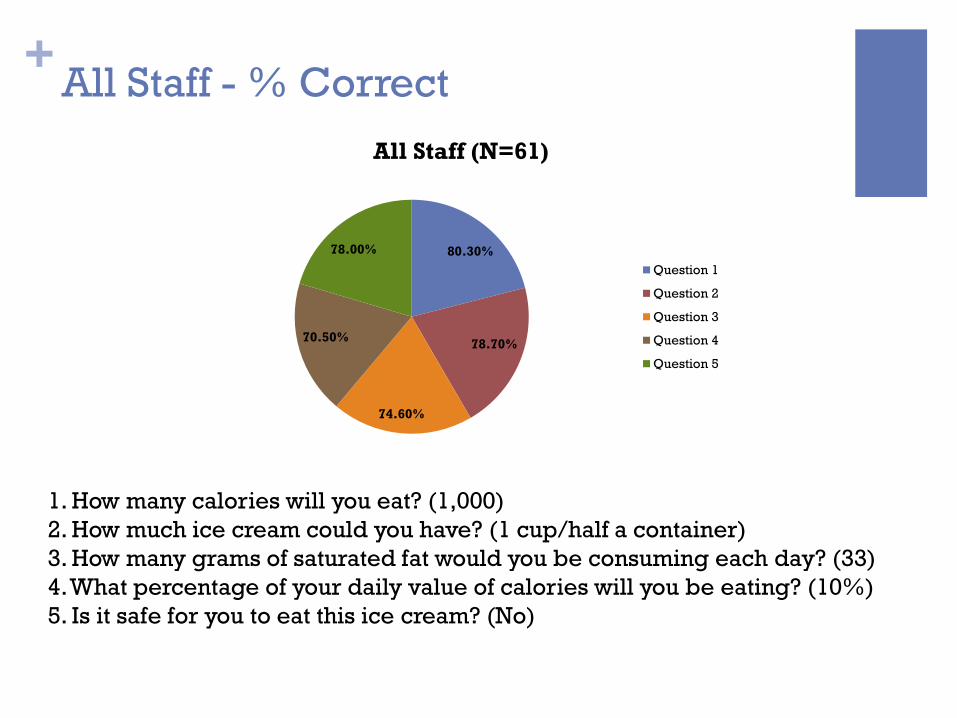
+ All Staff - % Correct
80.30%
78.70%
74.60%
70.50%
78.00%
All Staff (N=61)
Question 1
Question 2
Question 3
Question 4
Question 5
1. How many calories will you eat? (1,000)
2. How much ice cream could you have? (1 cup/half a container)
3. How many grams of saturated fat would you be consuming each day? (33)
4. What percentage of your daily value of calories will you be eating? (10%)
5. Is it safe for you to eat this ice cream? (No)
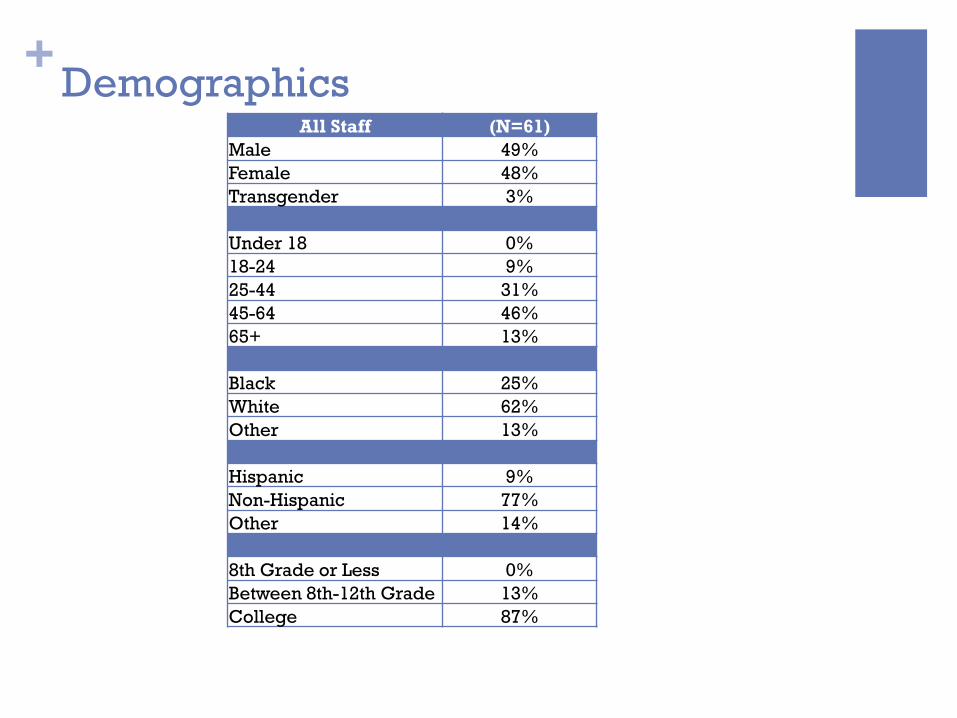
+ Demographics
All Staff (N=61)
Male 49%
Female 48%
Transgender 3%
Under 18 0%
18-24 9%
25-44 31%
45-64 46%
65+ 13%
Black 25%
White 62%
Other 13%
Hispanic 9%
Non-Hispanic 77%
Other 14%
8th Grade or Less 0%
Between 8th-12th Grade 13%
College 87%
+ All Clients - % Correct
61.80%
63.60%
54.60%
61.30%
60.00%
All Clients (N=111)
Question 1
Question 2
Question 3
Question 4
Question 5
1. How many calories will you eat? (1,000)
2. How much ice cream could you have? (1 cup/half a container)
3. How many grams of saturated fat would you be consuming each day? (33)
4. What percentage of your daily value of calories will you be eating? (10%)
5. Is it safe for you to eat this ice cream? (No)
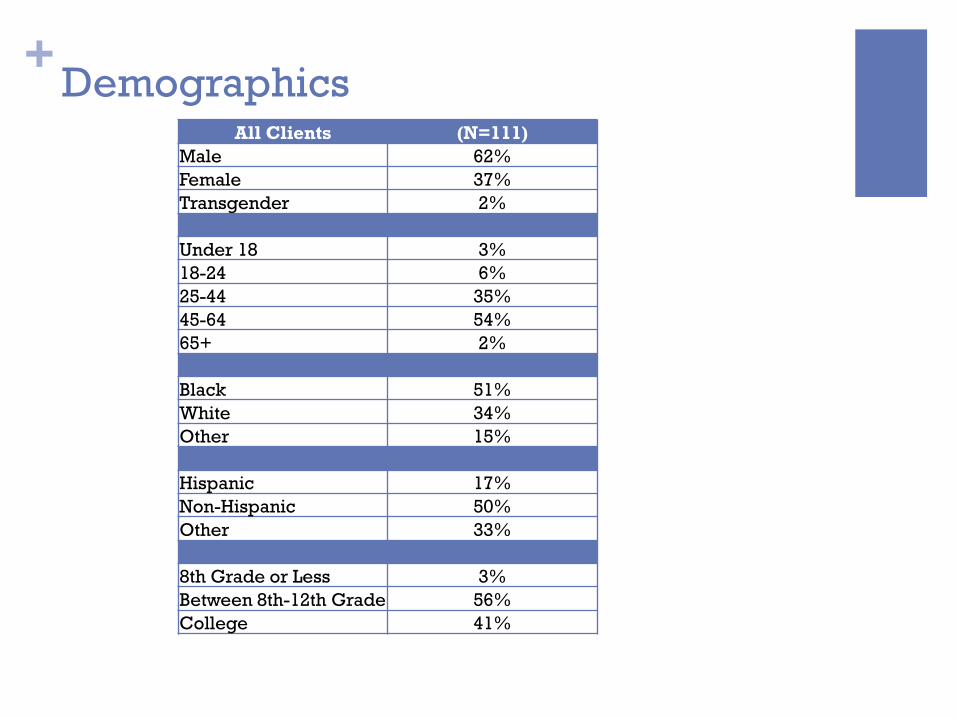
+ Demographics
All Clients (N=111)
Male 62%
Female 37%
Transgender 2%
Under 18 3%
18-24 6%
25-44 35%
45-64 54%
65+ 2%
Black 51%
White 34%
Other 15%
Hispanic 17%
Non-Hispanic 50%
Other 33%
8th Grade or Less 3%
Between 8th-12th Grade 56%
College 41%
+
Clients and Staff
% Correct
and
Health Literacy Scores
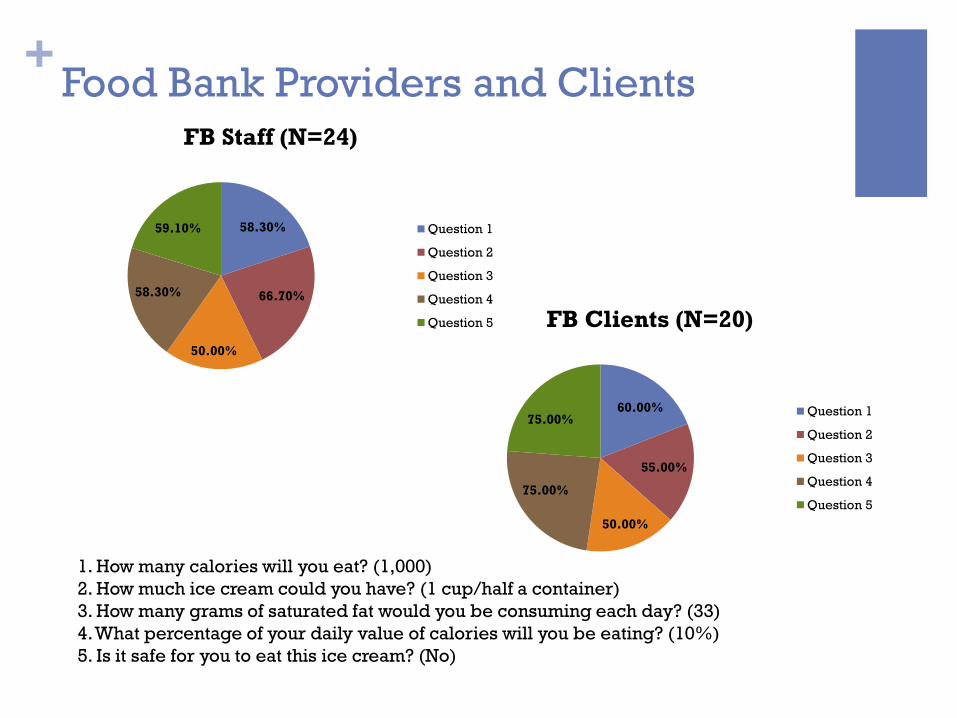
+ Food Bank Providers and Clients
58.30%
66.70%
50.00%
58.30%
59.10%
FB Staff (N=24)
Question 1
Question 2
Question 3
Question 4
Question 5
60.00%
55.00%
50.00%
75.00%
75.00%
FB Clients (N=20)
Question 1
Question 2
Question 3
Question 4
Question 5
1. How many calories will you eat? (1,000)
2. How much ice cream could you have? (1 cup/half a container)
3. How many grams of saturated fat would you be consuming each day? (33)
4. What percentage of your daily value of calories will you be eating? (10%)
• Score of 2-3 indicates the possibility of limited
literacy.
• Score of 4-6 almost always indicates adequate
literacy.
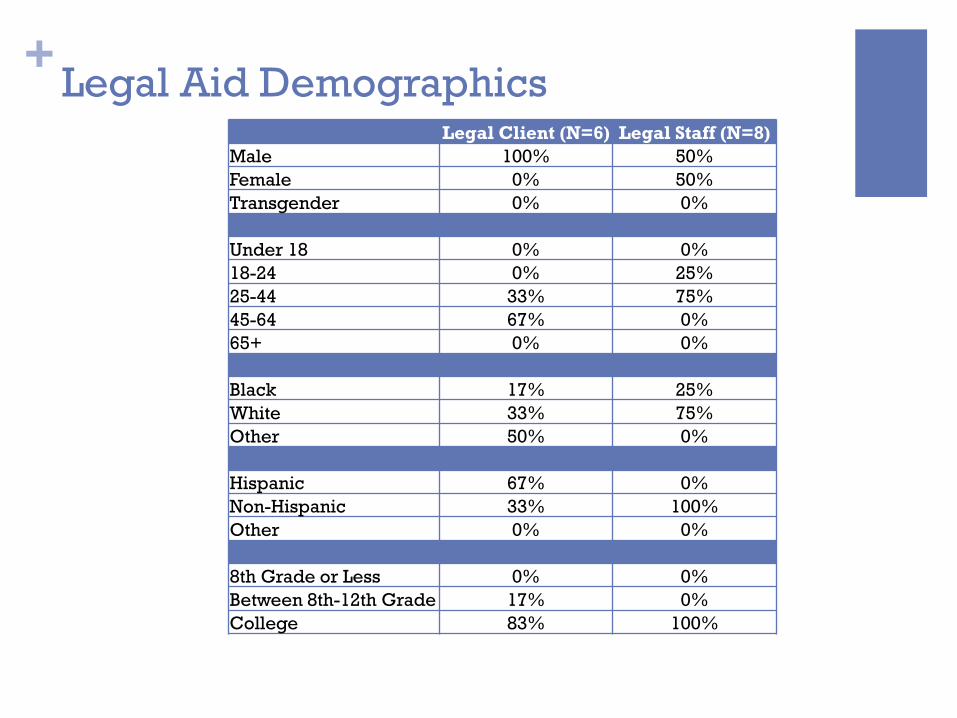
+ Legal Aid Demographics
Legal Client (N=6) Legal Staff (N=8)
Male 100% 50%
Female 0% 50%
Transgender 0% 0%
Under 18 0% 0%
18-24 0% 25%
25-44 33% 75%
45-64 67% 0%
65+ 0% 0%
Black 17% 25%
White 33% 75%
Other 50% 0%
Hispanic 67% 0%
Non-Hispanic 33% 100%
Other 0% 0%
8th Grade or Less 0% 0%
Between 8th-12th Grade 17% 0%
College 83% 100%
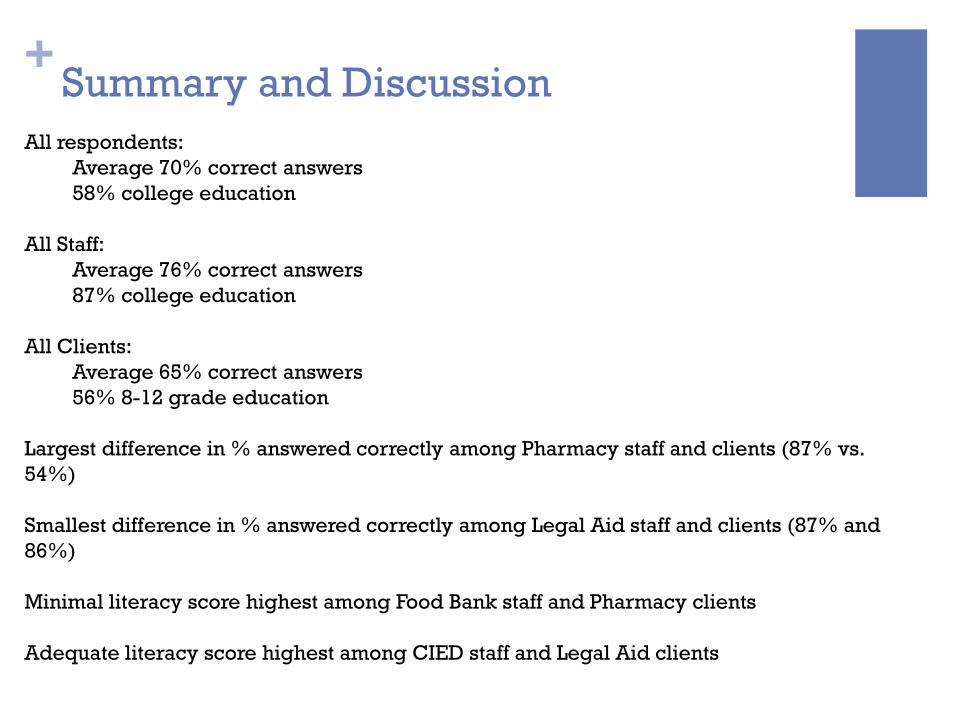
+ Summary and Discussion
All respondents:
Average 70% correct answers
58% college education
All Staff:
Average 76% correct answers
87% college education
All Clients:
Average 65% correct answers
56% 8-12 grade education
Largest difference in % answered correctly among Pharmacy staff and clients (87% vs.
54%)
Smallest difference in % answered correctly among Legal Aid staff and clients (87% and
86%)
Minimal literacy score highest among Food Bank staff and Pharmacy clients
Adequate literacy score highest among CIED staff and Legal Aid clients
NQC In+Care Retention Rates
1
IN+CARE CAMPAIGN RETENTION MEASURES
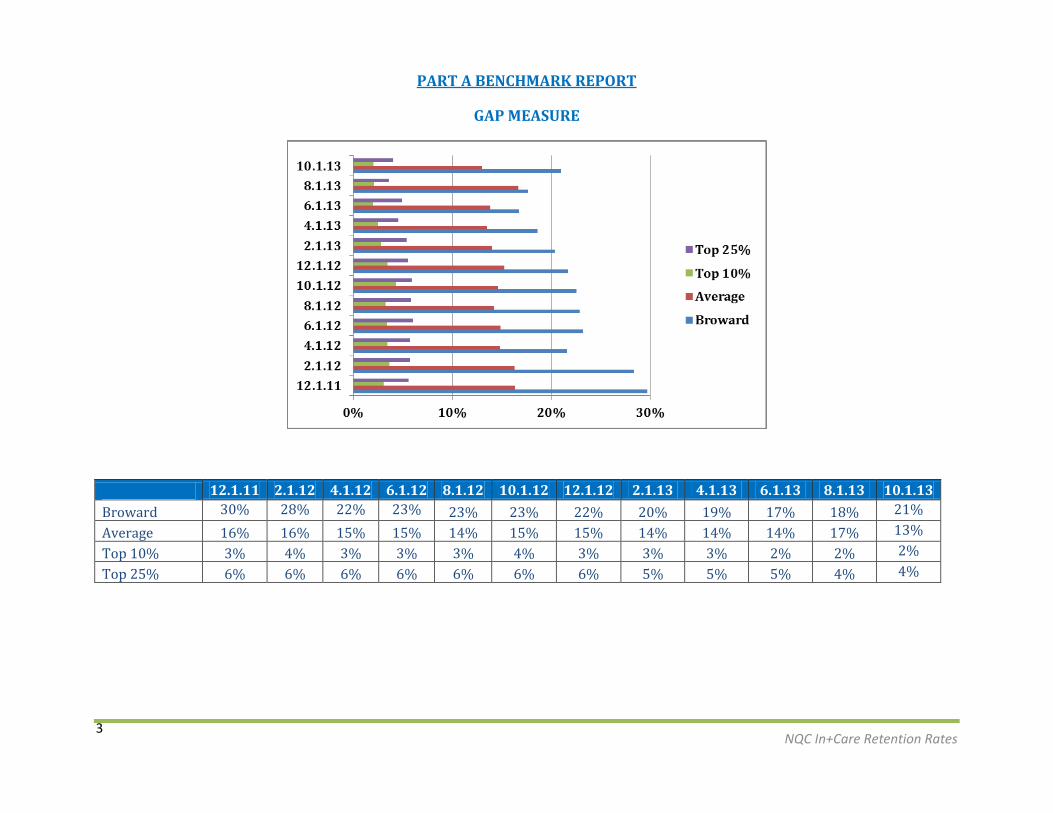
Gap Measure Percentage of patients, regardless of age, with a diagnosis of HIV/AIDS who did not have a medical visit with a provider with prescribing privileges in the last 6 months of the measurement year.
Medical Visit Frequency Percentage of patients, regardless of age, with a diagnosis of HIV/AIDS who had at least one medical visit with a provider with prescribing privileges in each 6-month period of the 24-month measurement period with a minimum of 60 days between medical visits.
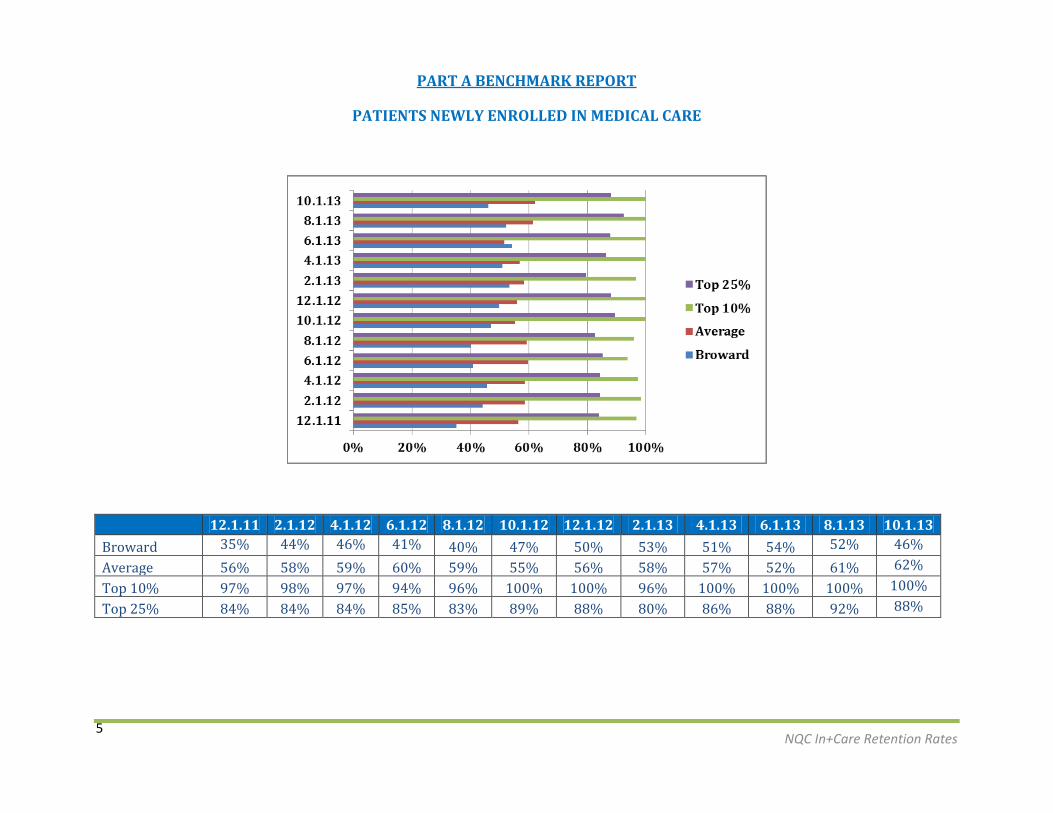
Patients Newly Enrolled in Medical Care Percentage of patients, regardless of age, with a diagnosis of HIV/AIDS who were newly enrolled with a medical provider with prescribing privileges who had a medical visit in each of the 4-month periods in the measurement year.
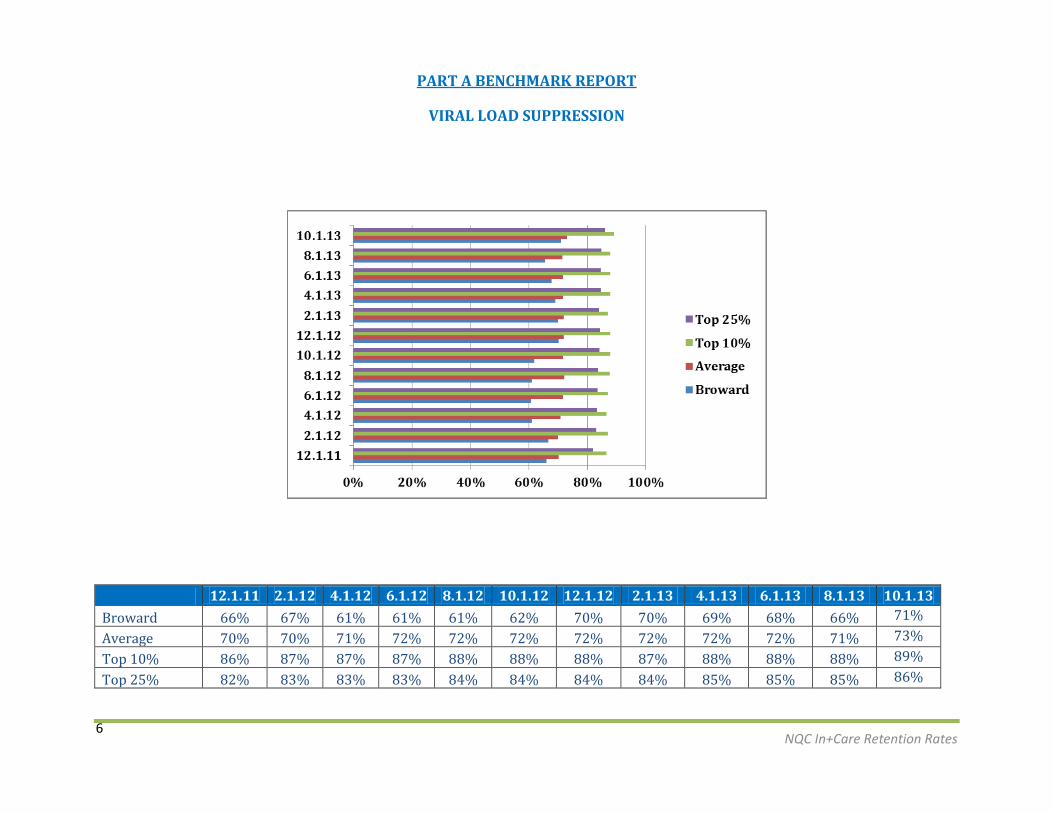
Viral Load Suppression Percentage of patients, regardless of age, with a diagnosis of HIV/AIDS with a viral load less than 200 copies/mL at last viral load test during the measurement year.
DATA SUBMISSION DATES
Submission Due Date Measurement Year* 24 Month Measurement Period** 12/01/2011 10/01/2010 - 09/30/2011 10/01/2009 - 09/30/2011
*applies to the following measures: Gap Measure, Patients Newly Enrolled in Medical Care, and Viral Load Suppression ** applies to the Medical Visit Frequency measure
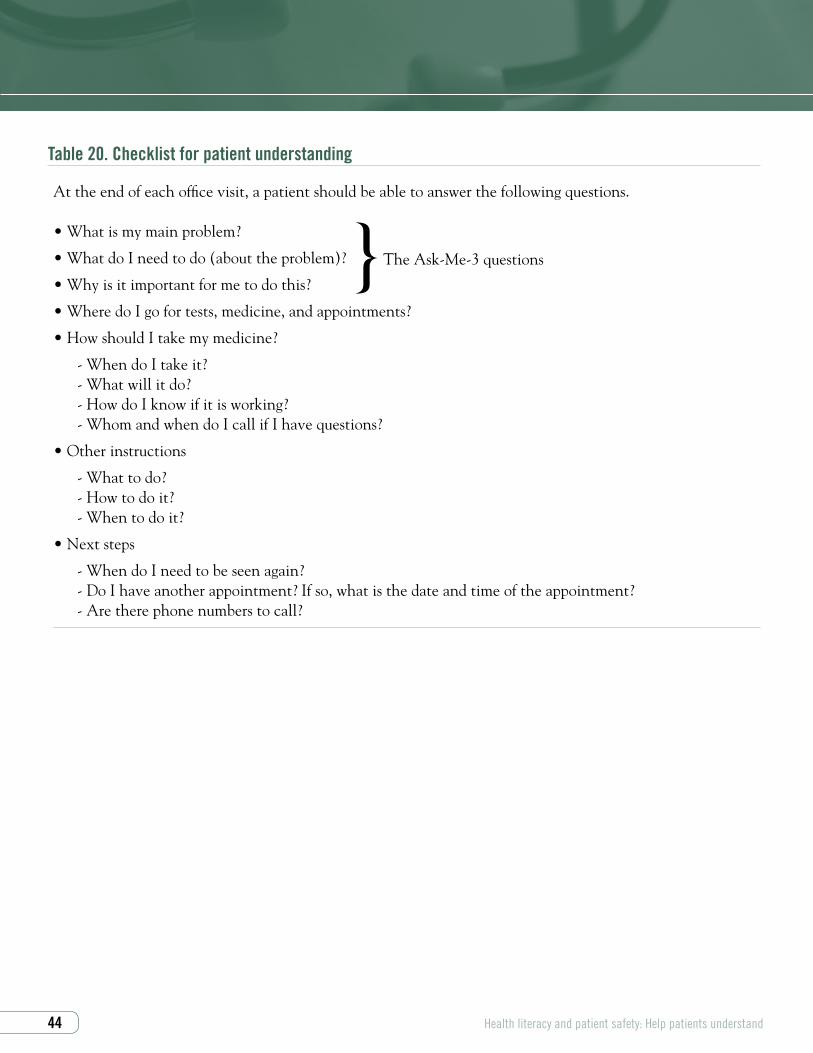
At the end of each office visit, a patient should be able to answer the following questions.
• What is my main problem?
• What do I need to do (about the problem)?
• Why is it important for me to do this?
• Where do I go for tests, medicine, and appointments?
• How should I take my medicine?
- When do I take it?- What will it do?- How do I know if it is working?- Whom and when do I call if I have questions?
• Other instructions
- What to do?- How to do it?- When to do it?
• Next steps
- When do I need to be seen again?- Do I have another appointment? If so, what is the date and time of the appointment? - Are there phone numbers to call?
�� Health literacy and patient safety: Help patients understand