151
THESIS ON CIVIL AND ENVIRONMENTAL ENGINEERING F8 Combined treatment of sulfate-rich molasses wastewater from yeast industry Technology optimization SERGEI ZUB TTÜ PRESS
THESIS ON CIVIL AND ENVIRONMENTAL ENGINEERING F8
Combined treatment of sulfate-rich molasses wastewater from yeast industry
Technology optimization
SERGEI ZUB
TTÜ
PRESS

2
Faculty of Civil Engineering Department of Environmental Engineering
TALLINN UNIVERSITY OF TECHNOLOGY
Dissertation was accepted for the defence of the degree of Doctor of Philosophy in Engineering on October 11, 2007
Supervisor: Ph.D. Viktorija Blonskaja, Faculty of Civil Engineering, Tallinn University of Technology
Opponents: Assoc. Prof. Dr. Marina Valentukeviciene, Temp Head of Water Management Department Environmental Engineering Faculty Vilnius Gediminas Technical University, Lithuania Prof. Dr. Rein Munter, Tallinn University of Technology, Estonia
Defence of the thesis: December 3, 2007
Declaration
I declare that the current thesis is my original and unaided work. It is being submitted for the Degree of Doctor of Philosophy in Engineering Sciences at the Tallinn University of Technology, Tallinn, Estonia. It has not been submitted for any degree or examination in any other university.
Signature of the candidate:
Date: 15 October 2007
Copyright: Sergei Zub, 2007
ISSN 1406-4766
ISBN 978-9985-59-737-8

3
KOKKUVÕTE
Pärmitööstuse sulfaatiderikka melassijäägi kombineeritud töötlemine
Käesoleva uurimuse põhiline eesmärk oli edasi arendada optimaalne skeem ja tööparameetrid sulfaatide eemaldamiseks ja sulfiidide inhibeeriva mõju vältimiseks AS Salutaguse Pärmitehase pärmireovee anaeroobsel töötlemisel. Käesolev töö viidi läbi, kasutades uuringuid AS Salutaguse Pärmitehase sulfaatiderikka reovee anaeroobse/aeroobse töötluse tööstusliku skeemi välja-arendamise ja juurutamise kohta, uuringuid pagaripärmi reovett töötleva anaeroobse laboratoorse annuspuhasti kohta, uuringuid anaeroobse bioreaktori modifikatsiooni kohta, parandamaks biomassi viibeaega muda degaseerimise tehnoloogia juurutamise teel ning uuringuid osooni ja koagulantide kasutus-võimaluste kohta bioloogiliselt eelkäideldud pärmireovee järeltöötlusel. Tehti kindlaks, et annuspuhasti protsessiga võrreldes on kombineeritud anaeroob-sel/anoksilisel protsessil paremad käidutingimused ja parem sulfaatiderikka reovee puhastusefektiivsus. Laboratoorse annuspuhasti skeemiga saavutati stabiilne KHT eemaldamise efektiivsus (umbes 80%), kui rakendatav orgaani-line koormus varieerus piirides 7,7 kuni 8,0 kg KHT m-3 päev-1. Mõlema puhastusskeemiga saadud katsetuste tulemusena leiti sulfaatide eemaldamise ja sulfiidide inhibeeriva toime vältimise tööparameetrid anaeroobsel töötlusel ning kohandati need tööstuslikule reoveepuhastile, kasutades olemasolevat apara-tuuri. Melassi töötlemise reovesi sisaldab suures koguses värvilisi ühendeid (melanoidiine jms), mis annavad reoveele tumepruuni värvuse ja suure orgaanilise koormuse. Bioloogiliselt eelkäideldud pagaripärmi reovee järeltöötluse katsetes uuriti koagulatsiooni astet ja osoneerimise mõju reovee kvaliteedile. Katsetuste käigus tehti kindlaks, et bioloogiliselt eelkäideldud pärmi reovee järelosoneerimise tulemuseks oli KHT alanemine 30-49% ning tarbitud osooni annus (mg osooni mg eemaldatud KHT kohta) oli vahemikus 1,2 kuni 2,5. Reovee bioloogiline lagundadatus, väljendatuna BHT ja KHT vahelise suhtega, osoneerimiskatsete vältel üldiselt suurenes. Koagulatsiooni astmes (Fe3+ ja Al3+ ) oli võimalik saavutada märkimisväärne värviliste ühendite sisalduse vähenemine (kuni 90%). Lisaks värvuse eemaldamisele oli raua (200 mg L-1) ja alumiiniumi (400 mg-1) abil võimalik oluliselt eemaldada ka KHT (40-61%), lämmastikku (74-76%) ja fosforit (kuni 78%). Üritati parandada anaeroobse reaktori toimimist ja vältida kõrgetest tipukoormustest tingitud sette väljapesemist. Arendati välja sobiv meetod, mis aitab säilitada biomassi anaeroobses reaktoris ja katsetati seda tööstuslikus süsteemis. Anaeroobne muda degaseerimise seade võimaldas tõsta orgaanilist tipukoormust kuni 17,8 kg KHTm-3d-1 ilma metanogeenset protsessi häirimata. Märksõnad: aktiivmuda vaakumtöötlus, anaeroobne, betaiin, biogaas, järelpu-hastus, koaguleerimine, melanoidiinid, melassijääk, osoneerimine, suhkrupeedi melass, sulfaate redutseerivad bakterid.
4
ABSTRACT
Combined treatment of sulfate-rich molasses wastewater from yeast industry
The main purpose of the present study was to develop further optimal setup and operational parameters for removing of sulfates and avoiding inhibitory effects of sulfides in anaerobic treatment of yeast wastewaters at Salutaguse Yeast factory, Estonia. Present work was carried out using the studies on development and introducing of full-scale anaerobic/anoxic treatment scheme of sulfate-rich wastewater at Salutaguse Yeast Factory, Estonia, lab-scale anaerobic Sequence Batch Reactor (SBR) treating baker’s yeast effluent, modification of anaerobic biorector to improve biomass retention by introducing sludge de-gassing technology and possibilities of using ozone and coagulants for post-treatment of biologically pre-treated yeast wastewater. It was established that compared to SBR process, the combined anaerobic/anoxic process indicates better operation results and treatment efficiency for purification sulfate rich wastewater. Lab-scale anaerobic SBR scheme demonstrated stable COD removal efficiency (about 80%) when applied organic loading rate varied between 7.7 and 8.0 kgCODm-3d-1. Full scale combined anaerobic/anoxic demonstrated similar COD removal efficiency with applied loading of 12.0-16.0 kgCODm-3d-1. As the result of experimental studies with both purification schemes the operational parameters for removing of sulfates and avoiding inhibitory effects of sulfides in anaerobic treatment were found and adopted at full-scale wastewater treatment plant using existing equipment. Wastewater from molasses processing presents a large amount of colored substances (melanoidins, etc.) that give dark brown color and high organic load to the effluents. In the experiments with post-treatment of biologically pre-treated baker’s yeast wastewater effluent, coagulation step and ozonation impact on effluent quality were studied. During experimental studies it was established that the post-ozonation of biologically treated yeast wastewater resulted in the reduction of COD by 30–49%, and the consumed ozone dosage (mg ozone per mg of COD removed) ranged from 1.2 to 2.5. The biodegradability of the wastewater, expressed as BOD/COD ratio, generally increased during the ozonation tests. During coagulation step (Fe3+ and Al3+) significant decrease of color substances could be achieved (up to 90%). In addition to color removal application of iron (200 mgL-1) and aluminium (400 mgL-1) showed the significant removal of COD (40-61%), nitrogen (74-76%) and phousphorous (up to 78%). Attempts to impove anaerobic reactor performance and prevent sludge washing out caused by applied high peak loads were done. The suitable techniques which helps to retain biomass in anaerobic digester was developed and tested at full-scale system. Anaerobic sludge de-gaasing unit allowed to increase peak organic loading rate up to 17,8 kg CODm3d-1 without methanogenic process failure. Keywords: anaerobic, beet molasses, betaine, biogas, coagulation, melanoidins, post-ozonation, sulfate reducing bacteria, vacuum sludge treatment, yeast wastewater.
5
ACKNOWLEDGEMENTS I would like to express my sincere gratitude to my supervisor Dr. Viktorija Blonskaja for her exceptional guidance and encouragement as my supervisor. I would like thank Dr. Anne Menert and Tõnu Kurissoo for many valuable discussions and nice teamwork and for involving me into the world of wastewater treatment processes. I am grateful to my colleagues Andres Mets (Salutaguse Pärmitehas AS) and Guy Marleau (Lallemand Inc.) for everything concerning the experiments and operation at full-scale system and for their entrusted hopes and the confidence. Special thanks to Dr. Zhigen Zhang (Lallemand Inc., R&D) for “remote control” of the wastewater treatment equipment in Estonia.
My sincere gratitude to professor Raivo Vilu and Raivo Vokk as my first teachers and to professor Toomas Paalme and Dr. Ildar Nisamedtinov for nice collaboration. I would like to thank PhD student Marina Krapivina and student Jelena Orehhova for their contribution to experimental work. And at last I would like to thank my family for eternal patience throughout these years.
6
CONTENTS
Kokkuvõte 3 Abstract 4 Acknowledgements 5 List of publications 7 1. Introduction 9 2. Aim of the study 10 3. Literature review 11
3.1. Anaerobic digestion processes 11 3.2. Substrate specificities 12 3.3. Biochemical interactions 14 3.4. Environmental factors 16
3.4.1. pH 16 3.4.2. Temperature 17 3.4.3. Ionic strength and Salinity 17 3.4.4. Nutrients 17 3.4.5. Toxicity and inhibition 18
3.5. Anaerobic treatment of sulfate-rich wastewaters 21 3.5.1. Sulfate reduction by sulfate reducing bacteria 21 3.5.2. Alternative electron acceptors for sulfate reducing bacteria 23 3.5.3. Methods for avoiding the inhibitory effect of sulfides 25
3.6. Characteristics of baker’s yeast wastewater 27 3.6.1. Beet molasses – main raw material for baker’s yeast fermentation 27 3.6.2. Beet molasses components in wastewater 29
4. Experimental study 32 4.1. Materials and methods 32
4.1.1. Experimental methods and procedure 32 4.1.2. Substrates 36 4.1.3. Seed sludges 36 4.1.4. Analyses 36
4.2. Results and discussion 37 4.2.1. Combined anaerobic/anoxic treatment of sulfate-rich wastewater
from yeast production 37 4.2.2. Treatment of sulfate containing yeast wastewater in an ASBR 51 4.2.3. Post-treatment of biologically pre-treated wastewater effluent 53 4.2.4. Modification of anaerobic bioreactor to improve biomass
retention 60 5. Conclusions 68 References 71 List of symbols and abbreviations 78

7
LIST OF PUBLICATIONS INCLUDED IN THE THESIS
This thesis is based on the following papers, which are referred to in the text by their Roman numerals:
I. Zub, S., Kurissoo, T., Menert, A., Blonskaja, V. (2002). The anaerobic/anoxic treatment of sulphate-rich wastewater. In. Proc.2nd
Biennial Conference on Management of Wastewaters: Edinburgh, UK, 15-
17 April 2002, p. 285-294
II. Krapivina, M., Kurissoo, T., Blonskaja, V., Zub, S. and Vilu, R. (2007). Treatment of sulphate containing yeast wastewater in an anaerobic sequence batch reactor. Proceedings of the Estonian Academy of Sciences.
Chemistry, 56(1), 38-52.
III. Zub, S., Blonskaja, V., Kamenev, I. (2006). Possibilities of using ozone for the treatment of wastewater from the yeast industry. Proceedings of the
Estonian Academy of Sciences. Chemistry, 55(1), 29-39.
IV. Zub, S., Kurissoo, T. and Mets, A. (16.07.2007). Device for the anaerobic purification of wastewater with obtaining of biogas. Utility Model EE 00665 U1, The Estonian Utility Model Gazette 3/2007, p.9. ISSN 1023-6546.
V. Blonskaja, V., Zub, S., Krapivina, M. (2005). Anaerobic treatment of yeast industry wastes-years of industrial experience. In: Conference proceedings. Vilnius, 2005. Vol.1, Environmental Engineering The 6
th International
Conference, Lithuania, May 26-27, p. 331-336. SBN 9986-05-858-9.
Other publications:
[1] Kurissoo, T., Menert, A., Zub, S. (2002). Monitoring of anaerobic/anoxic treatment of sulphate-rich wastewaters from yeast industry. –In: Abstracts: Xth International Congress of Bacteriology and Applied Microbiology, Paris, 27 July-1 August, Paris: EDK, 159-159.
[2] Zub, S. (2002). Water-soluble vitamins determination in inactive yeast products by HPLC. Food and nutrition, 108-109.
[3] Zub, S., Kurissoo, T., Menert, A., Blonskaja, V. (2007). The anaerobic/anoxic treatment of sulphate-rich wastewater. to be submitted in the Water and Environmental Journal
Reprints of papers were made with permission from the publishers.
8
The author’s contribution in the appended publications: Publication I: The study was initiated by the author. He is principally responsible for the data analysis and in the preparation and writing of the manuscript in cooperation with other authors. Publication II: The author is responsible for the data analyses, and participated in the general design of the study and writing the manuscript. Publication III: The study was initiated by the author. He is partly responsible for the data collection and analysis. The author participated together with BSc-students in the experiments. Publication IV: The author carried out the design and construction of prototype equipment, interpreted the obtained data and prepared necessary documentation together with co-authors for Utility Model. Publication V: The author is responsible for the data collection and analysis. He participated in the preparation of manuscript as the leading author.
9
1. INTRODUCTION
The level of pollution in waste water and the amount of waste produced by the FDM (Food, Drink and Milk Industries) sector can represent a significant load in some countries or regions. While most emissions from the FDM industry are biodegradable, some sectors use raw materials such as sugar cane or beet molasses which are resistant to conventional treatment methods and can introduce serious difficulties, e.g. non-biodegradable color substances which remain in waste water.
Traditionally, in many European countries, the sector has not been heavily regulated by environmental legislation. The impetus for the sector to improve its environmental performance has therefore been based on efficiency improvements, e.g. maximizing the utilization of materials, which subsequently leads to a minimization of waste.
There is now a trend towards focusing on proactive environmental management systems, natural resource conservation and the improvements of waste minimization techniques. To ensure sustainability, the effects of the raw material supply, food processing, transport, distribution, preparation, and disposal must be considered and controlled. Both primary production and processing are critically dependent upon a reliable water supply and adequate water quality, in conformity with legal requirements.
Water consumption is one of the key environmental issues for the FDM sector. Most of the water which is not used as an ingredient ultimately appears in the waste water stream. Typically, untreated FDM waste water is high in both COD and BOD. Levels can be 10-100 times higher than in domestic waste water. The SS concentration varies from negligible to as high as 120000 mg L-1. Generally the fermentation processes are the biggest contributors of wastewater pollution in FDM sector, e.g. alcohol and baker’s yeast production and breweries.
Fermentation is the process of using microorganisms to produce valuable products such as antibiotics, industrial enzymes, food, and chemicals. Baker’s yeast (Saccharomyces cerevesiae) is one of the oldest products of industrial fermentation. It is still one of the most important fermentation products based on volume of sales and its use for bread-making, a stable food for large section of world’s population. Yeasts are the most important and the most extensively used microorganisms in food industry. They are cultured for the cell mass, cell components, and products that they produce during the fermentation.
Yeast production wastewater is a complex mixture. Most of the contaminants in the wastewater are due to the use of molasses as a main raw material. During yeast fermentation process, the sugars contained in the molasses are utilized as carbon and energy source. The major part of the non-sugar substances in the molasses (molasses residuals), however, is not assimilable by the yeast and releases unchanged to the processing wastewater, which represents the principal

10
waste in the yeast production process. Besides molasses residuals, yeast production wastewater also contains chemicals added during fermentation (e.g. various salts, antifoams, propionic acids, brine, etc), yeast metabolites and residual yeast cells.
Since the main substrate for baker's yeast production in Europe is sugar beet molasses, these wastewaters are high strength (10000-80000 mg L-1 by COD), strong nitrogenous (1500-2500 mg L-1 total N), sulfate (2000-10000 mg L-1), phosphorus (30-60 mg L-1), recalcitrant for biodegradation and highly coloured (melanoidins etc.) substances. For each ton of the end product, about 17-25 m3 of wastewater is discharged.
Anaerobic treatment of wastewaters containing high amount of sulfate has been studied extensively in recent years. One of the main industries producing sulfate rich wastewaters are the fermentation industries – distilleries and yeast production plants. Technological production of citric acid, monosodium glutamate and nucleic acid also leads to formation of sulfate rich wastewaters. For the treatment of high strength wastewaters anaerobic digestion appears to be economically more attractive than the aerobic processes. Two important goals are achieved in anaerobic processes simultaneously: removal of organic matter and sulfates. Advantages of anaerobic digestion include also relatively low sludge production and low energy needs compared with aerobic treatment. However, high sulfate content can lead to destabilization of treatment processes due to the hydrogen sulfide formation. Biological sulfide oxidation to elemental sulphur seems to be the best solution for this problem, because elemental sulphur is inert solid material, which could be easily removed from the treatment system.
Currently many yeast factories are faced with heavy trade-effluent charges. Land disposal options generate problems with ground water pollution and are prohibited in majority of the European regions. Many local municipal sewage treatment plants are now insisting on pre-treatment of such effluents before discharge into their sewerage.
2. AIM OF THE STUDY
The aim of this study was, first of all develop further optimal setup and operational parameters for removing of sulfates and avoiding inhibitory effects of sulfides in anaerobic treatment of yeast wastewaters at Salutaguse Yeast factory, Estonia. The next aim was adaptation of optimal technological setup parameters at full scale wastewater treatment plant using existing equipment.
One of the most difficult aspects of the anaerobic system operation is the retention of the sludge in the reactor, due to the low density of the sludge and the rising of generated biogas bubbles. In order to keep the sludge in the reactor, comparatively difficult aim was targeted in this investigation – to develop
11
technology and techniques which helps to retain necessary biomass in anaerobic digester at Salutaguse Yeast Factory WWTP.
Wastewater from molasses processing presents a large amount of colored substances that give dark brown color and high organic load to the effluents. After a multistage biological treatment most of the organic load is removed. However, the brown color does not disappear and it can even increase because of the repolymerization of colored compounds. The main colored compounds are known as melanoidins. Therefore, the last aim of present work was to study additional treatments to remove color substances from biologically pre-treated effluent by ozonation and coagulation.
3. LITERATURE REVIEW 3.1. Anaerobic digestion processes
The anaerobic microbial conversion of organic substrates to methane is a complex biogenic process involving a number of microbial populations, often linked by their individual substrate and product specificities. As shown in Figure 1, the overall conversion process may be described as involving both direct and indirect symbiotic associations between different groups of microorganisms. Although these associations have been illustrated in various ways, nine recognizable steps, each mediated by a specific group of microorganisms and their enzyme complements, can be identified, including:
1) Enzymatic hydrolysis of organic polymers to intermediate organic monomers such as sugars, fatty acids, and amino acids
2) Fermentation of organic monomers to hydrogen (or formate), bicarbonate, pyruvate, alcohols, and lower fatty acids (acetate, butyrate, and propionate)
3) Oxidation of reduced organic products to hydrogen (formate), bicarbonate, and acetate by obligate hydrogen-producing acetogens (OHPA)
4) Acetogenic respiration of bicarbonate by homoacetogens (HA) 5) Oxidation of reduced organic products (alcohols, butyric and propionic
acids) to bicarbonate and acetate by nitrate-reducing bacteria (NRB) and sulfate-reducing bacteria (SRB)
6) Oxidation of acetate to bicarbonate by nitrate-reducing bacteria (NRB) and sulfate-reducing bacteria (SRB)
7) Oxidation of hydrogen (or formate) by nitrate-reducing bacteria and sulfate-reducing bacteria (SRB)
8) Aceticlastic methane fermentation 9) Methanogenic respiration of bicarbonate
These conversion possibilities can serve as a convenient basis for emphasizing some important biochemical and environmental requirements of the anaerobic microbial treatment of organic substrates and for directing the development or selection of substrate-linked process configurations.

12
3.2. Substrate specificities
The methanogenic bacteria are crucial to the anaerobic stabilization of a variety of substrates, since they constitute a major final step in the transfer of electrons from the various donor species. Unfortunately, known methanogens utilize only a narrow array of relatively simple substrates for growth and metabolism, the most familiar and frequently acknowledged of which are the hydrogen-mediated reduction of carbon dioxide and the aceticlastic cleavage of acetic acid. However, it is known that many methanogens may also utilize formate, and to a lesser degree, alcohols or carbon monodioxide, as electron donors. Therefore, in the presence of an abundant source of organic substrate, approximately two-thirds of the methane produced during anaerobic microbial conversion is derived from the methyl moiety of acetate, and about one-third is derived from dioxide reduction.
Figure 1. Substrate conversion patterns associated with the anaerobic treatment of wastewaters. Legend: (1) Hydrolysis of organic polymers; (2) Fermentation of organic monomers; (3) Oxidation of propionic and butyric acids and alcohols by OHPA; (4) Acetogenic respiration of bicarbonate; (5) Oxidation of propionic and butyric acids and alcohols by SRB and NRB; (6) Oxidation of acetic acid by SRB and NRB; (7) Oxidation of hydrogen by SRB and NRB; (8) Aceticlastic methane fermentation; and (9) Methanogenic respiration of bicarbonate (Harper and Pohland, 1987)

13
As indicated in Figure 1, the primary aceticlastic methangens, Methanosarcina and Methanosaeta (Methanothrix), are relatively slow-growing genera with 24 hour doubling times. Therefore, they are vulnerable to competition from the more rapidly-growing hydrogenotrophs (hydrogen-oxidizing methanogens) with 1 to 4 hour doubling times (Jones, 1991). Moreover, the former methanogenic bacteria can be adversely affected by the accumulation of hydrogen, and maintenance of low hydrogen (or formate) levels is important if these species are to contribute effectively to overall substrate conversion and mineralization. It has also been recognized that methane may be derived from the methyl moieties of a variey of 1-carbon compounds, including methanol, dimethyl sulfide, and mono-, di- and trimethylamines. In this cases, methane may be formed by a “disproportionation reaction” (Jones, 1991), whereby some of the substrate is oxidized to generate reducing equivalents for subsequent methyl group reduction. In addition, secondary alcohols, including 2-propanol and 2-butanol, as well as the primary alcohols ethanol, 1-propanol, and 1-butanol, are partially oxidized and serve as electron donors for reduction of carbon dioxide to methane (see Table 1). Table 1. Selected substrates and methane-producing reactions*
Reactions Hydrogenotrophic reactions: 4 H2 + CO2 → CH4 + 2H2O 4 Formate → CH4 + 3CO2 + 2H2O 4 (2-propanol) + CO2 → CH4 + 4 acetone + 2H2O Aceticlastic reaction: Acetate → CH4 + CO2 Disproportionation reactions: 4 Methanol → 3CH4 + CO2 + 2H2O 4 Methylamine + 3H2O → 3CH4 + CO2 + 4NH4
+ 2 Dimethyl sulfide + 2H2 → 3CH4 + CO2 + H2S
* Adapted from reference (Jones, 1991)
As also indicated in Figure 1, the presence of alternative electron acceptors such as nitrate or sulfate may inhibit methanogenesis, since sulfate-reducing bacteria (SRB) can outcompete methanogens for available substrates (H2, acetate), and hydrogen sulfide production can predominate over methanogenesis. Accordingly, in those cases, organic carbon is oxidized to carbon dioxide with a concomitant reduction of sulfate to hydrogen sulfide. With the exception of methylamines and possibly dimethyl sulfide, the major methanogenic substrates, acetate, formate, alcohols, and hydrogen plus carbon dioxide, also serve as substrates for sulfate-reducing bacteria. Thus, methane production from sulfate-rich substrates may be limited by such substrate preference.

14
3.3. Biochemical interactions
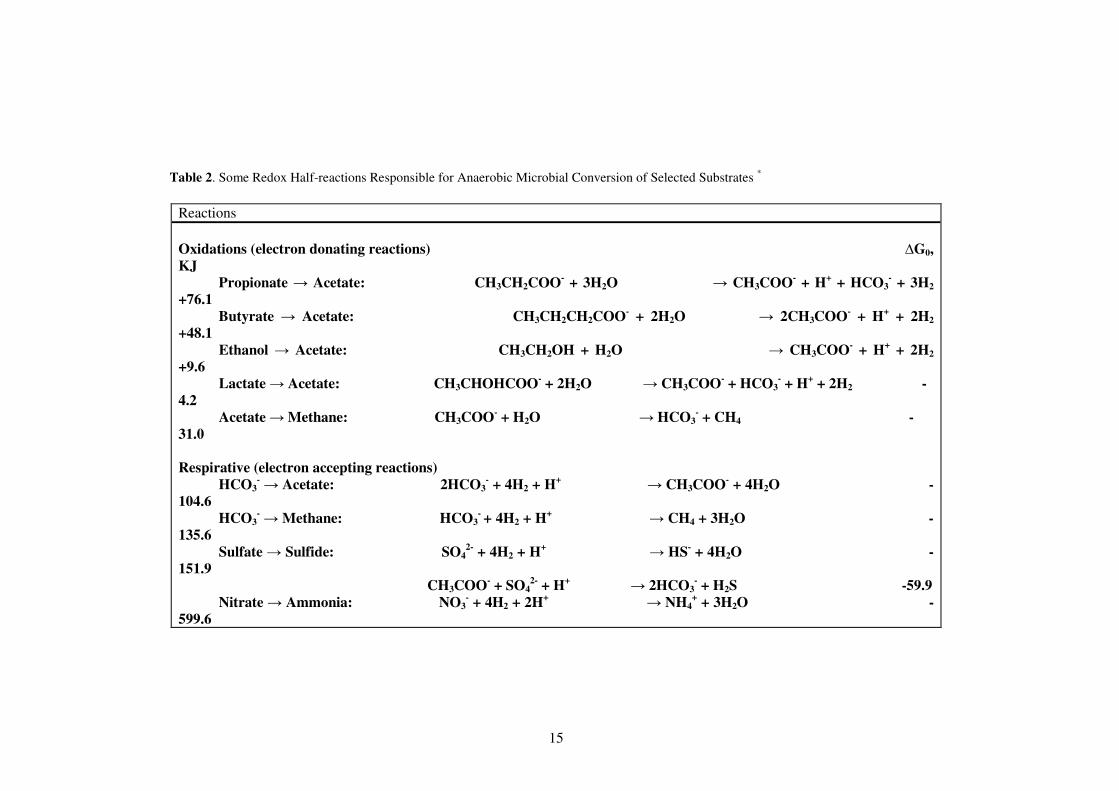
The methanogens and their biochemical interactions during methane fermentation have been reviewed by several authors (Jones et al., 1987, Rouviere et al., 1988, DiMarco et al., 1990). The major biochemical interactions for acetogenic and methanogenic conversion of the principal precursor substrates illustrated in Figure 1 are further defined in Table 2 in terms of associated redox half-reactions and biochemical standard free energy levels (Harper and Pohland, 1986).
Accordingly, when a particular metabolic pathway dominates a particular substrate conversion sequence, it is frequently regulated by the intensity of hydrogen (or formate) production and its potential for accumulation to inhibiting levels. Therefore, a lack of syntropy between the hydrogen-producing acidogens and the hydrogen-consuming methanogens, sulfate-reducing bacteria (SRB) or nitrate-reducing bacteria (NRB) can result in excessive accumulation of hydrogen or intermediate conversion products unless other hydrogen sinks (Fe3+, Mn+4, oxygen, unsaturated compounds, etc.) are available. Indeed, he thermodynamic energy yield of the oxidation of organic compounds, coupled to reduction of various electron acceptors, decreases in the order O2 > NO3 > MnO2 > Fe3+ > SO4 > CO2 (Kiene, 1991). Theoretically, greater energy is available and, hence, greater growth yield of the microorganisms that can use the most favorable electron acceptors (Thauer et al., 1997).
Anaerobic microbial conversion systems are most efficient when operating in the absence of inhibition. In the case of potential inhibition of hydrogen, this usually requires both ultimate cleavage of acetate and reduction of carbon dioxide. Conversion of the higher organic fatty acid homologues (butyric and propionic acids) to acetate and hydrogen is accomplished by organisms that grow only when hydrogen is used by the hydrogenotrophs, a process termed “interspecies hydrogen transfer” (Iannotti et al., 1973, Wolin,1977). In case of obligate interspecies hydrogen (or formate) transfer, syntrophy between the production of hydrogen from the acids and its utilization by methanogens is necessary to permit reactions that yield energy for the growth of both species. Hence, a common characteristic of such syntrophic associations is the “thermodynamic barrier” to the reduction of protons to hydrogen, a barrier that can be overcome by coupling the formation of hydrogen to the reduction of carbon dioxide to methane.
The microorganisms that oxidize butyrate and propionate to acetate and hydrogen grow very slowly, even in the presence of methnogens. The generation time for Syntrophomonas wolfei on butyrate is about 3 days (McInerney et al., 1981), and that Syntrophobacter wolinii growing on propionate is about 7 days (Boone and Bryant, 1980). Therefore, the complete conversion of these substrates may require processes with longer solids retention times (SRT), a future of many conventional anaerobic microbial treatment systems providing enhanced biomass containment.
15
Table 2. Some Redox Half-reactions Responsible for Anaerobic Microbial Conversion of Selected Substrates *
Reactions
Oxidations (electron donating reactions) ∆G0, KJ Propionate → Acetate: CH3CH2COO- + 3H2O → CH3COO- + H+ + HCO3
- + 3H2 +76.1 Butyrate → Acetate: CH3CH2CH2COO- + 2H2O → 2CH3COO- + H+ + 2H2 +48.1 Ethanol → Acetate: CH3CH2OH + H2O → CH3COO- + H+ + 2H2 +9.6 Lactate → Acetate: CH3CHOHCOO- + 2H2O → CH3COO- + HCO3
- + H+ + 2H2 -4.2 Acetate → Methane: CH3COO- + H2O → HCO3
- + CH4 -31.0 Respirative (electron accepting reactions) HCO3
- → Acetate: 2HCO3- + 4H2 + H+ → CH3COO- + 4H2O -
104.6 HCO3
- → Methane: HCO3- + 4H2 + H+ → CH4 + 3H2O -
135.6 Sulfate → Sulfide: SO4
2- + 4H2 + H+ → HS- + 4H2O - 151.9 CH3COO- + SO4
2- + H+ → 2HCO3
- + H2S -59.9 Nitrate → Ammonia: NO3
- + 4H2 + 2H+ → NH4+ + 3H2O -
599.6

16
CH3COO- + NO3- + H+ + H2O
→ 2HCO3
- + NH4+ -
511.4 Nitrate → Nitrogen gas: 2NO3
- + 5H2 + 2H+ → N2 + 6H2O -1120.5
* Adapted from reference (Harper and Pohland, 1986)

17
The activities of fatty acid-oxidizing bacteria are crucial for complete methanogenic fermentation, since low molecular weight fatty acids such as propionate and butyrate are common intermediate products and cannot be catabolized by methanogens. Butyrate catabolism by Syntrophomonas wolfei proceeds by β-oxidation with the release of acetate and hydrogen (McInerney et
al., 1981) or formate (Boone et al.,1989). Propionate oxidation is less well understood, but is accomplished by Syntrophoacter wolinii (Boone and Bryant, 1980) with the production of acetate and carbon dioxide, again with concomitant production of hydrogen of formate. These oxidation are thermodynamically possible only when the reduced product (hydrogen or formate) is maintained at low concentrations by the “scavenging” activities of the methanogens. The growth of the fatty acid-oxidizing bacteria in the consortia with methanogens is very slow and may limit methanogenesis in some systems. Accordingly, the accumulation of fatty acids, particularly propionic acid, is a common indicator of stress in anaerobic digestion systems. 3.4. Environmental factors Besides the necessary of available substrate and viable microbial populations, the principal environmental factors affecting the rates of methanogenesis in anaerobic microbial conversion processes include pH, temperature, ionic strength or salinity, nutrients, and toxic or inhibitory substances.
3.4.1. pH
Most anaerobic conversion processes operate best at near neutral pH. Deviations from this optimum, if not introduced with the influent substrate, are usually consequenced by excess production and accumulation of acidic or basic conversion products such as organic fatty acids or ammonia, respectively. Moreover, the intensity of pH will affect the solubility and reaction behavior of other potentially influencing substances, including both organic and inorganic species. Low pH and excessive acid production and accumulation, which displaces the more neutral pH bicarbonate buffer system (Pohland and Bloodgood, 1963, Pohland and Suidan, 1987), are considered conditions more inhibitory to methanogens than fermentative bacteria. These latter species can also continue to produce fatty acids, despite pH depression, thereby aggravating the environmental condition further. However, methanogenesis is known to occur in both acidic and alkaline environments, suggesting that methane production is not exclusively limited to a neutral pH. The effect is apparently manifested differently for the various anaerobic consortia, since Methanosarcina barkeri and Methanosarcina vacuolata, two well-known acetate-degrading methanogens, grow well at low pH with an optimum pH of 5 when cultured on hydrogen and methanol as the catabolic substrate (Maestrojuan and Boone, 1991). Similarly, hydrogen-oxidizing methanogens (Boone at al., 1986) and

18
methylotrophic methanogens (Liu et al.,1990, Mathrani et al.,1988) have been found at very alkaline pH values, but no aceticlastic methanogens have been found (Boone, 1991). Therefore, it seems that some biochemical interactions and degradation pathways may be influenced by pH, including the possible inhibition of hydrogen production (Conrad et al., 1987), which may then explain the lesser importance of hydrogen to methanogenic process applications at other than neutral pH have not been exhausted.
3.4.2. Temperature As with most microbially mediated processes, methanogenesis has been shown to be strongly temperature-dependent, with reaction rates generally increasing with temperature up to 60oC. Two optimal temperature ranges, mesophilic (near 35oC) and thermophilic (55 to 60oC), with decreased rates between these optima, have been often been cited. However, it has been suggested that low rates between these optima may have been due to a lack of adaptation (Macki and Bryant, 1981). With temperatures at or above 70oC, methanogenic rates have been reported to decrease (Zinder et al., 1984), although a larger pool of substrate may be available for conversion when higher temperatures are present (Westrich and Berner, 1988). Moreover, when inhabited by complex microbial consortia, including sulfate and nitrate reducers, temperature influences may be more significant and advantageous to certain species, to the detriment of others.
3.4.3. Ionic strength and Salinity
As already indicated, sulfate exerts a significant control on the viability of methanogenesis in the presence of certain substrates, primarily because of the competition between sulfate-reducing bacteria (SRB) and methanogens. Salinity effects on methane fluxes have been examined in marine systems (Capone and Kiene, 1988, DeLaune et al., 1983, Bartlett et al., 1987), and fluxes have generally been greater in freshwater regions of marshes and estuaries. Salinities up to 0.2 M NaCl have been reported to have minimal effects on mixed methanogenic populations, but higher salinities are inhibitory (Boone, 1991). The total ionic strength would also affect chemical activity and, therefore, the possible effect of other chemical species in terms of inhibition. 3.4.4. Nutrients
In addition to the fundamental requirements for micronutrients such as carbon and nitrogen, the inability of many anaerobes to synthesize some essential vitamin or amino acid often necessitates supplementation of the culture medium with specific nutrients for growth and metabolism. Generally, the gross level of essential nutrients can be evaluated if the biomass yield is known, and the C:N ratio is frequently utilized to describe this micronutrient requirement. On occasion, this ratio will be affected by substrate specificity, but if measured as chemical oxygen demand (COD), COD:N ratios of about 400:7 and 1000:7
19
have been estimated as required at high and low substrates loadings, respectively (Henze and Harremoes, 1983). Similarly, a N:P ratio of approximately 7:1 has been reported as required (Stronach et al.,1986), although establishing specific nutrient requirements in mixed substrate and population systems can be elusive and better determined separately for each circumstance. Other trace elements considered as necessary for various conditions of active methanogenesis include iron, nickel, magnesium, calcium, sodium, barium, tungsten, molybdate, selenium and cobalt. In the case of selenium, tungsten and nickel, these elements are implicated in the enzyme systems of acetogenic and methanogenic bacteria (Stronach et al., 1986). For example, the formate dehydrogenase and hydrogenase of Methanococcus vanielii, the formate dehydrogenase of Clostridium thermoaceticum, and the hydrogenase of Desulfovibrio desulfuricans require the presence of selenium, tungsten and nickel respectively. Normally, mixed substrate systems, particularly those involving waste discharges, have an abundance of essential nutrients, unless the waste is from a process that disallows such introduction. 3.4.5. Toxicity and inhibition
Toxicity or inhibition of methanogenic processes can be consequenced by a variety of circumstances, including the generation of intermediary products such as the volatile fatty acids, which may also manifest an adverse pH effect. Whereas methanogenic microbial growth has been often shown to be restricted in the presence of excessive amounts of VFAs, particularly when propionate accumulates, sudden increases in concentration of either acetate or butyric have also exhibited stimulation of the process (Iannotti and Fischer, 1984). In terms of the volatile fatty acids, the effects manifested are often related to other environmental conditions, particularly pH and buffer capacity (alkalinity) as originally introduced in terms of “volatile acid alkalinity” (Pohland and Bloodgood, 1963) and later operationally modified (Pohland and Suidan, 1987). Therefore, the overall inhibitory effect of the volatile fatty acids is related to the pH established by the prevailing buffer system, and may involve elevation of the concentration of unionized or un-dissociated species, with a greater internal cellular effect as they more readily migrate across the bacterial cell membrane (Pohland and Martin, 1969). Accordingly, volatile fatty acids may accumulate due to other stresses mentioned previously and can thereby not only function as weak acid buffers to lower the pH, but can then exert an inhibitory effect with pH on the microbial consortia present. As with the volatile fatty acids, hydrogen sulfide and ammonia, such as from reduction of sulfate and nitrate by sulfate- and nitrogen-reducing bacteria, are also capable of forming weak acid and weak base buffer systems (see Figure 2). Although these systems are usually less intensive and less likely to exert

20
principal control on the pH, unless the influent substrate contains high levels, both sulfide and ammonia have been implicated in exerting toxic effects on methanogenesis. Here again, the concentration of sulfide or ammonium species present would be pH-dependent, and the former could be rendered insoluble by association with other cations.
Figure 2. Major acid-base equilibria and their influence on buffer capacity during anaerobic microbial conversion of waste organic substrates (Pohland and Suidan, 1987) Hence, sulfide precipitates can form, as is the case with iron sulfide, thereby effectively eliminating potential toxic effects of either the precipitate metal or the uncomplexed sulfide. Similarly, at elevated pH levels, free ammonia might exist at concentrations sufficient to exert a toxic or inhibitory effect. In either case, whether or not such inhibition occurs is again dependent on other

21
environmental factors and the ability of the microbial consortia to accumulate or adapt to the imposed stress. Sulfide toxicity has been oserved at concentrations ranging from 200 to 1500 mg L-1 (Stronach et al., 1986) until acclimation occurred or the sulfide concentrations could be reduced by precipitation or release into the gas phase. Therefore, the potential toxic effects of sulfide, normally present in solution as a weak acid, would be a function of pH as well as the presence of precipitants such as most of the heavy metals. Similarly, the associated heavy metal toxicity would also be mediated by the presence of sulfides and the propensity to contribute to precipitation of the sparingly soluble metal sulfides to be discussed subsequently. In the case of the weak base, ammonia, microbial acclimation is particularly important and is often linked to the presence of volatile fatty acids and the effect of the acid-neutralization capacity of ammonia on pH. Hence, the “inhibitory concentration” of ammonia may vary depending on other environmental factors and the type of exposure expressed on the more sensitive methanogenic populations, with free ammonia being generally considered more toxic than the ionized ammonium species. This may account for the difference between observed results and the potential for reversibility of toxic effects even at short exposures with high ammonia nitrogen loadings. The methanogen, Methanobacterium formicium has been reported to be partially inhibited at a total ammonia concentration of 3000 mg L-1 and a pH of 7.1, whereas 4000 mg L-1 caused complete inhibition (Stronach et al., 1986). In contrast, non-methanogenic populations have been reported to be functional at ammonia concentrations in excess of 6000 mg L-1 and at a pH of 8 (Cross et al., 1983). Heavy metal toxicity has been often implicated as acause for failure of anaerobic microbial conversion processes, as influenced by oxidation-reduction potential (ORP), pH and ionic strength and the resultant speciation of the metals or metal complexes. It is generally accepted that free metals exert a toxic threshold, above which inhibition or failure of the process occurs. The difficulty is establishing that threshold in recognition of the moderating effects that can be imposed by the availability of complexes or precipitants such as sulfides. Moreover, the reducing potential (negative ORP) present in anaerobic methanogenic systems can alter the valence of some of the metals from a more oxidized to a more reduced state (e.g., iron and copper), thus affecting the potential requirements for detoxification. Often associated with heavy metals as a consequence of source, cyanide can also adversely affect anaerobic conversion processes, depending on concentration and exposure time (Stronach et al., 1986). However, rapid acclimation is known to be possible, even under the stress expressed by multiple toxic effects of the other system components (Cross et al., 1983). It has also
22
been reported that whereas cyanide prevents methane formation from acetate, it does not prevent formation from either carbon dioxide or methanol in cultures of Methanosarcina barkeri, a methanogen whose carbon monoxide dehydrogenase enzyme is inhibited by cyanide (Stronach et al., 1986). Besides the effects of inorganic heavy metals and cyanide, anaerobic microbial conversion processes are known to be adversely affected by a vast array of anthropogenic and recalcitrant compounds, some of which may be ultimately susceptible to bioconversation if appropriate conditions of acclimation and process selection are provided. Notwithstanding the generally accepted notion that these compounds persist unchanged for extended periods of time, considerable evidence is appearing that suggests potential for microbial conversion of many of the compounds heretofore categorized as recalcitrant. 3.5. Anaerobic treatment of sulfate-rich wastewaters 3.5.1. Sulfate reduction by sulfate reducing bacteria The reducing conditions prevailing in anaerobic processes of sulfate rich wastewaters result in the increase of hydrogen sulfide content. Although part of the sulfides originates from the sulfur containing amino acids, probably most of them are formed during the reduction of sulfates present in the raw wastewater. The main reactions of sulfate reduction performed by sulfate reducing bacteria (SRB) are the following reaction (Widdel et al., 1991, Menert, 2001): 2 lactate- + SO4
2- + 3 H+ → 2 acetate- + 2 CO2 + 2 H2O + HS- (1) ∆G’0 = -74.5 kJ/ 2 lactate
acetate- + SO4
2- + 3 H+ → 2CO2 + H2S + 2 H2O ∆G’0 = -57 kJ/ reaction (2) By generation times SRB can be classified as fast growers (τ ≈ 3 h) represented by the genera Desulfovibrio, Desulfomicrobium, Desulfobotulus, Desulfobulbus,
Desulfotomaculum and Thermodesulfobacterium. They utilize H2, formate, lactate, ethanol, pyruvate, and convert it to acetate, which accumulates. Slow growers with τ ≈ 15 h are represented by the genera Desulfobacter,
Desulfobacterium, Desulfococcus, Desulfosarcina, Desulfonema and some species of Desulfotomaculum. They utilize acetate, lactate, pyruvate, fatty acids, fumarate, malate, formate and H2 and perform their complete oxidation to CO2, H2O and H2S.
Sulfate metabolism comprises several individual stages (Menert, 2001). 1. Sulfate transport that is accomplished by active symport with 3H+ or Na+ (Desulfococcus). Strong inhibitors of transport are molybdate, chromate and selenate.

23
2. Activation of sulfate by ATP sulfurylase.
SO42- + 2 H+ ATP → APS [AMP-SO4] + PPi ∆G’0 = +46 kJ (3)
This is the first reaction in the reductive assimilation of sulfate for biosynthesis:
ATP + SO42- →→→→ HS- (4)
HS- + serine → cysteine + H2O (5)
as well as in dissimilative reduction (reactions 1, 2 and 8). APS is referred to as adenosylsulfate or adenosyl phosphosulfonate or adenosine-5’-phosphosulfate. In the same way molybdate and selenate can be converted by ATP sulfurylase into adenosine phospho-molybdate and adenosine.phosphoselenate leading thus to the toxic effects. 3. Formation of bisulfite:
APS reductase [4Fe4S], FADH2 APS [AMP-SO4] → HSO3
- + AMP + H+ ∆G’0 = -69 kJ (6) 4. Reduction of bisulfite:
3 H2 (6e-)
HSO3- → HS- + 3 H2O ∆G’0 = -171 kJ (7)
Bisulfite reductase is a α2β2 (167 - 215 kDa) protein containing desulfoviridin, desulforubidin or desulfofuscidin. The actual reaction route to sulfide is still in doubt and may involve either direct reduction or participation of intermediates such as trithionate (S3O6) or thiosulfite (S2O3). From the point of view of energetics two high-energy bonds were used to activate sulfate and two ATPs per mole of lactate oxidized to acetate are generated by substrate level phosphorylation. Acetotrophic SRB obtain ATP via citric acid cycle at the level of citrate lyase (Widdel and Hansen, 1991).
Both fast growing (e.g. Desulfovibrio) and slow growing (e.g. Desulfococcus) sulfate reducing bacteria are able to partially oxidize some organic compounds into acetate and CO2 that in turn can be metabolized by methane producing bacteria or the SRB themselves (Widdel and Hansen, 1991, Traore et al.,1983, Menert, 2001). Interactions between these two groups of microorganisms can be very diverse - trophic complementary, inhibition, etc. Of particular importance
24
is the competitive relationship towards the use of hydrogen since it can be the energy source for the both groups of bacteria. 3.5.2. Alternative electron acceptors for sulfate reducing bacteria Some colourless sulfur bacteria (Thiobacillus denitrificans) use sulfur compounds such as thiosulfate, elemental sulfur and sulfide as electron donors, and in the absence of oxygen they use nitrate as electron acceptor (Montgomery et al., 1990). A sulfide resistent strain of T. denitrificans was successfully grown in a coculture with the sulfate reducing bacteria Desulfovibrio
desulfuricans without accumulation of sulfide (Montgomery et al., 1990). As T.
denitrificans strain F is a chemoautotrophic bacterium, no additional nutrients are needed to support its growth. For long ago it has been noticed that addition of nitrate inhibits sulfide production in many environments. Environments such as sewage digester sludge contain large populations of denitrifiers that can use the sulfide produced by sulfate reducing bacteria, or compete for electron donors required for sulfate reduction. The first explanation to this was that products of NO3
- reduction (NO, N2O) might inhibit the growth of SRB (Montgomery et al., 1990). The common understanding is that the order of electron acceptor utilization by SRB is O2 > H+ > NO3
- > Mn > Fe3+ > SO42-, followed by methanogenesis as
dictated by thermodynamics (Mathews et al., 1995, Kennedy et al., 2001). Though microbial O2 and NO3
- respiration are thermodynamically more favoured, concentrations of these electron acceptors in ground water are usually small, and thus not available to SRB. In addition to that, O2 solubility in water is limited and its addition can result in fouling of injection equipment of treatment plants. Though nitrate is soluble, its concentration in drinking water is restricted by regulation to 10 mg L-1 (as N) (Kennedy et al., 2001). On the other hand, comparatively large amounts of Fe3+ (> 1000 mg kg-1) and dissolved SO4
2- (50 - 1000 mg L-1) can occur naturally and have been used as electron acceptors to stimulate bioremediation of organic contaminants in landfills (Kennedy et al., 2001). The use of H+ as electron acceptor is limited by excess production of H2 that is inhibitory to both methanogenic bacteria (MB) and sulfate reducing bacteria (SRB). The obligate proton reducing acetogenic bacteria or obligate hydrogen producing anaerobes (OHPA) include those that beta-oxidize short-chain fatty acids, decarboxylate propionate and oxidize ethanol and similar alcohols. Their growth occurs only in the presence of either a methanogen or any other microorganism using hydrogen. H2 is a stringent feedback inhibitor of hydrogenase and prevents the conversion of NADH to NAD+, which is essential for the growth of these bacteria. Some species of Desulfovibrio utilize both sulfate and H+ as electron acceptors and produce H2 if grown in syntrophic

25
association with an H2 utilizing methanogen (McInerney et al., 1981, Traore et
al., 1981):
lactate- + 0.37 SO42- + 0.56 H+ →
CO2 + 0.98 acetate- + 0.02 ethanol + 0.16 H2S + 0.215 HS- + 0.5 H2O + 0.48 H2 (8) ∆Hmet = -36.6 kJ mol-1 Sulfate reducing bacteria which contain hydrogenase (hydrogen: ferricytochrome c3 oxidoreductase EC. 1.12.2.1) and cytochrome c3 can either produce or consume molecular hydrogen. H2 is consumed if they grow by anaerobic oxidation of hydrogen with concomitant reduction of sulfate (Traore et al., 1981, Oude Elferink et al., 1998):
H2 + 0.25 SO4
2- + 0.25 H+ → 0.25 HS- + H2O (9) H2 is produced by some species of Desulfovibrio during growth on pyruvate (Traore et al., 1983, Traore et al., 1981) or any other volatile fatty acid medium, lacking sulfate (Oude Elferink et al., 1998):
pyruvate- + H2O → acetate- + CO2 + H2 ∆Hcat = -1.64 kJ mol-1 (10) lactate- + H2O → acetate- + CO2 + 2 H2 ∆Hcat = +73.30 kJ mol-1 (11) propionate- + 3H2O → acetate + HCO3
- + H+ + 3 H2 (12) butyrate- + 2 H2O → 2 acetate- + H+ + 2 H2 (13)
Already at low concentrations (1 mM) sulfate turned out to be a better electron acceptor than methanogen Methanosarcina barkeri or H+ for SRB Desulfovibrio
vulgaris Hildenborough (lactate and pyruvate as electron donors) (Traore et al., 1983). Molecular hydrogen was produced by the bacteria in a relatively high proportion at high (36 mM) sulfate concentrations (0.5 mol H2 per mol of lactate as the energy source (Eq. 11)) (Traore et al., 1981). This H2 production was interpreted as a device to minimize H2S production in the culture media. H2 production seemed to precede sulfate reduction since a significant amount of H2 was accumulated in the culture medium before H2S could be detected (Traore et
al., 1981). The greater “lack” of energy observed during the growth on lactate (∆Hmet= -36.36 kJ mol-1) as compared to that on pyruvate (∆Hmet = -70.22 kJ mol-1) could be attributed to the greater amount of H2 produced by the former substrate. In natural conditions the loss of energy induced by H2 production is counterbalanced by utilization of H2 and CO2 from SRB by MB. Hydrogen accumulation is inhibitory because of thermodynamic reasons - H0
f = -4.19 kJ mol-1 at t = 25°C (Brown, 1969).

26
In the absence of sulfate, Desulfovibrio species degraded little lactate to acetate, CO2 and H2, due to the relatively positive change in free energy, unless H2 using bacteria (H2-using methanogens) were present to maintain low concentration of H2 (McInerney et al., 1981). 3.5.3. Methods for avoiding the inhibitory effect of sulfides Anaerobic treatment of sulfate rich wastewaters, e.g. from food industry, fermentation industry, paper and pulp industry etc. may be accompanied by production of sulfides (Buismann et al., 1990). In addition to their toxicity and corrosive properties, sulfides have also inhibitory effect on methanogenesis. To prevent or decrease the sulfide inhibition in anaerobic reactors, different process schemes have been proposed to integrate sulfate reduction, methanogenesis and sulfide removal in order to achieve the removal of both organic matter and sulfurous compounds. More information in (Colleran et al., 1995). 3.5.3.1. Physicochemical sulfide removal
Physicochemical oxidation processes for sulfide removal are follows (Lens et
al., 2000): - Electrochemical oxidation, - Chlorination, ozonation, - Potassium permanganate (KMnO4), or hydrogen peroxide (H2O2)
treatment. In all these oxidation processes, elemental sulfur, thiosulfate and sulfate are the final products in a varying ratio depending on the pH. The sulfide removal process can be placed after the anaerobic step, an option that implies installation of an extra unit in the treatment system. Other nowadays methods commonly used to remove sulfide from the wastewater are:
- Dilution of the influent – in some cases sulfide concentration can be reduced below inhibitory level in anaerobic reactors by diluting the influent, for example, with sulfate-free potable water. Utilization of unpolluted water to meet this target is not preferred (Lens et al., 2000).
- Sulfide stripping – sulfide can be stripped directly from anaerobic reactor. Sulfide can be stripped from liquid in the ANTRIC filter by gas that is passed through a recirculation system in which the H2S in the gas had beeb removed in a scrubber. Alternatively, sulfide can be stripped in a separate stripping column with either biogas or a stripping gas (N2) from which the effluent is recycled to the anaerobic reactor (Särner, 1990).
- The reactor pH – operating the reactor at an elevated pH it is possible to reduce the H2S concentration. The pH reducing (>7.5) will lead to the

27
decreasing of the undissociated H2S in liquid which decreases its toxicity.
- The temperature control. Sulfide level is normally inhibitory to anaerobic organisms at levels of above 100 mg L-1 (HS-) and completely inhibits at levels above 200 mg L-1 (HS-). The associated form (H2S) is thought to be inhibitory agent at 50-100 mg L-1 H2S-S. H2S-HS- is in equilibrium and H2S solubility is strongly affected by temperature. Higher temperatures decrease H2S solubility and equilibria pK ad each degree of temperature change around 350C changes effective H2S concentration by approximately 2%. Therefore, operating at higher temperatures is often a sulfide control strategy. More information is in (Speece, 1996).
- Precipitation of sulfide. This method includes dosing with metal salts to anaerobic digester (especially Fe2+ and Fe3+).
3.5.3.2 Biological sulfide removal Biotechnological processes for sulfide removal consist in conversion of sulfide into elemental sulfur by colourless sulfur bacteria (Thiobacilli) (Buisman et al., 1990, Janssen et al., 1997, Janssen et al., 1999, Menert, 2001) according to the reaction (14):
2 HS- + O2 → 2 S0 + 2 OH- ∆G0= -169.35 kJ mol-1 (14)
or by genera of anaerobic photosynthetic bacteria from the families Chlorobiaceae and Chromaticeae that catalyze the photosynthetic van Niel reaction (Cork, 1985, Henshaw et al., 1998): nν
2n H2S + n CO2 → 2n S0 + (CH2O)n + n H2O (15) In the latter case light radiated to a photosynthetic reactor is coupled to the conversion of sulfide to elemental sulfur using the reverse citric acid cycle (Arnon cycle). According to experimental results, photoautotrophic bacteria produce a higher percentage conversion of S2- to S0 as compared to chemoautotrophic bacteria. There is also a thermodynamic advantage of using electrons from S2- in comparison to those from S0 or S2O3
2-: energy change per mole of electrons released from the oxidation of S2- to S0 is the highest (-26 kJ mole–1) as compared to other sulfur species (Henshaw et al., 1998). The greatest drawbacks of the system with the phostosynthetic bacteria remain its low cost effectiveness due to the use of a light source and use of suspended-growth reactors to ensure the transparency of medium. For the growth of colourless sulfur bacteria producing So (chemoautotrophs, see above), it is important for microaerophilic conditions to prevail, e.g. in the presence of sulfide concentrations up to 80 mg L-1 only less than 10% sulfate

28
was produced if O2 concentration remained below 6 mg L-1. Sulfide was concluded to be inhibitory to sulfate producing microorganisms or a more preferred electron donor than sulfur (Buisman et al., 1990). Later Janssen (Janssen et al., 1997) found the optimal concentration of oxygen to be 0.1 mg L-
1, guaranteeing the 92% conversion of sulfide into elemental sulfur. The optimal molar ratio of oxygen to sulfide consumption was 0.7 (autotrophic conditions) and 1.0 - 1.6 (heterotrophic conditions). 3.6. Characteristics of baker’s yeast wastewater Yeast production wastewater is a complex mixture. Most of the contaminants in the wastewater are due to the use of molasses as a main raw material. As a by-product of sugar manufacturing, molasses has 45 to 50% of residual sugars, 15 to 20% of non-sugar organic substances, 10 to 15% of ash (minerals) and about 20% of water. During yeast fermentation process, the sugars contained in the molasses were utilized as carbon and energy source. The major part of the non-sugar substances in the molasses (molasses residuals), however, is not assimilable by the yeast and releases unchanged to the processing wastewater, which represents the principal waste in the yeast production process. Besides molasses residuals, yeast production wastewater also contains chemicals added during fermentation (e.g. various salts, antifoams, propionic acids, brine, etc), yeast metabolites and residual yeast cells. Depending on type of yeast fermented (commercial baker’s yeast, seed yeast or yeast for special products), the yeast fermentation wastewaters are characterized by high content of COD (10000-80000 mg L-1), strong nitrogenous (1500-2500 mg L-1 total N), sulfate-rich (2000-10000 mg L-1), phosphorus (30-60 mg L-1 ), recalcitrant for biodegradation and highly coloured (melanoidins etc.) substances. 3.6.1. Beet molasses – main raw material for baker’s yeast fermentation The principal raw materials used in producing baker’s yeast are the pure yeast culture and molasses. The yeast strain used in producing compressed yeast is Saccharomyces cerevisiae. Other yeast strains are required to produce dry yeast products. Several types of dry yeast are produced, including active dry yeast (ADY) and instant dry yeast (IDY). Instant dry yeast is produced from a faster-reacting yeast strain than that used for ADY. The main difference between ADY and IDY is that ADY has to be dissolved in warm water before usage, but IDY does not. Another product is inactive dry yeast. This is yeast which has been inactivated and dried. It should have no diastase activity. Cane molasses and beet molasses are the principal carbon sources to promote yeast growth. Molasses contains 45 to 55 % fermentable sugars, in the forms of sucrose, glucose, and fructose.

29
The amount and type of used cane and beet molasses depend on the availability of the molasses types, costs, and the presence of inhibitors and toxins. Usually, a blend consisting of both cane and beet molasses is used in the fermentations. Once the molasses mixture is blended, the pH is adjusted to between 4.5 and 5.0 because more alkaline mixture promotes bacteria growth. As a rule concentrated sulfuric acid is utilized for pH adjustment because of price, hadling simplity and availability. Bacteria growth occurs under the same conditions as yeast growth, making pH monitoring very important. The molasses mixture is clarified to remove any sludge and is then sterilized with high-pressure steam. After sterilization it is diluted with water and held in holding tanks until it is needed for the fermentation process. A variety of essential nutrients and vitamins is also required for yeast production. The nutrient and mineral requirements include nitrogen, potassium, phosphate, magnesium, and calcium, with traces of iron, zinc, copper, manganese, and molybdenum. Normally, nitrogen is supplied by adding ammonium salts, aqueous ammonia, or anhydrous ammonia to the feedstock. Phosphates and magnesium are added, in form of phosphoric acid or phosphate salts and magnesium salts. Vitamins are also required for yeast growth (biotin, inositol, pantothenic acid, and thiamine). Thiamine is added to the feedstock. Most of the other vitamins and nutrients are already present in sufficient amounts in the molasses. The composition of molasses is shown in Table 3. Table 3. An average composition of beet and cane molasses at 75% dry matter (Olbrich, 1973)
Constituent Beet molasses Cane molasses
Total sugar (%) 48-52 48-56 Non-sugar organic matter (%)
12-17 9-12
Protein (Nx6.25)(%) 6-10 2-4 Potassium (%) 2.0-7.0 1.5-5.0 Calcium (%) 0.1-0.5 0.4-0.8 Magnesium (%) ca. 0.09 0.06 Phosphorus (%) 0.02-0.07 0.6-2.0 Biotin (%) 0.02-0.15 1.0-3.0 Pantothenic acid (mg kg-1) 50-100 15-55 Inositol (mg kg-1) 5000-8000 2500-6000 Thiamine (mg kg-1) ca. 1.3 1.8
30
3.6.2. Beet molasses components in wastewater
During yeast fermentation process, the sugars contained in the molasses were utilized as carbon and energy source. The major part of the non-sugar substances in the molasses (molasses residuals), however, is not assimilable by the yeast and releases unchanged to the processing wastewater, which represents the principal waste in the yeast production process.
3.6.2.1. Betaine and its behavior in anaerobic treatment processes
Betaine ((CH3)3N+CH2COO-), also known as N,N,N-trimethyl glycine, is one of
the main soluble nitrogenous compounds in sugar-beet. Sugar-beet molasses used as growth medium for yeast contains large amounts of trimethylglycine or betaine (up to 6% DS) (Thalasso et al., 1999). This highly water-soluble compound (maximum solubility of 1600 g dm-3 of water) is extracted with sucrose from sugar-beet pulp and is carried through the subsequent processing stages into the molasses fraction. Betaine is not consumed to any signifcant extent during baker’s yeast fermentation and appears to largely pass through the subsequent processing stages, becoming a signifcant constituent of wastewaters produced by yeast industry processing beet molasses. The presence of betaine in wastewaters from fermentation plants using sugar-beet molasses as substrate has been confrmed by Derycke et al. (Derycke et al., 1993). In anaerobic treatment plants, trimethylglycine can be almost totally degraded by a multi-step process with nitrogen-containing intermediates trimethylamine and other methylated amines, which are further degraded by methanogens, yielding CO2, ammonium and methane (Thalasso et al., 1999). The ammonium formed buffers the treatment system and enables its stable work. Cleavage of trimethylglycine into trimethylamine and acetate is characteristic of some halophilic fermentative bacteria (Moune et al., 1999).
2.5 trimethylglycine + 4.04 H2 → 2-propanol + 2.5 trimethylamine + 0.95 acetate + 0.1 CO2 +1.9 H2O (16)
trimethylglycine + 1.32 serine + H2O → trimethylamine + 2 acetate + 1.32 CO2 + 1.32 NH3 (17)
The similar cleavage mechanism for trimethylglycine under anaerobic conditions has also been reported for Clostridium sporogenes
(Naumann et al., 1983, Zumbusch et al., 1994) while the fermentation products of Eubacterium
limosum are N,N-dimethylglycine, acetic acid and butyric acid (Müller et al., 1981, Tchobanoglous et al., 1991). The acetate and trimethylamine can be readily used as carbon and energy sources by acetotrophic (e.g.

31
Methanobacterium soehngenii) and methylotrophic methanogens (e.g. Methanosarcina barkeri), respectively (Sax and Lusk, 1995): CH3COOH → CH4 + CO2 (18)
4 (CH3)3N + 12 H2O → 9 CH4 + 3 CO2 + 6 H2O +4 NH3 (19)
Since betaine is not detected by COD dichromate assay its concentration can be underestimated that leads to significant overloading of WWTPs. Furthermore, betaine is a nitrogenous compound, its complete anaerobic degradation can result in the increase of effluent ammonia concentration. This will raise the risk of ammonia inhibition of the anaerobic stage by free ammonia (Thalasso et al., 1999, Menert, 2001).
Considering that betaine is not present at significant concentrations in sugar-cane molasses, these potential problems do not apply to wastewaters plants treating effluents from sugar-cane molasses fermentation plants.
3.6.2.2. Colour substances
Sugar beets contain no colouring materials, but they do contain colour-forming substances. Sugar and nonsugars participate in the production of colour (caramel substances, melanoidines) or nonsugars as such (phenol-iron complexes, melanins) are responsible. The degree of discoloration is related primarily to pH and temperature. The discoloration in sugar juices increases threefold for each 10°C rise in temperature of processing. Colouring matter is formed not only when bases or acids react, but also, to some extent, from decomposition of saccharose. These mixtures of colour-conferring materials are referred to in the literature under various names, such as caramelan, caramelene, carameline, saccharan and fuscazinic acid. In addition, furfural derivatives are formed simultaneously together with volatile compounds (aldehydes, such as acrolein) and also carbon dioxide. The colouring matters that appear in the course of sugar manufacture can be divided into the following groups (Olbrich, 1973): A) Caramel materials. These substances are the results of thermal
decomposition (including loss of water) of saccharose; they contain no nitrogen. At constant pH the formation of caramel is directly proportional to the effective temperature.
B) Polyphenol-iron complexes. Pyrocatechol (plant pigment), which occurs in the epidermis and the head of beets (in amounts around 0.02%) leads to a yellow-greenish discoloration of the sugar juices resulting from the formation of a pyrocatechol-iron complex. This is not entirely removed during the defecation of the juice and can be found in molasses.
32
C) Melanoidines. Melanoidines are high molecular weight polymers. The formation of melanoidins comprises a set of consecutive and parallel chemical reactions taking place between amino compounds and carbohydrates during a Maillard reaction (Cämmerer and Kroh, 1995).
D) Melanins. Beet tyrosinase, which belongs to the polyphenol-oxidases, contains copper in its active group. On access of air it introduces the oxidation of various aromatic compounds (pyrocatechol, tyrosine) and products blackish-grey discolorations. This reaction, known as melanin-formation, requires only the enzymatically catalyzed oxidation for its initiation and then proceeds as a chain reaction passing through red and red-brown intermediate stages to orthoquinone-like compounds. Since this discoloration can be removed almost completely in the predefecation of beet-sugar juice, melanins seldom appear in molasses.
Phenolic compounds responsible for beet molasses wastewater color are partly removed (63% removal) during aerobic-anoxic treatment process, but color removal accounted for only 8-23% (Kalyuzhnyi et al., 2005). This is in accordance with other literature data (Francisca Kalavathi et al., 2001) that the visible color is mainly asociated with other substances than phenolic compounds namely, with persistent to biodegradation melanoidins. Conventional anaerobic-aerobic treatment processes can accomplish the degradation of melanoidins only up to 6% or 7% (Gonzàlez et al., 1999, Guimaraes et al., 1999). Therefore, it is necessary to study additional treatments to remove color from molasses effluents and prevent the serious environmental problems that colored wastewaters can promote in river courses such as the reduction of both photosynthetic activity and dissolved oxygen concentration. Melanoidins can be removed by physico-chemical treatments. These methods require high reagent dosages and generate a large amount of sludge (Gonzàlez et al., 1999). It was reported (Gladchenko et al., 2004) that application of iron and aluminium coagulation for molasses wastewater post-treatment of biofilter effluents showed that color, COD, nitrogen and phosphate decreased with incresing acting Fe and Al concentrations and the discharge limits were already archievable under iron concentrations around 200 mg L-1 and auminium around 540 mg L-1. Biological treatments with certain bacteria and fungi have also been applied, leading to lower color removal efficiency (Miyata et al., 2000). Many reseachers have tried to isolate microorganisms, which have the ability to decolorize melanoidins. Melanoidins have antioxidant properties and are toxic to many microorganisms in wastewater treatment (Frankel et al., 1978). It has been reported, however, that basidiomycetes including Corius sp. No.20 (Watanabe et al., 1982), dueteromycestes including Aspergillus fumigatus G-2-6 (Ohmomo et al., 1987), Aspergillus oryzae Y-2-32 (Ohmomo et al., 1988 b)

33
and bacteria including Lactobacillus hilgardi (Ohmomo et al., 1988 a) showed melanoidin-decolorization activity. The potential of these microorganisms to remove melanoidin from molasses wastewater are clear, but their actual use for molasses wastewater treatment processes might be difficult from the viewpoints of the stability and maintanace of color removal activity. Operation of proposed biological process will be difficult due to contamination with competetive microorganisms. Ozone has been used in many countries for the treatment of drinking water. Ozonation processes are particularly attractive because ozone can destroy hazardous organic contaminants. In the last years ozone has been applied successfully to the treatment of specific compounds such as dyes, phenolic compounds, pesticides and organochlorides (Wu and Masten, 2002, Kamenev, 2003). Neverless, the oxidation of molasses wastewater with ozone is rather limited to few investigations. In these studies synthetic solutions or very diluted wastewater were oxidized with ozone (Kim et al., 1985, Gehringer et al., 1997). Currently many yeast factories are faced with heavy trade-effluent charges. Land disposal options generate problems with ground water pollution and are prohibited in majority of the Europian regions. Many local municipal sewage treatment plants are now insisting on pre-treatment of such effluents before discharge into their sewerage. 4. EXPERIMENTAL STUDY The experimental work was conducted using arrangements and procedures typical for anaerobic wastewater treatment studies. 4.1. Materials and methods 4.1.1. Experimental methods and procedure Purification of wastewater was studied according to the following procedure. First, the anaerobic/anoxic treatment scheme was studied at full-scale equipment decribed below. Next, the lab-scale anaerobic Sequence Batch Reactor various schemes were tested. Lastly, post-ozonation and coagulation step of biologically treated wastewater was conducted. 4.1.1.1. Full-scale wastewater treatment equipment (PAPERS I and V)
The original treatment facility of OY Tampella AB (Finland) consisted of anaerobic pre-treatment stage (stainless steel mixing tank of 180 m³ with a stirrer and two up-flow anaerobic sludge blanket (UASB) reactors each of 180 m³ volume), followed by an aerobic stage (activated sludge with a 300 m³aeration tank) and a secondary sedimentation tank (45 m³) for final treatment before discharge.

34
At the beginning of present investigation new technological scheme was introduced which differed from the originally designed set-up mainly in the following (Figure 3):
• The reactors were inoculated with anaerobic sludge, brought from the Tallinn Municipal WWTP.
• The aerobic stage was replaced by the anoxic stage. The concentration of oxygen was kept at a level of 0.1 mg L-1 with an on-line oxygen analyzer Marvet OxyMat 99-1.
• The temperature was automatically controlled at +35±2°C with contact steam injection to the incoming streams of the mixing tank and both anaerobic reactors. Temperature monitoring electrodes were installed directly into the reactor wall (PT-100) and connected with the controller, which regulated steam injection pneumatic valves.
• Part of the anoxic stage sludge was re-circulated back to the inlet, i.e. to the mixing tank (acidification stage)
• Before disposal, anoxic effluent was treated by an aerobic sequencing batch reactor (SBR).
A
B Figure 3. Initial and modified treatment schemes. A - original scheme for baker’s yeast wastewater treatment (OY Tampella AB, Finland), B - modified anaerobic/anoxic schme proposed and adapted by author at the beginning of experiments Wastewater from the yeast production plant processing beet sugar molasses was divided into high strength wastewater and wash water. High strength wastewater was pumped to mixing tank and wash water was sent directly to anoxic stage. The anaerobic reactors were fed with mixture of high strength wastewater and recycled anoxic sludge. The temperature of wastewater
incoming from yeast production was 28-33o
C. Flow rate of incoming wastewater was measured by Baily Fisher Porter MAG-XM (CM) flow meters. Reactors feed and internal recycling flow rates measurements were conducted using Danfoss MAG1000/1100 electromagnetic flow meters.

35
4.1.1.2. Lab-scale wastewater treatment equipment (PAPER II)
Three different schemes of laboratory-scale experimental set-ups of ASBR (Anaerobic Sequence Batch Reactor) were used.
In the first experimental set-up stand-alone ASBR was used (Figure 4). ASBR with an active liquid volume of 0.7 L was made of glass tubing 0,145m × 0,075m (diameter). Plastic tubes were attached to the filling and drawing port. Peristaltic inflow pumps (Zalimp, Poland) were used at rates 0,51-0,48 L h-1 to fill the reactor and draw off the effluent, and to mix the suspension during the treatment process. The constant temperature during the operation was maintained by thermostat (35°±2°C).
In the second scheme ASBR was loaded with polymeric filler (Water group, Germany): 0.8cm x 1.0cm diameter, with a conditional surface area of 640 m2m-3. The volume of carriers was 0.5 L. Otherwise the experimental set-up was as in the first case.
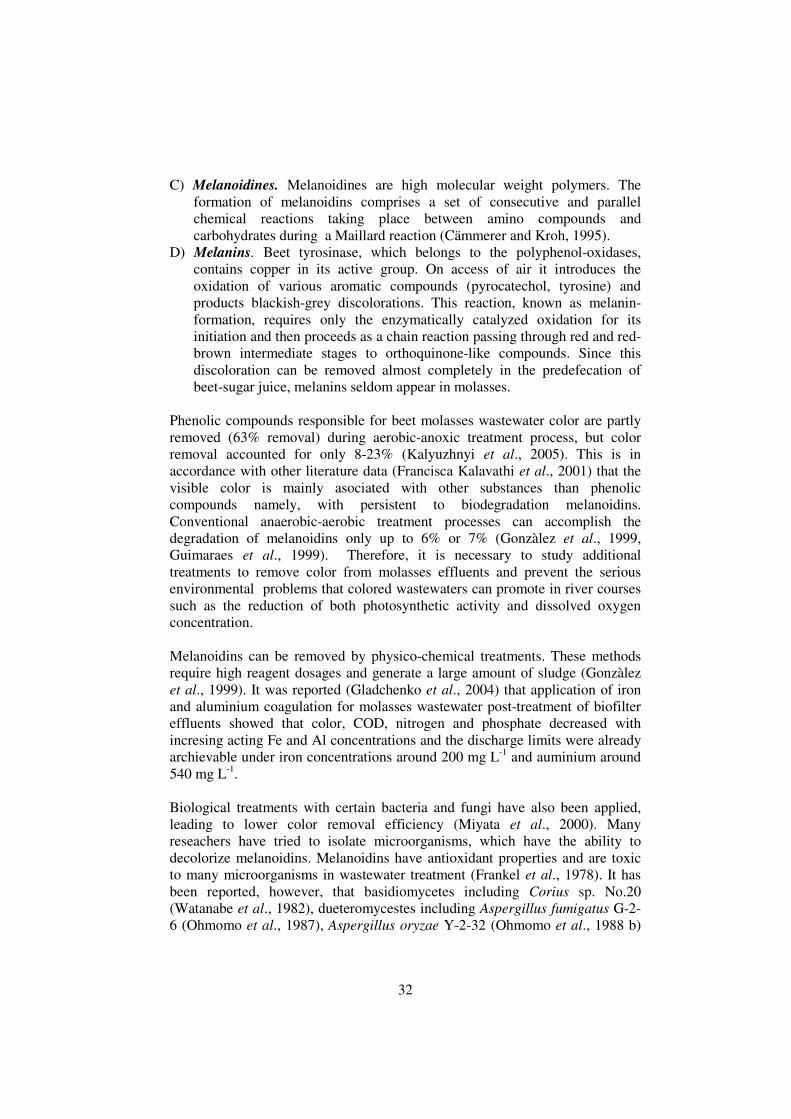
In the third set-up, coupled sequence batch reactor (CSBR), where anaerobic effluent from the ASBR was recycled through a microaerophilic system (Figure5). Mixing in microaerophilic reactor was carried out using a magnetic stirrer with regulated stirring speed (Beco, MM-5, 220W). Biogas from anaerobic reactor was passed to the microaerophilic reactor with recycling effluent. Anoxic reactor was open and the temperature of the water was same as a temperature of air in the room (20±2°C). The oxygen concentration was kept on the level 0.1-0.15 mgL-1.
Methane gas production was measured using a wet gas meter after adsorption of CO2 and H2S in a scrubber with a 10% NaOH solution.
Figure 4. Laboratory set-up for anaerobic sequencing batch reactor (ASBR). 1-anaerobic reactor, 2-thermostat, 3-peristaltic pump, 4-wet gas meter, 5-water collector, 6 – alkali lock
36
Figure 5. Laboratory set-up for coupled aerobic/anaerobic SBR (CSBR). 1-anaerobic reactor, 2-thermostat, 3-peristaltic pump, 4-aerobic reactor, 5-magnetic stirrer, 6 and 7 - valves
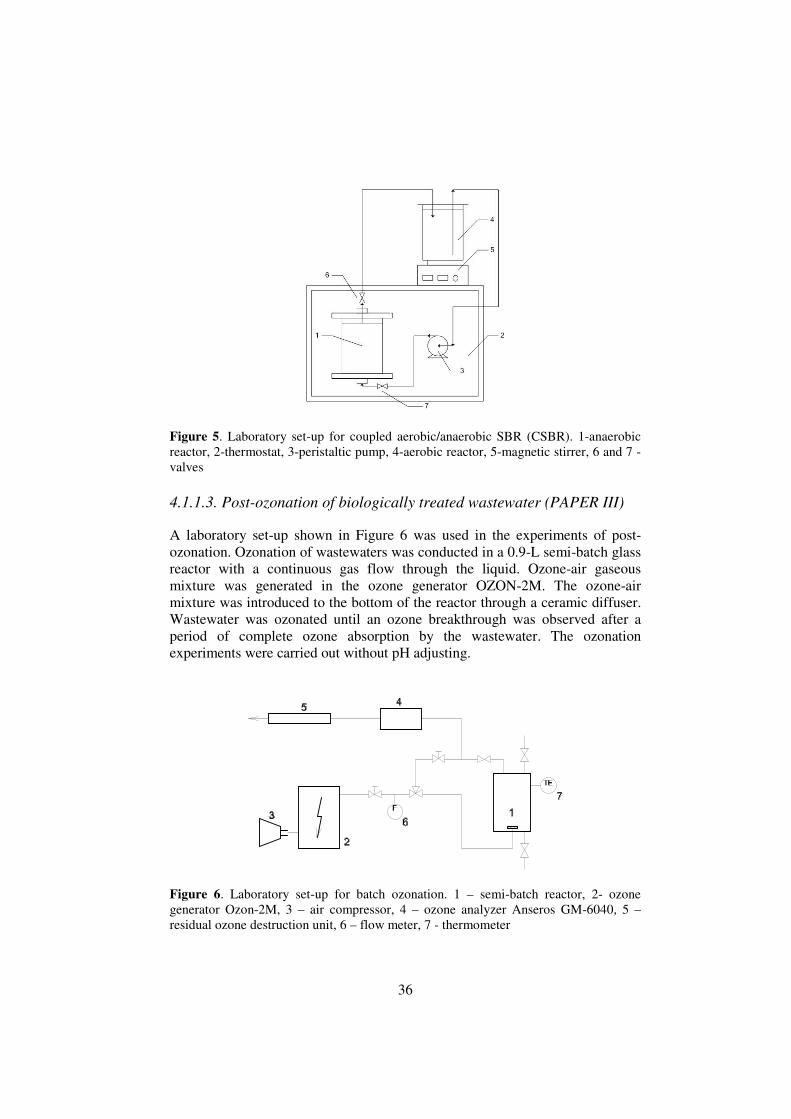
4.1.1.3. Post-ozonation of biologically treated wastewater (PAPER III)
A laboratory set-up shown in Figure 6 was used in the experiments of post-ozonation. Ozonation of wastewaters was conducted in a 0.9-L semi-batch glass reactor with a continuous gas flow through the liquid. Ozone-air gaseous mixture was generated in the ozone generator OZON-2M. The ozone-air mixture was introduced to the bottom of the reactor through a ceramic diffuser. Wastewater was ozonated until an ozone breakthrough was observed after a period of complete ozone absorption by the wastewater. The ozonation experiments were carried out without pH adjusting.
Figure 6. Laboratory set-up for batch ozonation. 1 – semi-batch reactor, 2- ozone generator Ozon-2M, 3 – air compressor, 4 – ozone analyzer Anseros GM-6040, 5 – residual ozone destruction unit, 6 – flow meter, 7 - thermometer

37
In the experiments, the absorption of ozone into pure water was studied. To minimize the ozone self-decomposition, pH of water was adjusted to 2. The ozone-air gaseous mixture was led through the water in the reactor. The concentrations of ozone in the liquid in the reactor and in the outlet gas from the reactor were monitored and recorded.
4.1.1.4. Coagulation assays
Tests were performed with 200 ml of anaerobicly/aerobicly pre-treated effluent in a laboratory glass under continuous stirring and pH control. Addition of coagulants (FeCl3·6H2O and Al2(SO4)3) was carried out under 200 rpm, then intensity of stirring was reduced to 40 rpm to complete a flocculation process during which pH was maintained at 7.2-7.5 by addition of sodium hydroxide. 4.1.2. Substrates
In all lab-scale experiments only real wastewaters from baker’s yeast production processing 100% sugar beet molasses were used. Real wastewater was obtained from Salutaguse Yeast Factory, Estonia. The wastewaters were collected from factory 1-2 times per week and subsequently refrigerated in the laboratory. 4.1.3. Seed sludges
At the beginning of full-scale experiments at Salutaguse Yeast Factory both anaerobic reactors were inoculated with digested sewage sludge from the mesophilic digester, Tallinn treatment plant. (PAPER I and V) In case of lab-scale experiments two types of seed sludge were used for the comparison of the efficiency of the process. Anaerobic sludge from the anaerobic digester of the municipal WWTP, Tallinn, Estonia, which was not adapted for the treatment of sulfates, was used in the first two lab-scale experimental set-ups, and sulfate adapted anaerobic sludge from full-scale anaerobic digesters of the Salutaguse Yeast Factory, Estonia, was used in the case of CSBR. (PAPER II) 4.1.4. Analyses
This section describes the methods used for regular samples analyzing throughout the research. These included total nitrogen, ammonia, phosphorus, sulfate and total sulfide, chemical oxygen demand (COD), total suspended solids (TSS), volatile suspended solids (VSS) and biological oxygen demand (BOD). BOD was analysed according to procedure 5210 of the Standard
Methods (APHA, 1998). Total and volatile solids were analysed as for method 2540D and E in Standard Methods (APHA, 1998).
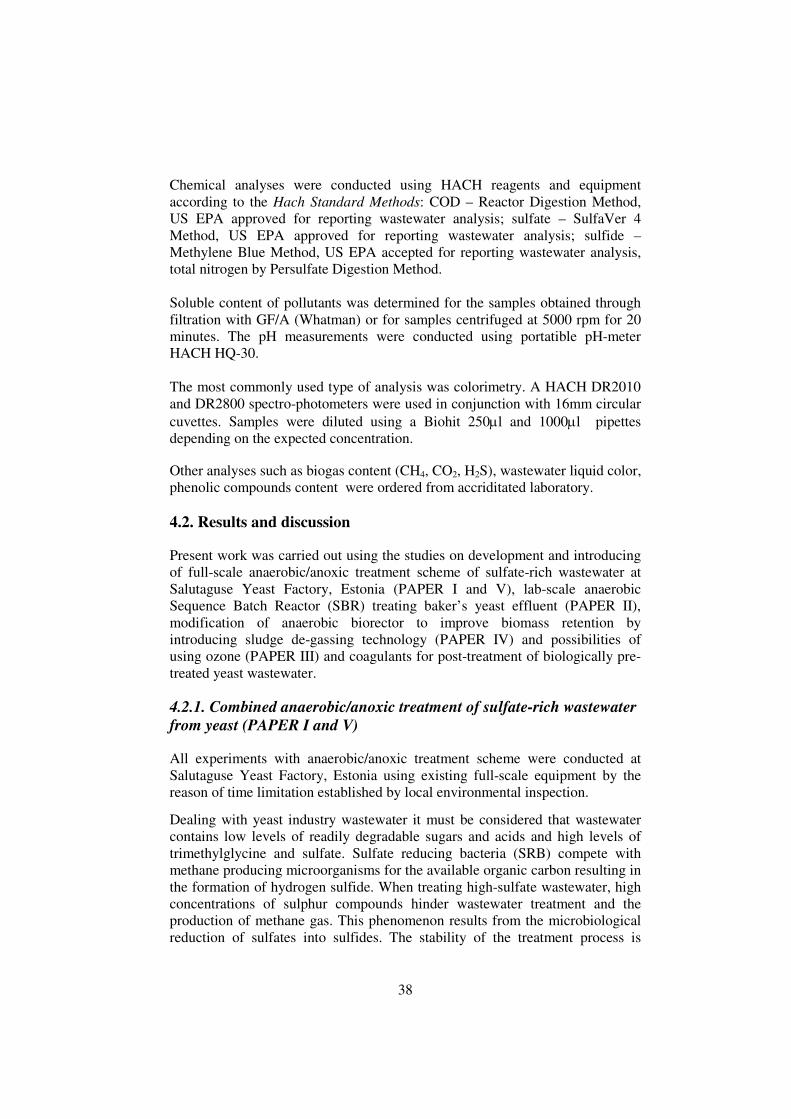
38
Chemical analyses were conducted using HACH reagents and equipment according to the Hach Standard Methods: COD – Reactor Digestion Method, US EPA approved for reporting wastewater analysis; sulfate – SulfaVer 4 Method, US EPA approved for reporting wastewater analysis; sulfide – Methylene Blue Method, US EPA accepted for reporting wastewater analysis, total nitrogen by Persulfate Digestion Method. Soluble content of pollutants was determined for the samples obtained through filtration with GF/A (Whatman) or for samples centrifuged at 5000 rpm for 20 minutes. The pH measurements were conducted using portatible pH-meter HACH HQ-30. The most commonly used type of analysis was colorimetry. A HACH DR2010 and DR2800 spectro-photometers were used in conjunction with 16mm circular cuvettes. Samples were diluted using a Biohit 250µl and 1000µl pipettes depending on the expected concentration. Other analyses such as biogas content (CH4, CO2, H2S), wastewater liquid color, phenolic compounds content were ordered from accriditated laboratory. 4.2. Results and discussion
Present work was carried out using the studies on development and introducing of full-scale anaerobic/anoxic treatment scheme of sulfate-rich wastewater at Salutaguse Yeast Factory, Estonia (PAPER I and V), lab-scale anaerobic Sequence Batch Reactor (SBR) treating baker’s yeast effluent (PAPER II), modification of anaerobic biorector to improve biomass retention by introducing sludge de-gassing technology (PAPER IV) and possibilities of using ozone (PAPER III) and coagulants for post-treatment of biologically pre-treated yeast wastewater.
4.2.1. Combined anaerobic/anoxic treatment of sulfate-rich wastewater
from yeast (PAPER I and V)
All experiments with anaerobic/anoxic treatment scheme were conducted at Salutaguse Yeast Factory, Estonia using existing full-scale equipment by the reason of time limitation established by local environmental inspection.
Dealing with yeast industry wastewater it must be considered that wastewater contains low levels of readily degradable sugars and acids and high levels of trimethylglycine and sulfate. Sulfate reducing bacteria (SRB) compete with methane producing microorganisms for the available organic carbon resulting in the formation of hydrogen sulfide. When treating high-sulfate wastewater, high concentrations of sulphur compounds hinder wastewater treatment and the production of methane gas. This phenomenon results from the microbiological reduction of sulfates into sulfides. The stability of the treatment process is

39
dependent on the pH value as well as the concentration of sulfides formed. Sulfides formed during the treatment process inhibit the growth of methanogens as well as the SRB in the pH range of 7.2-8.5 (O’Flaherty et al., 1998). All mentioned above could be summarized as a main key point when designing anaerobic treatment process for sulfate-rich baker’s yeast wastewater.
The wastewater treatment plant (incl. a biological purification facility) for the treatment of the separation of residues of baker’s yeast at Salutaguse (Estonia) was constructed by the Finnish contractor OY Tampella AB. It has been in operation since 1991, but has never performed satisfactorily. Thus, the aim of this study was to achieve the optimal set-up and operational parameters for removing sulfate and avoiding the inhibitory effects of sulfides in the anaerobic treatment of yeast industry wastewaters.
It is possible to remove the hydrogen sulfide produced in the anaerobic reactor from sulfate by partly oxidizing it into elemental sulphur. This process can be performed in an anoxic reactor where the concentration of oxygen is below 0.1 mg O2/L. The elemental sulphur formed can be removed in the sedimentation tank ( Janssen et al., 1997, Fox et al., 1996). The wastewater circulates from the anaerobic reactor to the subsequent aerobic reactor and from that point back to the anaerobic reactor.
Considering the specific character of baker’s yeast wastewater suitable technological treatment scheme was developed and introduced to existing equipment (Figure 7). The main difference between original designs is that new scheme contained anoxic sludge recirculation back to anaerobic stage (acidification tank). This industrial experiment has shown good results and process stability within short period of acclimation and long period of operation without surplus investments for wastewater treatment plant. All existing equipments were utilized in this experiment. Before disposal, anoxic effluent was treated by an aerobic sequencing batch reactor (SBR). Wastewater from the yeast production plant, processing sugar-beet molasses was divided into high strength wastewater (first separation, yeast wash water, 20% of the equipment wash water) and wash water (80% of equipment wash water, molasses clarification/cleaning, plant staff municipal waste water). High strength wastewater was pumped into a mixing tank and wash water was sent directly to an anoxic reactor. The next stage was SBR, which was used also as a bypass. The anaerobic reactors were fed with a mixture of high strength wastewater and recycled anoxic sludge. The temperature of the incoming wastewater from yeast production was +28 ÷ +33°C.

40
Figure 7. The technological set-up used in the Salutaguse Yeast Factory with re-circulation of the sludge from anoxic reactor back to the inlet, i.e. to the mixing tank

41
4.2.1.1. Characteristics of wastewater
The Salutaguse Yeast Factory (a subsidiary of Lallemand Inc.) generated 270 m3 d-1 of wastewater originating 100% from beet molasses. The yeast wastewater to be treated in anaerobic/anoxic stage is characterized by high BOD (up to 14550 mg L-1) and COD (up to 26155 mg L-1 by dichromate method) values. Sulphur is present in the wastewater as sulfate ions (up to 4060 mg L-1). The wastewater streams of Salutaguse Factory consist of (Table 4, Figure 8):
• first separation (high concentrated wastewater, t=+40°C, pH between 4 and 5), • yeast wash water (t=+14°C, pH between 6 and 10), • floor and equipment wash water; • cooling water (t=+28 to +30°C, pH 7); • molasses clarification/cleaning (limited amounts, depends on type/quality
of molasses, this stream is included in the high concentrated wastewater); • municipal wastewater (limited amount, directly to anoxic stage).
Figure 8. Scheme of wastewater streams at Salutaguse Yeast Factory
Final effluent
10-30 m3 d
-1
(53 m3 d
-1)
(20 m3 d
-1)
First separation (70 m
3 d
-1)
Yeast wash water (100 m
3 d
-1)
Equipment wash water
(100 m3 d
-1)
Cooling water (800 m
3 d
-1)
Molasses clarification /
cleaning (3 m3 d
-1)
Plant staff municipal
wastewater (3 m
3 d
-1)
Holding tank (190 m
3 d
-1)
Anaerobic stage
(137 m3 d
-1)
Anoxic stage SBR
(80 m3 d
-1)

42
Table 4. The average wastewater characteristics of Salutaguse Yeast Plant, Estonia
COD excluding betaine
COD including betaine (+20%)
BOD Suspended Solids (SS)
Total Nitrogen Total Phosphorus (P)
SO4 2- Type of
wastewater
Hyd
raul
ic lo
adin
g (m
3 d-1
)
Con
cent
rati
on
(mg
L-1
)
Loa
ding
(k
g d-1
)
Con
cent
rati
on
(mg
L-1
)
Loa
ding
(k
g d-1
)
Con
cent
rati
on
(mg
L-1
)
Loa
ding
(k
g d-1
)
Con
cent
rati
on
(mg
L-1
)
Loa
ding
(k
g d-1
)
Con
cent
rati
on
(mg
L-1
)
Loa
ding
(k
g d-1
)
Con
cent
rati
on
(mg
L-1
)
Loa
ding
(k
g d-1
)
Con
cent
rati
on
(mg
L-1
)
Loa
ding
(k
g d-1
)
First separation beer
70 55000 3850 66000 4620 30500 2135 1500 105 3500 245 60 4,2 8000 560
Yeast cream wash water
100 10600 1060 12720 1272 5890 589 300 30 700 70 10 1,0 2100 210
Equipment washing
100 3000 300 2000 200 500 50 100 10 20 2,0 400 40
Total influent average
270 19295 5210 21820 5892 10830 2924 685 185 1204 325 26,7 7,2 3000 810
Influent to anaerobic/ anoxic stage
190 26155 4970 31010 5892 14550 2764 716 136 1660 315,2 27,6 5,24 4057 771
Cooling water (directly to creek)
800 - - - - - - - - - - - - - -

43
In the modified anaerobic/anoxic reactors system a stabile, buffered system was observed with a pH between 7.2 and 7.5, self-regulated by the biological process (without neutralization) and with good purification efficiency. Therefore, considering the above-mentioned latest achievements in the treatment of high sulfate containing wastewaters, it was decided that there was no need for the urgent change of molasses preparation technology or of the chemical composition of mineral salts solution used for the cultivation of the yeast culture based on sugar-beet molasses. This set-up supported the creation of more favorable conditions for the methane-producing microorganisms and avoided their takeover by the sulfate reducing bacteria. The concentration of dissolved oxygen in anoxic reactor was kept strictly below 0.1 mgO2 L-1, enabling continuing decreases in sulfide content.
4.2.1.2. Change of process parameters during the treatment process
Recirculation of a part of the wastewater/sludge from the anoxic stage back to the anaerobic stage guaranteed rapid changes in the sulfate and sulfide content. Initially the concentration of sulfates in the outlet of anaerobic reactors increased but the concentration of sulfides did not change much (Figure 9). Despite the origin of the inoculation sludge (residual sludge from the municipal WWTP), after a slight initial increase, the concentration of sulfates started to decrease constantly reaching zero in 35 days (acclimatization effect). The concentration of sulfides in the anaerobic reactor 1 increased to some extent on the account of increasing feed, while there was no evident correlation between the concentration of sulfides and the hydraulic loading rate in the reactor 2. In the anoxic tank, the concentration of sulfates also remained close to zero while the concentration of sulfides did not exceed 50 mg L-1 in most of the cases (Figure 10). An anoxic reactor as well as anaerobic reactors recovered from fluctuations of sulfate concentration (evoked by various reasons) in a very short time (Figure 9 and Figure 10). Simultaneously with the drop in the concentration of sulfates the COD value of wastewater in the mixing tank (inlet) also decreased, caused by the dilution effect resulting from re-circulation from the sedimentation tank (Figure 11). On the 51st day of the experiments, reactor 2 was supplemented with an additional amount (50 m3) of residual sludge, collected from the anoxic reactor. Thus, the necessity of the transportation of it from the Tallinn Municipal WWTP was avoided as well as the possible contamination of the reactor with fine particles of sand. This supplementary inoculation of reactor 2 reduced its effluent contamination (expressed as COD), in spite of the increasing contamination of the influent from the mixing tank (Fig. 5). Simultaneously, there was a sharp decrease in the volatile fatty acids (VFAs) content in the effluent from reactor 2 (Figure 12).

44
Because of the use of combined anaerobic/aerobic reactors system, the biological purification process had started already in the mixing tank. Results from analyses demonstrated that supernatant COD (SCOD) of the sample from the mixing tank was decreased up to 40% and the sulfide content up to 31% compared to the corresponding values in the holding tank. In the mixing tank, the concentration of sulfides originated from sulfates was 36.2 mg L-1. These results confirm that the elaboration of the modified technological set-up of wastewater treatment also converted the mixing tank into a biological reactor. The removal of sulfates from wastewater is not as complicated as guaranteeing the stability of this system. The purification scheme under study can be distinguished from other similar ones by returning anoxic residual sludge back to the mixing tank. The above-mentioned technology enables the ability to work at a high loading rate without using granulated sludge. Figure 9. Hydraulic loading rate (feed, m3 d-1) and the content of sulfates and sulfides (mg L-1) in the effluent from anaerobic reactor 2: �- sulfates inlet, � - sulfates outlet, � - sulfides, � - feed.
0
500
1000
1500
2000
2500
3000
3500
4000
0 20 40 60 80 100 120 140 160 180
Time, d
Co
ncen
trati
on
, m
g L
-1
0
10
20
30
40
50
60
70
80
90
100
Feed
, m
3 d
-1
Additional
inoculation with
anaerobic sludge
Wash waters to
anaerobic reactors
From anoxic
reactor back
to anaerobic
reactors

45
Figure 10. Influence of re-circulation on the concentration of sulfates and sulfides in anoxic reactor: � - sulfates (mg L-1), � - sulfides (mg L-1)
Figure 11. Concentration of total chemical oxygen demand (TCOD, mg L-1) in anaerobic reactors: � - TCOD of the inflow to the mixing tank, �- TCOD of reactor 1, � - TCOD of reactor 2.
Co
ncen
trati
on
of
CO
D, m
g L
-1
100 120 140 160 180
Wash waters
to anaerobic
reactors
Time, d
25000 From Additional
0
5000
10000
15000
0 20 40 60 80
anoxic
reactor
back to
reactors
inoculation with
anaerobic sludge
anaerobic
0
100
200
300
400
500
600
700
800
900
0 50 100 150 200 250 300 350 400 450
Time, d
Co
ncen
trati
on
, m
g L
-1
inoculation with
anaerobic sludge Wash waters to
anaerobic reactors
reactor back
reactors

46
Figure 12. Concentration of volatile fatty acids (VFAs, mg L-1): � - in the mixing tank, �- in the effluent from anaerobic reactor 1, �- in the effluent from anaerobic reactor 2.
4.2.1.3. Estimation of trimethylglycine content in wastewater
Regarding the literature data, using sugar-beet molasses as a growth medium, after cultivation of yeasts up to 4.5 g L-1 trimethylglycine could remain in the separation residue (high strength wastewater) (Thalasso et al., 1999). However, that amount might be omitted from the COD analysis by the bichromate method. The latter is performed as acid hydrolysis at elevated temperatures. Depending on the presence of methyl groups linked to N-atom, gaseous products could be formed that will not be recorded (Menert, 2001). Therefore, it would be reasonable to add to the COD concentration in the holding tank an additional 20% of hidden contamination load at the expense of trimethylglycine (Table 4). Thus, the treatment efficiency of the entire anaerobic/anoxic system appeared to be 79%.
Anaerobic microorganisms degrade trimethylglycine completely into trimethylamine, acetate, and other compounds (Eq. 20 and 21).
2.5 trimethylglycine + 4.04 H2 → 2-propanol + 2.5 trimethylamine + 0.95 acetate + 0.1 CO2 +1.9 H2O (20)
120
Time, d
0
20
40
60
80
100
0 20 40 60 80 100 120 140 160
Vo
lati
le f
att
y a
cid
s, m
Eq
L-1
From anoxic
reactor back
to anaerobic
reactors
Additional
inoculation
with anaerobic
sludge
Wash waters to
anaerobic
reactors

47
trimethylglycine + 1.32 serine + H2O → trimethylamine + 2 acetate + 1.32 CO2 + 1.32 NH3 (21)
Trimethylamine is further degraded into methane, CO2 and ammonia (Eq. 22), while the ratios between trimethylglycine and trimethylamine and trimethylamine and ammonia always remain equimolar.
4 (CH3)3N + 12 H2O → 9 CH4 + 3 CO2 + 6 H2O +4 NH3 (22)
Assuming that N-compounds produced during the microbiological degradation of trimethylglycine practically do not volatilize (in an anaerobic reactor), based on their apparently increased values an approximate estimation of trimethylglycine content in wastewater can be given. To prove the above presented assumption, a separate experiment on laboratory sequencing batch reactor (SBR) was conducted, using wastewater from the Salutaguse Plant. The analyses of Ntot were performed by the persulfate digestion method that mostly considers the nitrogen present as amino groups (in proteins and amino acids) as well as NH4. The concentrations of NO3
- and NO2- in the influent were
practically zero. The concentration of Ntot in the influent was 250-475 mg L-1 and in the effluent 270-875 mg L-1 (average 571 mg L-1) (Table 5). Therefore, according to equations 20 and 21, from trimethylglycine trimethylamine in the ratio of 1:1 (and further NH4 with the same ratio) could be obtained. Taking MWNH4=18 and MWtrimethylglycine=118, we get 0.571/18=0.032 mol, corresponding to 0.032*118=3.74 g L-1 trimethylglycine. This is the concentration of trimethylglycine in the industrial wastewater of Salutaguse Yeast Factory by theoretical calculations.
From trimethylamine in turn we can obtain methane in a ratio of 4:9 (equation 22), e.g. from 1 mol trimethylamine (trimethylglycine) 2.25 mol methane. Thus, from 1 mol (118 g) trimethylglycine 9/4*22.4=50.4 L methane can be formed and from 3.74 g L-1 trimethylglycine in the reactor the formation of 3.74/118*50.4=1.60 L methane is possible. The degradation of carbonaceous organic material by anaerobic bacteria leads to the production of methane at the theoretical stoichiometric conversion rate of 0.35 m3 of methane per kg of COD converted (Sax et al., 1995). Adding 1.60 L to 0,35 L methane produced from the rest of COD we get 1.95 L that was almost the same amount of methane (per g COD removed) as observed in our experiments (Table 5).

48
Table 5. Results of chemical analysis on laboratory SBR reactor
Dur
atio
n of
ex
peri
men
t (d
)
Flo
w (
ml d
-1)
CO
D o
f in
flue
nt
(mg
L-1
)
CO
D o
f ef
flue
nt
(mg
L-1
)
∆C
OD
(m
g L
-1)
CO
D r
emov
ed (
g)
The
oret
ical
bio
gas
prod
ucti
on f
rom
CO
D
(L (
g C
OD
*d)-1
)*
Rea
l bi
ogas
pro
duct
ion
by C
OD
rem
oved
(L
g-1
)
Nto
t of
infl
uent
(m
g L
-1)
Nto
t of
effl
uent
(m
g L
-1)
Bet
aine
con
cent
rati
on
(g L
-1)
Bio
gas
from
bet
aine
(L
d-1
)
Tot
al t
heor
etic
al b
ioga
s (L
d-1
)
Rea
l bi
ogas
pr
oduc
tion
(L
d-1
)
22 105 23660 15840 7820 0.821 0.287 1.729 255 690 4.5233 0.203 0.490 1.420
39 175 20280 17200 3080 0.539 0.189 2.059 250 270 1.7700 0.132 0.321 1.110
47 200 20280 13960 6320 1.264 0.442 0.736 475 875 5.7361 0.490 0.932 0.930
68 200 20540 5030 15510 3.102 1.086 0.484 325 650 4.2611 0.364 1.450 1.500
75 200 20540 3970 16570 3.314 1.160 0.772 345 550 3.6056 0.308 1.468 2.560
88 245 22890 3670 19220 4.709 1.648 0.656 255 690 4.5233 0.473 2.121 3.090
100 280 22890 11040 11850 3.318 1.161 0.452 250 270 1.7700 0.212 1.373 1.500
Average 201 21583 10101 11481 2.438 0.853 0.710 308 571 3.741 0.312 1.165 1.730 *Theoretical biogas production from COD was calculated on the assumption that on the degradation of carbonaceous organic
material 0.35 m3 of methane per kg of COD converted is produced.

49
4.2.1.4. Decrease of sulfide concentration at the expense of trimethylglycine
In redox reactions, the nitrogen (oxidation state +5) contained in trimethylglycine can be an electron acceptor for two electrons. The sulfide ion can donate two electrons, and thus, be converted into elemental sulphur. Considering the stoichometric ratio in the chemical reaction between trimethylglycine (ammonia) and the sulfide ion (sulfate ion) (Fdz-Polanco et al., 2001).
SO42- + 2 NH4
+ → S0+ N2 + 4 H2O (23)
consisting of the following reactions:
3 SO42- + 4 NH4
+ → 3 S2- + 4 NO2- + 4 H2O + 8 H+ (24)
3 S2- + 2 NO2- + 8 H+ → N2 + 3 S0 + 4 H2O (25)
2 NO2- + 2 NH4
+ → 2 N2 + 4 H2O (26) the concentration of sulfide ions can be decreased by 1,026 mg (0.032 mol) at the expense of 3,74 mg (0.032 mol) trimethylglycine. The concentration of sulfates in the holding tank at the end of the experiment (day 166) was 4200 mg/L from which the sulfate reducing bacteria are able to produce 1,400 mg/L sulfides (Widdel et al., 1991),(Eq. 27).
2 lactate¯ + SO42- + 3 H+ → 2 acetate¯ + 2 CO2 + 2 H2O + HS¯ (27)
If the concentration of sulfides in the wastewater can be reduced at the expense of trimethylglycine, then the residual concentration of sulfide ions should be 1,400-1,026=376 mg L-1. At the end of the experiment, the concentration of sulfides in the anaerobic reactor 1 was measured as 360 mg L-1 and in the reactor 2 as 390 mg L-1 giving an average of 375 mg L-1. The fluctuations of sulfide concentration during the experiment were 176 - 410 (average 296) mg L-
1 in reactor 1 and 176-417 (average 307) mg L-1 in reactor 2.
According to the technological set-up presented in Figure 3, the biological processes in the anaerobic reactors and in the anoxic reactor are inter-related by the returned sludge from the secondary sedimentation tanks. The effluent from settler (by anoxic reactor) is re-circled to the inlet of the mixing tank. The evaluation of the efficiency of anaerobic and anoxic stages as well as the total efficiency of the system has demonstrated that leading the wash waters back to the holding tank improved the efficiency of the anoxic stage. The performances of the anaerobic stage and the anoxic stage counterbalance each other guaranteeing the relative stability of the entire system (Fig. 13A and 13B). After the start-up research, the wastewater loading was increased to 400 m3 d-1, up to 40% more than the initial loading. Aerobic polishing was commenced on day 220. The final treatment efficiency of the entire system consisting of two anaerobic reactors, anoxic reactor and SBR for aerobic polishing appeared to be up to 98% (by BOD) and over 90% (by COD).

50
A
B Figure 13. The treatment efficiency: A) by the total COD value (TCOD, %), B) by the soluble COD value (SCOD, %). �- anaerobic reactor 1, � - anaerobic reactor 2, � - anoxic reactor, � - sequenced batch reactor, � - the whole system.
-60
-40
-20
0
20
40
60
80
100
0 20 40 60 80 100 120 140 160 180 200 220 240 260 280 300 320 340 360 380 400
Time / d
Eff
icie
nc
y / %
Wash waters to
anaerobic reactors
-60
-40
-20
0
20
40
60
80
100
0 20 40 60 80 100 120 140 160 180 200 220 240 260 280 300 320 340 360 380 400 420 440
Time / d
Eff
icie
nc
y / %
Wash waters to
anaerobic reactors

51
Because of additional inoculation of reactor 2 with adapted anaerobic sludge from the anoxic reactor (on day 51), the biogas production from the former was more intensive. Exact biogas measurement was commenced on day 76. Leading wash waters to the mixing tank increased the production of biogas up to 25m3 h-1. The maximum biogas production achieved was up to 37m3 h-1 in both reactors because of increased loading (up to 16 kg COD m-3 d-1).
4.2.1.5. Energy balance
Energy is produced in form of biogas during anaerobic fermentation. During experiment taken biogas samples indicated that average CH4 content was between 65% and 70% by volume. Considering actual loading (5210 kgCOD day-1) the expected theoretical methane production will be in the range of 1094-1188 Nm3CH4. These values correspond to biogas volumes of 1683-1827 Nm3 day-1.
For Salutaguse Yeast Factory is more attractive electrical energy needed to decrease expanses for aeration (second stage of wastewater treatment process). Considering expected biogas production of 1683-1827 Nm3 day-1 with methane content of 65% it agrees with an energy capacity of 10612-11523 kWh day-1. Combined (electricity/heat) microturbine could produce about 133-144 kWh (~30% efficiency) of electrical energy and 221-240 kWh (~50% efficiency) heat energy simultaneously. 4.2.1.6. Conclusions
Differently from other similar biological wastewater purification schemes, residual sludge from the anoxic stage was returned to the beginning of the purification scheme (mixing tank). Therefore, the main results of our combined anaerobic/anoxic reactors system were: • The purification of baker’s yeast wastewater (produced from sugar beet
molasses, having high SO4
2- content) was feasible without the use of
granulated sludge. • There was no need to use chemicals for pH-control • The returned anoxic sludge retained methanogenic activity; no additional
inoculation of anaerobic reactors was needed. • COD reduction efficiency (by TCOD) in the in anaerobic + anoxic stage
was up to 80%, in anaerobic + anoxic + SBR stage up to 90% supporting
average biogas production 1800 m3
/d (with two anaerobic reactors). The system operated stabile, without sludge washout. The complete purification of wastewaters from sulfates (with 100% efficiency) accompanied by moderate production of sulfides (up to 50 mg L-1) was obviously possible at the expense of reduction of trimethylglycine to other nitrogen-containing compounds.

52
4.2.2. Treatment of sulfate containing yeast wastewater in an ASBR
(PAPER II)
The main aim of the experiments of Anaerobic Sequencing Batch Reactor (ASBR) with baker’s yeast wastewater was to establish the application possibilities and expected maximum efficiency.
4.2.2.1. Study 1 - Anaerobic Sequencing Batch Reactor (ASBR)
The sludge adaptation and process steady phase achieving a constant OLR value (7.7 kgCODm-3d-1) was applied. During the operation at a constant OLR of 7.7 kgCODm-3d-1 a significant increase in the removal efficiency to over 80% was observed. The maximum treatment efficiency (84% by COD) and the maximum biogas production of 3.79 Ld-1 was reached at OLR values between 7.7 and 8.0 kgCODm-3d-1. At higher OLR (over 8.01 kgCODm-3d-1) treatment efficiency decreased.
The average sulfate removal efficiency was 95% in the experiment. Sulfate conversion to sulfide was greater than 80% during the start-up period. Then during the days 39-89 while the OLR was constant no inhibition was detected and approximately 100% removal efficiency was observed, furthermore the concentration of sulfates in effluent did not exceed 40 mgL-1.
The composition of biogas was measured on the 65th day of experiment and was as follows: 60% CH4, 35% CO2 and 2.7% H2S. This composition indicated that mainly the methanogenic mineralization of organic matter in the ASBR was taking place.
4.2.2.2. Study II – ASBR with a polymeric filler
Experiments with polymeric filler used as a support material for microorganisms were performed in order to study the influence of artificial filler on the efficiency of process. Previous studies had shown that using of support material favored the adherence of methanogenic bacteria and accelerated washout of SRB. The authors (Isa et al, 1986) demonstrated a poor attachment ability of SRB. They have concluded on the basis of the results of their experiments that in the presence of filler SRB were washed out of the reactor providing acetotrophic methanogenic bacteria with a sufficient growth advantage. These data suggested that artificial carrier could stimulate methanogenic activity in anaerobic digester, and increase the efficiency and stability of the treatment processes.
One of two reactors was filled with polymeric filler and another was operated like in Study I without filler for comparison. The COD and sulfate removal efficiency was not significantly different between the two reactors studied, however, in reactor without carrier slightly higher average treatment efficiency was observed, sulfate removal efficiencies varied from 85% to 100%. The

53
sulfide concentrations in effluents of both reactors did not exceed inhibitory levels and were not higher than 123 mg L-1 and 110 mg L-1 respectively.
The efficiency of phosphorous removal in the reactor with carrier was significantly higher (up to 79%) than in the control reactor (57%). It could be assumed that the carrier promoted deposition of insoluble materials, for example precipitation of Ca3(PO4)2. This conclusion was supported by the observation that scaling of the carrier beads was observed in the experiment. The fast clogging of the system with a carrier treating sulfate rich wastewaters has been described also in other study (Thalasso et al, 1999). In addition to facilitating scaling, carrier could hamper the equal distribution of wastewater over the sections of the reactor, which could result in lower COD and sulfate treatment efficiency. Therefore it can be concluded that the application of the carrier for the given treatment system was not effective and can’t be recommended.
4.2.2.3. Study III – Coupled microaerophilic/anaerobic system (CSBR)
In the CSBR the effluent from the anaerobic reactor was recycled through an aeration system. The content of oxygen in microaerophilic reservoir was kept at the level of 0.1-0.15 mg L-1 to prevent sulfate formation in the oxidation of the sulfide formed in the anaerobic stage of process leaving sulphur in the form of elemental sulphur (S0) (Buisman et al, 1990). The formation of elemental sulphur is an advantage because sulphur is a colloid, inert solid and can be removed from the wastewater for example by gravity sedimentation. Anaerobic reactor was seeded with sulfate adapted anaerobic sludge, and microaerophilic reactor was seeded with activated sludge obtained from the full-scale aerobic reactor of the Salutaguse yeast plant, Estonia.
The maximum OLR achieved was 7.74 kgCOD m-3d-1. The average pH value of the final effluent was 8.2 and the alkalinity always remained up to 177 mEq L-1 at average pH of influent 4.2. There were no attempts to adjust pH of the influent. High pH values could be explained by formation of hydroxide ion during the following biological overall reaction, taking place in a microaerophilic sulfide removal system.
The results obtained allowed to conclude that rather good COD treatment efficiency (50%-70%) was observed during the experiment. Since the sludge had been well adapted to the wastewater very quick start up was observed. Only a few days after seeding the COD removal was significantly increased and reached 70%.
Sulfates removal efficiency achieved in our experiments was excellent - more than 98%. Due to low dissolved oxygen concentration (0.1-0.15 mg L-1) there were almost no sulfides and sulfates in the effluent. Only approximately 0.5 mg L-1 H2S and 0-30 mg L-1 of SO42- were present in the effluent while up to 3.6 g L-1 sulfate had been reduced.

54
4.2.2.4. Conclusions
The results of the study carried out demonstrated that the anaerobic sequencing batch reactor (ASBR) is a suitable and effective method for anaerobic treatment of sulfate rich wastewaters from baker’s yeast production plant. Optimal parameters of the process were determined. However, the problems of sulfide formation caused significant malodour problems and corrosion of equipment during the experiment. Experiments with two additional schemes developed for solving the sulfide formation problem showed that using of plastic carriers in the reactor led to the decrease of the treatment efficiency which was the result of the accumulation of insoluble sediment (presumably CaCO3 and Ca3(PO4)2) on the surface of the carriers, so this technology can not be recommended for large scale application. Combining anaerobic sulfate reduction with biological oxidation of sulfide in coupled microaerophilic/anaerobic SBR (CSBR) showed the best results and might be preferable for the treatment of sulfate rich yeast wastewaters. Since the scaling of biomass and the fast accumulation of inorganic compounds were observed also in this case, successful application of the CSBR technology requires finding a solution for removal of the inorganic precipitate from the reactor. 4.2.3. Post-treatment of biologically pre-treated wastewater effluent Wastewater from molasses processing presents a large amount of colored substances that give dark brown color and high organic load to the effluents. After a multistage biological treatment most of the organic load is removed. However, the brown color does not disappear and it can even increase because of the repolymerization of colored compounds. The main colored compounds are known as melanoidins (Gonzàlez et al., 1999). Melanoidins are high molecular weight polymers. The formation of melanoidins comprises a set of consecutive and parallel chemical reactions taking place between amino compounds and carbohydrates during a Maillard reaction (Cämmerer and Kroh, 1995). Conventional anaerobic-aerobic treatment processes can accomplish the degradation of melanoidins only up to 6% or 7% (Guimaraes et al., 1999). Therefore, it was necessary to study additional treatments to remove color from molasses effluents and prevent the serious environmental problems that colored wastewaters can promote in river courses such as the reduction of both photosynthetic activity and dissolved oxygen concentration.

55
Regarding the literature data melanoidins can be removed by: 1) Physico-chemical treatments. These methods require high reagent
dosages and generate a large amount of sludge. 2) Chemical oxidation with ozone. 3) Biological treatments with certain bacteria and fungi have also been
applied, leading to lower color removal efficiencies. (Miyata et al., 2000)
This study aims to investigate the precipitation of colored substances with coagulation and the oxydation with ozone of highly polluted biologically pre-treated wastewater from Salutaguse Yeast Factory processing beet molasses.
In the experiments of coagulation and ozonation, biologically treated yeast wastewater from Salutaguse Yeast Factory was used. Samples of wastewater were taken over a period of two months from aerobic Sequencing Batch Reactor effluent. This biologically treated wastewater had a relatively high residual COD and brown colour. The values of the most important parameters were: COD – 1500–2200 mg L–1, BOD – 160–310 mg L–1, N-total – 250-350 mg L-1, P-tot – 15-25 mg/L-1, pH – about 8. 4.2.3.1. Coagulation - performance of iron and aluminium coagulation step
Some results on efficiency of Fe3+ and Al+3 coagulation step for treatment of aerobic SBR effluent are presented in Table 6 and Table 7. It is seen that all parameters (total COD, N-total, P-total and color) decreased with increasing acting Fe and Al concentrations and the disharge limits are already achieveble under iron concentrations around 200 mg L-1 and aluminium around 400 mg L-1. The color of wastewater underwent dramatic changes from deep brown to pastel yellow after coagulation. These results are superior (with regard to coagulant added) to those reported in the literature for anaerobically treated baker’s yeast wastewater (Kalyuzhnyi et al., 2003). Table 6. Performance of iron coagulation step
Acting Fe concentration, mg L-1
0 50 100 150 200 500
CODtot,mg L-1 2120 1750 1350 1040 830 710
Phenols, mg L-1 288 260 224 178 125 99
Ptot, mg L-1 21 18,3 15,2 10,2 4,5 2,1
Ntot, mg L-1 310 245 125 101 78 61
OD580 0.414 0,380 0,331 0,250 0,165 0,067
Sludge percentage, % vol*.
- ND ND 5,4 15,8 63,4
SVI, ml g-1 TSS - ND ND 210 270 420
Sludge VSS/TSS, %
- ND ND 90 88,9 33,5
*after 30 min of settling

56
ND-not detected Table 7. Performance of aluminium coagulation step
Acting Al concentration, mg L-1
0 100 200 400 600 800
CODtot,mg L-1 2120 1910 1690 1270 800 760
Phenols, mg L-1 288 144 82 67 64 59
Ptot, mg L-1 21 15,7 7,2 4,5 3,4 1,5
Ntot, mg L-1 310 180 112 74 65 54
OD580 0.414 0,361 0,139 0,112 0,076 0,065
Sludge percentage, % vol*.
- 35,5 91,4 93,5 94,4 96,3
SVI, ml g-1 TSS - 655 615 545 355 341
Sludge VSS/TSS, %
- 42 52,4 56,5 52,2 39,8
*after 30 min of settling
The sludge formed under an acting Fe concentration of 200 mg L-1 was relatively large (SVIFe = 270 ml g-1 TSS). An acting Al concentration of 400 mg L-1 produced much more sludge (SVIAl=545 ml g-1 TSS). The iron sludge had high (~90%) VSS content compared to sludge obtained during Al coagulation step (56,5% VSS) showing the significant removal of organic COD and nitrogen during the iron coagulation step. Figure 14 shows the evolution of color removal and COD decrease for experiments carried out at different Fe3+ and Al3+ dosages.
Figure 14. Effect of Fe3+ and Al+3 dosages on color and COD removal during coagulation experiments
As the result of coagulation, absorbance at 580 nm decreased significantly. Applied concentration of Fe3+ and Al3+ had positive effect not only on color
0
500
1000
1500
2000
2500
0 50 100 150 200 400 500 600 800
Coagulant concentration, mg L-1
CO
D, m
g L
-1
0
20
40
60
80
100
Col
or r
emov
al, %
COD decrease with Fe3+
COD decrease with Al3+
Color decrease with Fe3+

57
removal but also on COD removal. Melanoidins are responsible for the brown color and included in COD.

58
Conclusion for coagulation
- The application of iron chloride and aluminium sulfate coagulation for post-treatment of anaerobic-aerobic effluents may fulfill the discharge limits to the sewer under iron concentrations around 200 mg L-1 and aluminium concentrations around 400 mg L-1.
- Significant decrease of color substances could be achieved using coagulation. It is very important when final effluent is treated by ultraviolet radiation to meet biological limits.
- Generated during coagulation sludge could be the problem when full scale process applied. The iron sludge had much better SVI which is important parameter for sludge further handling (separation, de-watering).
- Considering that Salutaguse Yeast Factory has daily 270 m3 d-1 of wastewater to be treated using coagulation process it could be proposed that up to 348 kg TSS d-1 will be generated additionally if Fe3+ is used and up to 230 kg TSS d-1 in case of Al3+. It corresponds to amount of sludge 1,05-1,58 m3 d-1 (at 22%DS after sludge dewatering).
- Installation of flotation unit is needed before sludge de-watering.
4.2.3.2. Post-ozonation of biologically treated wastewater
The results of the post-ozonation of biologically treated yeast wastewater are presented in Table 8. The experiments indicated that the efficiency of postozonation in terms of COD (COD removal) ranged from 30% to 49%, and the ratio dn/COD, consumed ozone dosage mg of ozone per mg of COD removed, ranged from 1.2 to 2.5.
Figures 15 to 19 express the dependence of CODtot, CODsol, BOD, and BOD/COD, the biodegradability of the wastewater, on the consumed ozone dose dn (mg of ozone per litre of treated wastewater). The ozone dosage required to decrease the residual COD noticeably was about 1000–1500 mg L–1, and both CODtot and CODsol decreased. This indicates that during post-ozonation the particulated organic matter in the wastewater was partly solubilized and the soluble matter was being oxidized. Table 8. Results of post-ozonation of biologically treated wastewater

59
Figure 15. The effect of ozone dosage (dn) on CODtot, BOD, and the ratio BOD/COD of biologically treated yeast wastewater (run 1). The pH rose from 7.3 to 7.9
Figure 16. The effect of ozone dosage dn on CODtot, CODsol, BOD, and BOD/COD of biologically treated yeast wastewater (run 2). The pH fell from 8.3 to 8.1
As a rule, the results of the post-ozonation of yeast wastewater depend on the wastewater composition and consequently on the previous process of biological purification. BOD and biodegradability (BOD/COD) of the wastewater increased during ozonation, as shown in Figures 15, 17, and 19. In run 2, illustrated in Figure 16, BOD decreased. This can be explained by the low efficiency of the biological treatment before ozonation. The biologically treated water contained a large amount of biodegradable compounds – CODtot was 2120 mg L–1 and BOD was 580 mg L–1. Even in this case, the biodegradability was initially enhanced by ozonation (at ozone dose of 300 mg L–1) followed by
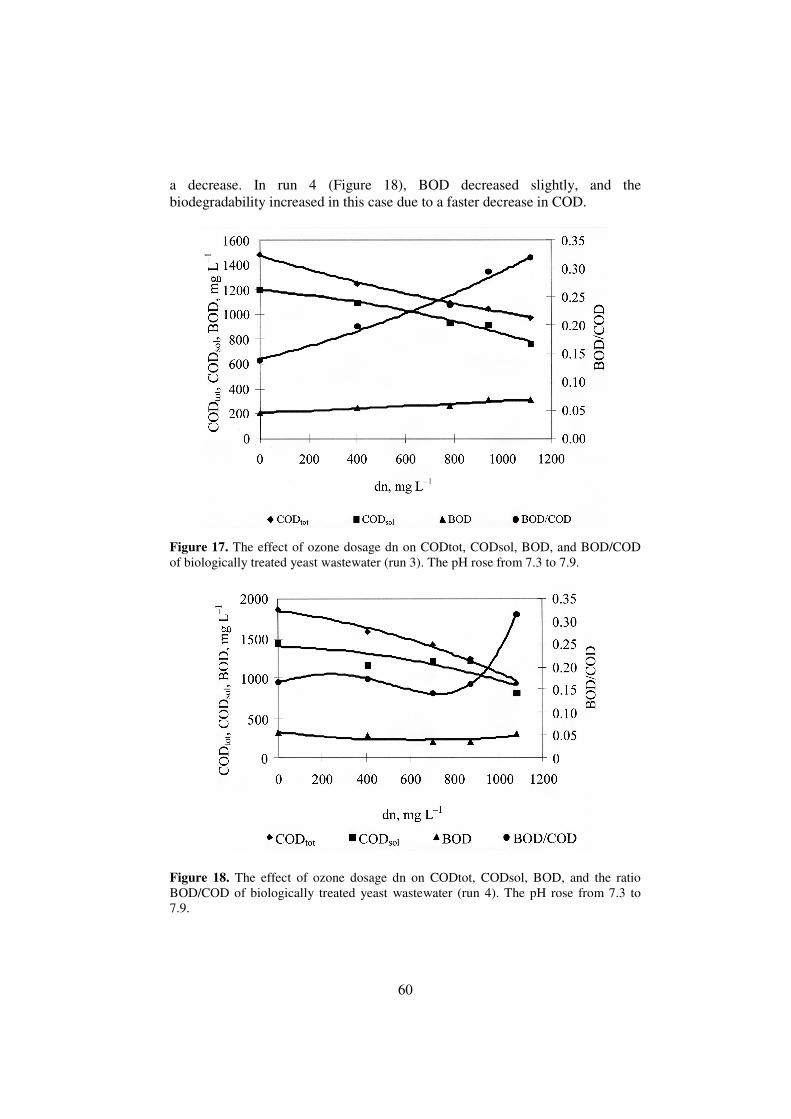
60
a decrease. In run 4 (Figure 18), BOD decreased slightly, and the biodegradability increased in this case due to a faster decrease in COD.
Figure 17. The effect of ozone dosage dn on CODtot, CODsol, BOD, and BOD/COD of biologically treated yeast wastewater (run 3). The pH rose from 7.3 to 7.9.
Figure 18. The effect of ozone dosage dn on CODtot, CODsol, BOD, and the ratio BOD/COD of biologically treated yeast wastewater (run 4). The pH rose from 7.3 to 7.9.
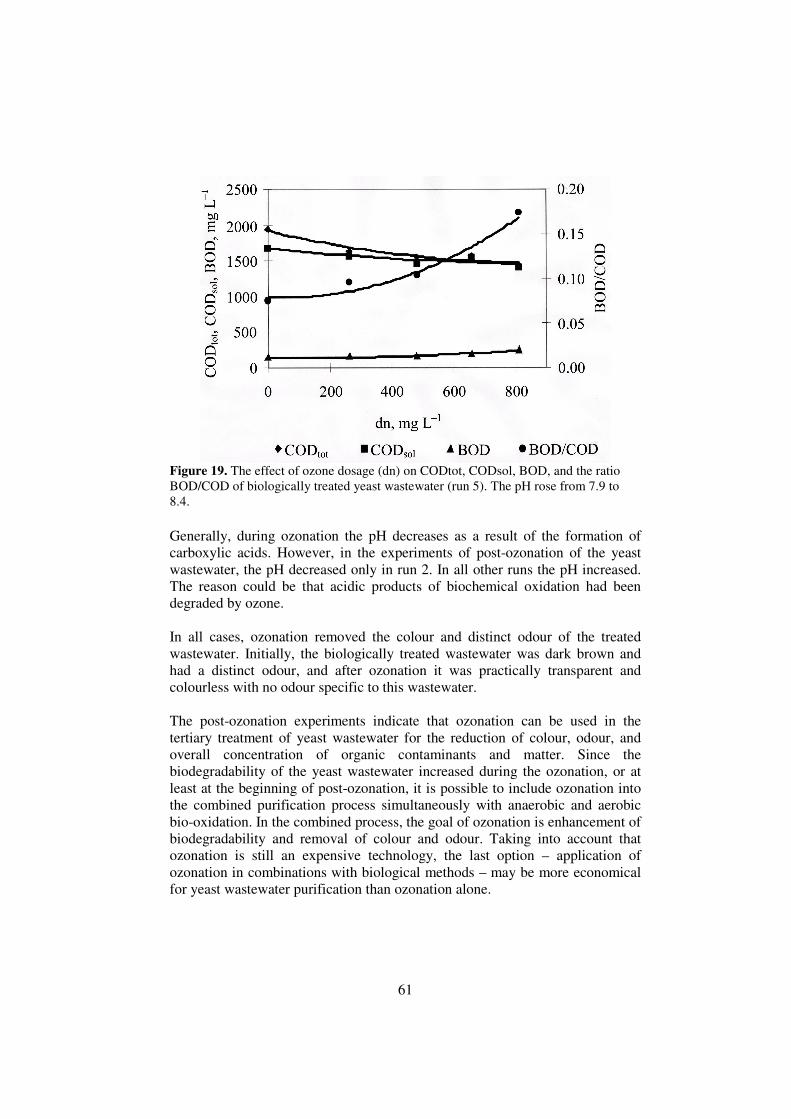
61
Figure 19. The effect of ozone dosage (dn) on CODtot, CODsol, BOD, and the ratio BOD/COD of biologically treated yeast wastewater (run 5). The pH rose from 7.9 to 8.4.
Generally, during ozonation the pH decreases as a result of the formation of carboxylic acids. However, in the experiments of post-ozonation of the yeast wastewater, the pH decreased only in run 2. In all other runs the pH increased. The reason could be that acidic products of biochemical oxidation had been degraded by ozone. In all cases, ozonation removed the colour and distinct odour of the treated wastewater. Initially, the biologically treated wastewater was dark brown and had a distinct odour, and after ozonation it was practically transparent and colourless with no odour specific to this wastewater. The post-ozonation experiments indicate that ozonation can be used in the tertiary treatment of yeast wastewater for the reduction of colour, odour, and overall concentration of organic contaminants and matter. Since the biodegradability of the yeast wastewater increased during the ozonation, or at least at the beginning of post-ozonation, it is possible to include ozonation into the combined purification process simultaneously with anaerobic and aerobic bio-oxidation. In the combined process, the goal of ozonation is enhancement of biodegradability and removal of colour and odour. Taking into account that ozonation is still an expensive technology, the last option – application of ozonation in combinations with biological methods – may be more economical for yeast wastewater purification than ozonation alone.

62
Conclusion for ozonation
It was established that the post-ozonation of biologically treated yeast wastewater resulted in the reduction of COD by 30–49%, and the consumed ozone dosage (mg ozone per mg of COD removed) ranged from 1.2 to 2.5. Comparetevly low COD removal could be explained by the fact that ozone oxidizes unsaturated bonds and leads to partial oxidation products, causing wastewater decolorization. However, ozonation generates organic compounds that also contribute to COD and rarely produces complete mineralization of organic matter to carbon dioxide and water. The biodegradability of the wastewater, expressed as BOD/COD ratio, generally increased during the ozonation. Also, the odour problem of the yeast wastewater was eliminated. Thus, it is possible to use ozonation in the tertiary treatment of yeast wastewater or to include ozonation into the combined purification process simultaneously with anaerobic and aerobic bio-oxidation.
Application of ozonation in a combined process seems to be promising for yeast wastewater purification; in this case, the target of ozonation is the enhancement of biodegradability and removal of colour and odour. Ozonation cost estimation for yeast factory effluent The ozone dosage required to decrease the residual COD noticeably was about 1000–1500 mg L–1, and both CODtot and CODsol decreased. It was reported that electical power consumption to produce pure ozone from air is 17-30 kWh kgO3
-1 (Haapea et al., 2002)
Considering that Salutaguse Yeast Factory has daily 270 m3 d-1 of wastewater to be treated using ozonation process it could be proposed that up to 405 kgO3 d
-1 is required. It corresponds to 6885-12150 kWh day-1 electrical energy consumption. In addition to mentioned above installation of modern ozone generator is needed. 4.2.4. Modification of anaerobic bioreactor to improve biomass retention The most difficult aspect of the anaerobic system operation is the retention of the sludge in the reactor, due to the low density of the sludge and the rising of generated biogas bubbles. In order to keep the sludge in the reactor, the biomass has to grow in the form of dense flocs or preferably granules.
When dealing with high peak organic loadings to be treated it is very often take place the biomass washout from reactor. Biomass losses lead to organic removal efficiency dramatic decrease and overall process failure.
There are various types of microbial conglomerates – granules, pellets, flocs. Flocs and flocular sludge have a loose undefined structure. They often settle as a homogeneous layer with a settling velocity of 0.1-1m h-1. As such they are

63
generally unsuitable for high rate upflow anaerobic rectors unless a separate solid separation phase is included (Lettinga and Hulfhoff Pol, 1991). There are several factors that may adversely effect settling velocity and cause biomass washout. These include excessive growth of extracellular polymeric substances and acidogenic bacteria (causing a fluffy surface) (Alphenaar, 1994), attachment of flocs or granules by biogas bubbles produced (Thaveesri, et al., 1995). Extracellular polymeric substances consist mainly of protein and polysaccharides in ratio of 2:1 – 6:1 (Schmidt and Ahring, 1996).
However, anaerobic wastewater treatment system at Salutaguse Yeast Factory is utilizing regular flocular anaerobic sludge in both reactors (initially UASB) with relatively high loading (12.0-16.0 kgCOD m-3day-1). The main explanation for this is recently introduced novel technology for treatment of anaerobic sludge with vacuum. Following text is the summary of investigation. 4.2.4.1. Development of device for wastewater anaerobic treatment with
biogas production.
As the result of anaerobic degradation of organic compounds of wastewater the anaerobic bacterial biomass and the biogas are formed. Obtained biogas composition depends on the type of the bacteria utilized in the treatment process and on the composition of wastewater to be treated. Besides non-soluble gases like methane and hydrogen, some soluble gases (H2S and NH3) and poorly soluble gases (CO2) are formed during anaerobic process of organic substrate degradation.
Resultant gases CO2, NH3 and other partially are dissolved in the water, ionizing it with the formation of acidic or alkaline environment and participating subsequently in the process of the metabolism of anaerobic sludge. The acidic environment (pH lower than 6,2) suppresses the process of methane formation, therefore prevention the appearance of acidic environmental condition contributes to the more complete decomposition of organic substances by the anaerobic methane producing microorganisms.
Not dissolved in the water methane, hydrogen and poorly soluble gases like carbon dioxide (CO2) form the small gas bubbles, which remain inside of sludge flocs and granules or are attached to their surface. All this decreases the general specific density of flakes and granules and their capability for precipitation, contributing to the washing out of active sludge from the bioreactor. As a result of the washing out of active sludge necessary microbial biomass decreases in reactor, this in turn leads to decreasing of wastewater treatment efficiency.
The different methods for increasing sludge specific density are used to prevent the washing out of active biomass from bioreactor. One of such methods is an increase of sludge specific density by the dosing of the special additives to influent, which improve the process of granular sludge formation. Proposed bio-supplement „GRANDOS“ promotes the different bacterial groups involved in

64
the anaerobic digestion to grow in granules. GRANDOS is composed of readily available carbohydrates which favour the growth of acidogenic bacteria; the latter ensures the formation of sufficiently strong sludge flocs or granules. GRANDOS also contains a surface tension active compound which facilitates the detachment of the gas bubbles from the microbial flocs and granules so that the latter are retained more effectively in the reactor. In other words it could be concluded that declared product prevents the washing out of active sludge flakes (granules) from the anaerobic bioreactor.
More information about proposed product is available at GRANDOS official webpage (http://www.iol.ie/~metrotec/quikload/avecom/avecom.htm).
A negative side of this method includes the supplementation of extra pollution coming with proposed additive. According to product specification bio-supplement contains COD/N/P in ratio of 100/5/2. Overdosing of additive could easily cause digester overloading and bacterial consortium composition change – acidogenic bacteria will dominate. Regular use of additive also increases anaerobic system maintenance and operation costs.
The washing out of active sludge from the anaerobic reactor can be avoided by maintenance of the layer of active sludge in the pseudoliquified state with the use of artificial granules. Such technique was proposed by Yoda et al.(patent US 4 762 612; Motoyuki Yoda Et Al; 09.08.1988). Equipment for the anaerobic treatment of waste water with production of biogas contains the anaerobic bioreactor, and the system of recirculation. Anaerobic sludge is located in the lower part of reactor together with influent distribution system. Outlet of pre-treated wastewater and the release of the generated biogas are located in the upper part of the bioreactor. The system of recirculation is connected between the outlet of the pre-treated effluent and the lower part of the bioreactor - influent distribution. Part of pre-treated effluent and raw wastewater influent are directed to the lower part of the bioreactor where through feed distribution system passed to reactor and directed upward, penetrating the layer of active sludge and creating in it the pseudoliquified state, or fluidized bed. The layer of active sludge contains the artificial granules of the specific size and the specific density, which serve as the carriers of active sludge.
Proposed method has the following deficiencies: - In practice it is not easy to keep fluidized bed in full-scale reactor
especially when dealing with non constant loadings (biogas production varies also).
- The usage of artificial granules as biomass carrier decreases the working volume of anaerobic reactor.
- Artificial granules in the course of time excessively outgrow by mineral and organic precipitation. Activity of granular biomass decreases. In practice it means that working reactor have to be stopped for cleaning or artificial granules replacement. Re-start of anaerobic process after cleaning takes long period of time to reach steady phase again.

65
4.2.4.2. Essence of the invention
The aim of present invention was the elimination of mentioned above deficiencies and the creation of the device for wastewater anaerobic treatment, which ensures an increase of anaerobic bioreactor operation effectiveness with simultaneous simplification in the operation of device and decrease of its operating costs. Object of the invention was reached by the fact that, according to present invention, the anaerobic treatment of wastewater with production of biogas occurs in the device, which contains anaerobic bioreactor, system of recirculation, device of vacuum degassing in the form of the inverted letter U and if necessary second sedimentation tank and/or the collector for surplus active sludge, where in the lower part of the bioreactor anaerobic active sludge and the distribution of influent are located, in the upper part of the bioreactor are located the outlet of the pre-treated liquid and gas cavity with the outlet of the biogas, where the system of recirculation is connected between the outlet of the recirculated liquid and the lower part of the bioreactor, and where, in contrast to the known device (patent US 4 762 612; Motoyuki Yoda Et Al; 09.08.1988), the outlet of the recirculated liquid is placed into the location of anaerobic active sludge. Therefore the recirculated liquid contains more active sludge, than the recirculated liquid in the known device, where the outlet of the recirculated liquid is located in the upper part of the bioreactor, near the outlet of the purified liquid, where a quantity of active sludge is small; in this case the device of vacuum degassing in the form of the inverted letter U is located in the system of recirculation, the lower end of supply line is connected with the outlet of the recirculated liquid, upper end of supply line is connected to the degassing chamber of higher than liquid level in the bioreactor, and the lower end of outlet pipe has a connection with the lower part of the bioreactor. As a result of this the recirculated liquid enters the degassing chamber, where occurs removal of gases, which are contained in the active sludge.
In the totality, this ensures the entering to bioreactor of degassed recycled liquid together with degassed recycled sludge which has higher capability for precipitation than sludge before degassing treatment. The degassed active sludge is much better retained in bioreactor, contributing to an increase of the mass of active sludge. This ensures a substantial increase in effectiveness and wastewater treatment efficiency, which is manifested in an increase in the yield of methane and an improvement in the quality of purified wastewater, in comparison with the nearest known device.
Furthermore, vacuum degassing decreases also a quantity of dissociated carbon and hydrosulfuric acids and increases their isolation from the water phase in the form of carbon dioxide (CO2) and hydrogen sulfide H2S, which leads to an increase in pH of the bioreactor medium and strengthens its alkaline reaction. This creates the favourable conditions (optimum values of pH and the

66
elimination of toxic hydrogen sulfide) for the vital activity of the methane-forming bacteria, which, in turn, increases the purifying ability of anaerobic bioreactor.
The device of purification of wastewater, according to invention, has following construction (Figure 20).
Figure 20. Device of anaerobic purification of wastewater with obtaining of biogas. 2 - anaerobic bioreactor (methane reactor); 3 - inlet of raw wastewater; 4 - outlet of pre-treated liquid; 5 – biogas release; 6 - outlet of the recirculated liquid; 7 - equipment of vacuum degassing; 8 - recirculation pump; 9 - output of recirculation pump; 10 – pipe divider ; 11 - collector of the surplus sludge; 12- degassing chamber; 13 - supply line; 14 - drain pipe; 15 - source of vacuum, vacuum pump; 16 - vacuum pipeline; 17 - release of biogas; 18 - liquid level; 19 - gas cavity; 20 - biogas pipeline, 21 – gate valve; 22 - second sedimentation tank; 23 - outlet of the recirculated liquid; 24 - pipeline of the purified liquid outlet (effluent) ; 25-27 - conduit, 28-32 - valves, 33 – outlet ftom sludge collector; 34 - conduit, 35-37 – gate valves.

67
Purification of wastewater is accomplished in methane reactor 2 in the continuous operation regime. Raw wastewater is given into methane reactor continuously or with the portions through the inlet 3 located in the bottom and, getting mixed with the located in the reactor suspension of active sludge, they rise upward. The decomposition of organic pollution in methane reactor is accompanied by the formation of new anaerobic microbial biomass and gaseous substances, including of CH4, CO2, small quantity of H2 and toxic H2S. All these gases are separated from the liquid and they are gathered above, in the gas cavity 19 of methane reactor, from where they are derived through the biogas release pipe 5. But the part of smaller gas bubbles is not detached off from the flakes of active sludge, which reduces the specific density of active sludge flocs. Additionally certain quantity of CO2 and H2S, that appear in the process of anaerobic treatment process, interacts with the water with the formation of the dissociated carbon acid and the hydrosulfuric acid, which increases the acidic reaction (it reduces pH value) in the methane reactor, decreasing the purifying ability of anaerobic active sludge. Furthermore, resultant hydrogen sulfide H2S is toxic to methanogens. An increase in H2S concentration decreases their viability. For an improvement of anaerobic treatment process, the part of the mixture (sludge and pre-treated effluent) is derived from methane reactor through the outlet of recirculated liquids 6 and rises along suction supply line 13 into the degassing chamber 12 of vacuum degassing device 7. Under the action of vacuum small gas bubbles are enlarged and are torn off from the flocs of active sludge, increasing the specific density of active sludge. In this case biogas release from the water phase occurs also. The part of the active sludge, which is located in second sedimentation tank 22 and in the collector of surplus sludge 11, also can be directed through the outlets of 23 and 33 into vacuum degassing device 7. Vacuum pump 15 and recirculation pump 8 support the liquid flow in the recirculation system, which creates possibility for an increase of the gas bubbles size in the supply line of degassing chamber 13 and gas release from the liquid in degassing chamber 12. With a sufficient power of vacuum pump it is possible to support the circulation of liquid in the system of recirculation without application of a recirculation pump. Vacuum pump 15 ensures the suction of the recirculated liquid into supply line 13 and into degassing chamber 12. Upper end of supply line 13 is located not less than on 5 m higher than the bioreactor liquid level 18 and it is connected to degassing chamber 12 on 0,3-2 m lower than place of attachment to it of the vacuum pipe 16 opening, which connects vacuum pump with the degassing chamber. In operating conditions in the upper part of degassing chamber 12 the space is free from the liquid, where is created the negative pressure, which varies from -0,05 MPa (-0,5 atm) to -0, 098 MPa (-0,97 atm). The height of the part of the degassing chamber free from

68
the liquid and applied negative pressure appearing to be in dependence on the mutual arrangement of device elements (methane bioreactor, the device of vacuum degassing and vacuum pump, their elements, conduits) and on the relationship of the pipelines dimensions, and also on the rise velocity of the liquid flow. The totality of these factors provides the rise of the recirculated liquid into the degassing chamber, the intensive degassing of the liquid entering, and also the removal of the isolated gas from the chamber with the action of vacuum pump 15, preventing in this case the entry of liquid and active sludge into vacuum pump. The separated gas is derived from the vacuum pump through the biogas outlet 17. Degasified active sludge gets down from degassing chamber 12 on drain pipe 14 to the entrance of recirculation pump 8 and further will be pumped into the lower part of methane bioreactor 2. Thus, pre-treated in vacuum chamber sludge is freed from gas bubbles, which possesses large specific weight and higher purifying ability than sludge before degasification. Furthermore, under the conditions of vacuum degassing the concentration of dissociated in the water phase carbon acid and hydrosulfuric acid is reduced, as a result of which rises the alkaline reaction and the value of pH of the liquid, which is returned from the system of recirculation to methane bioreactor. This creates in methane reactor optimal environment conditions for the vital activity of the methane-forming bacteria, this in turn, increases the possibility of organic substances decomposition in methane reactor. Recirculation pump 8 is supplied with pipe divider 10 for the adjustable distribution of the flow between its two branches. Through one branch the recirculated liquid will be given into the lower part of methane bioreactor, through another branch - into the collector of the surpluses of active sludge 11. This ensures maintenance in the bioreactor of an optimum concentration of microbial biomass. In the device according to present invention it is possible send the part of the biogas from the bioreactor gas cavity 19 (through the biogas pipe 20) into the lower part of the supply line 13 of degassing device 7. This increases the speed of the recirculation flow through degassing chamber 12 and intensifies the detachment and release of gas bubbles. For guaranteeing the continuously variable control of the system operation regime of waste-water treatment following gate-valves are used: 21, 28 - 32, 35 – 38. 4.2.4.3. Device test in practice
To evaluate the influence of vacuum degassing technology on anaerobic wastewater treatment system following tests were conducted in practise. The co-work of methane bioreactor together sludge de-gassing unit depending on hydraulic load and operating time was investigated. One of two in parallel working identical methane reactors with a capacity of 180 m3 (R1) was
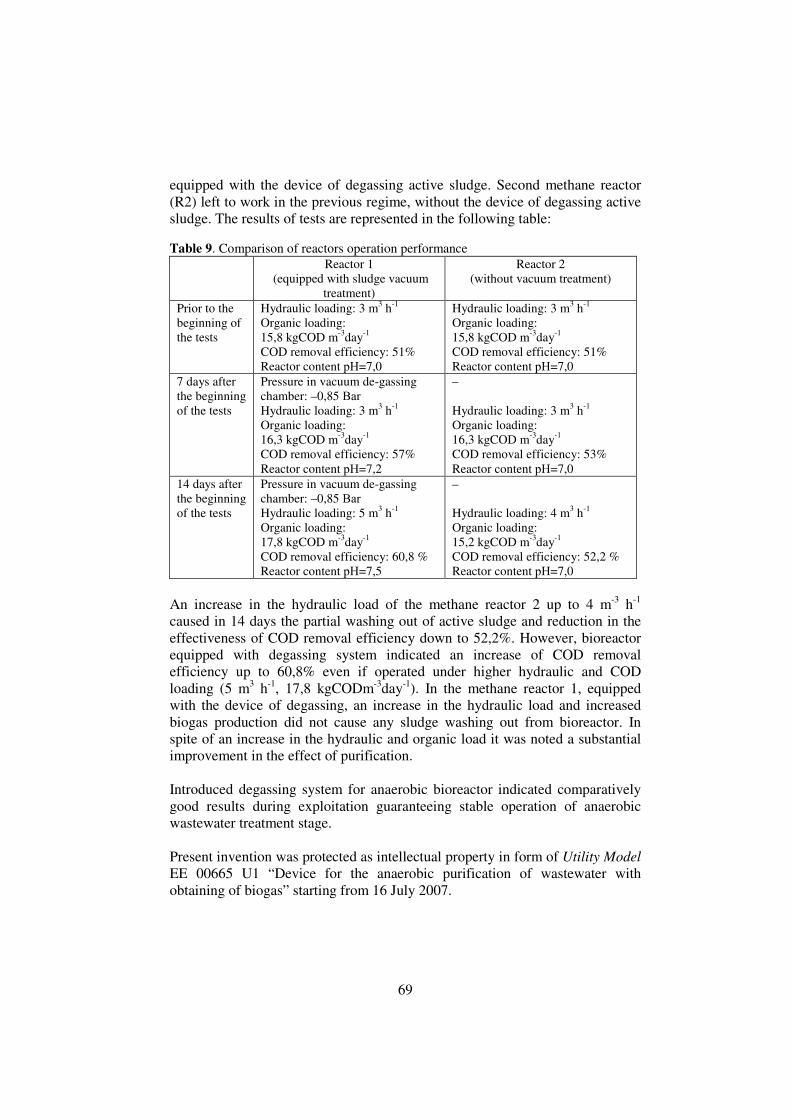
69
equipped with the device of degassing active sludge. Second methane reactor (R2) left to work in the previous regime, without the device of degassing active sludge. The results of tests are represented in the following table: Table 9. Comparison of reactors operation performance
Reactor 1 (equipped with sludge vacuum
treatment)
Reactor 2 (without vacuum treatment)
Prior to the beginning of the tests
Hydraulic loading: 3 m3 h-1
Organic loading: 15,8 kgCOD m-3day-1
COD removal efficiency: 51% Reactor content рН=7,0
Hydraulic loading: 3 m3 h-1 Organic loading: 15,8 kgCOD m-3day-1
COD removal efficiency: 51% Reactor content рН=7,0
7 days after the beginning of the tests
Pressure in vacuum de-gassing chamber: –0,85 Ваr Hydraulic loading: 3 m3 h-1 Organic loading: 16,3 kgCOD m-3day-1 COD removal efficiency: 57% Reactor content рН=7,2
– Hydraulic loading: 3 m3 h-1 Organic loading: 16,3 kgCOD m-3day-1 COD removal efficiency: 53% Reactor content рН=7,0
14 days after the beginning of the tests
Pressure in vacuum de-gassing chamber: –0,85 Ваr Hydraulic loading: 5 m3 h-1 Organic loading: 17,8 kgCOD m-3day-1 COD removal efficiency: 60,8 % Reactor content рН=7,5
– Hydraulic loading: 4 m3 h-1 Organic loading: 15,2 kgCOD m-3day-1 COD removal efficiency: 52,2 % Reactor content рН=7,0
An increase in the hydraulic load of the methane reactor 2 up to 4 m-3 h-1 caused in 14 days the partial washing out of active sludge and reduction in the effectiveness of COD removal efficiency down to 52,2%. However, bioreactor equipped with degassing system indicated an increase of COD removal efficiency up to 60,8% even if operated under higher hydraulic and COD loading (5 m3 h-1, 17,8 kgCODm-3day-1). In the methane reactor 1, equipped with the device of degassing, an increase in the hydraulic load and increased biogas production did not cause any sludge washing out from bioreactor. In spite of an increase in the hydraulic and organic load it was noted a substantial improvement in the effect of purification. Introduced degassing system for anaerobic bioreactor indicated comparatively good results during exploitation guaranteeing stable operation of anaerobic wastewater treatment stage. Present invention was protected as intellectual property in form of Utility Model EE 00665 U1 “Device for the anaerobic purification of wastewater with obtaining of biogas” starting from 16 July 2007.

70
5. CONCLUSIONS Purification of baker’s yeast wastewater was experimentally studied. Both lab-scale and full-scale purification equipment were utilized in this study to clarify the most suitable technological setup for anaerobic treatment of yeast wastewaters at Salutaguse Yeast Factory. As the result of experimental study operational parameters for removing of sulfates and avoiding inhibitory effects of sulfides in anaerobic treatment were found and adopted at full-scale wastewater treatment plant using existing equipment. Combining anaerobic sulfate reduction with biological oxidation of sulfide in studied anaerobic/anoxic treatment scheme showed the best results and might be preferable for the treatment of sulfate rich yeast wastewaters. The main results obtained during experiments with full-scale anaerobic/anoxic reactors system were:
- the purification of baker’s yeast wastewater (produced from sugar beet
molasses, having high SO4
2- content) was feasible without the use of
granulated sludge. - for controlling pH there was no need to use chemicals. - the returned anoxic sludge retained methanogenic activity, for methane
gas production there was no need to re-inoculate anaerobic reactors. - during experiments combined anaerobic/anoxic system operated under
organic loading rate varied between 12.0-16.0 kgCODm-3d-1 with stable COD removal efficiency. COD reduction efficiency (by TCOD) in anaerobic + anoxic stage was up to 80%, in anaerobic + anoxic + SBR
stage up to 90% supporting average biogas production 1800 m3
/d (with two anaerobic reactors).
The results of the study carried out with lab-scale equipment demonstrated that the anaerobic sequencing batch reactor (ASBR) is a suitable and effective method for anaerobic treatment of sulfate rich wastewaters from baker’s yeast production plant. ASBR scheme demonstrated stable COD removal efficiency (about 80%) when applied organic loading rate varied between 7.7 and 8.0 kgCODm-3d-1. At higher organic loading rate (over 8.01 kgCODm-3d-1) treatment efficiency decreased. In the experiments with post-treatment of biologically pre-treated baker’s yeast wastewater effluent, coagulation step and ozonation impact on effluent quality were studied. The application of iron chloride and aluminium sulfate coagulation for post-treatment of anaerobic-aerobic effluents may fulfill the discharge limits to the sewer under iron concentrations around 200 mg L-1 and aluminium concentrations around 400 mg L-1. Significant decrease of color substances could be achieved using coagulation (up to 90%). Both iron and aluminium

71
showed the significant removal of organic COD (40-61%), nitrogen (74-76%) and phousphorous (up to 78%) during coagulation step. Generated during coagulation sludge could be the problem when full-scale process applied. Awaited sludge amount will be 1,05-1,58 m3 d-1 (at 22%DS after sludge dewatering). Application of ozonation as post-treatment of effluent seems to be promising for yeast wastewater purification. During experimental studies it was established that the post-ozonation of biologically treated yeast wastewater resulted in the reduction of COD by 30–49%, and the consumed ozone dosage (mg ozone per mg of COD removed) ranged from 1.2 to 2.5. The biodegradability of the wastewater, expressed as BOD/COD ratio, generally increased during the ozonation tests. In case of full-scale ozonation system (Salutaguse Yeast Factory) up to 405 kgO3 d
-1 is required to decrease the residual COD noticeably. It corresponds to electrical energy of 6885-12150 kWh day-1. There were no significant changes in nitrogen and phosphorous content when ozonation applied. After the start-up research the wastewater loading was increased to 400 m3 d-1 that was up to 40 % more than the initial loading. Aerobic polishing was started on day 220. The final treatment efficiency of the whole system consisting of two anaerobic reactors, anoxic reactor and 2xSBR for aerobic polishing appeared to be up to 98 % (by TCOD) and over 90 % (by SCOD). One of the most difficult aspects of the anaerobic system operation is the retention of the sludge in the reactor when high organic loading applied. The influence of vacuum degassing technology was studied. The suitable techniques which helpes to retain biomass in anaerobic digester was developed and tested at full-scale system. Introduced degassing system for anaerobic bioreactor indicated comparatively good results during exploitation guaranteeing stable operation of anaerobic wastewater treatment stage. Anaerobic sludge de-gaasing unit allowed to increase organic loading rate up to 17,8 kgCODm-3d-1. In experiments, anaerobic reactor equipped with the device of degassing, an increase in the hydraulic load and increased biogas production did not cause any sludge washing out from bioreactor. In spite of an increase in the hydraulic and organic load it was noted a substantial improvement in the effect of purification. Present invention was protected as intellectual property in form of Utility Model EE 00665 U1 “Device for the anaerobic purification of wastewater with obtaining of biogas” starting from 16 July 2007. Due to the use of molasses as the only economically acceptable carbon source for large scale food biomass production, the effluent of yeast industry is characterized by high COD and nitrogen loads originating from not assimilated residual compounds in the fermentation broth. As these substances are difficult to degrade by any micro-organism, full biological treatment, whether on site in specialized installations or by co-treatment with urban waste waters in

72
municipal plants, will only remove about 90% of the original COD. Considering this fact and stricter environmental politics in future it is reasonable to look for other alternatives to decrease pollution discharge from yeast industry processing beet or cane molasses. One possible way to decrease COD and nitrogen loads is replacement of raw material with other carbon source for yeast fermentation, for example corn syrup or hydrolyzed starch. These sources are completely utilized by yeast during fermentation and do not contribute pollution. More efficient but energy consuming technologies like evaporation and anaerobic treatment of distillates reveal a COD removal of over 98% of the original load, with the benefits, that products from evaporation can be recycled in the agrarian sector and that biogas may be used for partial energy coverage. As a result of the performed improvements during full-scale experiments, the 4-year permission from local environmental inspection for further continuing of yeast production at Salutaguse Yeast Factory was achieved in year 2002. As the result of good suitability of combined anaerobic/anoxic treatment scheme for purify sulfate rich wastewater it was planned to introduce this technology to other yeast factories belonging to Lallemand Inc. For example in year 2007/2008 it was planned to modify and improve existing wastewater treatment plant in Passau, Germany. The first stage of purification will be combined anaerobic/anoxic treatment process.

73
REFERENCES Alphenaar, A. (1994). Anaerobic granular Sludge: Characterisation and factors
effecting its functioning. Agricultural College. Wageningen Agricultural College, Wageningen: 222.
APHA., (1998). Standard Methods for the Examination of Water and
Wastewater, 20th ed. American Public Health Association, Washington DC.
Bartlett, K.B., Bartlett, D.S., Harriss, R.C. and Sebacher, D.I., (1987). “Methane Emissions Along a Salt Marsh Salinity Gradient,” Biogeochemistry, 4:183-202.
Boone, D.R. and Bryant, M.P., (1980). ” Propionate-Degrading Bacterium, Syntrophobacter wolinii sp. nov. gen. nov., from Methanogenic Ecosystems,” Applied Environmental Microbiology, 40:626-632.
Boone, D.R., (1991). ”Ecology of Methanogenesis,” in Microbial Production
and Consumption of Greenhouse Gases: Methane, Nitrogen Oxides,
and Halomethanes, J.E.Rogers and W.B. William, eds., American Society of Microbiology, pp. 57-70.
Boone, D.R., Johnson, R.L. and Liu, Y., (1989). ”Diffusion of the Interspecies Electron Carriers H2 and Formate in Methanogenic Ecosystems, and its Implications in the Measurement of Km for H2 or Formate Uptake,” Applied Environmental Microbiology, 55:1735-1741.
Boone, D.R., Worakit, S., Mathrani, I.M. and Mah, R.A., (1986). ”Alkaliphilic Methanogens from High-pH Lake Sediments,” Journal of Systematic
Applied Microbiology, 7:230-234. Brown, H.D. (ed.), (1969). Selected values of thermodynamic properties. In:
Biochemical microcalorimetry, Academic Press Inc., NY, pp. 305 -316.
Buisman, C.J.N., 1996. Process for removing sulfur compounds from water. US Patent 5 518 619.
Buisman, C.N.J., Geraats, B.G., Ijspeert, P.and Lettinga, G., (1990). Optimization of sulfur production in a biotechnological sulfide-removing reactor. Biotechnol. Bioeng. 35 (1): 50-56.
Cämmerer, B., Kroh, L.W., (1995). Investigations of the influence of reaction conditions on the elementary composition of melanoidins. Food Chem. 53(1), 55-59
Capone, D.G. and Kiene, R.P., (1988). ”Comparison of Microbial Dynamics in Marine and Freshwater Sediments: Contrasts in Anaerobic Carbon Catabolism,” Limnology and Oceanography, 4:725-749.
Colleran, E., Finneger, S., Lens P., (1995). Anaerobic treatment of sulfate-containing waste streams. Ant. Leeuv. 67, 29-46.
Conrad, R., Goodwin, S. and Zeikus, J.G., (1987). ”Hydrogen Metabolism in Mildly Acidic Lake Sediment (Knaack Lake),” FEMS
Microbiological Ecology, 45:243-249.

74
Cork, D.J., (1985). Microbial conversion of sulfate to sulfur - an alternative to gypsum synthesis. In: Advances in Biotechnological Process 4, (Alan R. Liss, ed.), NY, pp. 183-209.
Cross, W.H., Chian, E.S.K., Pohland, F.G., Harper, S., Kharkar, S., Cheng, S.S. and Lu., F., (1983). ”Anaerobic Biological Treatment of Coal Gasifier Effluent,”in Biotechnology and Engineering Symposium No. 12, C. D. Scott, ed., John Wiley&Sons, pp. 349-363.
DeLaune, R.D., Smith, C.J. and Patrick, J.R., (1983).”Methane Release from Gulf Coast Wetlands,” Tellus, 35B:8-15.
Derycke, D., Keefe, O., Leahy, B. and Pipyn, P., (1993). Anaerobic treatment and sulfur-related problems: bulk fine chemicals, inWastewater Treatment in Chemical Industries, Biotim NV Publication, Antwerp, Belgium. pp 29±35.
DiMarco, A.A., Bobik, T.A. and Wolfe, R.S., (1990). “Unusual Coenzymes of Methanogenesis,” Annual Reviews of Biochemistry, 59:355-394.
Fdz-Polanco, F., Fdz-Polanco, M., Fernandez, N., Urueña, M.A., Garcia, P.A., Villaverde, S., 2001. New process for simultaneous removal of nitrogen and sulfur under anaerobic conditions. Wat. Res., 35, (4), 1111-1114.
Fox, P. and Venkatasubbiah, V., (1996). Coupled anaerobic/ aerobic treatment of high-sulfate wastewater with sulfate reduction and biological sulfide oxidation. Wat. Sci. Technol., 34 (5-6, Water Quality International ‘96, Part 3), 359-366.
Francisca Kalavathi, D., Uma, L. and Subramanian, G., (2001). Degradation and metabolization of the pigment-melanoidin in distillery effluent by the marine cyanobacterium Oscillatoria boryana bdu 92. Enzyme
Microb. Technol., 29, 246-251. Frankel, R.J., Ludwing, H.F., Tontkasame, C., (1978). Case studies of
agroindustrial wastewater pollution control in Thailand In: Proceedings of the International Conference on Water Pollution Control in Developing Countries Thailand: Asian Institute of Technology, pp. 513-24.
Gehringer, P., Szinovatz, W., Eschweiler, H., Haberl, R., (1997). Oxidative treatment of a wastewater stream from a molasses processing using ozone and advanced oxidation technologies. Ozone Sci. Eng. 19 (2), 157-168.
Gladchenko, M., Starostina, E., Scherbakow, S., Versprille, B. and Kalyuzhnyi, S., (2004). Combined biological and physico-chemical treatment of baker’s yeast wastewater including removal of coloured and recalcitrant to biodegradation pollutants. Wat. Sci. Technol., 50, (5) 67-72.
Gonzàlez, G., Peña, M.M., Garcĭa, M.T., Urueña, M.A., (1999). Decolorization of molasses effluents by coagulation-floculation process. Zuckerindustrie 124 (5), 406-410.
GRANDOS. http://www.iol.ie/~metrotec/quikload/avecom/avecom.htm

75
Guimaraes, C., Bento, L., Mota, M., (1999). Biodegradation of colorants in refinery effluents. Potential use of the fungus Phanerochaete
chrysosporium. Int. Sugar Jnl. 101 (1205), 246-251. Haapea, P., Korhonen. S. and Tuhkanen, T. (2002). Treatment of industrial
landfill leachates by chemical and biological methods: ozonation, ozonation+hydrogen peroxide, hydrogen peroxide and biological post-treatment for ozonated water. Ozone: Sci. And Eng., 2 24, 369-378.).
Harper, S.R. and Pohland, F.G., (1986). “Recent Developments in Hydrogen Management during Anaerobic Biological Wastewater Treatment,” Biotechnology and Bioengineering, XXVII:585-602.
Harper, S.R. and Pohland, F.G., (1987). “Enhancement of Anaerobic Treatment Efficiency through Process Modification”, Journal Water Pollution
Control Federation, 59(3):152-161 Henshaw, P.F., Bewtra, J.K. and Biswas, N. (1998) Hydrogen sulfide
conversion to elemental sulfur in a suspended-growth continuous stirred tank reactor using Chlorobium limicola. Wat. Res. 32 (6): 1769-1778.
Henze, M. and Harremoes, P., (1983).”Anaerobic Treatment of Wastewater in Fixed Film Reactors – A Literature Review,” Water Science and
Technology, 15(8/9):1-101. Iannotti, E.L. and Fischer, B.J., (1984).”Effects of Ammonia, Volatile Acids,
pH, and Sodium on the growth Bacteria Isolated from a Swine Manure Digester,” in Developments in Industrial Microbiology, Vol. 25, C.H. Nash III and L.A. Underkofler, eds., Society of Industrial Microbiology, pp. 741-747.
Iannotti, E.L., Kafkewitz, D., Wolin, M.J. and Bryant, M.P., (1973). “Glucose Fermentation Products of Runinococcus albus Grown in Conditions Culture with Vibrio succinogenes: Changes Caused by Interspecies Transfer of H2,” Journal of Bacteriology, 114:1231-1240.
Isa, Z., Grusenmeyer, S., Vertraete, W. (1986). Sulfate reduction relative to methane
Janssen, A.J.H., Lettinga, G., and de Keizer, A., (1999). Removal of hydrogen sulfide from wastewater and waste gases by biological conversion to elemental sulfur. Colloidal and interfacial aspects of biologically produced sulfur particles. Colloids and Surfaces A: Physicochem. &
Engineering Aspects 151: 389-397. Janssen, A.J.H., Ma, S.C., Lens, P. and Lettinga, G., (1997) Performance of a
sulfide oxydizing expanded-bed reactor supplied with dissolved oxygen. Biotechnol. Bioeng. 53 (1): 32-40.
Jones, W.J., (1991).”Diversity and Physiology of Methanogens”, in Microbial
Production and Consumption of Greenhouse Gases: Methane,
Nitrogen Oxides, and Halomethans, J. E. Rogers and W. B. Williams, eds., American Society of Microbiology, pp. 39-55.
Jones, W.J., Jr Nagle, D.P. and Whiteman, W.B., (1987). “Methanogens and the Diversity of Archaebacteria,” Microbiological Reviews, 51:135-177.
76
Kalyuzhnyi, S., Gladchenko, M., Starostina, S., Versprille, B. (2005). Integrated biological (anaerobic-aerobic) and physico/chemical treatment of baker’s yeast wastewater. Water Science & Technology, Vol. 52, pp. 273-280
Kalyuzhnyi, S.V., Gladchenko, M.A., Starostina, Ye.A., Shcherbakov, S.S. and Kortout, D. (2003). High rate anaerobic treatment as a key step of purification of baker’s yeast wastewater: a review. Manufacture of alchohol and liqueur & vodka products, N3, 37-44.)
Kamenev, I. (2003). Aerobic bio-oxidation combined with ozonation in recalcitrant wastewater treatment. PhD thesis. TTU Press.
Kennedy, L.G. and Everett, J.W., (2001). Microbial degradation of simulated landfill leachate: solid iron/sulfur interactions. Adv. Environ. Res. 5: 103-116.
Kiene, R.P., (1991). “Production and Consumption of Methane in Aquatic Systems,” in Microbial Production and Consumption of Greenhouse
Gases: Methane, Nitrogen Oxides, and Halomethanes, J.E. Rogers and W.B. Williams, eds., American Society of Microbiology, pp. 111-146.
Kim, S.B., Hayase, F., Kato, H., (1985). Decolorization and degradation products of melanoidins on ozonolysis. Agric. Biol. Chem. 49 (3), 785-792.
Lens P.N.L., Omil F., Lema J.M., Hulshoff-Pol L.W., (2000). Biological treatment of organic sulfate-rich wastewaters. Environmental
Technologies to Treat Sulfur Pollution, ed.Lens P., Hulshoff-Pol L, London: IWA Publishing, pp. 467-489.
Lettinga, G. and. Hulshoff Pol, L.W. (1991). “UASB-process design for various types of wastewaters.” Wat. Sci. Tech 24(8) , 87-107.
Liu, Y., Boone, D.R. and Choy, C., (1990).” Methanohalophilis oregonense sp. nov., a Methylotrophic Methanogen from an Alkaline, Saline Aquifier,” International Journal of Systematic Bacteriology, 40:111-116.
Macki, R.I. and Bryant, M.P., (1981).”Metabolic Activity of Fatty Acid-Oxidizing Bacteria and the Contribution of Acetate, Propionate, Butyrate, and CO2 to Methanogenesis in Cattle Waste at 40 and 60oC,” Applied Environmental Microbiology, 41:1363-1373.
Maestrojuan, G.M. and Boone, D.R., (1991).”Characterization of Methanosarcina barkeri MST, and Methanosarcina vacuolata Z-761T.” International Journal of Systematc Bacteriology, 41:267-274
Mathews, C.K. and van Holde, K.E. (1995) Biochemistry. 2nd ed. The Benjamin / Cummings Publishing Company, Inc. California, pp. 520-553.
Mathrani, I. M., Boone, D.R., Mah, R.A., Fox, G.E. and Lau, P.P., (1988). ”Methanohalobium zhilinae gen. nov. sp. nov., an Alkaliphilic, Halophilic, Methyltrophic Methanogen,” International Journal of Systematic Bacteriology, 38:139-142.

77
McInerney, M.J. and Bryant, M.P., (1981) Anaerobic degradation of lactate by syntrophic associations of Methanosarcina barkeri and Desulfovibrio species and effect on H2 on acetate degradation. Appl. Environ.
Microbiol. 41 (2): 346-354. Menert, A. (2001). Microcalorimetry of Anaerobic Digestion. PhD thesis, TTU
press. Miyata, N., Mori, T., Iwahori, K., Fujita, M., (2000). Microbial decolorization
of melanoidin-containing wastewaters: combined use of activated sludge and the fungus Coriolus hirsutus. J. Biosci. Bioeng. 89 (2), 145-150.
Montgomery, A.D., McInerney, M.J. and Sublette, K.L., (1990). Microbial control of the production of hydrogen sulfide by sulfate-reducing bacteria. Biotechnol. Bioeng. 35 (3): 533-539.
Moune, S., Manac’h, N., Hirschler, A., Caumette, P., Willison, J.C., Matheron, R., (1999). Haloanaerobacter salinarus sp. nov., a novel fermentative bacterium that reduces glycine-betaine to trimethylamine with hydrogen or serine as electron donors; emendation of the genus Haloanaerobacter. Int. J. Syst. Bacteriol., 49, 103-112
Müller, E., Fahlbusch, K., Walther, R., Gottschalk, G., (1981). Formation of N,N-dimethylglycine, acetic acid, and butyric acid from betaine by Eubacterium limosum. Appl. Environ. Microbiol., 42, 439-445.
Naumann, E., Hippe, H., Gottschalk, G., (1983). Betaine: new oxidant in the Stickland reaction and methanogenesis from betaine and l-alanine by a Clostridium sporogenes-Methanosarcina barkeri co-culture. Appl. Environ. Microbiol., 45, 474-483.
O’Flaherty, V., Mahony, T., O’Kennedy, R., Colleran, E., (1998). Effect of pH on the growth kinetics and sulfide toxicity thresholds of a range of methanogenic, syntrophic and sulfate-reducing bacteria. Process Biochem. (Oxford), 33, (5), 555-569.
Ohmomo, S., Daengsabha, W., Yoshikawa, H., Yui, M., Nozaki, K., Nakajima, T., Nakamura, I., (1988 a). Screening of anaerobic bacteria with the ability to decolorize molasses melanoidin. Agric Biol Chem, 57:2429-35.
Ohmomo, S., Kainuma, M., Kamimura, K., Sirianuntapiboon, S., Oshima, I., Atthasumpunna, P., (1988 b). Adsorption of melanoidin to the mycelia of Aspergillus oryzae Y-2-32. Agric Biol Chem, 52:381-6.
Ohmomo, S., Kaneko, Y., Sirianuntapiboon, S., Somchai, P., Atthasumpunna, P., Nakamura, I., (1987). Decolorization of molasses wastewater by a thermophilic strain Aspergillus fumigatus G-2-6. Agric Biol Chem, 51:3339-46.
Olbrich, H., (1973). The Molasses. Publish by Biotechnologie-Kempe GmbH (2006)
Oude Elferink, S.J.W.H., Vorstman, W.J.C., Sopjes, A. and Stams, A.J.M., (1998). Characterization of the sulfate-reducing and syntrophic

78
population in granular sludge from a full-scale anaerobic reactor treating papermill wastewater. FEMS Microbiol. Ecol. 27: 185-194.
Pohland, F.G. and Bloodgood, D.E., (1963).”Laboratory studies on Mesophilic and Thermophilic Anaerobic Sludge Digestion,” Journal Water
Pollution Control Federation, 35:11-42
Pohland, F.G. and Martin, J.C., (1969).” Dynamic model of the Anaerobic Digestion Process – A Discussion,” Journal Sanitary Engineering
Division, ASCE, 95, SA6:1197-1202. Pohland, F.G. and Suidan, M.T., (1987).”Prediction of pH Stability in
Biological Treatment systems,” in Chemistry of Wastewater Technology, A.J. Rubin, ed., Ann Arbor Science Publishers, Inc., pp.441-463. production in high rate anaerobic digestion: technical aspects. Appl. Environ. Microbiol. 51, 580-587.
Rouviere, P.E. and Wolfe, R.S., (1988). “Novel Biochemistry of Methanogenesis,” Journal Biological Chemistry, 263:7913-7916.
Särner, E., (1990). Removal of sulfate and sulfite in an anerobic trickling (ANTRIC) filter. Wat.Sci.Tech., 22, 395-404
Sax, R. I., Lusk, P.D., (1995).Anaerobic digestion of municipal, industrial and livestock wastes for energy recovery and disposal. Proc. - Biomass Conf. Am. Energy, Environ, Agric. Ind., 2nd, National Renewable Energy Laboratory,Golden, Colo., 711-723.
Schmidt, J. E. and Ahring, B.K. (1996).”Granular sludge formation in upflow anaerobic sludge blanket (UASB) reactors.”Biotech. Bioeng.49(3), 229-246.
Speece, R.E., (1996). Anaerobic Biotechnology. Archae Press, Nashville, Tennessee.
Stronach, S.M., Rudd, T. and Lester, J.N., (1986). Anaerobic digestion
Processes in Industrial Wastewater Treatment, Springer-Verlag, pp. 21-38.
Tchobanoglous, G., and Burton, F.L. (eds), (1991). Anaerobic Suspended-growth treatment processes. In: Wastewater engineering, treatment, disposal and reuse. 3rd ed. Metcalf & Eddy, Inc., McGraw-Hill, Inc.
Thalasso, F., Burgt, J. van der, O’Flaherty, V., Colleran, E., (1999). Large-stage anaerobic degradation of betaine. J. Chem Technol. Biotechnol., 74, 1176-1182
Thauer, R.K., Jungermann, K. and Dekker, K., (1997). “Energy Conservation in Chemotrophic Anaerobic Bacteria,” Bacteriological Reviews, 41:100-180.
Thaveesri, J., Daffonchio, D., Liessens, B., Vandermeren, P. and Verstraete, W. (1995). “Granulation and sludge bed stability of upflow anaerobic sludge bed reactors in relation to surface thermodynamics.” Appl.
Environ. Microbiol. 61(10) , 3681-3686. Traore, A.S., Fardeau, M.-L., Hatchikian, C.E., Le Gall J and Belaich, J.-P.,
(1983). Energetics of growth of a defined mixed culture of

79
Desulfovibrio vulgaris and Methanosarcina barkeri: interspecies hydrogen transfer. Appl. Environ. Microbiol. 46 (5): 1152-1156.
Traore, A.S., Hatchikian, C.E., Belaich, J.-P. and Le Gall J., (1981). Microcalorimetric studies of the growth of sulfate-reducing bacteria: energetics of Desulfovibrio vulgaris growth. J. Bacteriol. 145 (1): 191-199.
Watanabe, Y., Sugi, R., Tanaka, Y., Hayashida, S., (1982). Enzymation of melanoidin by Coriolus sp No 20. Agric Biol Chem, 46:1623-30
Westrich, J.T. and Berner, R.A., (1988).”The Effect of Temperature on Rates of Sulfate Reduction in Maarine Sediments,” Geomicrobiology Journal, 6:99-117.
Widdel, F. and Hansen, T.A., (1991). The dissimilatory sulfate- and sulfur-reducing bacteria (Chapter 24). In: The Procaryotes. 2nd ed., pp. 583-624.
Wolin, M. J., (1977). “Fermentation of Cellulose by Ruminococcus flavefaciens in the Presence and Absence of Methanobacterium ruminantium,” Applied Environmental Microbiology, 34:297-301.
Wu, J.J., Masten, S.J., (2002). Oxidation kinetics of phenolic and indolic compounds by ozone: applications to synthetic and real swine manure slurry. Wat.Res. 36(6), 1513-1526.
Yoda, M. and Nishimura, S.(1997).Controlling granular sludge floatation in UASB reactors. Wat Sci Technol, 36(6-7), pp. 385-394.
Yoda, Motoyuki and Mikio, Kitagawa (1988). Anaerobic fluidized bed apparatus. US 4762612.
Zinder, S.H., Anguish, T. and Cardwell, S.C. (1984). “Effects of Temperature on Methanogenesis in a Thermophilic (58oC) Digestor,” Applied
Environmental Microbiology, 47:808-813. Zumbusch, P.V., Meyer-Jens, T., Brunner, G., Märkl, H., (1994). On-line
monitoring of organic substances with high-pressure liquid chromatography (HPLC) during the anaerobic fermentation of waste-water. Appl. Microbiol. Biotechnol., 42, 140-146.
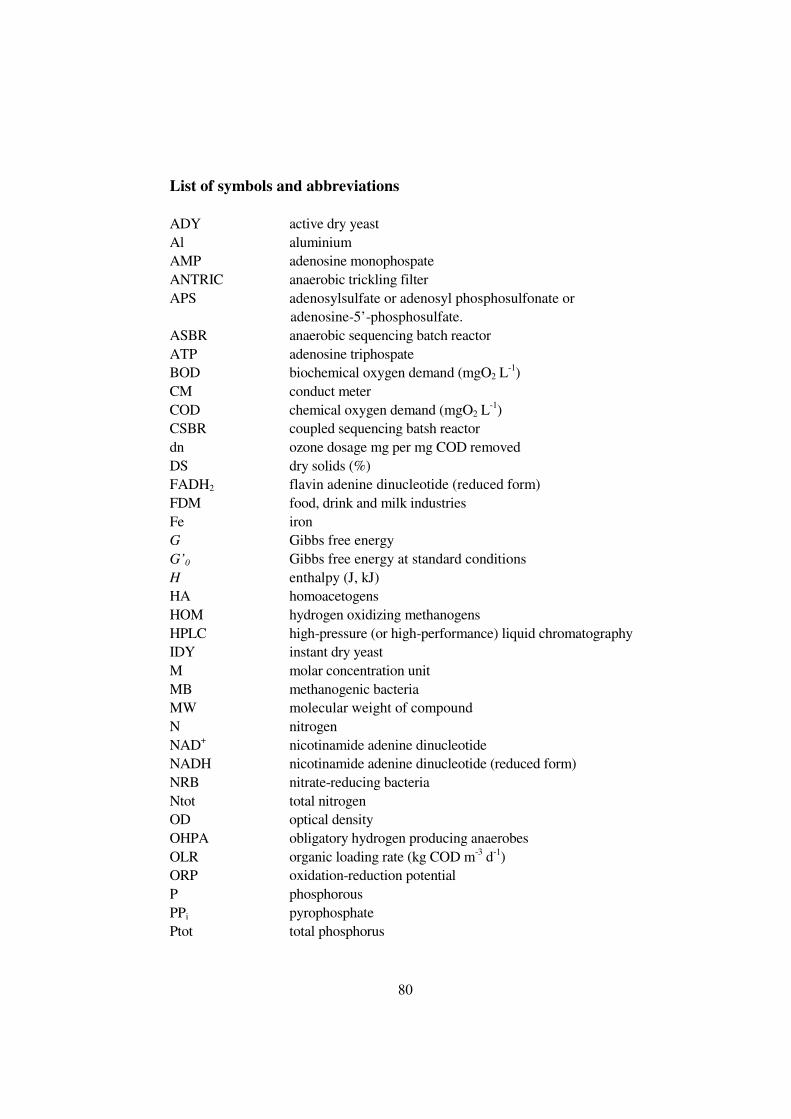
80
List of symbols and abbreviations ADY active dry yeast Al aluminium AMP adenosine monophospate ANTRIC anaerobic trickling filter APS adenosylsulfate or adenosyl phosphosulfonate or
adenosine-5’-phosphosulfate. ASBR anaerobic sequencing batch reactor ATP adenosine triphospate BOD biochemical oxygen demand (mgO2 L
-1) CM conduct meter COD chemical oxygen demand (mgO2 L
-1) CSBR coupled sequencing batsh reactor dn ozone dosage mg per mg COD removed DS dry solids (%) FADH2 flavin adenine dinucleotide (reduced form) FDM food, drink and milk industries Fe iron G Gibbs free energy G’0 Gibbs free energy at standard conditions H enthalpy (J, kJ) HA homoacetogens HOM hydrogen oxidizing methanogens HPLC high-pressure (or high-performance) liquid chromatography IDY instant dry yeast M molar concentration unit MB methanogenic bacteria MW molecular weight of compound N nitrogen NAD+ nicotinamide adenine dinucleotide NADH nicotinamide adenine dinucleotide (reduced form) NRB nitrate-reducing bacteria Ntot total nitrogen OD optical density OHPA obligatory hydrogen producing anaerobes OLR organic loading rate (kg COD m-3 d-1) ORP oxidation-reduction potential P phosphorous PPi pyrophosphate Ptot total phosphorus
81
rpm rotations per minute SBR sequencing batch reactor SCOD (CODsol) soluble chemical oxygen demand (mgO2 L
-1) SRB sulfate reducing bacteria SRT solids retention time SS suspended solids (mgL-1) SVI sludge volumetric index (ml g-1 TSS) TCOD (CODtot) total chemical oxygen demand (mgO2 L
-1) TSS total suspended solids (mg L-1) UASB Upflow Anaerobic Sludge Blanket (reactor) VFAs volatile fatty acids VSS volatile suspended solids (mg L-1) WWTP wastewater treatment plant Greek letters µ specific growth rate of microorganisms (d-1, h-1) ∆ difference τ generation time of microflora (d-1) Subscripts and superscripts tot total cat catabolism met metabolism f fusion sol soluble O2 oxygen O3 ozone

82

83
PAPER I S. Zub, T. Kurissoo, A. Menert, V. Blonskaja. The anaerobic/anoxic treatment of sulphate-rich wastewater. In. Proc.2nd
Biennial Conference on Management of
Wastewaters: Edinburgh, UK, 15-17 April (2002), p. 285-294
84
PAPER II
M. Krapivina, T. Kurissoo, V. Blonskaja, S. Zub, R. Vilu. Treatment of sulphate containing yeast wastewater in an anaerobic sequence batch reactor. Proceedings of the Estonian Academy of Sciences. Chemistry, 2007, 56(1), 38-52.

85
PAPER III S. Zub, V. Blonskaja, I. Kamenev. Possibilities of using ozone for the treatment of wastewater from the yeast industry. Proceedings of the Estonian Academy of Sciences. Chemistry, 2006, 55(1), 29-39.

86
PAPER IV S. Zub, T. Kurissoo, A. Mets. Device for the anaerobic purification of wastewater with obtaining of biogas. Utility Model EE 00665 U1, The Estonian Utility Model Gazette 3/2007, p.9. ISSN 1023-6546

87
PAPER V V. Blonskaja, S. Zub, M. Krapivina. Anaerobic treatment of yeast industry wastes-years of industrial experience. In: Conference proceedings. Vilnius, 2005. Vol.1, Environmental Engineering The 6
th International Conference,
Lithuania, May 26-27, p. 331-336. SBN 9986-05-858-9.

88
DISSERTATIONS DEFENDED AT TALLINN UNIVERSITY OF TECHNOLOGY ON
CIVIL ENGINEERING
1. Heino Mölder. Cycle of investigations to improve the efficiency and reliability of activated sludge process in sewage treatment plants. 1992.
2. Stellian Grabko. Structure and properties of oil-shale Portland cement concrete. 1993.
3. Kent Arvidsson. Analysis of interacting systems of shear walls, coupled shear walls and frames in multi-storey buildings. 1996.
4. Andrus Aavik. Methodical basis for the evaluation of pavement structural strength in Estonian Pavement Management System (EPMS). 2003.
5. Priit Vilba. Unstiffened welded thin-walled metal girder under uniform loading. 2003.
6. Irene Lill. Evaluation of Labour Management Strategies in Construction.
7. Juhan Idnurm. Discrete analysis of cable-supported bridges. 2004.
8. Arvo Iital. Monitoring of Surface Water Quality in Small Agricultural Watersheds. Methodology and optimization of monitoring network. 2005.
9. Liis Sipelgas. Application of satellite data for monitoring the marine environment. 2006.
10. Ott Koppel. Infrastruktuuri arvestus vertikaalselt integreeritud raudtee-ettevõtja korral: hinnakujunduse aspekt (Eesti peamise raudtee-ettevõtja näitel). 2006.
11. Targo Kalamees. Hygrothermal criteria for design and simulation of buildings. 2006.
12. Raido Puust. Probabilistic leak detection in pipe networks using the SCEM-UA algorithm. 2007.

89


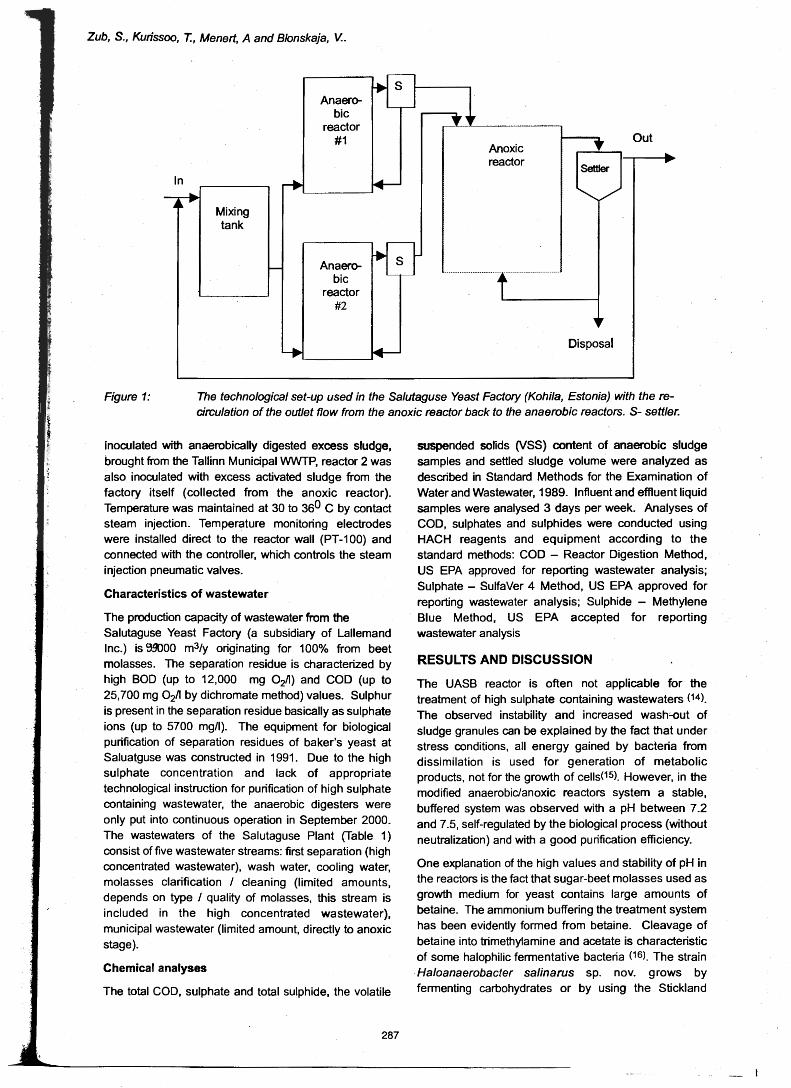


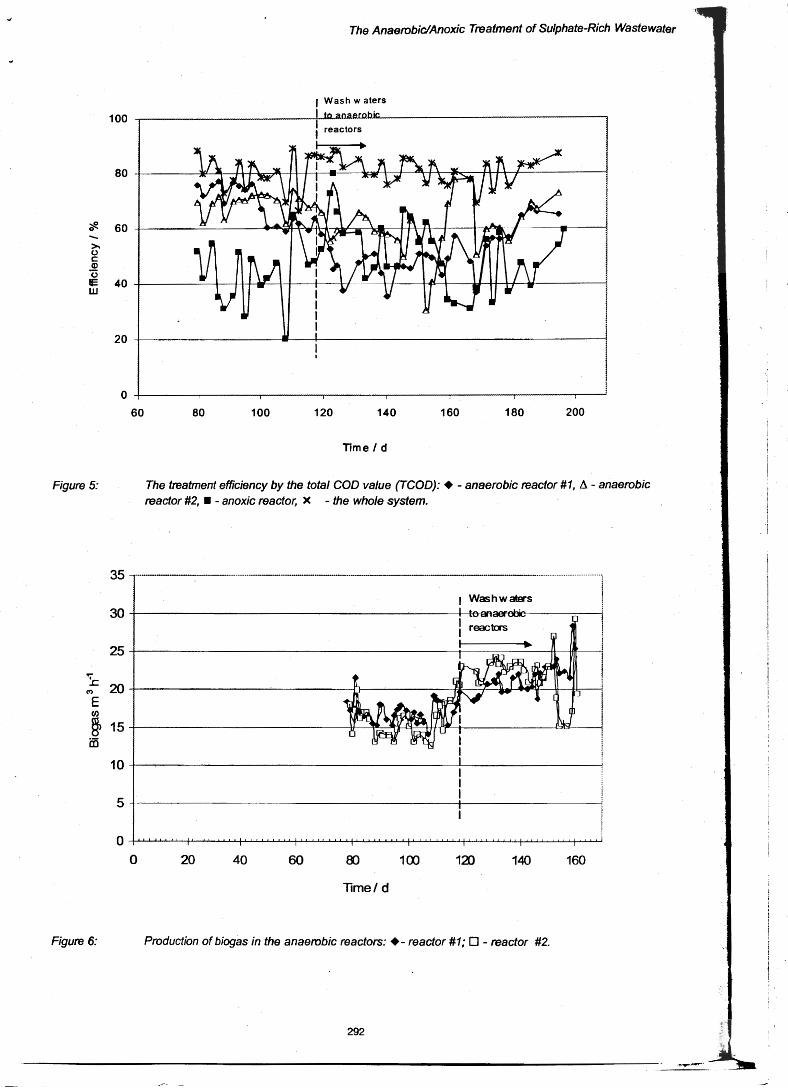

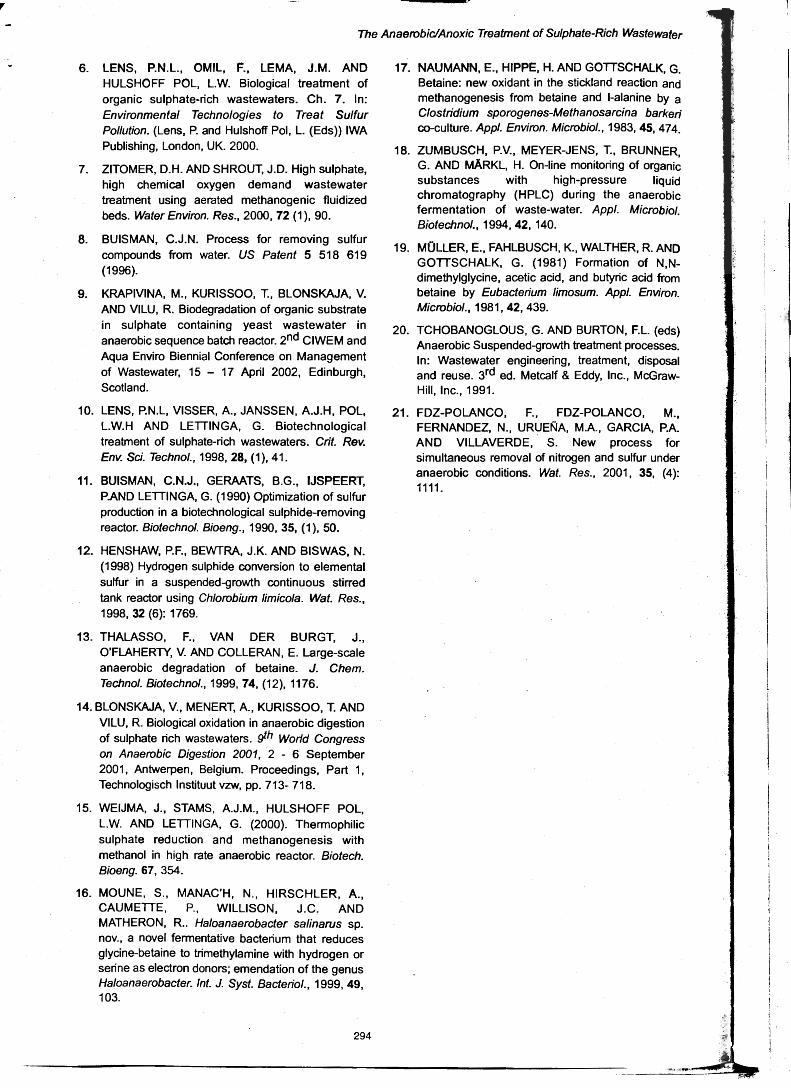
38
Proc. Estonian Acad. Sci. Chem., 2007, 56, 1, 38–52
Treatment of sulphate containing yeast wastewater in an anaerobic sequence
batch reactor
Marina Krapivinaa, Tõnu Kurissoob, Viktoria Blonskajac*, Sergei Zubd, and Raivo Vilua
a Department of Chemistry, Tallinn University of Technology, Ehitajate tee 5, 19086 Tallinn, Estonia b BimKemi Eesti AS, Akadeemia tee 21G, 12618 Tallinn, Estonia c Department of Environmental Engineering, Tallinn University of Technology, Ehitajate tee 5,
19086 Tallinn, Estonia d AS Salutaguse Pärmitehas, Kohila, 79702 Raplamaa, Estonia Received 27 November 2006 Abstract. Anaerobic mesophilic fermentation of sulphate containing yeast industry wastewaters at laboratory scale with anaerobic sequence batch reactors (ASBR) was studied. Three different treat-ment schemes were investigated – ASBR with and without a polymeric filler and coupled micro-aerophilic/anaerobic SBR (CSBR). The optimal concentration of sludge (total solids 17.3 g L–1) in the reactor and the optimal reaction time (22 h) were determined. It was shown that in the case of ASBR efficient treatment characterized by chemical oxygen demand (COD) removal of 75–82% took place at volume loading rates up to 7.7–8.0 kgCOD m–3 d–1 and at COD/(SO4)
2– ratio 8.0. In optimal conditions the methane content of the biogas was 60%. The best results for sulphate removal (99%) were achieved in the CSBR with the concentration of sulphide in the reactor effluent being about 10 mg L–1. Decreasing treatment efficiency after a long-time exploitation of these reactors occurred as a result of the formation of insoluble sediment (presumably CaCO3 and Ca3(PO4)2). Key words: anaerobic sequence batch reactor (ASBR), calcium precipitates, high strength wastewater, sulphate reduction, yeast industry.
INTRODUCTION Wastewater from the yeast industry contains extremely high concentrations of
COD (up to 30 g L–1) and sulphate (up to 4.5 g L–1). For the treatment of high strength wastewaters anaerobic digestion appears to be economically more * Corresponding author, [email protected]

39
attractive than aerobic processes. Two important goals are achieved simultaneously in anaerobic processes: removal of organic matter and sulphates.
Advantages of anaerobic digestion include also relatively low sludge pro-duction and low energy need compared with aerobic treatment. However, a high sulphate content can lead to the destabilization of the anaerobic treatment processes due to the hydrogen sulphide formation [1], especially if COD/(SO4)
2– is below 10 [2]. Despite these difficulties anaerobic digestion has been successfully applied for the treatment of a variety of sulphate-rich wastewaters both at laboratory and full-scale levels [1]. In comparison with continuous anaerobic methods, anaerobic digestion is a more flexible and cost-effective treatment technology [3]. However, there are no reports in the literature on the treatment of sulphate-rich wastewaters using anaerobic sequence batch reactors (ASBR).
The main aim of this research work was to study the treatment process of sulphate-rich high strength wastewaters from a yeast production plant using ASBR technologies.
MATERIALS AND METHODS
Experimental set-ups Three different schemes of laboratory-scale experimental set-ups of ASBR
were used. In the first experimental set-up (Fig. 1) a stand-alone ASBR was used. The ASBR with an active liquid volume of 0.7 L was made of glass tubing of 0.145 m × 0.075 m (diameter). Plastic tubes were attached to the filling and
6
4
5
2
1 3
Fig. 1. Laboratory set-up for an anaerobic sequencing batch reactor. 1 – ASBR, 2 – thermostat, 3 – peristaltic pump, 4 – wet gas meter, 5 – water collector, 6 – alkali lock.

40
drawing ports. Peristaltic inflow pumps (Zalimp, Poland) were used at rates of 0.48–0.51 L h–1 to fill the reactor, draw off the effluent, and to mix the suspension during the treatment process. The temperature was maintained constant (35 ± 2 °C) during the operation by a thermostat. Methane gas production was measured using a wet gas meter after absorption of CO2 and H2S in a scrubber with 10% NaOH solution.
In the second scheme the ASBR was loaded with a polymeric filler (Water Group, Germany): 0.8 cm × 1.0 cm diameter, with a conditional surface area of 640 m2 m–3. The volume of carriers was 0.5 L. Otherwise the experimental set-up was as in the first case.
In the third set-up, a coupled sequence batch reactor (CSBR) where the anaerobic effluent from the ASBR was recycled through a microaerophilic system was applied. Mixing in the microaerophilic reactor was carried out using a magnetic stirrer with regulated stirring speed (Beco, MM-5, 220 W). The biogas from the anaerobic reactor was passed to the microaerophilic reactor with the recycling effluent. The anoxic reactor was open and the temperature of the water was the same as the temperature of the air in the room (20 ± 2 °C). The oxygen concentration was kept at 0.1–0.15 mg L–1.
Operating cycle parameters
The operating cycles of the ASBRs in all three set-ups consisted of three
stages: (1) filling and decanting stage – this was accomplished by replacing the upper layer of the liquid in the reactors (effluent) with the lower layer adding influent to the bottom of the reactor, (2) reaction stage with uninterrupted agitation (by suspension recycling), and (3) sludge settling stage. The total cycle length was 24 h made up of 23 h of reaction–agitation, 0.5 h at rest for settling, and 0.5 h for filling and drawing (Fig. 2).
Fig. 2. Operation cycles of an ASBR. 1 – filling and decanting cycle, 2 – reaction cycle, 3 – sludge settling.

41
Sludge used Two types of seed sludge were used for comparing the efficiencies of the
processes. Anaerobic sludge from the anaerobic digester of the municipal waste-water treatment plant (WWTP), Tallinn, Estonia, which was not adapted for the treatment of sulphates, was used in the first two experimental set-ups, and sulphate adapted anaerobic sludge from full-scale anaerobic digesters of a yeast plant (AS Salutaguse Pärmitehas, Estonia) was used in the case of the CSBR.
Morphology of the sludge
The morphology of the seed sludge and of the sludge at the end of the
experiments was investigated using microscopy. Sludge samples of 10 mL were washed with 10 mL of distilled water and allowed to settle while the turbid layer was drained. The procedure was repeated until the water became transparent. The washed sludge samples were placed into a 3.5 cm Petry dish and studied.
Microscopy of the structure of the seed anaerobic sludge from Tallinn WWTP showed that the sludge was of granulated type. The approximate size of granules was 1.7–2.0 mm. The sludge was mixed with sand, which seemed to be a good carrier of the sludge granules.
Investigation of the structure of the adapted to the sulphates seed anaerobic sludge from the Salutaguse yeast plant showed that the sludge was of flocculated type with a small percentage of single granules. The approximate size of granules was 0.5 mm. The activated sludge used in the CSBR experiment for seeding the microaerophilic reactor was completely flocculated.
Sulphate-rich high strength yeast production wastewaters
The reactors were fed with wastewater from the full-scale yeast production
plant of Salutaguse (Estonia). The chemical composition of the wastewater was as follows: total COD 14.4–25.7 g L–1, SO4
2– 3.5–5.3 g L–1, COD/SO42– 2.71–
7.63, total solids 12.9–21.6 g L–1, total N 250–350 mg L–1, total P 17.3–48.2 mg L–1, trimethylglycine 3.7–4.0 g L–1. Prior to treatment the wastewater was stored at 4 °C to prevent premature denaturation.
Sampling and monitoring
The production of biogas in anaerobic reactors, the influent and effluent pH,
and the temperature of the sludge were measured daily. For the pH determina-tions a pH meter (E6121, Evicon) was used. Dissolved oxygen concentration in the microaerophilic reservoir was controlled twice a day by a conductivity and dissolved-oxygen meter (WTW.GMBH, M325/Oxi-L5). The COD, total solids (TS), sulphate, and total sulphides concentrations in the effluent were measured weekly, dissolved phosphorous and total nitrogen contents were analysed twice a

42
month. In all cases standard procedures described in standard methods [4] for wastewater examination were used. Effluent samples were drawn from the ASBR upon completion of the 30 min decant cycle. Sulphide and sulphate contents were determined immediately. The COD and phosphorous samples were frozen before analysis. Completely mixed samples were taken from the ASBR reactor before and after the end of the experiments and used for TS determination. The biogas composition was determined with gas chromatography.
RESULTS AND DISCUSSIONS The optimal concentration of sludge for the start-up in usual anaerobic
processes is 30–40% of the volume of the reactor, about 15 g L–1 of the sludge [5].
The start-up experiments with three different amounts of seed sludge were carried out during 47 days. Three identical reactors (first scheme) were seeded with 30% (TS 12.9 g L–1) of anaerobic sludge obtained from the anaerobic digester (municipal WWTP, Tallinn, Estonia), 40% (TS 17.3 g L–1), and 50% (TS 21.6 g L–1), respectively. To allow biomass to adapt to sulphate-rich waste-water the sludge load was increased step-by-step (5% weekly). During the start-up period the organic load rate (OLR) was gradually increased from 1.4 kgCOD m–3 d–1 to 7.1 kgCOD m–3 d–1 (Fig. 3) and hydraulic retention time (HRT) was changed from 10 and to 2.5 days, respectively.
0
1
2
3
4
0 20 40 60 80 100
Time, day
Gas
pro
du
ctio
n,
L d–1
0
2
4
6
8
10
Lo
ad
, kg
CO
D m
–3 d
–1
Gas production
Organic loading rate
Start-up
Fig. 3. Organic load and gas production during the experiment.

43
0.0
0.2
0.4
0.6
0.8
1.0
1.2
1.4
1.6
1.8
10 20 30 40 50
Time, day
12.9 TS g L–1
17.3 TS g L–1
21.6 TS g L–1
50% sludge
40% sludge
30% sludge
Gas
pro
du
ctio
n,
L d–1
During a month following seeding the OLR of 7.7 kgCOD m–3 d–1 was maintained and then the reactors were operated at a constant OLR value. The efficiency of the treatment process during the start-up was monitored by biogas production (Fig. 4). A faster start-up of the reactor inoculated with 40% of sludge than of those inoculated with 30% and 50% of sludge was observed. The average gas production rates were 0.96, 0.6, and 0.4 L d–1, respectively. Maximum gas production of 1.6 L d–1 was detected for the reactor with 40% sludge on the 27th day of experiments. On the basis of these results the reactor with the sludge concentration of 17.3 g L–1 was selected for the subsequent experiments.
As seen from Table 1, during the start-up period the COD removal efficiency in the reactor was rather low – 10–33%, but it increased toward the end of the
Table 1. Results of the experiment with the organic load TS 17.3 g L–1
Day COD in influent, mg L–1
COD in effluent, mg L–1
Organics removal
efficiency, %
Gas production,
m3 kg–1
COD removal
Sulphate in influent,
mgSO42– L–1
Sulphate in effluent,
mgSO42– L–1
Sulphate removal
efficiency, %
Sulphide in effluent,
mg S2– L–1
Start-up 11 14 380 12 880 10 0.243 5 300 840 84 6.2 22 23 660 15 840 33 0.157 5 300 40 99 41.4 39 20 280 17 200 15 0.178 3 100 320 90 7.3 47 20 280 13 960 31 0.232 3 600 10 100 18.3
Steady state
68 20 540 5 030 80 0.126 4 800 40 99 10.5 75 20 540 3 970 81 0.165 3 000 20 99 2.3 88 22 890 3 670 84 0.187 3 000 10 100 36.7 100 22 890 11 040 52 0.161 3 500 340 90 28.1
Fig. 4. Gas production at different seed sludge contents.
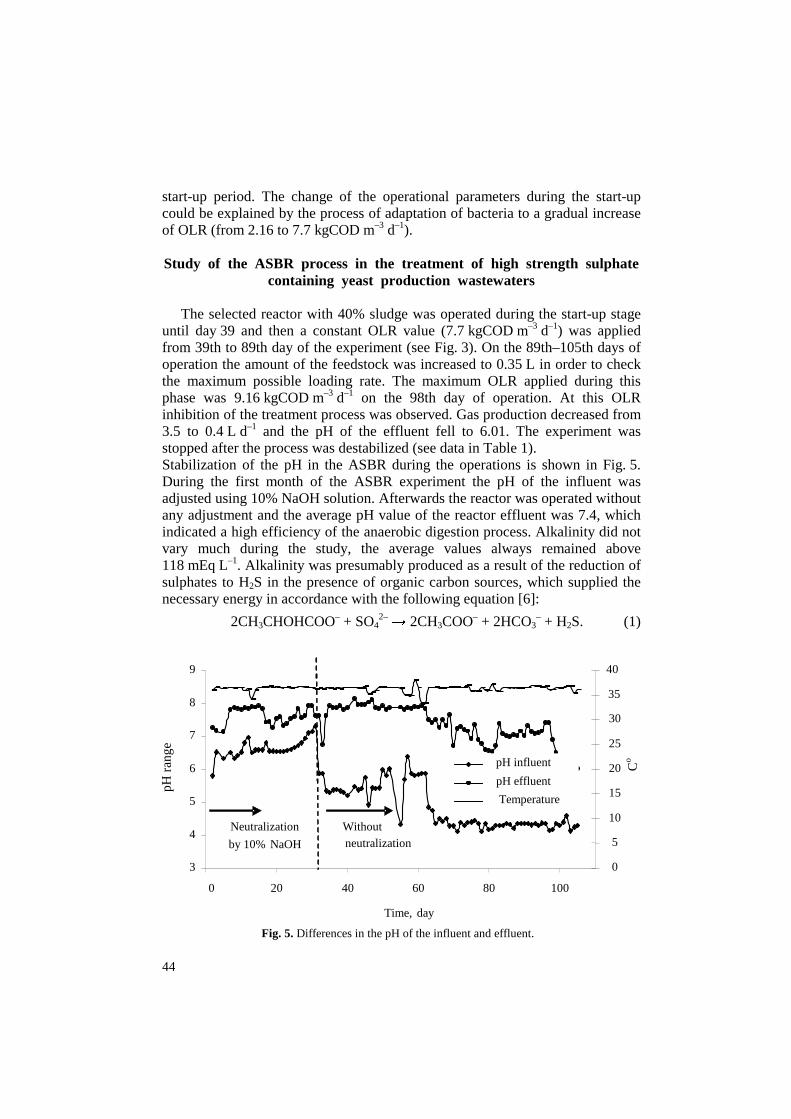
44
3
4
5
6
7
8
9
0 20 40 60 80 100
Time, day
pH
ra
ng
e
0
5
10
15
20
25
30
35
40
Co
pH influent
pH effluent
Temperature
Without neutralization
Neutralization
by 10% NaOH
start-up period. The change of the operational parameters during the start-up could be explained by the process of adaptation of bacteria to a gradual increase of OLR (from 2.16 to 7.7 kgCOD m–3 d–1).
Study of the ASBR process in the treatment of high strength sulphate
containing yeast production wastewaters The selected reactor with 40% sludge was operated during the start-up stage
until day 39 and then a constant OLR value (7.7 kgCOD m–3 d–1) was applied from 39th to 89th day of the experiment (see Fig. 3). On the 89th–105th days of operation the amount of the feedstock was increased to 0.35 L in order to check the maximum possible loading rate. The maximum OLR applied during this phase was 9.16 kgCOD m–3 d–1 on the 98th day of operation. At this OLR inhibition of the treatment process was observed. Gas production decreased from 3.5 to 0.4 L d–1 and the pH of the effluent fell to 6.01. The experiment was stopped after the process was destabilized (see data in Table 1). Stabilization of the pH in the ASBR during the operations is shown in Fig. 5. During the first month of the ASBR experiment the pH of the influent was adjusted using 10% NaOH solution. Afterwards the reactor was operated without any adjustment and the average pH value of the reactor effluent was 7.4, which indicated a high efficiency of the anaerobic digestion process. Alkalinity did not vary much during the study, the average values always remained above 118 mEq L–1. Alkalinity was presumably produced as a result of the reduction of sulphates to H2S in the presence of organic carbon sources, which supplied the necessary energy in accordance with the following equation [6]:
2CH3CHOHCOO– + SO42– → 2CH3COO– + 2HCO3
– + H2S. (1)
Fig. 5. Differences in the pH of the influent and effluent.

45
During the operation at a constant OLR of 7.7 kgCOD m–3 d–1 a significant increase in the removal efficiency to over 80% was observed. The maximum treatment efficiency (removal of 84% of COD) and the maximum biogas production of 3.79 L d–1 was reached at OLR values between 7.7 and 8.0 kgCOD m–3 d–1. At higher OLR (over 8.01 kgCOD m–3 d–1, days 89–105) the treatment efficiency decreased.
The data obtained on the treatment efficiency in COD removal were in agree-ment with the data published for yeast wastewater treatment process in [7].
The average sulphate removal efficiency was 95% in the experiment. Sulphate conversion to sulphide was greater than 80% during the start-up period. Then during days 39–89 when the OLR was constant no inhibition was detected and a nearly 100% removal efficiency was observed. Furthermore, the concentration of sulphates in the effluent did not exceed 40 mg L–1. Due to the high OLR (9.2 kgCOD m–3 d–1, day 98) the conversion efficiency decreased after day 100 to 90%. The data indicated that sulphate reduction was limited at higher OLR, and higher sulphate concentrations were observed in the influent. In fact, it has been supposed that for a successful anaerobic treatment a COD/SO4
2– ratio higher than 10 is necessary [8]. Lower ratios were thought to be detrimental to methano-genesis because they led to the production of excessive sulphide concentrations (> 150–200 mg L–1). In the experiment the sulphide concentrations in the effluents of neither ASBR nor CSBR exceeded the inhibitory levels (150 mg L–1, [9]) despite the fact that the COD/SO4
2– ratio of the influent was always lower than 8. The effluent sulphide concentration was lower than 41.4 mg S2L
–1. During the steady state period of operation (days 39–89) the rate of biogas
production varied between 2.30 and 3.85 L d–1. This indicated that the per-formance and functioning of the reactor were rather variable. The variability observed was caused most probably by competition between sulphidogens and methanogens and possible inhibitory influence of sulphides (average value 18.85 mg S2 L
–1), although they did not exceed the inhibitory level. The composition of biogas was measured on the 68th day of the experiment
and was as follows: 60% CH4, 35% CO2, 2.7% H2S. This composition indicated that mainly methanogenic mineralization of organic matter was taking place in the ASBR. The biogas production rate during the operation cycle was measured on the 50th day of the experiment. The data obtained showed that the rate of biogas production was the greatest at the start of the cycle (during the first 7 h after the period of raw water input), and then slowly decreased with time, reaching very low and relatively stable levels at the end of the reaction stage. Biogas production completely stopped in the reactor on the 22nd–23rd hour of the cycle. The data showed that the lengths of the stages of the treatment cycle had been chosen correctly.
Previous results have indicated that inoculation of UASB with non-sulphate-adapted sludge could lead to complete inhibition of the treatment process [2] because bacterial groups, especially methanogens, could not adapt to the high levels of sulphide present in the influent. However, in our research full inhibition

46
of the process did not take place. This could be explained by the presence of non-competitive substrates for methanogens (trimethylglycine) in yeast wastewater. Since trimethylglycine remains undetected by a COD dichromate assay, its concentration can be underestimated, which in turn may lead to a significant overloading of WWTPs. It is known that sugarbeet molasses used as a component of the growth medium for baker’s yeast [5] in the Salutaguse yeast plant contains up to 6% w/w trimethylglycine. In anaerobic treatment plants, trimethylglycine is practically totally degraded through a multistep degradation process with the formation of nitrogen-containing intermediates – trimethylamine and other methylated amines [10]. These intermediates are further degraded by methanogenic bacteria, yielding CO2, ammonium, and methane. The presence of trimethylglycine could allow methanogens to maintain a significant population in a sulphate containing environment, which stimulates the growth of sulphate reducing bacteria (SRB), competitors of methanogens for the same substrates in the anaerobic treatment processes. Degradation of trimethylglycine (trimethyl-glycine is a nitrogenous compound, whose complete anaerobic degradation can result in an increase of the effluent ammonia concentration) and formation of amines can explain also accumulation of Ntot during the experiments carried out by us (see Table 2).
As seen from Table 2, the effluent concentrations of Ntot increased on average from 236 to 570 mgN L–1. It should be noted that removal of all nitrogen compounds would require anaerobic, microaerophilic, and aerobic conditions established simultaneously in different locations of the anaerobic reactor, which is highly improbable in the case of the small-scale laboratory vessels used in our experiments.
The results of the present study (Table 2) demonstrate the ability of the ASBR process to achieve a good phosphorus removal efficiency – up to 61%. As calcium chloride is used in the technological process of yeast production, wastewaters are characterized by a rather high content of calcium ions. Under these conditions the high phosphorous removal efficiency could be explained by precipitation as a result of the formation of insoluble Ca3(PO4)2.
Table 2. Change of phosphorus and nitrogen content in the ASBR during the steady-state period
Day Ntot in influent, mg L–1
Ntot in effluent, mg L–1
N accumulation,
%
Ptot in influent, PO4
3–
mg L–1
Ptot in effluent, PO4
3–
mg L–1
P removal efficiency,
%
39 245 275 12 32.2 13.9 56.9 47 475 870 83 48.2 24.3 49.6 68 325 650 100 28.5 22.2 22.1 75 345 550 59 17.3 15.3 10.7 88 255 690 170 32.6 19.2 41.1 100 250 270 8 34.2 13.3 61.1

47
Despite the high sulphate treatment efficiency achieved in the ASBR, sulphide production during the process was significant, and this led to the observed instability of the process. In the large-scale experiments the instability of the processes could create significant difficulties in applying the ASBR technology for the treatment of yeast wastewaters. In addition to the inhibition of the process, sulphide formation caused also major malodour problems and corrosion of equipment during the experiment. In the further experimental work two modifications of the ASBR technique were investigated to reduce the problems noted. Accumulation of sulphides was an indication that competition between methanogens and SRB was won by the latter.
The aim of the further investigation was to find experimental conditions where methanogens would prevail, and the reduction of sulphate would stop at the level of elemental sulphur. An ASBR with a polymeric filler and coupled microaerophilic/anaerobic sequence batch reactor (CSBR) were investigated.
ASBR with a polymeric filler
Experiments with a polymeric filler used as a support material for micro-
organisms were performed in order to study the influence of an artificial filler on the efficiency of the process. Previous studies [11] had shown that the use of a support material favours the adherence of methanogenic bacteria and accelerates the washout of SRB. A poor attachment ability of SRB was demonstrated. It was concluded on the basis of the experimental results that in the presence of a filler SRB are washed out of the reactor providing acetotrophic methanogenic bacteria with a sufficient growth advantage. These data suggest that an artificial carrier could stimulate methanogenic activity in the anaerobic digester and increase the efficiency and stability of the treatment processes.
Two reactors were operated in our series of experiments during 68 days. One was loaded with a polymeric filler and the other was operated like the first one but without the filler. The operational conditions were the same as described in the previous experiments. The COD and sulphate removal efficiencies were not significantly different between the two reactors studied; however, in the reactor without the carrier a slightly higher average treatment efficiency was observed, sulphate removal efficiencies varied from 85% to 100%. The sulphide con-centrations in the effluents of either reactors did not exceed inhibitory levels and were not higher than 123 and 110 mg L–1, respectively. These data are in agree-ment with the results of our previous experiment. The efficiency of phosphorous removal in the reactor with the carrier was significantly higher (up to 79%) than in the control reactor (57%). It can be assumed that the carrier promoted deposition of insoluble materials, for example precipitation of Ca3(PO4)2. This conclusion was supported by the observation that scaling of the carrier beads was observed in the experiment. The fast clogging of the system with a carrier when treating sulphate-rich wastewaters has been described also in several other studies [12, 13]. In addition to facilitating scaling, a carrier could hamper equal
48
distribution of wastewater over the sections of the reactor, which could result in a lower COD and sulphate treatment efficiency. Therefore it can be concluded that the application of the carrier for the given treatment system was not effective and cannot be recommended.
Coupled microaerophilic/anaerobic system (CSBR)
In the CSBR the effluent from the anaerobic reactor was recycled through an
aeration system. The content of oxygen in the microaerophilic reservoir was kept at the level of 0.1–0.15 mg L–1 to prevent sulphate formation in the oxidation of the sulphide formed in the anaerobic stage of the process leaving sulphur in the form of elemental sulphur (S0) [14]. It was assumed to be the best for simultaneous solution of two problems: sulphate and sulphide removal. The formation of elemental sulphur is an advantage because sulphur is a colloid, inert solid and can be removed from the wastewater for example by gravity sedimentation. The anaerobic reactor was seeded with sulphate adapted anaerobic sludge, and the micro-aerophilic reactor was seeded with activated sludge obtained from the full-scale aerobic reactor of the Salutaguse yeast plant, Estonia.
The CSBR was operated during 68 days under the operational conditions described in previous experiments. The maximum OLR achieved was 7.74 kgCOD m–3 d–1. The average pH value of the final effluent was 8.2 and the alkalinity always remained up to 177 mEq L–1 at the average pH of the influent 4.2. No attempts were made to adjust the pH of the influent. High pH values could be explained by the formation of hydroxide ion during the following biological overall reaction, taking place in a microaerophilic sulphide removal system [15]:
2HS– + O2 → 2S0 + 2OH–. (2)
The results obtained allow us to conclude that a rather good COD removal efficiency (50–70%) was achieved during the experiment. Since the sludge had been well adapted to wastewater a very quick start-up was observed. Only a few days after seeding, the COD removal significantly increased and reached 70%.
The optimal COD loading found for the ASBR was 6–8 kgCOD m–3 d–1. The highest COD removal efficiencies, exceeding 65% in the CSBR, were observed at the same (from 6 to 8 kgCOD m–3 d–1) OLR values (Fig. 6).
Taking into consideration that the optimal ORL value reported in the literature [1] for different methanogenic reactors varies remarkably – from 4 to 12 kgCOD m–3 d–1 – the results obtained in our experiments were quite good for the treatment of high strength sulphate-rich wastewaters. The sulphate removal efficiency achieved in our experiments was excellent – more than 98%. Due to the low dissolved oxygen concentration (0.1–0.15 mg L–1) there were almost no sulphides and sulphates in the effluent (Fig. 7). Only approximately 0.5 mg L–1 of H2S and 0–30 mg L–1 of SO4
2– were present in the effluent while up to 3.6 g L–1 of sulphate had been reduced.

49
40
45
50
55
60
65
70
75
3 5 7 9 11 13
OLR, kgCOD m–3d–1
CO
D r
emov
al e
ffici
ency
, %
Fig. 6. Relationship between OLR and the efficiency of COD removal.
0
10
20
30
40
50
60
70
80
90
100
0 10 20 30 40 50 60 70
Time, day
Sulp
hat
e re
mo
val r
ate,
%
0
2
4
6
8
10
Su
lph
ide,
mg
L–1 Sulphate removal rate
Sulphide, effluent
Fig. 7. Concentration of sulphide and the rate of sulphate removal.
Our data suggest that keeping a low level of the dissolved oxygen concentra-tion in the microaerophilic part of the treatment system helps to poise the treatment process towards the formation of elemental sulphur and that the coupled microaerophilic/anaerobic treatment processes of sulphate-containing wastewaters were effective in alleviating sulphide inhibition of both methano-genesis and sulphate reduction. Last but not least, the exceptional stability of the CSBR process should be noted. The operational conditions worked out in the

50
laboratory-scale experiments were successfully applied at full scale in the Salu-taguse yeast plant, where the process has been applied by now for more than a year.
Final sludge tests
Microscopic examination of the sludge and of the biomass concentration were
performed at the beginning and at the end of each experiment. In none of our experiments granulation was detected. However, significant changes in the structure of the sludge were recorded.
Serious scaling of biomass by inorganic precipitation was observed already during 3.5 months of operation. Measurements of biomass concentration showed that the density of the sludge had also significantly changed since the start of the experiments. The sludge concentration varied between 43.2 g TS L–1 at the beginning of the experiment and 62 g TS L–1 in the ASBR and 65.2 g TS L–1 in the CSBR at the end of the study (Fig. 8). The difference between the values of total solids and volatile suspended solids indicated the presence of inorganic salts in suspension, possibly calcium carbonate and phosphates. Due to the formation of elemental sulphur in the CSBR a faster accumulation rate of inorganic compounds was observed than in the ASBR. With all advantages of this type of reactor the fast accumulation of inorganic compounds is an essential dis-advantage. Precipitation of inorganic salts, as for example calcium carbonate, can indirectly upset the reactor performance by scaling [6, 16], which interferes with a good mass transport of substrate and reaction products. Scaling of biomass by Ca precipitates (CaCO3 and/or Ca3(PO4)2) may already occur at Ca2+ concentra-tions of 400 mg L–1 [17]. Also clogging problems can arise from precipitates in the piping system. Unfortunately, the concentration of calcium in the influent and effluent was not measured in the present study and the problem of the formation and removal of inorganic precipitate requires more detailed study in the future.
0
10
20
30
40
50
60
70
Seed sludge CSBR ASBR
g L
–1
Inorg. Org. TS
Fig. 8. Changes in the sludge composition during the CSBR and the ASBR processes.

51
CONCLUSIONS The results of the study carried out demonstrated that the anaerobic sequenc-
ing batch reactor (ASBR) is a suitable and effective tool for anaerobic treatment of sulphate-rich wastewaters from baker’s yeast production plants. Optimal parameters of the process were determined. However, sulphide formation caused significant malodour problems and corrosion of equipment during the experi-ment.
Experiments with two additional schemes developed for solving the sulphide formation problem showed that use of plastic carriers in the reactor led to a decrease of the treatment efficiency due to the accumulation of insoluble sediment (presumably CaCO3 and Ca3(PO4)2) on the surface of the carriers. So this technology cannot be recommended for large-scale application.
Combination of anaerobic sulphate reduction with biological oxidation of sulphide in a coupled microaerophilic/anaerobic SBR (CSBR) showed the best results and might be preferable for the treatment of sulphate-rich yeast waste-waters. As the scaling of biomass and fast accumulation of inorganic compounds were observed also in this case, successful application of the CSBR technology requires finding a solution for the removal of the inorganic precipitate from the reactor. The data obtained by us will be useful in designing full-scale ASBR and CSBR processes.
ACKNOWLEDGEMENT The authors are grateful to AS Salutaguse Pärmitehas, Estonia, for supporting
this study.
REFERENCES
1. Lens, P. N. L, Omil, F., Lema, J. M. & Hulshoff-Pol, L. W. Biological treatment of organic sulphate-rich wastewaters. In Environmental Technologies to Treat Sulphur Pollution (Lens, P. & Hulshoff-Pol, L., eds). IWA Publishing, London, Alliance, 2000, 467–489.
2. O‘Flaherty, V. & Colleran, E. Effect of sulphate addition on volatile fatty acid and ethanol degradation in an anaerobic hybrid reactor, I: process disturbance and remediation. Biores. Tehnol., 1999, 68, 101–110.
3. Sung, S. & Dague, R. R. Laboratory studies on the anaerobic sequencing batch reactor process. Water Environ. Res., 1995, 67, 291–294.
4. Clesceri, L. C., Breenberg, A. E. & Trussel, R. R. Standard Methods for the Examination of Water and Wastewater. Washington, DC, USA, 1989.
5. Blonskaja, V., Menert, A., Kurissoo, T. & Vilu, R. Use of biological oxidation in the operation of anaerobic digester with sulphate-rich wastewaters. In Proc. 9th World Congress Anaerobic Digestion. Antwerpen, Belgium, 2001, Part 1, 713–718.
6. Maree, J. P., Hulse, G., Dods, D. & Schutte, C. E. Pilot plant studies on biological sulphate removal from industrial effluent. Water Sci. Technol., 1991, 23, 1293–1300.

52
7. Doorn, M., Strait, R. & Barnard, W. In Estimates of Global Greenhouse Gas Emissions from Industrial and Domestic Wastewater Treatment. Environmental Protection Agency Office of Research and Development, Washington, 1997, 148.
8. Rinzema, A. & Lettinga, G. Anaerobic treatment of sulphate containing wastewater. In Bio-treatment Systems (Wise, D. L., ed.). CRC Press, Boca Ration, 1988, 65–109.
9. Lens, P. N. L., Visser, A., Janssen, A. J. H., Hulshoff-Pol, L. W. & Lettinga, G. Biotechnological treatment of sulfate-rich wastewaters. Crit. Rev. Environ. Sci. Technol., 1998, 28(1), 41–88.
10. Welsh, D. T. Ecological significance of compatible solute accumulation by microorganisms: from single cells to global climate. FEMS Microbiol. Rev., 2000, 24, 263–290.
11. Isa, Z., Grusenmeyer, S. & Vertraete, W. Sulfate reduction relative to methane production in high rate anaerobic digestion: technical aspects. Appl. Environ. Microbiol., 1986, 51, 580–587.
12. Matuzevičius, A. & Dilba, A. Experience in using anaerobic reactors for treating highly polluted wastewater. Environ. Engin., 1999, 4, 206–208.
13. Thalasso, F., Van Der Burght, J., O’Flaherty, V. & Colleran, E. Large-scale anaerobic degrada-tion of betaine. J. Chem. Technol. Biotechnol., 1999, 74(12), 1176–1182.
14. Buisman, C. J. N., Bert, G. G., Lispeert, P. & Lettinga, G. Optimisation of sulphur production in a biotechnological sulphide-removing reactor. Biotechnol. Bioeng., 1990, 35, 50–56.
15. Buisman, C. N. J., Stams, A. J., Meijer, H. & Lettinga, G. Sulphur and sulphate reduction with acetate and propionate in an anaerobic process for sulphide removal. Appl. Microbiol. Biotechnol., 1989, 32, 363–370.
16. Lettinga, G. Anaerobic wastewater treatment systems. Ant. Leeuw., 1995, 67, 3–28. 17. Hulshoff Pol, L., Lens, P., Stams, A. J. M. & Lettinga, G. Anaerobic treatment of sulphate-rich
wastewaters. Biodegradation, 1998, 9(3–4), 213–224.
Pärmitööstuse sulfaate sisaldavate reovete töötlemine anaeroobse annuspuhasti reaktoris
Marina Krapivina, Tõnu Kurissoo, Viktoria Blonskaja, Sergei Zub
ja Raivo Vilu Laboratoorse annuspuhastina töötava anaeroobse reaktori (ASBR) vahendusel
on uuritud pärmitööstuse mesofiilsel temperatuurirežiimil sulfaate sisaldavate reovete puhastusprotsessi. On kasutatud kolme erinevat režiimi: puhastusprot-sessi läbiviimist vabalt elunevate anaeroobsete bakterite suspensiooniga, polü-meerse täidise pinnale kinnitunud anaeroobsete bakteritega ja mikroaerofiilset/ anaeroobset töötlust annuspuhastis (CSBR). Anaeroobsete bakterite suspensiooni optimaalseks kontsentratsiooniks on leitud 17,3 g L–1 kuivaine järgi ja reakt-siooniajaks 22 tundi. ASBR-i režiimis töötavas seadmes alaneb KHT 75–82% mahukoormuse 7,7–8,0 kgKHT m–3 d–1 ja KHT/(SO4)
2– suhte 8,0 korral. Eral-duvas biogaasis on metaanisisaldus optimaalsete tingimuste korral 60%. Parim tulemus (99%) sulfaatioonide sisalduse alandamisel saavutatakse CSBR-i režii-mil, kusjuures reaktorist väljunud reovees on sulfiidioonide sisaldus 10 mg L–1 piires. Annuspuhastina töötava anaeroobse reaktori pikaajalisel töös hoidmisel väheneb puhastusprotsessi efektiivsus, mis on autorite hinnangul tingitud lahus-tumatu mineraalse sette moodustumisest, mis võib koosneda kaltsiumkarbo-naadist (CaCO3) ja kaltsiumfosfaadist (Ca3(PO4)2).

29
Proc. Estonian Acad. Sci. Chem., 2006, 55, 1, 29–39
Possibilities of using ozone for the treatment of wastewater from the yeast industry
Viktoria Blonskajaa*, Inna Kamenevb, and Sergei Zubc
a Department of Environmental Engineering, Tallinn University of Technology, Ehitajate tee 5,
19086 Tallinn, Estonia b Department of Chemical Engineering, Tallinn University of Technology, Ehitajate tee 5, 19086
Tallinn, Estonia; [email protected]
c Salutaguse Yeast Factory, Kohila, 79702 Raplamaa, Estonia; [email protected] Received 3 March 2005, in revised form 14 November 2005 Abstract. The purpose of the study was to establish if ozonation can be used to enhance the process of purifying wastewater from the yeast industry. The results of the experiments indicate that ozonation can be used in the tertiary treatment of yeast wastewater for the reduction of colour, odour, and the overall concentration of contaminants. During ozonation, the biodegradability of the wastewater increased; therefore it is possible to include ozonation into the combined purification process simultaneously with anaerobic and aerobic bio-oxidation. In addition, the application of ozonation as a pre-treatment method for anaerobic digestion of excess sludge from wastewater treatment plants was studied. Ozonation of the excess sludge resulted in a reduction of the sludge amount and increased the solubility of sludge organic matter. Although the solubility of sludge increased, the process of anaerobic mesophilic digestion was not improved. Key words: ozonation, yeast wastewater, excess sludge, anaerobic digestion.
INTRODUCTION The food industry is one of the contributors of wastewater pollution. The total
amount of the wastewater is not large but the level of its contamination is very high. Also, the composition of wastewater varies considerably with each branch and mill type of the industry.
The wastewater from the yeast industry is characterized by a high chemical oxygen demand (COD), dark colour, and high concentrations of total nitrogen (Ntot) and non-biodegradable organic pollutants. Most of the contaminants in the
* Corresponding author, [email protected]

30
wastewater are due to the use of molasses as a main raw material. As a by-product of sugar manufacturing, molasses contains 45–50% residual sugars, 15–20% non-sugar organic substances, 10–15% ash (minerals), and about 20% water. During yeast fermentation, the sugars contained in the molasses are a source of carbon and energy. However, a major part of the non-sugar substances in the molasses are not assimilable by the yeast and are released unchanged to the processing wastewater. These compounds represent the principal waste from the yeast production process. In addition, the chemicals added during fermentation (e.g. antifoams, propionic acids, brine, etc.), yeast metabolites, and residual yeast cells are in the wastewater.
In Estonia, Salutaguse Yeast Factory produces about 330 m3 of wastewater per day, which is currently treated with a combination of anaerobic/anoxic biological oxidation followed by aerobic stages with activated sludge (Fig. 1). The raw wastewater contains high concentrations of organic pollutants (25 020 mg L–1 total chemical oxygen demand, CODtot; 23 420 mg L–1 soluble chemical oxygen demand, CODsol), nutrients (1470 mg L–1 of total nitrogen, Ntot; 100 mg L–1 of total phosphorus, Ptot), and sulphates (2940 mg L–1 SO4
2–). Salutaguse Yeast Factory has developed and improved its biological wastewater
treatment process during the last years to reach effluent targets. However, the current technology is still not optimal as the total treatment efficiency in terms of COD is only about 80%. Even after multi-step biological treatment, the wastewater contains a relatively high amount of pollutants – mainly slowly biodegradable or non-biodegradable compounds such as melanoidins. Melanoidins are the high molecular weight polymers responsible for the brown colour, residual COD, and nitrogen in baker’s yeast effluent [1].
Fig. 1. The technological set-up used in Salutaguse Yeast Factory (Kohila, Estonia).

31
In summary, the main problems in the treatment of yeast wastewater are high concentration of COD in the effluent, colour, odour, and a high amount of excess sludge generated in the wastewater treatment process.
If a higher degree of purification is required, biological purification can be used in combination with other processes such as physico-chemical, chemical, or advanced oxidation processes [2]. Advantages of ozonation in treatment applica-tions are removal of toxicity, destruction of organic matter, and enhancement of the biodegradability of recalcitrant wastewaters [3]. Ozone pre-treatment has been used to improve subsequent biodegradation [4–6]. In addition, ozonation can also increase the biodegradability of previously biologically treated waste-waters [7], thus enabling the use of an additional biological treatment stage, and repetitive treatment schemes. Presently, special attention is paid to the recycling combinations of biological treatment and ozonation [8, 9] where increased discharge quality at decreased oxidant consumption was obtained. It has been shown that a combined method, aerobic bio-oxidation with ozonation of recycled biologically treated wastewater, enabled improvement in purification efficiency at low ozone dosages [10, 11].
Another concern is the reduction of the excess sludge. According to new regulations, in effect since 2001, the priority is to develop new ways to reduce the amount of waste (excess sludge) on-site and to recycle biomass as much as possible [12]. Anaerobic digestion is an economical and environmentally friendly strategy for solving this problem. At present, a million tonnes of organic wastes are digested per year [13]. These are converted to biogas and to a stabilized residual matter. Today the anaerobic digestion method for sludge stabilization is used in Estonia too.
Anaerobic digestion of excess sludge is a multi-stage process and it is generally limited by the rate of hydrolysis of suspended matter and organic solids [13]. This stage of digestion is very important and therefore it is reasonable to carry it out in a separate reactor as a pre-treatment process. There are several methods that can be used: mechanical methods, ultrasonic disintegration, chemical methods, thermal pre-treatment, and aerobic and anaerobic pre-treatment [14]. Most of these methods have an influence on mesophilic anaerobic digestion and result in a better supply of soluble substrate to methanogenic bacteria.
The aim of this study was to establish if the application of ozone can enhance the purification of yeast wastewater, and improve the pre-treatment of excess sludge.
MATERIALS AND METHODS
Post-ozonation of biologically treated wastewater In the experiments of post-ozonation, biologically treated yeast wastewater
from Salutaguse Yeast Factory was used. Samples of wastewater were taken over a period of two months. This biologically treated wastewater had a relatively

32
Fig. 2. Laboratory set-up for batch ozonation. 1 – semi-batch reactor, 2 – ozone generator Ozon-2M, 3 – air compressor, 4 – ozone analyser Anseros GM-6040, 5 – residual ozone destruction unit, 6 – flow meter, 7 – thermometer.
high residual COD and brown colour. The values of the most important para-meters were: COD – 1500–2200 mg L–1, BOD – 160–310 mg L–1, pH – about 8.
Figure 2 illutrates the laboratory set-up used in the experiments of post-ozonation. Ozonation of wastewater was conducted in a 0.9-L semi-batch glass reactor with a continuous gas flow through the liquid. This ozone–air gaseous mixture was generated in the ozone generator OZON-2M. The ozone–air mixture was introduced to the bottom of the reactor through a ceramic diffuser. Wastewater was ozonated until an ozone breakthrough was observed after a period of complete ozone absorption by the wastewater. The experiments were carried out without adjusting the pH.
Pre-ozonation of excess sludge
In this part of the study, the influence of pre-ozonation of excess sludge on its
anaerobic mesophilic digestion was tested. The ozonation of the sludge was carried out in a laboratory set-up analogous
to that shown in Fig. 2. The batch reactor was a 1.3-L glass reactor supplied with a foam destructor. The sludge was ozonated for 20, 105, and 240 min, with the corresponding consumed ozone doses of 23.8, 89.0, and 313.3 mgO3 L
–1. In the following tests of anaerobic digestion, mesophilic anaerobic inoculation
sludge (10% of the total volume of the reactor) was added to the pre-ozonated sludge to initiate a mesophilic anaerobic digestion process. Flasks (volume 1.0 L) containing sludge mixture were then placed into an air-thermostat at mesophilic temperature conditions (35 ± 1 °C). Anaerobic digestion was carried out for 27 days. The flux of the generated biogas, a criterion for the evaluation of the process efficiency, was measured continuously.

33
Analyses The amount of total organic matter in the wastewater was determined as
chemical oxygen demand of unfiltered sample CODtot, the amount of soluble organic matter as COD of filtered samples CODsol, and the amount of bio-degradable organic matter as seven-day bio-chemical oxygen demand BOD. In addition, the pH of the wastewater was measured.
For sludge, the following concentrations were measured: COD of sludge mixture (CODtot) and its supernatant, the solubilized fraction (CODsol), and total suspended solids (TSS).
Analyses of COD were conducted using HACH reagents and equipment according to the standard methods. BOD was determined using procedure 5210 of the Standard Methods for the Examination of Water and Wastewater. The pH was measured with an Evicon E6121 pH-meter. Ozone concentration in gaseous phase was measured with an ozone analyser Anseros GM-6040.
RESULTS AND DISCUSSION
Post-ozonation of biologically treated wastewater The results of the post-ozonation of biologically treated yeast wastewater are
presented in Table 1. The experiments indicated that the efficiency of post-ozonation in terms of COD (COD removal) ranged from 30% to 49%, and the ratio dn/∆COD, consumed ozone dosage mg of ozone per mg of COD removed, ranged from 1.2 to 2.5.
Figures 3 to 7 express the dependence of CODtot, CODsol, BOD, and BOD/COD, the biodegradability of the wastewater, on the consumed ozone dose dn (mg of ozone per litre of treated wastewater). The ozone dosage required to decrease the residual COD noticeably was about 1000–1500 mg L–1, and both CODtot and CODsol decreased. This indicates that during post-ozonation the particulated organic matter in the wastewater was partly solubilized and the soluble matter was being oxidized.
Table 1. Results of post-ozonation of biologically treated wastewater
Parameters of biologically treated yeast wastewater
Parameters of wastewater after post-ozonation
Run
CODtot, mg L–1
BOD, mg L–1
BOD/ COD
Consumed ozone dosage,
dn/∆COD, mgO3 mgCOD–1
Efficiency of post-
ozonation ∆COD, %
CODtot, mg L–1
BOD, mg L–1
BOD/ COD
1 2055 161 0.08 2.45 30 1460 317 0.22 2 2120 579 0.27 2.47 31 1470 381 0.26 3 1480 204 0.14 2.2 34 970 310 0.32 4 1860 308 0.17 1.2 49 940 297 0.32 5 1940 147 0.08 1.6 30 1430 250 0.17

34
0
500
1000
1500
2000
2500
0 500 1000 1500 2000
dn, mg L –1
CO
Dto
t, B
OD
, mg
L–1
0.00
0.05
0.10
0.15
0.20
0.25
BO
D/C
OD
CODtot BOD BOD/COD Fig. 3. The effect of ozone dosage (dn) on CODtot, BOD, and the ratio BOD/COD of biologically treated yeast wastewater (run 1). The pH rose from 7.3 to 7.9.
0
500
1000
1500
2000
2500
0 500 1000 1500
dn, mg L –1
CO
Dto
t, C
OD
sol,
BO
D, m
g L
–1
0.20
0.25
0.30
0.35
0.40
0.45
0.50
BO
D/C
OD
BOD CODtot CODsol BOD/COD Fig. 4. The effect of ozone dosage dn on CODtot, CODsol, BOD, and BOD/COD of biologically treated yeast wastewater (run 2). The pH fell from 8.3 to 8.1.
As a rule, the results of the post-ozonation of yeast wastewater depend on the
wastewater composition and consequently on the previous process of biological purification. BOD and biodegradability (BOD/COD) of the wastewater increased during ozonation, as shown in Figs 3, 5, and 7. In run 2, illustrated in Fig. 4, BOD decreased. This can be explained by the low efficiency of the biological treatment before ozonation. The biologically treated water contained a large

35
amount of biodegradable compounds – CODtot was 2120 mg L–1 and BOD was 580 mg L–1. Even in this case, the biodegradability was initially enhanced by ozonation (at ozone dose of 300 mg L–1) followed by a decrease. In run 4 (Fig. 6), BOD decreased slightly, and the biodegradability increased in this case due to a faster decrease in COD.
0
200
400
600
800
1000
1200
1400
1600
0 200 400 600 800 1000 1200
dn, mg L–1
CO
Dto
t, C
OD
sol,
BO
D, m
g L
–1
0.00
0.05
0.10
0.15
0.20
0.25
0.30
0.35
BO
D/C
OD
CODtot CODsol BOD BOD/COD
Fig. 5. The effect of ozone dosage dn on CODtot, CODsol, BOD, and BOD/COD of biologically treated yeast wastewater (run 3). The pH rose from 7.3 to 7.9.
0
500
1000
1500
2000
0 200 400 600 800 1000 1200
dn, mg L–1
CO
Dto
t, C
OD
sol,
BO
D, m
g L
–1
0
0.05
0.10
0.15
0.20
0.25
0.30
0.35
BO
D/C
OD
CODtot CODsol BOD BOD/CO Fig. 6. The effect of ozone dosage dn on CODtot, CODsol, BOD, and the ratio BOD/COD of biologically treated yeast wastewater (run 4). The pH rose from 7.3 to 7.9.

36
0
500
1000
1500
2000
2500
0 200 400 600 800
dn, mg L–1
CO
Dto
t, C
OD
sol,
BO
D, m
g L
–1
0.00
0.05
0.10
0.15
0.20
BO
D/C
OD
CODtot CODsol BOD BOD/CO Fig. 7. The effect of ozone dosage (dn) on CODtot, CODsol, BOD, and the ratio BOD/COD of biologically treated yeast wastewater (run 5). The pH rose from 7.9 to 8.4.
Generally, during ozonation the pH decreases as a result of the formation of carboxylic acids. However, in the experiments of post-ozonation of the yeast wastewater, the pH decreased only in run 2. In all other runs the pH increased. The reason could be that acidic products of biochemical oxidation had been degraded by ozone.
In all cases, ozonation removed the colour and distinct odour of the treated wastewater. Initially, the biologically treated wastewater was dark brown and had a distinct odour, and after ozonation it was practically transparent and colourless with no odour specific to this wastewater.
The post-ozonation experiments indicate that ozonation can be used in the tertiary treatment of yeast wastewater for the reduction of colour, odour, and overall concentration of organic contaminants and matter. Since the biodegrad-ability of the yeast wastewater increased during the ozonation, or at least at the beginning of post-ozonation, it is possible to include ozonation into the combined purification process simultaneously with anaerobic and aerobic bio-oxidation. In the combined process, the goal of ozonation is enhancement of biodegradability and removal of colour and odour. Taking into account that ozonation is still an expensive technology, the last option – application of ozonation in combinations with biological methods – may be more economical for yeast wastewater purification than ozonation alone.
Pre-ozonation of excess sludge
During the experiments raw sludge (CODtot 85 000 mg L–1, CODsol
5300 mg L–1, and TSS 39 200 mg L–1), sludge after pre-treatment and after anaerobic mesophilic digestion process were analysed.

37
Table 2. Main results of sludge pre-treatment with ozone
Sludge characteristics
CODtot, mg L–1 CODsol, mg L–1 TSS, mg L–1
Consumed
ozone dosage,
mgO3 L–1
Raw sludge
After pre-treat-ment
∆COD, %
Raw sludge
After pre- treat- ment
∆COD, %
Raw sludge
After pre- treat ment
∆TSS, %
0 85 000 5300 39 200 23.8 85 000 64 000 25 5300 7000 – 32 39 200 34 100 13 89.0 85 000 70 000 18 5300 6500 – 23 39 200 35 900 8 313.3 85 000 73 000 14 5300 7500 – 42 39 200 36 200 8
The main results of the pre-ozonation of excess sludge are shown in Tables 2
and 3. These tables contain a control experiment without ozonation for direct comparison.
During sludge pre-treatment CODtot decreased by up to 25% as a result of the oxidation of organic materials. CODsol of the pretreated sludge was higher than that in the control reactor because the products of ozonation (alcohols, aldehydes, organic acids) are more soluble than the initial organic material. Thus ozonation enabled us to transfer more organic matter into soluble form (the CODsol increase 42%) and as a result the amount of sludge (as TSS) decreased by up to 13%.
The results of the anaerobic digestion process are shown in Table 3. During the mesophilic anaerobic stage of digestion, the best results were
achieved in the control sample without ozonation. The decomposition of organic matter was 70%, the amount of total suspended solids decreased by up to 35%, and as a result, the best biogas production occurred (up to 0.01 m3 kg–1 CODtot removed).
The pre-treatment has to be evaluated by its effects on the overall process. The ozone pre-treatment did not improve the mesophilic anaerobic digestion process (CODtot and TSS removal and biogas production were lower than in the control experiment) and therefore cannot be used for this purpose.
Table 3. Main results of the anaerobic sludge digestion process
Sludge characteristics
CODtot, mg L–1 CODsol, mg L–1 TSS, mg L–1
Consumed ozone dosage in sludge pre-
treatment, mgO3 L
–1
Before MAD
After MAD
∆COD, %
Before MAD
After MAD
∆COD, % Before MAD
After MAD
∆TSS, %
0 85 000 25 400 70 5300 3470 35 39 200 25 400 35 23.8 64 000 30 700 52 7000 8220 17 34 100 28 800 15 89.0 70 000 26 900 62 6500 5030 23 35 900 27 400 24 313.3 73 000 25 800 65 7500 3920 48 36 200 27 000 25 ———————— MAD – mesophilic anaerobic digestion of the sludge.

38
CONCLUSIONS It was established that the post-ozonation of biologically treated yeast
wastewater resulted in the reduction of COD by 30–49%, and the consumed ozone dosage (mg ozone per mg of COD removed) ranged from 1.2 to 2.5. The biodegradability of the wastewater, expressed as BOD/COD ratio, generally increased during the ozonation. Also, the colour and odour problems of the yeast wastewater were eliminated. Thus, it is possible to use ozonation in the tertiary treatment of yeast wastewater or to include ozonation into the combined purification process simultaneously with anaerobic and aerobic bio-oxidation. Application of ozonation in a combined process seems to be promising for yeast wastewater purification; in this case, the target of ozonation is the enhancement of biodegradability and removal of colour and odour.
Although the pre-treatment of the excess sludge with ozone resulted in a reduction of the sludge amount and increased the solubility of sludge organic matter, the following process of mesophilic anaerobic digestion was not improved.
ACKNOWLEDGEMENT The authors would like to thank the Estonian Science Foundation (grant
No. 5607).
REFERENCES
1. Cämmerer, B. & Kroh, L. W. Investigations of the influence of reaction conditions on the elementary composition of melanoidins. Food Chem., 1995, 53(1), 55–59.
2. Marco, A., Esplugas, S. & Saum, G. How and why to combine chemical and biological processes for wastewater treatment. Water Res., 1997, 35, 321–327.
3. Kayser, R. Wastewater treatment by combination of chemical oxidation and biological processes. In Proc. Int. Conf. of Oxidation Technologies for Water and Wastewater Treatment, May 12–15, 1996, Goslar, Germany. Papierflieger, Glausthal-Zellerfeld, 1996.
4. Tuhkanen, T., Naukkarinen, M., Blackburn, S. & Tanskanen, H. Ozonation of pulp mill effluent prior to activated sludge treatment. Environ. Technol., 1997, 18, 1045–1051.
5. Alvares, A. B. C, Diaper, C. & Parsons, S. A. Partial oxidation by ozone to remove recalcitrance from wastewater – a review. Environ. Technol., 2001, 22, 409–416.
6. Haapea, P., Korhonen, S. & Tuhkanen, T. Treatment of industrial landfill leachates by chemical and biological methods: ozonation, ozonation + hydrogen peroxide, hydrogen peroxide and biological post-treatment for ozonated water. Ozone: Sci. Eng., 2002, 24, 369–378.
7. Oeller, H.-J., Weinberger, G. & Demel, I. Reduction in residual COD in biologically treated paper mill effluents by ozone and ozone/UV treatment. In Proc. Int. Conf. Ozonation Related Oxidation Processes in Water Liquid Waste Treatm., 1997, Berlin, Germany, VI.1–15, 1997.
8. Ried, A. & Mielcke, M. The state of development and operational experience gained with processing leachate with a combination of ozone and biological treatment. In Proc. 15th Ozone World Congress, August 22–26, 1999, Dearnborn, Michigan, USA. Part 2, 65–81.

39
9. Jeworsky, M. & Heinzle, E. Combined chemical–biological treatment of wastewater containing refractory pollutants. Biotechnol. Ann. Rev., 2000, 6, 163–196.
10. Kamenev, I., Pikkov, L. & Kallas, J. Aerobic bio-oxidation combined with ozonation in the treatment of landfill leachates. Proc. Estonian Acad. Sci. Chem., 2002, 51, 148–155.
11. Kamenev, I. Aerobic bio-oxidation combined with ozonation in recalcitrant wastewater treatment. PhD thesis. TTU Press, 2003.
12. Yasul, H., Komatsu, K., Goel, R., Li, Y. Y. & Nolka, T. Full-scale application of anaerobic digestion process with partial ozonation of digested sludge. In Proc. IWA Conference on 10th World Congress Anaerobic Digestion 2004. Montreal, Canada, 29 August–2 September 2004. Part 2, 636–641.
13. van Lier, J. B., Tilche, A., Ahring, B. K., Macarie, H., Moletta, R., Dohanyos, M., Huls-hoff Pol, L. W., Lens, P. & Verstraete, W. New perspectives in anaerobic digestion. Water Sci. Technol., 2001, 43, 1–18.
14. Blonskaja, V. & Vaalu, T. Investigation of pre-treatment influence to excess sludge digestion process. In Proc. Symposium dedicated to the 40th Anniversary of Institute of Environ-mental Engineering at Tallinn Technical University. Tallinn, Estonia, 24–26 September 2001, 223–231.
Osooni kasutamise võimalustest pärmitööstuse reovee töötlemisel
Viktoria Blonskaja, Inna Kamenev ja Sergei Zub
Töö eesmärgiks on hinnata osoonimise rakendamise võimalikkust pärmi-
tööstuse reovee puhastusprotsessi parandamiseks. Katsetest on selgunud, et osoonimist on võimalik kasutada bioloogiliselt
puhastatud reovee süvapuhastuses värvuse ning lõhna kõrvaldamiseks ja reo-ainete kontsentratsiooni vähendamiseks. Kuna osoonimisel suureneb reovee bio-lagundatavus, on otstarbekas kasutada osoonimist reovee puhastamisel kombi-neeritult koos anaeroobse ja aeroobse biooksüdatsiooniga.
Samuti on uuritud reovee puhastusprotsessis tekkinud jääkmuda osoonimist enne selle anaeroobset kääritamist. Jääkmuda eeltöötlemine osooniga vähendab muda hulka ja suurendab selle orgaanilise aine lahustuvust. Muda lahustuvus küll suureneb, kuid sellele järgneva muda mesofiilse kääritamise protsessi efektiivsus ei parane.


ENVIRONMENTAL ENGINEERING
May 26-27, 2005 The 6th International Conference Faculty of Environmental Engineering, Vilnius Gediminas Technical University Sauletekio al. 11, LT-10223 Vilnius-40, Lithuania Tel.: +370 5 2745011; Fax.: +370 5 2744731; e-mail: [email protected]
ANAEROBIC TREATMENT OF YEAST INDUSTRY WASTES - YEARS OF INDUSTRAL EXPERIENCE
Victoria Blonskaja1, Sergei Zub2 and Marina Krapivina3
1Tallinn University of Technology, Department of Environmental Engineering, Ehitajate tee 5,
19086 Tallinn, Estonia, E-mail: [email protected] Salutaguse Yeast Factory, Kohila, 79702 Raplamaa, Estonia, E-mail: [email protected]
3Tallinn University of Technology1 Institute of Basic and Applied Chemistry, Ehitajate tee 5, 19086 Tallinn, Estonia
Abstract. This paper described some aspects of the operation of the local treatment plant of bakers industry. The operation factors of stable treatment performance were optimized. Included are results of the lab-scale experiments with ozone and results of one or two stage anaerobic mesophilic treatment process with different types of reactors. During ozonation, the biodegradability of the wastewater increased, therefore, the ozonation can be used in the post treatment of yeast wastewater for the reduction of colour, odour, and the overall concentration of contaminants.
Keywords: anaerobic mesophilic fermentation, organic matter, post-ozonation, sulphate rich wastewaters, yeast
industry.
1. Introduction
Food industry is one of the major contributors for
wastewater pollution. Baker's yeast industry effluents are characterized with high chemical oxygen demand (COD), sulphate, total nitrogen (Ntot), dark colour, and non-biodegradable organic compounds (melanoidins). Slow or non-biogradable substances melanoidins are the high molecular weight polymers responsible for the brown colour, residual COD, and nitrogen in baker’s yeast effluent. Melanoidins are formed in a set of consecutive and parallel chemical reactions between amino compounds and carbohydrates during a Maillard reaction [1].
Most of the contaminants in the wastewater are due to the use of molasses as a main raw material.
Summarizing, the main problems for the treatment of yeast wastewater are high concentration of COD, sulphate, colour and odour.
The article presents a summary of the important aspects of the operation of the anaerobic treatment process.
2. Materials and methods
Anaerobic mesophilic (36 ±1°C) treatment of
highly concentrated wastewater of the yeast industry was studied at the laboratory and pilot plant scales. The biological oxygen demand (BOD7), chemical
oxygen demand (COD), sulphate, sulphide, Suspended Solids (SS), Ntot, Ptot, dry matter, alkalinity and volatile fatty acids (VFA) of wastewater and effluent were measured according to the Standard Methods for Water and Wastewater Examination [2]. Flow rates, biogas production rate, temperature and effluent pH were measured daily.
3. Theory
Anaerobic wastewater treatment technologies are
used throughout the world for effective treatment of this type of wastewaters.
One or two reactors (stages) can be used for the anaerobic digestion process. As known, methanogens were more active in the phase-separated set-up than in the single-phase system [3, 4]. As fermentation proceeds at a much greater speed than acetogenesis/methanogenesis, the former is carried out in acidic conditions in separate reactor.
A two-phase system of anaerobic digestion process has many advantages, such as optimizing the potential rate limiting steps (hydrolysis and methanogenesis), improving the reaction kinetics and stability.
During the anaerobic processes two important goals are achieved simultaneously: removal of organic matter and of sulphates (yeast industry

wastewater). However, high sulphate content can lead to destabilization of the process due to hydrogen sulphide formation [5].
Sulphate reducing bacteria (SBR) interact competitively with other anaerobic bacteria involved in methanogenesis, resulting in formation of H2S rather than methane (Figure 1).
C o m p le x o r g a n ic m a t e r ia l
H y d r o ly s i sF e r m e n t a t io n
F a t t y a c id
A c e t o g e n e s i s
A c e t a teH 2 + C O 2
M e t h a n o g e n e s i s M e t h a n o g e n e s i s
C H 4 + C O 2
S u l f a t e r e d u c t io n
S u l f a t e r e d u c t io n
H 2 S + C O 2
S u l f a t e r e d u c t io n
Fig. 1. Anaerobic degradation of sulphate containing
wastewater [3]. Sulphate reducing bacteria product sulphide,
which is higher concentration toxic to methanogenic bacteria [6]. On the other hand sulphide is the major sulfur source of methanogenic bacteria. Sulphide toxicity is highly dependents on pH. This means that low pH (<6.5) increases toxicity because unionized hydrogen sulphide is able to pass through the cell membranes[7].
The anaerobic mesophilic digestion processes responsible for the formation of odour-causing substances produce inorganic gases. The malodorous inorganic gases are primarily ammonia (NH3) and hydrogen sulphide (H2S). In addition to odour, hydrogen sulphide in the gas phase causes both human health and corrosion problems [8].
The main problems with formation of H2S during the anaerobic digestion process are [5]:
1. the inhibitory effect of H2S on many bacterial groups,
2. a reduction of methane yield and thus less energy recovery,
3. a odour, corrosion of piping and pumps, 4. the production of sulphide and formation of
sulphide precipitates. The strategies consist of the determination of the
optimal pH to maintain the concentration of both the unionized H2S and unionized NH3 as low as possible. Since the inhibitory effects of both compounds determine the overall efficiency.
Successful strategies include dilution of the wastewater, decreasing the ionized sulphide concentration (by scrubbing or precipitation) and employing a multi step anaerobic digestion process [5]:
1. Anaerobic digestion in two stages (pre-acidification step with sulphate reduction followed by a methanogenic stage). The sulphide can be removed in the first stage or between the two stages,
2. The precipitation of sulphide in the anaerobic digester by the use of iron is the accumulation of FeS precipitate in the reactor.
3. Removal of sulphide from the effluent of the reactor combined with recirculation of the effluent. The removal of the sulphide can be conducted by chemical precipitation or by chemical or biological oxidation.
4. Results and discussion
The undiluted wastewater from baker’s yeast
production contains high average concentrations of organic pollutants (25,020 mg L-1 total COD; 23,420 mg L-1 soluble COD), nutrients (1,470 mg L-1 Ntot, 100 mg L-1 Ptot) and sulphates (2,940 mg L-1 SO4
2-). The anaerobic mesophilic process was
investigated for COD and sulphate removal. Two–stage system with anaerobic filter (AF) on
the first stage and upflow anaerobic sludge bed (UASB) reactor on the second stage respectively and single stage system with – sequence batch reactor (SBR) were analysed.
Two-stage system [9] Experiments were conducted with a hydraulic
retention time (HRT) of 5 to 16 days and organic load rate (OLR) of 0.6 to 4.3kgCOD·m-3·d-1 in the first stage and 9 to 15 days at ORL 0.1 to 1.4 kgCOD·m-
3·d-1 in the second stage. COD removal efficiency was 88% and 70% in the first and second stage respectively. The main results of the experiment are shown at Table 1.
Summarising the results obtained under steady state conditions one can conclude for the investigated system, that COD reduction decreased with decrease of HRT, as well as with decrease of influent waste.
Sulphate removal efficiency was 98% of which up to 91% was removed (converted to sulphides) in the first reactor. The content of H2S in biogas was 2,8%.
Experiments shown, that high pH (>8) value together with high sulphide concentrations inhibit the growth of methanogenes and in lesser extend biogas production decrease rapidly.
Anaerobic treatment is considered as a feasible treatment method for sulphate rich wastewaters. However, a high sulphate content can cause major trouble to the process, mainly because in interactions between sulphate reducers and methanogens.

Table 1. Summary of the results during the experimental run period
Effluent Parameters Unit Influent AF UASB
Min Max Min Max Min Max COD mgL-1 3000 27000 973 13000 1080 9720
Sulphate mgL-1 883 4900 390 575 118 370 Alkalinity mgL-1 1900 11410 184 2720 Dry matter mgL-1 2.9 15.0 3.1 14.0
VFAs, mgL-1 130 2840 184 2720 Gas production L d-1 0,174 7,544 0,024 0,642
pH 5.6 8.3 7.8 8.6 The sulphate reduction, as well as
methanogenesis took place predominantly in the first stage of the two-stage digestion scheme. In the case of two-stage scheme the total sulphate removal was 98%, and COD removal was up to 88%.
Loss of methanogenesis on the second stages of the digestion processes (UASB) can result in the formation of high concentrations of VFAs and sulphides with a significant risk of creating odour problems.
The UASB reactor is often not applicable for the treatment of high sulphate containing wastewaters in mezophilic conditions. The observed instability and increased wash-out of sludge granules observed can be explained by the fact that under stress conditions, all energy gained by bacteria from dissimilation is used for generation of metabolic products, not for the growth of cells [10]. However, in the modified anaerobic/anoxic reactors system a stabile, buffered system was observed with a pH between 7.2 and 7.5, self-regulated by the biological process (without neutralization) and with good purification efficiency.
The AF can be useful for suitability for treatment of soluble organic, but UASB system better for well settling sludge.
Single stage-SBR [11]. Three different treatment schemes were
investigated – anaerobic sequence batch reactor (ASBR), ASBR with the polymeric filler and coupled microaerophilic/anaerobic SBR (CSBR). The optimal contents of sludge - 40% (S S 17.3 g⋅L-1) in the reactor, and the optimal reaction time - 22 hours were determined by monitoring the rate of biogas production. Optimal time for sludge settling cycle – 0.5-1.0 hours was established on the basis of the study of the kinetics of sludge settling processes.
It was shown that in the case of ASBR efficient treatment characterized by COD removal of 75%-82% took place at COD loading rates up to 7.7-8.0 kgCOD·m-3·d-1 and at COD/ SO4
2- ratio 8.0. Sulphate removal efficiency was up to 95% (Figure 2). The temperature and pH changes during the experiments are shown in Figure 3. Methane content of the biogas in optimal conditions was 60%.
In the case of CSBR anaerobic effluent from the reactor was recycled through an aeration system, and the content of oxygen in microaerophilic reservoir was kept on the level 0.1-0.15 mg⋅L-1 to direct the process of sulphur reduction towards the formation of elemental sulphur, and to prevent the formation of toxic H2S. Sulphate removal efficiency in CSBR was 99%, and the concentration of sulphide in the reactor effluent was about 10 mg⋅L-1. Decreasing of treatment efficiency after a long-time exploitation of these reactors studied were the result of formation of insoluble sediment (presumably CaCO3 and Ca3(PO4)2).
The high cation (both Na and Ca) concentrations present in sulphate-rich wastewater can inhibit anaerobic bacteria. The calcium ion does not exert a severe direct toxic effect, CaCO3 and Ca3(PO4)2 precipitates can indirectly upset the reactor performance by scaling.
0102030405060708090
100
0 20 40 60
Time,day
Sulp
hate
rem
oval
rate
,%
0
2
4
6
8
10
Sulp
hide
, mg/
LSulphate removal rate
Sulphide, effluent
Fig. 2. Sulphate removal efficiency during the
experiment These precipitates are entrapped in the reactor
biomass and results in a complete loss of the activity of the sludge granules owing the calcium layer which can completely block substrate transport [12]. Clogging problems can also arise from precipitates in the piping system.
Biomass scaling and the fast accumulation of inorganic compounds were detected during the

experiment. For successful application of this technology it is necessary to find a way to remove the inorganic precipitate from the reactor.
The results of the study carried out demonstrated that the anaerobic sequencing batch reactor (ASBR) is a suitable and effective method for anaerobic treatment of sulphate rich wastewaters from baker’s yeast production plant. However, the problems of sulphide formation caused significant malodour problems and corrosion of equipment during the experiment.
3
4
5
6
7
8
9
0 20 40 60 80 100
Time, day
pH ra
nge
0
5
10
15
20
25
30
35
40
CpH influentpH effluentTemperature
Without neutralization
Neutralization by10% NaOH
Fig. 3. Temperature and pH changes time The temperature, pH control, acidity, alkalinity,
sulphate and gas production were main factors for improving to anaerobic process.
The lab-scale experiments with one and two-stage process shown, that the combination of anaerobic digestion process with AF or ASBR with anoxic-anaerobic treatment can be useful for COD and sulphate removal from yeast wastewaters.
Ozonation The application of ozonation in combined
process may be more economical and prospective for yeast wastewater purification; in this case, the target of ozonation is the enhancement of biodegradability and removal of colour and odour. During the lab-scale experiments with post-ozonation of biologically treated yeast wastewater were received that, the reduction of COD by 30 to 49%, and the consumed ozone dosage per mg of COD removed ranged from 1.2 to 2.5. The biodegradability of the wastewater, expressed as BOD/COD ratio, generally increased during the ozonation. Also, the colour and odour problems of the yeast wastewater were eliminated.
The local treatment plant. The equipment for biological purification of
separation residues of baker’s yeast at Salutaguse Yeast Plant (built by a Finnish Contractor, Tampela) is in operation since 1991, but has never performed satisfactory.
The main results from lab-scale experiments were adopted at Salutaguse wastewater treatment plant. After introducing modified anaerobic/anoxic system local treatment plant has been in stable operation more than 5 years (Figure 4).
Wastewater from the yeast production plant processing beet sugar molasses with a volume of 190 m3 d-1 (after year 2003 average daily volume is 350 m3d-1) was treated with anaerobic sludge in modified anaerobic/anoxic reactors system. The anaerobic reactors were fed with mixture of raw wastewater and recycled anoxic sludge. The temperature of the anaerobic stage has been kept between 30 and 36 °C; the pH of between 7.2 and 7.5 was self-regulated by the biological process without neutralization. Both anaerobic reactors are operating with COD loading of 12 – 16 kgCOD·m-3·d-1.
Fig. 4. The principal scheme of wastewater treatment
in Yeast Factory (Estonia) Principal technological set-up differs from the
originally designed set-up in the following: a) the anaerobic stage is followed by the anoxic
stage; b) part of anoxic sludge from secondary
sedimentation tank is re-circulated back to the inlet, i.e. the to the mixing tank;
c) for final purification of the effluent the aerobic sequencing batch reactors and aerated bio ponds are used.
According to the technological set-up presented in Figure 4, the biological processes in the anaerobic reactors and in the anoxic reactor are inter-related by the returned sludge from the secondary sedimentation tank (by the anoxic reactor) to the inlet of the mixing tank. Evaluation of the efficiency of anaerobic and anoxic stages as well as the total efficiency of the system has demonstrated that leading the wash waters back to the holding tank improved the efficiency of the anoxic stage. The possible reason might lay in the resulting increased concentration of VFAs in the effluent from anaerobic reactors entering the anoxic reactor. This increased concentration of VFAs forces the bacterial consortium in anoxic reactor to metabolize more substrate spending more oxygen for it and thus increasing the efficiency of this stage. Thus the performances of the anaerobic stage and the anoxic stage counterbalance each other guaranteeing the relative stability of the whole system.

At (present) moment COD removal efficiency is about 80% and sulphate removal is up 100% correspondingly.
It was concluded that the success of this type of purification process, based on the recirculation system with the use of returned sludge depends most critically on avoiding the loss of sludge from the anaerobic reactors.
The main results of treatment wastewater from yeast industry are given at Table 2.
Table 2. The main results of the treatment process.
Years Removal,% 1993* 2000** 2003*** COD 30 80 85 BOD7 45 90 98 Sulphate 15 100 100 N tot 10 65 75 P tot 5 50 60
WWTP status: * Initial process design. Anaerobic/aerobic stages only ** After introducing of modified anaerobic/anoxic reactors system. *** Raw wastewater volume increased up to 350 m3 d-1. Expanding of aerobic stage
5. Conclusions
During the anaerobic digestion processes two
important goals are achieved simultaneously: removal of organic matter and of sulphates (yeast industry wastewater).
The UASB reactor is often not applicable for the anaerobic mesophilic treatment of high sulphate containing wastewaters. Loss of methanogenesis on the second stages of the digestion processes (UASB) can result in the formation of high concentrations of VFAs and sulphides with a significant risk of creating odour problems.
The results of the study carried out demonstrated that the anaerobic sequencing batch reactor (ASBR) is a suitable and effective method for anaerobic treatment of sulphate rich wastewaters from baker’s yeast production plant. For successful application of this technology it is necessary to find a way to remove the inorganic precipitate sediments from the reactor.
During ozonation, the biodegradability of the wastewater increased, therefore, the ozonation can be used in the post- treatment of yeast wastewater for the reduction of colour, odour, and the overall concentration of contaminants.
The main results from lab-scale experiments
were adopted at Salutaguse wastewater treatment plant and results of this-high effisiency of treatment process. References
1. Cämmerer,B., Kroh,L.W., Investigations of the influence
of reaction conditions on the elementary composition of melanoidins. Food Chem. Vol 53, (1), 1995, p. 55-59.
2. Standard Methods for the Examination of Water and Wastewater. 19th American Public Health Association, American Water Works Association, Water Environmental Federation, Washington DC, USA, 1995.
3. Cohen, A., Breure, A.M., Van Andel, I.G., Van Deurse, A. Influence of phase separation on the anaerobic digestion of glucose: maximum COD-turnover rate during continuous operation. Wat. Res.1980, p.1439-1448.
4. Lettnga, G., Hulshoff Pol, L. W., Grin, P., Roesma, R., Sayed, S., van Velsen, A.F.M., Upflow sludge blanket processes. In. Proc. Int. Symp. Anaerobic Digestion. Boston, Massachusetts, 1993, p. 139-158.
5. Lens P.N.L., Omil F., lema J.M., Hulshoff-Pol L.W. Biological treatment of organic Sulphate-rich wastewaters. Environmental Technologies to Treat Sulphur Pollution. Ed. Lens P., Hulshoff-Pol L. London: IWA Publishing. Alliance. 2000, p.467-789.
6. Novals, R.F.V. The microbiologe of anaerobic digestion. Water Science and Technology, Vol 18, (12), 1987, p.1-14.
7. Koster, I.W., Renzema, A., De Vegt, A. L. and Lettinga, G. Sulphide inhibition of tye methanogenic activity of granular sludge at varieus pH –levels. Water Research. Vol 20 (12), 1986, p.1561-1567.
8. Stuetz, R., Frechen, F-B. Odours in Wastewater treatment. Measurement, modelling and Control. London: IWA Publishing. Alliance .2001, p. 33-92.
9. Blonskaja, V., Menert, A., Kurissoo, T. and Vilu, R. Biological oxidation in anaerobic digestion of Sulphate rich wastewater. 9th World Congress Anaerobic Digestion 2001. Anaerobic Conversion for Sustainability. Antwerpen, Belgium, 2-6 September 2001. Conference proceedings, part 1, p. 713-718.
10. Weijma. I., Stams. A.I.M. Hulshof Pol, L.W. and Lettinga, G. Thermophilic sulphate reduction and methanogenesis with methane in high rate anaerobic reactor. Biotech. Bioeng, Vol 67, 2000, p.354-363.
11. M. Krapivina, V. Blonskaja, T. Kurissoo, R. Vilu. Biodegradation of organic substrate in sulphate containing yeast wastewater. Environmental Impact and Water Management in a Catchments Area Perspective. Proceeding of Symposium dedicated to the 40t h
Anniversary of Institute of Environmental Engineering at Tallinn Technical University. Tallinn, Estonia, 24-26 September 2001. p. 232-241.
12. Langerak, van E.P.A., Gonzales, Gil, G., Aeslt, van A., van Lier, I.B., Hamelers H.V.M. and Lettinga G. Effect of high-calcium concentrations on the development of methanogenic sludge in UASB reactors. Wat. Res. Vol 32,1998, p.1255-1263.

Combined biological treatment of high-sulphate wastewater fromyeast production
S. Zub1, T. Kurissoo2, A. Menert3 & V. Blonskaja4
1Salutaguse Yeast Factory, Kohila, Raplamaa, Estonia; 2BimKemi Eesti AS, Tallinn, Estonia; 3Department of Chemistry, Tallinn University of Technology,
Tallinn, Estonia; and 4Department of Environmental Engineering, Tallinn University of Technology, Tallinn, Estonia
Keywords
anaerobic; anoxic; baker’s yeast; betaine
(trimethylglycine); sludge; sulphate-rich
wastewater.
Correspondence
S. Zub, Salutaguse Yeast Factory, Kohila 79702
Raplamaa, Estonia. Email: [email protected]
doi:10.1111/j.1747-6593.2007.00097.x
Abstract
The wastewater from baker’s yeast production contains above-average con-
centrations of organic pollutants (25 000 mg/L total chemical oxygen demand,
TCOD), nutrients (1500 mg/L Ntot, 100 mg/L Ptot) and sulphate (2900 mg/L
SO42� ). Baker’s yeast wastewater with a flow rate of 190 m3/day was treated in
a mesophilic anaerobic/anoxic continuous stirred tank reactor (CSTR) system.
At the expense of the reduction of trimethylglycine (or betaine component of
sugar-beet molasses) to other nitrogen-containing compounds, it was possible
to re-oxidize the sulphides to elemental sulphur, remove them from the
wastewater and increase biogas production. Therefore, the average removal
efficiency in the anaerobic/anoxic system was 79% by TCOD, 100% by SO42�
in which the concentration of sulphides in the effluent did not exceed 50 mg/L.
The application of this combined anaerobic/anoxic system to a full-scale
treatment plant supported biogas production up to 1300 m3/day, and the
purification of wastewater was feasible without the use of granular sludge.
List of symbols
BOD biological oxygen demand (mg/L)
COD chemical oxygen demand (mg/L)
DS dry solids (%)
HELCOM Helsinki Commission or Baltic Marine Environment Protection
Commission
Ntot total concentration of nitrogen (mg/L)
Ptot total concentration of phosphorus (mg/L)
SBR sequenced batch reactor
SCOD solubilized chemical oxygen demand (mg/L)
SRB sulphate-reducing bacteria
SS suspended solids (mg/L)
t time (h)
TCOD total chemical oxygen demand (mg/L)
TKN total Kjeldahl nitrogen (mg/L)
UASB up-flow anaerobic sludge blanket reactor
VFAs concentration of volatile fatty acids (meq/dm3)
VSS volatile suspended solids (mg/L)
WWTP wastewater treatment plant
Introduction
Sources of sulphate and sulphide pollution
Many industrial processes, including the food and fer-
mentation industries, generate wastewaters containing
high levels of organic matter and sulphate. Yeast industry
wastewater contains low levels of readily degradable
sugars and acids and high levels of trimethylglycine and
sulphate. Sulphate-reducing bacteria (SRB) compete with
methane-producing micro-organisms for the available
organic carbon, resulting in the formation of hydrogen
sulphide. When treating high-sulphate wastewater, high
concentrations of sulphur compounds hinder wastewater
treatment and the production of methane gas. This phe-
nomenon results from the microbiological reduction of
sulphates into sulphides. The stability of the treatment
process is dependent on the pH value as well as the
concentration of the sulphides formed. Sulphides formed
during the treatment process inhibit the growth of metha-
nogens as well as the SRB in the pH range of 7.2–8.5
(O’Flaherty et al. 1998).
1
2
3
4
5
6
7
8
9
10
11
12
13
14
15
16
17
18
19
20
21
22
23
24
25
26
27
28
29
30
31
32
33
34
35
36
37
38
39
40
41
42
43
44
45
46
47
48
49
50
51
52
53
W E J 9 7 B Dispatch: 14.11.07 Journal: WEJ CE: Nidhi
Journal Name Manuscript No. Author Received: No. of pages: 13 Op: Deepa/Vinod
Water and Environment Journal (2007) c� 2007 The Authors. Journal compilation c� 2007 CIWEM. 1
Water and Environment Journal. Print ISSN 1747-6585
WEJ 97(BW
UK
WE
J 97
.PD
F 14
-Nov
-07
21:5
4 38
8798
Byt
es 1
3 PA
GE
S n
oper
ator
=K
.Vin
odK
umar
)

Strategies to avoid high sulphide concentrationsin wastewater
The dilution of wastewater is an efficient method for the
reduction of pollutant concentrations but it is not consis-
tent with environmental protection strategies of the
HELCOM (Helsinki Commission or Baltic Marine Environ-
ment Protection Commission) (Versprille 2000). The HEL-
COM convention contracted in 1974 for protection of the
marine environment of the Baltic Sea Area includes tasks
that cannot effectively be accomplished by national
efforts alone but by close regional co-operation. One of
its main tasks is to restrict pollution from land-based
sources to the sea by point or diffuse inputs from all
sources on land reaching the sea waterborne, airborne or
directly from the coast (http://www.helcom.fi/stc/files/
Convention/Conv0704.pdf).
Fox & Venkatasubbiah (1996) and Janssen et al. (1997)
found that it is also possible to remove the hydrogen
sulphide produced in the anaerobic reactor from sulphate
by partly oxidizing it into elemental sulphur. This process
can be performed in an anoxic reactor where the concen-
tration of oxygen is below 0.1 mg O2/L. The elemental
sulphur formed can be removed in the sedimentation
tank. The wastewater circulates from the anaerobic
reactor to the subsequent aerobic reactor and from that
point back to the anaerobic reactor. This method enabled
95% removal of the sulphate, and the residual con-
centration of sulphides in the outlet of the treatment
system was below 20 mg/L, while also facili-
tating stable pH conditions. In the Chinese patent
N11144782, 1997, the removal of sulphides from an
anaerobic reactor has been solved by feeding the reactor
with a controlled concentration of O2 or air (Shan &
Xiong 1998). A similar method has also been used in
the Netherlands (Lens et al. 2000) and United States
(Zitomer & Shrout 2000) without observing any
inhibiting effect on the methanogens. Industrial (Buis-
man 1996) as well as laboratory experiments have shown
that sulphide-containing wastewater leaving anaerobic
reactors does not inhibit the processes in the aerobic
reactor.
Biological methods for the removal of sulphur-containing compounds from wastewater
In the case of biological treatment, sulphate, sulphite and
other sulphur compounds are reduced in an anaerobic
step to sulphide, which in turn can be oxidized to
elemental sulphur by way of limited oxidation (Buisman
1996; Lens et al. 1998). For reducing sulphur compounds
to sulphide, an electron donor is necessary, as follows
from the reaction:
SO2�4 þ 5H2Oþ 8e! HS� þ 9HO�: ð1Þ
Biotechnological processes for sulphide removal consist
in the conversion of sulphide into elemental sulphur by
colourless sulphur bacteria (Thiobacilli), (Buisman et al.
1990; Janssen et al. 1997) according to the following
reaction:
2HS� þO2 ! 2S0 þ 2OH�; ð2Þor by genera of anaerobic photosynthetic bacteria from
the families Chlorobiaceae and Chromaticeae that catalyse
the photosynthetic van Niel reaction (Henshaw et al.
1998):
2n H2Sþ n CO2 �!hn
2n S0 þ ðCH2OÞnþ n H2O: ð3Þ
In the latter case, light radiated to a photosynthetic
reactor is coupled to the conversion of sulphide to ele-
mental sulphur using the reverse citric acid cycle (Arnon
cycle). The advantage of such a method is that only small
waste streams remain because the sulphur, that is, formed
can be reused. However, the disadvantage is that, espe-
cially when the effluent contains little organic matter,
electron donors (methanol, ethanol, glucose and other
saccharides, organic acids, H2 and CO) have to be added in
order to provide sufficient reducing equivalents for the
SRB. This, as a result, increases the costs of this method
substantially (Buisman 1996). Organic compounds that
have more than two carbon atoms that degrade under
anaerobic conditions give H2 and acetate. H2 can be used
as an electron donor for the reduction of sulphate and
sulphite.
Role of trimethylglycine in anaerobic processes
Anaerobic granular sludge bed technology with upward-
flow anaerobic sludge blanket (UASB) reactors is used for
high-rate anaerobic treatment of wastewater. However, the
UASB reactor is often inapplicable for the treatment of high
sulphate-containing wastewaters (Blonskaja et al. 2001).
The instability and increased washout of sludge granules
observed can be explained by the fact that under stress
conditions, all energy gained by bacteria from dissimilation
is used for the generation of metabolic products, and not for
the growth of cells (Weijma et al. 2000).
Sugar-beet molasses used as a growth medium for yeast
contains large amounts [up to 6% dry solids (DS)] of betaine
also known as N,N,N-trimethyl glycine, a soluble nitrogen-
ous compound. Molasses is used as a substrate in a wide
range of industrial fermentations, for example, alcohol, acid
and yeast cell production. Trimethylglycine is not signifi-
cantly consumed during these fermentations, passes the
1
2
3
4
5
6
7
8
9
10
11
12
13
14
15
16
17
18
19
20
21
22
23
24
25
26
27
28
29
30
31
32
33
34
35
36
37
38
39
40
41
42
43
44
45
46
47
48
49
50
51
52
53
Water and Environment Journal (2007) c� 2007 The Authors. Journal compilation c� 2007 CIWEM.2
Treatment of high-sulphate wastewater from yeastQ1
production S. Zub et al.
WEJ 97(BW
UK
WE
J 97
.PD
F 14
-Nov
-07
21:5
4 38
8798
Byt
es 1
3 PA
GE
S n
oper
ator
=K
.Vin
odK
umar
)

subsequent processing stages and becomes a significant
constituent of wastewater (Thalasso et al. 1999).
Trimethylglycine is a compatible solute, which is able to
restore and maintain the osmotic balance of living cells. It is
synthesized and accumulated in response to abiotic stress.
Trimethylglycine also acts as a methyl group donor and has
a number of important applications including its use as a
feed additive (Nyyssola et al. 2000). In anaerobic treatment
plants, trimethylglycine can be nearly entirely degraded by
a multistep process with the nitrogen-containing inter-
mediates trimethylamine and other methylated amines,
which are further degraded by methanogens, yielding
CO2, ammonium and methane (Thalasso et al. 1999). The
ammonium formed buffers the treatment system and
enables its stable functionQ2 . The cleavage of trimethylglycine
into trimethylamine and acetate is characteristic of some
halophilic fermentative bacteria (Moune et al. 1999).
2:5 trimethylglycineþ 4:04 H2 !þ 2-propanol2:5 trimethylamine
þ 0:95 acetateþ 0:1 CO2 þ 1:9 H2O;
ð4Þ
trimethylglycineþ 1:32 serineþ H2O!trimethylamineþ 2 acetateþ 1:32 CO2 þ 1:32 NH3:
ð5Þ
A similar cleavage mechanism for trimethylglycine
under anaerobic conditions has also been reported for
Clostridium sporogenes (Naumann et al. 1983; von Zum-
busch et al. 1994) while the fermentation products of
Eubacterium limosum are N,N-dimethylglycine, acetic acid
and butyric acid (Muller et al. 1981; von Zumbusch et al.
1994). The acetate and trimethylamine can be readily
used as carbon and energy sources by acetotrophic
(e.g. Methanobacterium soehngenii) and methylotrophic
methanogens (e.g. Methanosarcina barkeri), respectively
(Tchobanoglous & Burton 1991):
CH3COOH! CH4 þ CO2; ð6Þ
4ðCH3Þ3Nþ 12 H2O! 9 CH4 þ 3 CO2 þ 6 H2O
þ 4 NH3: ð7Þ
Because trimethylglycine is undetected by a chemical
oxygen demand (COD) dichromate assay, its concentra-
tion can be underestimated, which in turn leads to the
significant overloading of wastewater treatment plants
(WWTPs). Furthermore, trimethylglycine is a nitrogen-
ous compound, in which its complete anaerobic degrada-
tion can result in the increase of effluent ammonia
concentration. This will raise the risk of the ammonia
inhibition of the anaerobic stage by free ammonia
(Thalasso et al. 1999).
Thalasso et al. suggest that trimethylglycine degrada-
tion does not appear to be coupled to sulphate reduction
during the treatment of high-sulphate wastewaters
(Thalasso et al. 1999).
The wastewater treatment plant (including a biological
purification facility) for the treatment of the separation of
residues of baker’s yeast at Salutaguse Yeast Factory has
been in operation since 1991, but has never performed
satisfactorily. Thus, the aim of this work was to achieve
the optimal set-up and operational parameters for remov-
ing sulphate and avoiding the inhibitory effects of sul-
phides in the anaerobic treatment of yeast industry
wastewaters.
Materials and methods
Experimental set-up
The original treatment facility of OY Tampella Ab (Fin-
land) consisted of an anaerobic pretreatment stage (mix-
ing tank of 180 m3 with a stirrer and two UASB reactors
each of 180 m3 volume), followed by an aerobic stage
(activated sludge with a 360 m3 aeration tank) and a
secondary sedimentation tank (45 m3) for final treatment
before discharge Fig. 1(a). The biological treatment of
wastewater was intended to be performed first in the
anaerobic stage with granules forming methanogens,
followed by an aerobic treatment with activated sludge.
After the initial start-up of the plant in 1991, increased
disintegration of sludge granules accompanied by their
flow-out was observed at the plant. Instability of the
anaerobic stage resulted in noncompliance of the whole
process with the requirements of environmental inspec-
tion. The average concentrations of pollutants as well as
environmental standards are shown in Table 1.
The new technological scheme (Fig. 1b) differed from
the originally designed set-up in the following:
� The two parallel reactors of the anaerobic digestion unit
were inoculated with anaerobic sludge, brought from the
Tallinn Municipal WWTP.
� The aerobic stage was replaced by the anoxic stage. The
concentration of oxygen was kept at a level of 0.1 mg/L
with an on-line oxygen analyser Marvet OxyMat Q399-1.
� The temperature was automatically controlled at
+35� 2 1C with contact steam injection to the incoming
streams of the mixing tank and both anaerobic reactors.
Temperature-monitoring electrodes were installed di-
rectly into the reactor wall (PT-100) and connected with
the controller, which regulated steam injection pneu-
matic valves.
1
2
3
4
5
6
7
8
9
10
11
12
13
14
15
16
17
18
19
20
21
22
23
24
25
26
27
28
29
30
31
32
33
34
35
36
37
38
39
40
41
42
43
44
45
46
47
48
49
50
51
52
53
Water and Environment Journal (2007) c� 2007 The Authors. Journal compilation c� 2007 CIWEM. 3
Treatment of high-sulphate wastewater from yeastQ1
productionS. Zub et al.
WEJ 97(BW
UK
WE
J 97
.PD
F 14
-Nov
-07
21:5
4 38
8798
Byt
es 1
3 PA
GE
S n
oper
ator
=K
.Vin
odK
umar
)
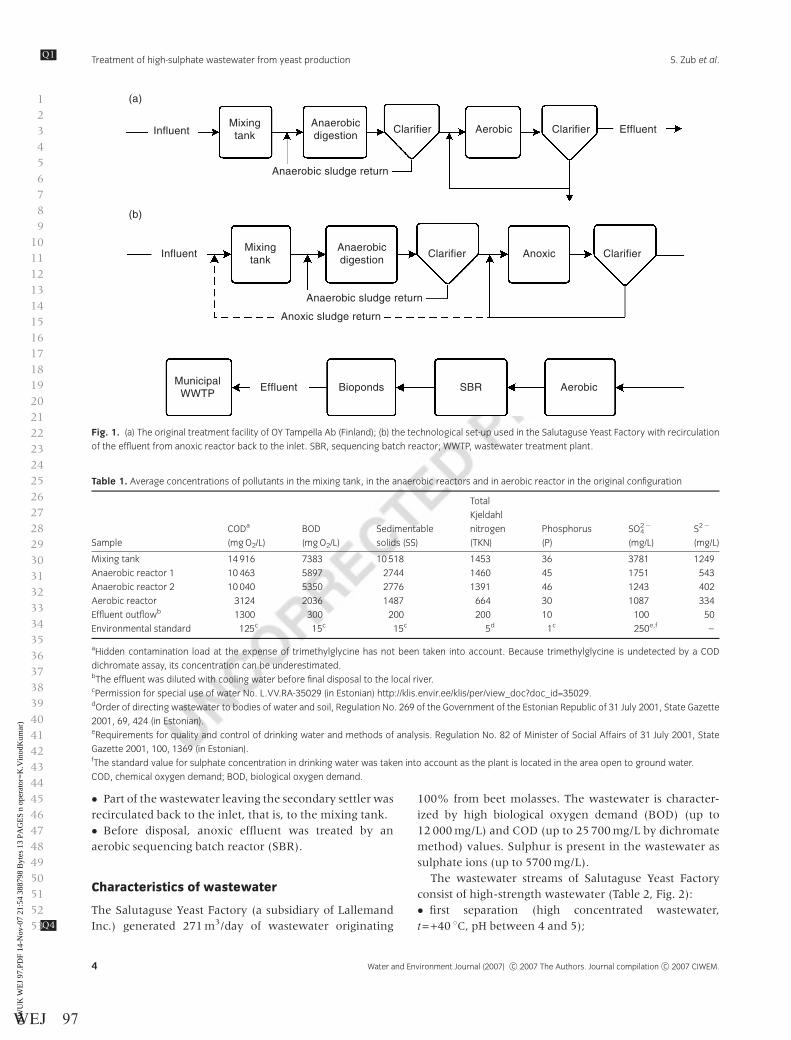
� Part of the wastewater leaving the secondary settler was
recirculated back to the inlet, that is, to the mixing tank.
� Before disposal, anoxic effluent was treated by an
aerobic sequencing batch reactor (SBR).
Characteristics of wastewater
The Salutaguse Yeast Factory (a subsidiary of Lallemand
Inc.) generatedQ4 271 m3/day of wastewater originating
100% from beet molasses. The wastewater is character-
ized by high biological oxygen demand (BOD) (up to
12 000 mg/L) and COD (up to 25 700 mg/L by dichromate
method) values. Sulphur is present in the wastewater as
sulphate ions (up to 5700 mg/L).
The wastewater streams of Salutaguse Yeast Factory
consist of high-strength wastewater (Table 2, Fig. 2):
� first separation (high concentrated wastewater,
t=+40 1C, pH between 4 and 5);
1
2
3
4
5
6
7
8
9
10
11
12
13
14
15
16
17
18
19
20
21
22
23
24
25
26
27
28
29
30
31
32
33
34
35
36
37
38
39
40
41
42
43
44
45
46
47
48
49
50
51
52
53
Table 1. Average concentrations of pollutants in the mixing tank, in the anaerobic reactors and in aerobic reactor in the original configuration
Sample
CODa
(mg O2/L)
BOD
(mg O2/L)
Sedimentable
solids (SS)
Total
Kjeldahl
nitrogen
(TKN)
Phosphorus
(P)
SO42�
(mg/L)
S2�
(mg/L)
Mixing tank 14 916 7383 10 518 1453 36 3781 1249
Anaerobic reactor 1 10 463 5897 2744 1460 45 1751 543
Anaerobic reactor 2 10 040 5350 2776 1391 46 1243 402
Aerobic reactor 3124 2036 1487 664 30 1087 334
Effluent outflowb 1300 300 200 200 10 100 50
Environmental standard 125c 15c 15c 5d 1c 250e,f –
aHidden contamination load at the expense of trimethylglycine has not been taken into account. Because trimethylglycine is undetected by a COD
dichromate assay, its concentration can be underestimated.bThe effluent was diluted with cooling water before final disposal to the local river.cPermission for special use of water No. L.VV.RA-35029 (in Estonian) http://klis.envir.ee/klis/per/view_doc?doc_id=35029.dOrder of directing wastewater to bodies of water and soil, Regulation No. 269 of the Government of the Estonian Republic of 31 July 2001, State Gazette
2001, 69, 424 (in Estonian).eRequirements for quality and control of drinking water and methods of analysis. Regulation No. 82 of Minister of Social Affairs of 31 July 2001, State
Gazette 2001, 100, 1369 (in Estonian).fThe standard value for sulphate concentration in drinking water was taken into account as the plant is located in the area open to ground water.
COD, chemical oxygen demand; BOD, biological oxygen demand.
Influent
Influent
Effluent Bioponds SBRMunicipal
WWTP
Mixingtank
Mixingtank
Anaerobicdigestion
Anaerobicdigestion
Clarifier
Clarifier
Anaerobic sludge return
Anaerobic sludge return
Anoxic sludge return
Clarifier
Clarifier
Aerobic
Aerobic
Anoxic
Effluent
(a)
(b)
Fig. 1. (a) The original treatment facility of OY Tampella Ab (Finland); (b) the technological set-up used in the Salutaguse Yeast Factory with recirculation
of the effluent from anoxic reactor back to the inlet. SBR, sequencing batch reactor; WWTP, wastewater treatment plant.
Water and Environment Journal (2007) c� 2007 The Authors. Journal compilation c� 2007 CIWEM.4
Treatment of high-sulphate wastewater from yeastQ1
production S. Zub et al.
WEJ 97(BW
UK
WE
J 97
.PD
F 14
-Nov
-07
21:5
4 38
8798
Byt
es 1
3 PA
GE
S n
oper
ator
=K
.Vin
odK
umar
)

� molasses clarification/cleaning (limited amounts, de-
pends on the type/quality of molasses; this stream is
included in the high concentrated wastewater);
� yeast wash water (t=+14 1C, pH between 6 and 10);
� 20% of floor and equipment wash water;
and low-strength wastewater
� 80% of floor and equipment wash water;
� cooling water (t=+28 to +30 1C, pH 7); and
� municipal wastewater (limited amount, directly to the
anoxic stage).
High-strength wastewater was pumped into a mixing
tank and low-strength wastewater was sent directly to an
anoxic reactor (Fig. 2). The next stage was SBR, which
was also used as a bypass. The anaerobic reactors were fed
with a mixture of high-strength wastewater and recycled
anoxic sludge. The temperature of wastewater from the
incoming yeast production was +28C+33 1C. The flow
rate of the incoming wastewater was measured by flow
meters Q5(MAG-XM, Baily Fisher Porter). Reactor feed and
internal recycling flow rate measurements were con-
ducted using Danfoss MAG1000/1100 electromagnetic
flow Q6metres.
Chemical analyses
The volatile suspended solids (VSS) content of anaerobic
sludge samples and settled sludge volume were analysed,
as described in Standard Methods for the Examination of
Water and Wastewater, 1989. Influent and effluent liquid
samples were sampled and analysed 3 days/week. Ana-
lyses of COD, total nitrogen, sulphates and dissolved
sulphides were conducted using HACH reagents and
equipment according to the standard methods: COD –
Reactor Digestion Method, US EPA approved for reporting
wastewater analysis; sulphate – SulfaVer 4 Method, US
EPA approved for reporting wastewater analysis; and
sulphide – Methylene Blue Method, US EPA accepted for
reporting wastewater analysis, total nitrogen by the
Persulfate Digestion Method (American Public Health
Association 1995).
Results and discussion
Change of process parameters during thetreatment process
In the modified anaerobic/anoxic reactor system, a stable,
buffered system was observed with a pH between 7.2 and
7.5, self-regulated by the biological process (without
neutralization) and with good purification efficiency.
Recirculation of a residual sludge from the anoxic stage
back to the anaerobic stage guaranteed rapid changes in
1
2
3
4
5
6
7
8
9
10
11
12
13
14
15
16
17
18
19
20
21
22
23
24
25
26
27
28
29
30
31
32
33
34
35
36
37
38
39
40
41
42
43
44
45
46
47
48
49
50
51
52
53 Tab
le2
Ave
rag
ew
ast
ew
ate
rch
ara
cte
rist
ics
of
Sa
luta
gu
seYe
ast
Pla
nt,
Est
on
ia
Wa
ste
stre
am
Flo
w
(m3/d
ay
)
CO
De
xclu
din
gb
eta
ine
CO
Din
clu
din
gb
eta
ine
(+2
0%
)B
OD
Se
dim
en
tab
leso
lids
(SS
)To
talK
jeld
ah
ln
itro
ge
n(T
KN
)P
ho
sph
oru
s(P
)S
O42�
Co
nce
ntr
ati
on
(mg
/L)
Loa
din
g
(kg
/da
y)
Co
nce
ntr
ati
on
(mg
/L)
Loa
din
g
(kg
/da
y)
Co
nce
ntr
ati
on
(mg
/L)
Loa
din
g
(kg
/da
y)
Co
nce
ntr
ati
on
(mg
/L)
Loa
din
g
(kg
/da
y)
Co
nce
ntr
ati
on
(mg
/L)
Loa
din
g
(kg
/da
y)
Co
nce
ntr
ati
on
(mg
/L)
Loa
din
g
(kg
/da
y)
Co
nce
ntr
ati
on
(mg
/L)
Loa
din
g
(kg
/da
y)
Hig
h
stre
ng
th
wa
ste
wa
ter
in
the
ho
ldin
g
tan
k
19
02
00
00
14
00
24
00
01
68
08
00
05
60
50
03
52
00
01
40
30
2.1
40
00
28
0
Wa
shw
ate
r1
00
30
00
30
02
00
02
00
50
05
01
00
10
20
24
00
40
Co
olin
g
wa
ter
80
0
Mu
nic
ipa
l
wa
ter
No
da
ta,
limit
ed
am
ou
nt
CO
D,
che
mic
al
ox
yge
nd
em
an
d;
BO
D,
bio
log
ica
lox
yge
nd
em
an
d.
Water and Environment Journal (2007) c� 2007 The Authors. Journal compilation c� 2007 CIWEM. 5
Treatment of high-sulphate wastewater from yeastQ1
productionS. Zub et al.
WEJ 97(BW
UK
WE
J 97
.PD
F 14
-Nov
-07
21:5
4 38
8798
Byt
es 1
3 PA
GE
S n
oper
ator
=K
.Vin
odK
umar
)

the sulphate and sulphide contents. Initially, the concen-
tration of sulphates in the outlet of anaerobic reactors
increased but the concentration of sulphides did not
change much (Fig. 3). Despite the origin of the inocula-
tion sludge (residual sludge from the municipal WWTP),
after a slight initial increase, the concentration of sul-
phates started to decrease constantly, reaching zero in 35
days (acclimatization effect). The concentration of sul-
phides in the anaerobic reactor 1 increased to some extent
on account of increasing feed, while there was no evident
1
2
3
4
5
6
7
8
9
10
11
12
13
14
15
16
17
18
19
20
21
22
23
24
25
26
27
28
29
30
31
32
33
34
35
36
37
38
39
40
41
42
43
44
45
46
47
48
49
50
51
52
53
0
500
1000
1500
2000
2500
3000
0 20 40 60 80 100 120 140 160 180
Time (day)
Con
cent
ratio
n (m
g/L
)
0
10
20
30
40
50
60
70
80
90
100
Fee
d (m
3/d
ay)
Additionalinoculation withanaerobic sludge
Wash waters toanaerobic reactors
From anoxicreactor backto anaerobicreactors
Fig. 3. Hydraulic loading rate (feed, m3/day) and the content of sulphates and sulphides (mg/L) in the effluent from anaerobic reactor 2: ~, sulphates
inlet; �, sulphates outlet; �, sulphides; � , feed.
(50–100 m3
Finaleffluent
(53 m3/day)
First separation(70 m3/day)
Yeast wash water(100 m3/day)
Equipmentwash water
(100 m3/day)
Cooling water(800 m3/day)
Molassesclarification /
cleaning (3 m3/day)
Plant staffmunicipal
wastewater(3 m3/day)
Holding tank(190 m3/day)
Anaerobicstage
(137 m3/day)
Anoxic stage SBR
(20 m3/day)
(80 m3/day)
Fig. 2. Scheme of wastewater streams at Salutaguse Yeast Factory. SBR, sequencing batch reactor.
Water and Environment Journal (2007) c� 2007 The Authors. Journal compilation c� 2007 CIWEM.6
Treatment of high-sulphate wastewater from yeastQ1
production S. Zub et al.
WEJ 97(BW
UK
WE
J 97
.PD
F 14
-Nov
-07
21:5
4 38
8798
Byt
es 1
3 PA
GE
S n
oper
ator
=K
.Vin
odK
umar
)

correlation between the concentration of sulphides and
the hydraulic loading rate in reactor 2. In the anoxic tank,
the concentration of sulphates also remained close to zero
while the concentration of sulphides did not exceed
50 mg/L in most of the cases (Fig. 4). The anoxic reactor
as well as anaerobic reactors recovered from fluctuations
of sulphate concentration (due to various reasons) in a
very short time (Figs 3 and 4).
Simultaneous with the decline in the concentration of
sulphates, the COD value of wastewater in the mixing
tank (inlet) also decreased, caused by the dilution effect
resulting from recirculation from the sedimentation tank
(Fig. 5).
On the 51st day of the experiments, reactor 2 was
supplemented with an additional amount (50 m3) of
residual sludge, collected from the anoxic reactor. Thus,
its transportation from the Tallinn Municipal WWTP as
well as the possible contamination of the reactor with fine
particles of sand was avoided. This supplementary inocu-
lation of reactor 2 reduced its effluent contamination
1
2
3
4
5
6
7
8
9
10
11
12
13
14
15
16
17
18
19
20
21
22
23
24
25
26
27
28
29
30
31
32
33
34
35
36
37
38
39
40
41
42
43
44
45
46
47
48
49
50
51
52
53
0
100
200
300
400
500
600
700
0 50 100 150 200 250 300 350 400 450
Time (day)
Con
cent
ratio
n (m
g/L)
Additionalinoculation withanaerobic sludge
Wash waters toanaerobic reactors
From anoxicreactor backto anaerobicreactors
Fig. 4. Influence of recirculation on the concentration of sulphates and sulphides in anoxic reactor: �, sulphates (mg/L); �, sulphides (mg/L).
0
5000
10 000
15 000
0 20 40 60 80 100 120 140 160 180
Time (day)
Con
cent
ratio
n of
TC
OD
(m
g/L
)
Fromanoxicreactorback toanaerobicreactors
Wash watersto anaerobicreactors
Additionalinoculation withanaerobic sludge
Fig. 5. Concentration of total chemical oxygen demand (TCOD, mg/L) in anaerobic reactors: m, TCOD of the inflow to the mixing tank;~, TCOD of reactor
1; �, TCOD of reactor 2.
Water and Environment Journal (2007) c� 2007 The Authors. Journal compilation c� 2007 CIWEM. 7
Treatment of high-sulphate wastewater from yeastQ1
productionS. Zub et al.
WEJ 97(BW
UK
WE
J 97
.PD
F 14
-Nov
-07
21:5
4 38
8798
Byt
es 1
3 PA
GE
S n
oper
ator
=K
.Vin
odK
umar
)

(expressed as COD), in spite of the increasing contamina-
tion of the influent from the mixing tank (Fig. 5).
Simultaneously, there was a sharp decrease in the volatile
fatty acids (VFAs) content in the effluent from reactor 2
(Fig. 6).
Because of the use of a combined anaerobic/aerobic
reactor system, the biological purification process had
already started in the mixing tank. This phenomenon is
illustrated with the data for chemical analyses presented
in Table 3. These data demonstrate that the super-
natant COD (SCOD) of the sample from the mixing tank
was decreased up to 40% and the sulphide content up
to 31% compared with the corresponding values in
the holding tank. In the mixing tank, the concentration
of sulphides that originated from sulphates was 36.2
mg/L. These results confirm that the elaboration of
the modified technological set-up of wastewater treat-
ment also converted the mixing tank into a biological
reactor.
The removal of sulphates from wastewater is not as
complicated as guaranteeing the stability of this system.
The purification scheme under study can be distinguished
from other similar ones by returning anoxic residual
sludge back to the mixing tank. The above-mentioned
technology enables the ability to work at a high loading
rate without using granular sludge. As a result
1
2
3
4
5
6
7
8
9
10
11
12
13
14
15
16
17
18
19
20
21
22
23
24
25
26
27
28
29
30
31
32
33
34
35
36
37
38
39
40
41
42
43
44
45
46
47
48
49
50
51
52
53
0
20
40
60
80
0 20 40 60 80 100 120 140 160
Time (day)
Vol
atile
fatty
aci
ds (
mE
q/L
)
From anoxicreactor backto anaerobicreactors
Additionalinoculationwith anaerobicsludge
Wash waters toanaerobicreactors
Fig. 6. Concentration of volatile fatty acids (mg/L): }, in the mixing tank;, in the effluent from anaerobic reactor 1; �, in the effluent from anaerobic
reactor 2.
Table 3 Concentrations of pollutants in the mixing tank, in anaerobic reactors, in the inlet to the anoxic tank and in the effluent from the anoxic tank at
the end of the experiment (day 166)
Sample
Feed
(m3/day)
TCOD
(mg O2/L)
Decrease
of TCOD (%)
SCOD
(mg O2 /L)
Decrease
of SCOD (%) SO42� (mg/L)
Decrease
of SO42� (%)
S2�
(mg/L)
Holding tanka+20% from
betaine
190 19 020 18 260 4200
22 824 21 912
Mixing tank 137 15 540 23.2 12 980 40.8 2900 31 36.2
Anaerobic reactor 1 72 11 380 35.1 8250 36.4 400 86.2 360
Anaerobic reactor 2 65 4850 72.3 4080 68.6 0 100 390
Influent to anoxic reactor 190 12 338 10 634
Effluent from anoxic reactor 190 4890 60.4 4360 59 0 100 37.2
Total treatment efficiency 78.6 80.1
aNot shown in the technological scheme in Fig. 1(b).
TCOD, total chemical oxygen demand; SCOD, supernatant COD.
Water and Environment Journal (2007) c� 2007 The Authors. Journal compilation c� 2007 CIWEM.8
Treatment of high-sulphate wastewater from yeastQ1
production S. Zub et al.
WEJ 97(BW
UK
WE
J 97
.PD
F 14
-Nov
-07
21:5
4 38
8798
Byt
es 1
3 PA
GE
S n
oper
ator
=K
.Vin
odK
umar
)

� better stability as to washout of the sludge was
achieved;
� for controlling pH, there was no need to use chemicals;
and
� anoxic sludge retained metanogenic Q7activity, and for
methane gas production there was no need to re-inocu-
late the reactors.
Estimation of trimethylglycine content inwastewater
The HPLC analyses (data not presented) of molasses,
separation residue, samples from the holding tank, mix-
ing tank, anaerobic reactors and anoxic reactor have
shown that trimethylglycine possibly present in waste-
water is degraded in the mixing tank. Regarding the
literature data, using sugar-beet molasses as a growth
medium, after cultivation of yeasts up to 4.5 g/L tri-
methylglycine could remain in the separation residue
(high-strength wastewater) (Thalasso et al. 1999). How-
ever, this amount might be omitted from the COD
analysis by the bichromate method. The latter is per-
formed as acid hydrolysis at elevated temperatures. De-
pending on the presence of methyl groups linked to
nitrogen atom, gaseous products could be formed that
will not be recorded. Therefore, it would be reasonable to
add to the COD concentration in the holding tank an
additional 20% of a hidden contamination load at the
expense of trimethylglycine (Versprille 2000) (Table 2).
Betaine as some other nitrogen-containing compounds
(e.g. pyridine Thalasso et al. 1999) resists oxidation during
the standard dichromate method for COD determination.
Thus, the treatment efficiency of the entire system ap-
peared to be 79%. During the set-up period, the values of
total COD (TCOD) in the effluent of anaerobic reactor 1
were in the range of 3520–13 520 mg O2/L and in the
range of 3830–16 270 mg O2/L in anaerobic reactor 2.
Anaerobic micro-organisms degrade trimethylglycine
completely into trimethylamine, acetate and other com-
pounds [Eqs (4) and (5)]. Trimethylamine is further
degraded into methane, CO2 and ammonia [Eq. (7)],
while the ratios between trimethylglycine and trimethy-
lamine and trimethylamine and ammonia always remain
equimolar. Assuming that nitrogen compounds produced
during the microbiological degradation of trimethylgly-
cine practically do not volatilize (in an anaerobic reactor),
based on their apparently increased values an approxi-
mate estimation of trimethylglycine content in waste-
water can be given. To prove the above-presented
assumption, a separate experiment on a laboratory SBR
was conducted, using wastewater from the Salutaguse
Yeast Factory. The analysis of Ntot was performed by the
Persulfate Digestion Method that mostly considers the
1
2
3
4
5
6
7
8
9
10
11
12
13
14
15
16
17
18
19
20
21
22
23
24
25
26
27
28
29
30
31
32
33
34
35
36
37
38
39
40
41
42
43
44
45
46
47
48
49
50
51
52
53 Tab
le4
Re
sult
so
fch
em
ica
la
na
lysi
so
nth
ela
bo
rato
ryS
BR
rea
cto
r
Du
rati
on
of
ex
pe
rim
en
t
(da
y)
Flo
w
(mL/
da
y)
CO
Do
f
infl
ue
nt
(mg
/L)
CO
Do
f
effl
ue
nt
(mg
/L)
DC
OD
(mg
/L)
CO
D
rem
ove
d
(g)
Th
eo
reti
calb
iog
as
pro
du
ctio
nfr
om
CO
D[L
/(g
CO
D�d
ay
)]a
Re
alb
iog
as
pro
du
ctio
nb
y
CO
Dre
mo
ved
(L/g
)
Nto
to
f
infl
ue
nt
(mg
/L)
Nto
to
f
effl
ue
nt
(mg
/L)
Be
tain
e
con
cen
tra
tio
n
(g/L
)
Bio
ga
sfr
om
be
tain
e
(L/d
ay
)
Tota
l
the
ore
tica
l
bio
ga
s(L
/da
y)
Re
al
bio
ga
s
pro
du
ctio
n
(L/d
ay
)
22
10
52
36
60
15
84
07
82
00
.82
10
.28
71
.72
92
55
69
04
.52
33
0.2
03
0.4
90
1.4
20
39
17
52
02
80
17
20
03
08
00
.53
90
.18
92
.05
92
50
27
01
.77
00
0.1
32
0.3
21
1.1
10
47
20
02
02
80
13
96
06
32
01
.26
40
.44
20
.73
64
75
87
55
.73
61
0.4
90
0.9
32
0.9
30
68
20
02
05
40
50
30
15
51
03
.10
21
.08
60
.48
43
25
65
04
.26
11
0.3
64
1.4
50
1.5
00
75
20
02
05
40
39
70
16
57
03
.31
41
.16
00
.77
23
45
55
03
.60
56
0.3
08
1.4
68
2.5
60
88
24
52
28
90
36
70
19
22
04
.70
91
.64
80
.65
62
55
69
04
.52
33
0.4
73
2.1
21
3.0
90
10
02
80
22
89
01
10
40
11
85
03
.31
81
.16
10
.45
22
50
27
01
.77
00
0.2
12
1.3
73
1.5
00
Ave
rag
e2
01
21
58
31
01
01
11
48
12
.43
80
.85
30
.71
03
08
57
13
.74
10
.31
21
.16
51
.73
0
aT
he
ore
tica
lb
iog
as
pro
du
ctio
nfr
om
CO
Dw
as
calc
ula
ted
on
the
ass
um
pti
on
tha
to
nth
ed
eg
rad
ati
on
of
carb
on
ace
ou
so
rga
nic
ma
teri
al0
.35
m3
of
me
tha
ne
pe
rkg
of
CO
Dco
nve
rte
dis
pro
du
ced
.
CO
D,
che
mic
al
ox
yge
nd
em
an
d;
SB
R,
seq
ue
nce
db
atc
hre
act
or.
Water and Environment Journal (2007) c� 2007 The Authors. Journal compilation c� 2007 CIWEM. 9
Treatment of high-sulphate wastewater from yeastQ1
productionS. Zub et al.
WEJ 97(BW
UK
WE
J 97
.PD
F 14
-Nov
-07
21:5
4 38
8798
Byt
es 1
3 PA
GE
S n
oper
ator
=K
.Vin
odK
umar
)

nitrogen present as amino groups (in proteins and amino
acids) as well as NH4. The concentrations of NO3� and
NO2� in the influent were practically zero. The concentra-
tion of Ntot in the influent was 250–475 mg/L and
270–875 mg/L in the effluent (average 571 mg/L) (Table
4). Therefore, according to Eqs (4) and (5), from tri-
methylglycine, trimethylamine in a ratio of 1 : 1 (and
further NH4 with the same ratio) could be obtained.
Taking MWNH4¼ 18 and MWtrimethylglycine=118, we ob-
tain 0.571/18=0.032 mol, corresponding to
0.032� 118=3.74 g/L trimethylglycine. This is the con-
centration of trimethylglycine in the industrial waste-
water of Salutaguse Yeast Factory by theoretical
calculations.
From trimethylamine, in turn, we can obtain methane
in a ratio of 4 : 9 [Eq. (7)], e.g. from 1 mol trimethylamine
(trimethylglycine) 2.25 mol methane. Thus, from 1 mol
(118 g) trimethylglycine 9/4� 22.4=50.4 L methane can
be formed and from 3.74 g/L trimethylglycine in the
reactor the formation of 3.74/118� 50.4=1.60 L methane
is possible. The degradation of carbonaceous organic
material by anaerobic bacteria leads to the production of
methane at the theoretical stoichiometric conversion rate
of 0.35 m3 of methane per kg of COD converted (Sax &
Lusk 1995). Adding 1.60–0.35 L methane produced from
the rest of COD, we obtained 1.95 L, which was almost the
same amount of methane (per g COD removed) as ob-
served in our experiments (Table 4).
1
2
3
4
5
6
7
8
9
10
11
12
13
14
15
16
17
18
19
20
21
22
23
24
25
26
27
28
29
30
31
32
33
34
35
36
37
38
39
40
41
42
43
44
45
46
47
48
49
50
51
52
53
–60
–40
–20
0
20
40
60
80
100
0 20 40 60 80 100 120 140 160 180 200 220 240 260 280 300 320 340 360 380 400
Time (day)
Time (day)
Effi
cien
cy (
%)
Wash waters toanaerobic reactors
–60
–40
–20
0
20
40
60
80
100(b)
(a)
0 20 40 60 80 100 120 140 160 180 200 220 240 260 280 300 320 340 360 380 400 420 440
Effi
cien
cy (
%)
Wash waters toanaerobic reactors
Fig. 7. The treatment efficiency: (a) by the total chemical oxygen demand (TCOD, %) value, (b) by the supernatant CODQ16 value (SCOD, %). ~, anaerobic
reactor 1; n, anaerobic reactor 2; �, anoxic reactor; ’, sequenced batch reactor (SBR); � , the whole system.
Water and Environment Journal (2007) c� 2007 The Authors. Journal compilation c� 2007 CIWEM.10
Treatment of high-sulphate wastewater from yeastQ1
production S. Zub et al.
WEJ 97(BW
UK
WE
J 97
.PD
F 14
-Nov
-07
21:5
4 38
8798
Byt
es 1
3 PA
GE
S n
oper
ator
=K
.Vin
odK
umar
)

Decrease of sulphide concentration at theexpense of trimethylglycine
In redox reactions, the nitrogen (oxidation state +5)
contained in trimethylglycine can be an electron acceptor
for two electrons. The sulphide ion can donate two
electrons, and thus, can be converted into elemental
sulphur. Considering the stoichometric ratio in the che-
mical reaction between trimethylglycine (ammonia) and
the sulphide ion (sulphate ion) (Fdz-Polanco et al. 2001)
SO2�4 þ 2NHþ4 ! S0 þ N2 þ 4 H2O; ð8Þ
consisting of the following reactions:
3 SO2�4 þ 4 NHþ4 ! 3 S2� þ 4 NO�2 þ 4 H2Oþ 8 Hþ; ð9Þ
3 S2� þ 2 NO�2 þ 8 Hþ ! N2 þ 3 S0 þ 4 H2O; ð10Þ
2 NO�2 þ 2 NHþ4 ! 2 N2 þ 4 H2O; ð11Þ
the concentration of sulphide ions can be decreased by
1026 mg (0.032 mol) at the expense of 3.74 mg
(0.032 mol) trimethylglycine. The concentration of sul-
phates in the holding tank was 4200 mg/L, from which
the SRB are able to produce 1400 mg/L sulphides (Widdel
& Hansen 1991) [Eq. (12), Table 3].
2 lactate� þ SO2�4 þ 3 Hþ ! 2 acetateþ 2 CO2
þ 2 H2Oþ HS: ð12Þ
If the concentration of sulphides in wastewater can be
reduced at the expense of trimethylglycine, then the
residual concentration of sulphide ions should be
1400–1026=376 mg/L. At the end of the experiment, the
concentration of sulphides in the reactor 1 of the anaero-
bic digestion unit (Fig. 1b) was measured as 360 mg/L and
as 390 mg/L, in reactor 2 giving an average of 375 mg/L.
The fluctuations in the sulphide concentration during the
experiment were 176–410 (average 296) mg/L in reactor
1 and 176–417 (average 307) mg/L in reactor 2.
According to the technological set-up presented in
Fig. 1, the biological processes in the anaerobic reactors
and in the anoxic reactor are inter-related by the returned
sludge from the secondary sedimentation tanks. The
effluent from the settler (by anoxic reactor) is recircled to
the inlet of the mixing tank. The evaluation of the
efficiency of anaerobic and anoxic stages as well as the
total efficiency of the system has demonstrated that
leading the sludge back to the holding tank improved the
efficiency of the anoxic stage. The performances of the
anaerobic stage and the anoxic stage counterbalance
each other, guaranteeing the relative stability of the
entire system (Fig. 7a and b). After the start-up research,
the wastewater loading was increased to 400 m3/day, up
to 40% more than the initial loading. Aerobic polishing
was commenced on day 220. The final treatment effi-
ciency of the entire system consisting of two anaerobic
reactors, anoxic reactor and SBR for aerobic polishing
appeared to be up to 98% (by TCOD) and over 90% (by
SCOD).
Because of additional inoculation of reactor 2 with
adapted anaerobic sludge from the anoxic reactor (on
day 51), the biogas production from the former was more
intensive. Exact biogas measurement was commenced on
day 76. Leading returned sludge to the mixing tank
increased the production of biogas up to 25 m3/h (Fig. 8).
The maximum biogas production achieved was up to
37 m3/h in both reactors because of increased loading
(up to 16 kg COD/m3/day).
1
2
3
4
5
6
7
8
9
10
11
12
13
14
15
16
17
18
19
20
21
22
23
24
25
26
27
28
29
30
31
32
33
34
35
36
37
38
39
40
41
42
43
44
45
46
47
48
49
50
51
52
53
0
5
10
15
20
25
30
35
40
0 20 40 60 80 100 120 140 160 180 200 220 240 260 280 300 320Time (day)
Bio
gas
(m3 /
h)
Wash watersto anaerobicreactors
Fig. 8. Production of biogas in the anaerobic reactor 2 (m3/h).
Water and Environment Journal (2007) c� 2007 The Authors. Journal compilation c� 2007 CIWEM. 11
Treatment of high-sulphate wastewater from yeastQ1
productionS. Zub et al.
WEJ 97(BW
UK
WE
J 97
.PD
F 14
-Nov
-07
21:5
4 38
8798
Byt
es 1
3 PA
GE
S n
oper
ator
=K
.Vin
odK
umar
)

Conclusions
(1) Different fromQ8 other similar biological wastewater
purification schemes, residual sludge from the anoxic
stage was returned to the beginning of the purification
scheme (mixing tank). The main results of our combined
anaerobic/anoxic reactors system were as follows:
� The purification of baker’s yeast wastewater (produced
from sugar-beet molasses, having a high SO42� content)
was feasible without the use of granular sludge.
� There was no need to use chemicals for pH control.
� The returned anoxic sludge retained methanogenic
activity; no additional inoculation of anaerobic reactors
was needed.
� COD reduction efficiency (by TCOD) in the anaero-
bic+anoxic stage was up to 80%, and up to 98% in the
anaerobic+anoxic+SBR stage, supporting an average bio-
gas production of 1300 m3/day (with two anaerobic reac-
tors). The system operated in a stable manner, without
sludge washout. The complete purification of wastewaters
from sulphates (with 100% efficiency) accompanied by
moderate production of sulphides (up to 50 mg/L) was
obviously possible at the expense of reduction of tri-
methylglycine to other nitrogen-containing compounds.
(2) Therefore, considering the above-mentioned latest
achievements in the treatment of high-sulphate-contain-
ing wastewaters, it was decided that there was no need for
the urgent change of molasses preparation technology or
of the chemical composition of mineral salts solution used
for the cultivation of the yeast culture based on sugar-beet
molasses. This set-up supported the creation of more
favourable conditions for the methane-producing micro-
organisms and avoided their takeover by the SRB. The
concentration of dissolved oxygen in the anoxic reactor
was kept strictly below 0.1 mg O2/L, enabling a continu-
ing decrease in sulphide content.
(3) The increase of the daily volume of biogas production
in an anaerobic reactor was explained by the presence of
trimethylglycine in sugar-beet molasses. Considering the
positive effect of trimethylglycine on biogas production,
studies on the precise analytical measurement of
intermediate products of anaerobic digestion continue.
Furthermore, thrimethylglycine can be used as an osmo-
lyte to treat wastewaters with high concentrations of
salts.
Acknowledgements
The authors would like to thank Guy Marleau, Zhigen
Zhang (Lallemand Inc., Canada) for technical and finan-
cial support, and Andres Mets, Tiina Valk and Olev Kroon
(Salutaguse Yeast Factory) for their excellent collabora-
tion. The financial support from the Estonian Science
Foundation (Grants Nos. 5653 and 5889) is gratefully
acknowledged.
References
American Public Health Association. (1995) Standard Methods
for the Examination of Water and Q9Wastewater (19th edn).
American Public Health Association.
Blonskaja, V., Menert, A., Kurissoo, T. and Vilu, R. (2001).
Biological oxidation in anaerobic digestion of sulfate rich waste-
waters. 9th World Congress on Anaerobic Digestion 2001,
2–6 September 2001, Antwerpen, Belgium. Proceedings,
Part 1, Technologisch Instituut vzw, pp. 713–718.
Buisman, C.J.N. (1996). Process for removing sulfur compounds
from water. US Patent 5 518 619.
Buisman, C.J.N., Geraats, B.G., Ijspeert, P. and Lettinga, G.
(1990) Optimization of Sulfur Production in a Biotechnolo-
gical Sulfide-Removing Q10Reactor. Biotechnol. Bioeng., 35 (1),
50–56.
Fdz-Polanco, F., Fdz-Polanco, M., Fernandez, N., Uruena,
M.A., Garcia, P.A. and Villaverde, S. (2001) New Process for
Simultaneous Removal of Nitrogen and Sulfur Under Anae-
robic Conditions. Water Res., 35 (4), 1111–1114.
Fox, P. and Venkatasubbiah, V. (1996) Coupled Anaerobic/
Aerobic Treatment of High-Sulfate Wastewater with Sulfate
Reduction and Biological Sulfide Oxidation. Water Sci. Tech-
nol., 34 (5–6, Water Quality International ’96, Part 3),
359–366.
Henshaw, P.F., Bewtra, J.K. and Biswas, N. (1998) Hydrogen
Sulfide Conversion to Elemental Sulfur in a Suspended-
Growth Continuous Stirred Tank Reactor Using Chlorobium
limicola. Water Res., 32 (6), 1769–1778.
http://www.helcom.fi/stc/files/Convention/Conv0704.pdf
[accessed 16 June 2006].
Janssen, A.J.H., Ma, S.C., Lens, P. and Lettinga, G. (1997)
Performance of a Sulfide Oxidizing Expanded Bed Reactor
with Spatially Separated Aeration Unit. Biotech. Bioeng., 53
(1), 32–40.
Lens, P.N.L, Visser, A., Janssen, A.J.H, Pol, L.W.H and Lettinga,
G. (1998) Biotechnological Treatment of Sulfate-Rich Was-
tewaters. Crit. Rev. Environ. Sci. Technol., 28 (1), 41–88.
Lens, P.N.L., Omil, F., Lema, J.M. and Hulshoff Pol, L.W. (2000)
Biological Treatment of Organic Sulfate-Rich Q11Wastewaters.
Chapter 7. In Lens, P. and Hulshoff Pol, L. (eds). Environ-
mental Technologies to Treat Sulfur Pollution. IWA Publishing,
London, UK.
Moune, S., Manac, N., Hirschler, A., Caumette, P., Willison,
J.C. and Matheron, R. (1999) Haloanaerobacter salinarus sp.
nov., A Novel Fermentative Bacterium that Reduces Gly-
cine-Betaine to Trimethylamine with Hydrogen or Serine as
Electron Donors; Emendation of the Genus Haloanaerobacter.
Int. J. Syst. Bacteriol., 49, 103–112.
Muller, E., Fahlbusch, K., Walther, R. and Gottschalk, G.
(1981) Formation of N,N-Dimethylglycine, Acetic Acid, and
Butyric Acid from Betaine by Eubacterium limosum. Appl.
Environ. Microbiol., 42, 439–445.
1
2
3
4
5
6
7
8
9
10
11
12
13
14
15
16
17
18
19
20
21
22
23
24
25
26
27
28
29
30
31
32
33
34
35
36
37
38
39
40
41
42
43
44
45
46
47
48
49
50
51
52
53
Water and Environment Journal (2007) c� 2007 The Authors. Journal compilation c� 2007 CIWEM.12
Treatment of high-sulphate wastewater from yeastQ1
production S. Zub et al.
WEJ 97(BW
UK
WE
J 97
.PD
F 14
-Nov
-07
21:5
4 38
8798
Byt
es 1
3 PA
GE
S n
oper
ator
=K
.Vin
odK
umar
)
Naumann, E., Hippe, H. and Gottschalk, G. (1983) Betaine:
New Oxidant in the Stickland Reaction and Methanogenesis
from Betaine and L-Alanine by a Clostridium sporogenes–-
Methanosarcina barkeri Co-Culture. Appl. Environ. Microbiol.,
45, 474–483.
Nyyssola, A., Kerovuo, J., Kaukinen, P., von Weymarn, N. and
Reinikainen, T. (2000) Extreme Halophiles Synthesize
Betaine from Glycine by Methylation. J. Biol. Chem., 275
(29), 22196–22201.
O’Flaherty, V., Mahony, T., O’Kennedy, R. and Colleran, E.
(1998) Effect of pH on the Growth Kinetics and Sulfide
Toxicity Thresholds of a Range of Methanogenic, Syntrophic
and Sulfate-Reducing Bacteria. Process Biochem. (Oxford), 33
(5), 555–569.
Sax, R.I. and Lusk, P.D. (1995). Anaerobic digestion of municipal,
industrial and livestock wastes for energy recovery and disposal.
Proceedings of the Biomass Conf. Am. Energy, Environ,
Agric. Ind., 2nd, National Renewable Energy Laboratory,
Golden, CO,Q12 711–723.
Shan, M. and Xiong, C.(Chengdu Methane Scientific Research
Institute, Ministry of Agriculture, Peop. Rep. China).
(1997). Removal of hydrogen sulfide by oxidation in
methane fermentation tanks. Faming Zhuanli Shenqing
Gongkai Shuomingshu CN 1144782 A, 12 March 1997, 5
pp. (in Chinese). (People’s Republic of China). Coden:
CNXXEV. Class: ICM: C02F011-04. ICS: C01B017-04;
C01B017-16; C12M001-107. Application:CN 95-
111486, 5 September 1995. Ref. Chemical Abstracts,
128:206810.
Anaerobic Suspended-Growth Treatment Q13Processes. In Tcho-
banoglous, G. and Burton, F.L. (eds). (1991) Wastewater
Engineering, Treatment, Disposal and Reuse (3rd edn). Metcalf
& Eddy Inc./McGraw-Hill Inc.
Thalasso, F., van der Burgt, J., O’Flaherty, V. and Colleran, E.
(1999) Large-Scale Anaerobic Degradation of Betaine.
J. Chem. Technol. Biotechnol., 74 (12), 1176–1182.
Versprille, B. (2000) Report on the Wastewater Treatment Plant of
Salutaguse Yeast Factory, Biothane Systems International. B. V,
Salutaguse, Estonia, 11 pp.
Weijma, J., Stams, A.J.M., Hulshoff Pol, L.W. and Lettinga, G.
(2000) Thermophilic Sulfate Reduction and Methanogen-
esis with Methanol in High Rate Anaerobic Reactor. Biotech.
Bioeng., 67, 354–363.
Widdel, F. and Hansen, T.A. (1991) The Dissimilatory Sulfate-
and Sulfur-Reducing Bacteria Q14(Chapter 24). In The Procar-
yotes (2nd edn, p. 583.
Zitomer, D.H. and Shrout, J.D. (2000) High Sulfate, High Chemical
Oxygen Demand Waste-Water Treatment Using Aerated Me-
thanogenic Fluidized Beds. Water Environ. Res., 72 (1), 90–97.
von Zumbusch, P., Meyer-Jens, T., Brunner, G. and Markl, H.
(1994) On-Line Monitoring of Organic Substances with
High-Pressure Liquid Chromatography (HPLC) During the
Anaerobic Fermentation of Waste- Q15Water. Appl. Microbiol.
Biotechnol., 42, 140–146.
1
2
3
4
5
6
7
8
9
10
11
12
13
14
15
16
17
18
19
20
21
22
23
24
25
26
27
28
29
30
31
32
33
34
35
36
37
38
39
40
41
42
43
44
45
46
47
48
49
50
51
52
53
Water and Environment Journal (2007) c� 2007 The Authors. Journal compilation c� 2007 CIWEM. 13
Treatment of high-sulphate wastewater from yeastQ1
productionS. Zub et al.
WEJ 97(BW
UK
WE
J 97
.PD
F 14
-Nov
-07
21:5
4 38
8798
Byt
es 1
3 PA
GE
S n
oper
ator
=K
.Vin
odK
umar
)

Author Query Form
_______________________________________________________
_______________________________________________________
Dear Author,
During the copy-editing of your paper, the following queries arose. Please respond to these by marking up your proofs with the necessary changes/additions. Please write your answers clearly on the query sheet if there is insufficient space on the page proofs. If returning the proof by fax do not write too close to the paper's edge. Please remember that illegible mark-ups may delay publication.
Journal WEJArticle 97
Query No. Description Author Response
Q1AQ: Please check if the suggested running title is OK.
Q2AQ: Please check if ‘stable work’ changed to ‘stable function’ in the following sentence ‘The ammonium … stable function’ is OK.
Q3AQ: Please provide the manufacturer information for Marvet OxyMat 99-1: company name, town, state (if USA) and country.
Q4AQ: Please provide the manufacturer information for Lallemand Inc.: town, state (if USA) and country.
Q5AQ: Please provide the manufacturer information for Baily Fisher Porter: town, state (if USA) and country.
Q6AQ: Please provide the manufacturer information for Danfoss MAG1000/1100 electromagnetic flow metres: company name, town, state (if USA) and country.
Q7AQ: Please check if it is ‘metanogenic’ or ‘methanogenic’ in the sentence ‘anoxic sludge … the reactors’.
Q8AQ: The conclusions have been set as numbered points as per journal style. Please confirm.
Q9AQ: Please provide place of publication for the reference American Public Health Association (1995).
Q10AQ: Please check if Buisman C.N.J. changed to Buisman C.J.N. for the reference Buisman et al. (1990) is OK.
Q11AQ: Please provide page range for the reference Lens et al. (2000).
Q12AQ: Please provide the expansion of the proceedings in the reference Sax & Lusk (1995).
Q13AQ: Please provide author and place of publication for the reference Tchobanoglous & Burton (1991).
Q14AQ: Please provide editor, publisher and place of publication for the reference Widdel & Hansen (1991).
Q15AQ: Please check if Zumbusch P.v changed to von Zumbusch for the reference Zumbusch et al. (1994) is OK.
Q16AQ: Please check if soluble COD changed to supernatant COD for SCOD in Fig. 7 as per in the text is OK.

MARKED PROOF
Please correct and return this set
Instruction to printer
Leave unchanged under matter to remain
through single character, rule or underline
New matter followed byor
or
or
or
or
or
or
or
or
and/or
and/or
e.g.
e.g.
under character
over character
new character new characters
through all characters to be deleted
through letter orthrough characters
under matter to be changedunder matter to be changedunder matter to be changedunder matter to be changedunder matter to be changed
Encircle matter to be changed
(As above)
(As above)
(As above)
(As above)
(As above)
(As above)
(As above)
(As above)
linking characters
through character orwhere required
between characters orwords affected
through character orwhere required
or
indicated in the marginDelete
Substitute character orsubstitute part of one ormore word(s)
Change to italicsChange to capitalsChange to small capitalsChange to bold typeChange to bold italicChange to lower case
Change italic to upright type
Change bold to non-bold type
Insert ‘superior’ character
Insert ‘inferior’ character
Insert full stop
Insert comma
Insert single quotation marks
Insert double quotation marks
Insert hyphenStart new paragraph
No new paragraph
Transpose
Close up
Insert or substitute spacebetween characters or words
Reduce space betweencharacters or words
Insert in text the matter
Textual mark Marginal mark
Please use the proof correction marks shown below for all alterations and corrections. If you
in dark ink and are made well within the page margins.wish to return your proof by fax you should ensure that all amendments are written clearly


