Combined use of imaging and computational techniques to investigate fluid dynamics in stented coronary bifurcations John F. LaDisa PhD 1 , Andrew Williams MS 1 , Bon-Kwon Koo MD, PhD 2 1 Biomedical Engineering, Marquette University Cardiovascular Medicine, Medical College of Wisconsin 2 Center for Cardiovascular Technology, Stanford University Medical Center Seoul National University College of Medicine, Seoul, Korea
Transcript
Combined use of imaging and computational techniques to investigate fluid dynamics in
stented coronary bifurcations
John F. LaDisa PhD1, Andrew Williams MS1, Bon-Kwon Koo MD, PhD2
1Biomedical Engineering, Marquette University
Cardiovascular Medicine, Medical College of Wisconsin
2Center for Cardiovascular Technology, Stanford University Medical Center
Seoul National University College of Medicine, Seoul, Korea
Hemodynamics in coronary artery bifurcations
2Nov. 22, 2008Analysis of hemodynamics after bifurcation stentingLaDisa, Williams & Koo
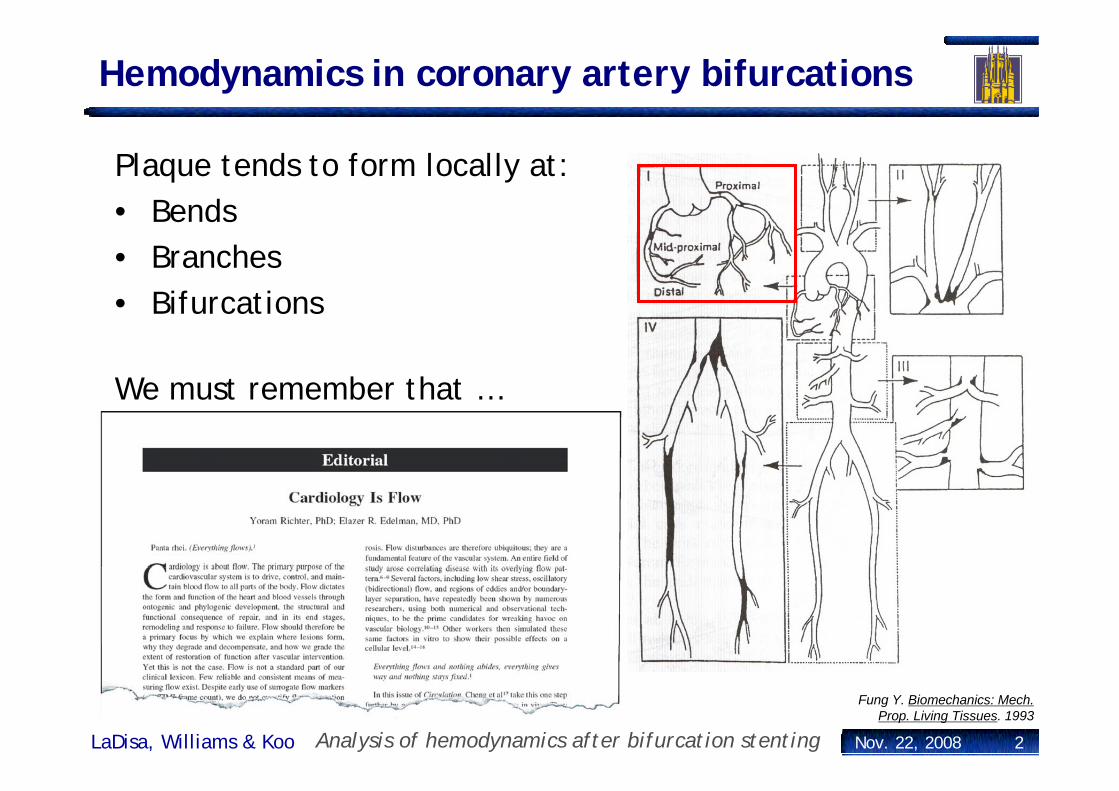
Fung Y. Biomechanics: Mech.Prop. Living Tissues. 1993
Plaque tends to form locally at: • Bends• Branches• Bifurcations
We must remember that …
Hemodynamics in coronary artery bifurcations
3Nov. 22, 2008Analysis of hemodynamics after bifurcation stentingLaDisa, Williams & Koo
He & Ku. J Biomech Eng. 118: 74-82, 1996Grøttum et al. Atherosclerosis. 47: 55-62, 1983
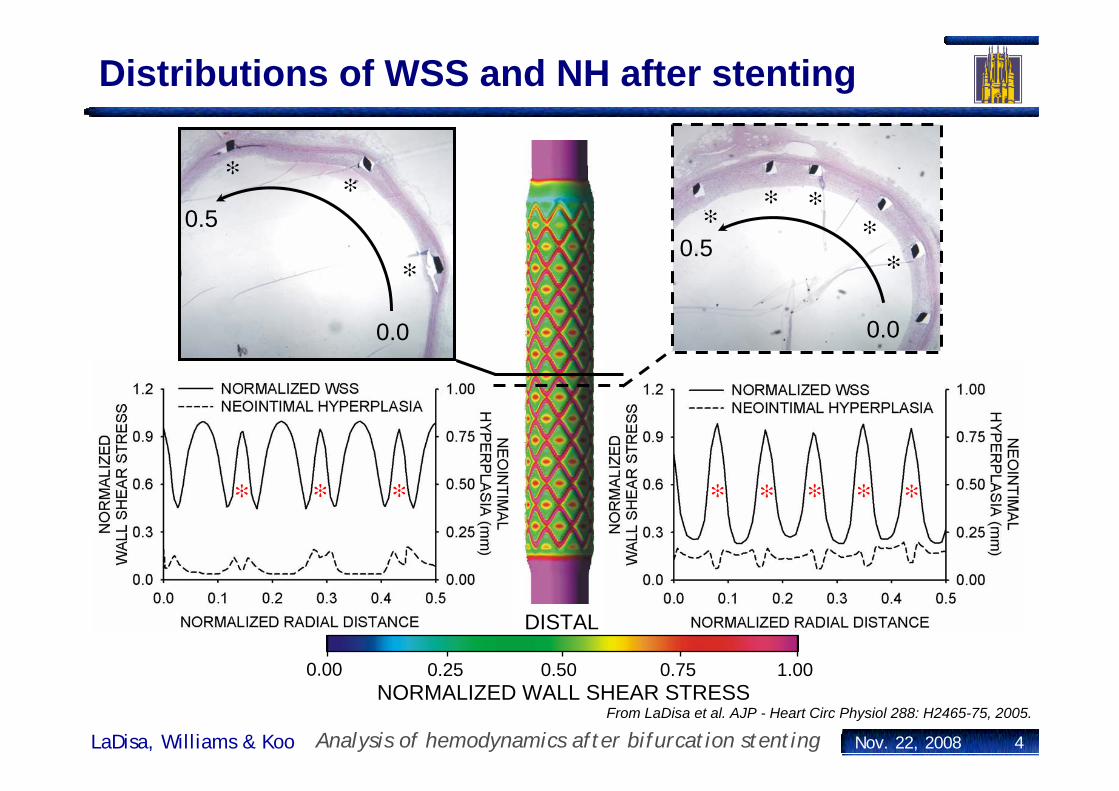
Areas of low time-averaged WSS (< 4 dyn/cm2) and high oscillatory WSS are prone to plaque
From LaDisa et al. AJP - Heart Circ Physiol 288: H2465-75, 2005.
Aimed Blood Pressure (mmHg)Systolic BP - 77Mean BP - 68Diastolic BP - 59
R c
R dC
Rc Rd
C
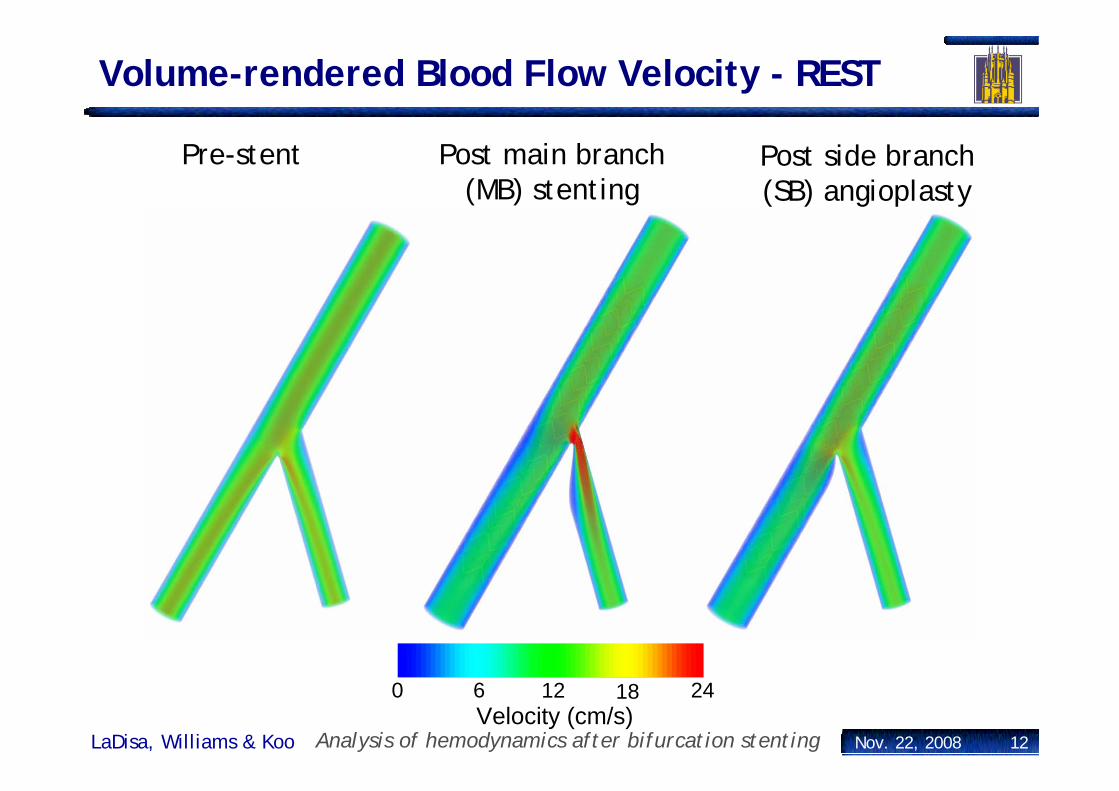
Volume-rendered Blood Flow Velocity - REST
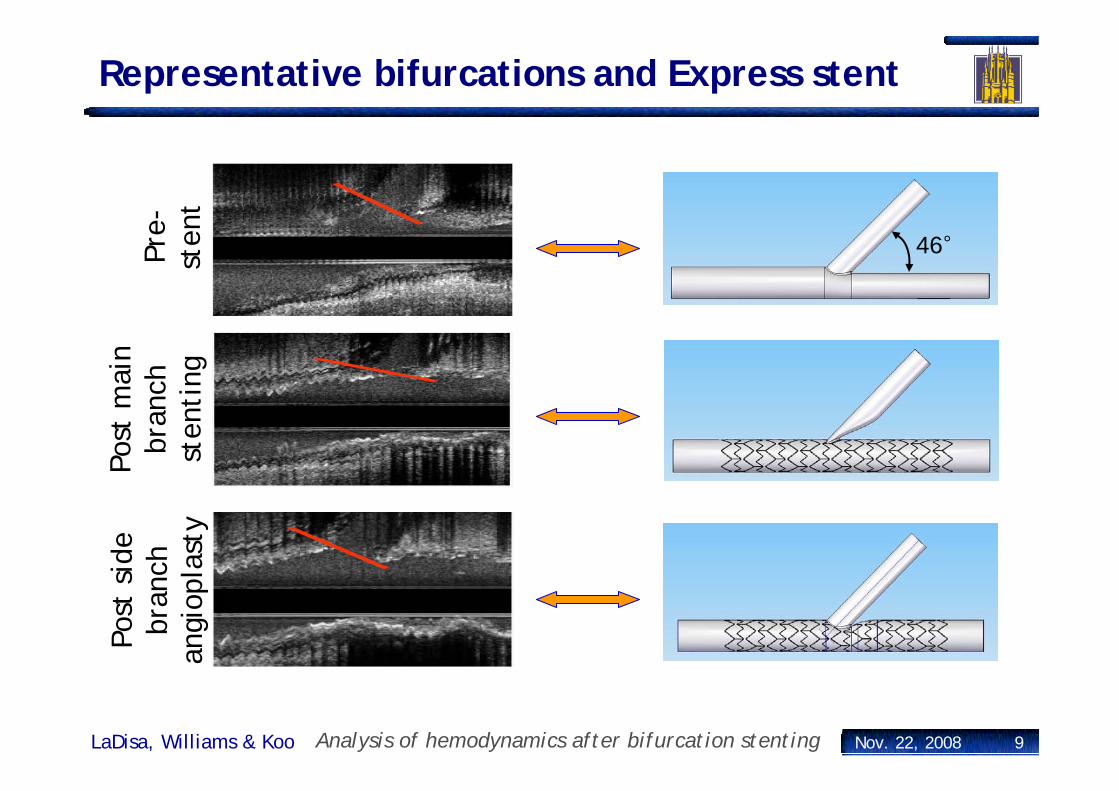
Pre-stent Post main branch (MB) stenting
Post side branch (SB) angioplasty
0 6 12 18 24Velocity (cm/s)
12Nov. 22, 2008Analysis of hemodynamics after bifurcation stentingLaDisa, Williams & Koo
Systolic Blood Flow Velocity
Post SB angioplasty
Post MB stenting
(best case)Pre-stent
13Nov. 22, 2008Analysis of hemodynamics after bifurcation stentingLaDisa, Williams & Koo
Post MB stenting
(worst case)
REST
ADEN
OSI
NE
24
18
12
6
0
Sys
tolic
Blo
od F
low
Vel
ocity
(cm
/s)
Ostium area = 1.94 mm2
Diameter stenosis = 54%Area stenosis = 51%
Ostium area = 1.88 mm2
Diameter stenosis = 54%Area stenosis = 52%
Ostium area = 3.89 mm2
Diameter stenosis = 0%Area stenosis = 0%
Side branch jailing - impact on FFR
Post SB angioplasty
Post MB stenting(worst case)
Post MB stenting(best case)
14Nov. 22, 2008Analysis of hemodynamics after bifurcation stentingLaDisa, Williams & Koo
a
dNmax
Smax
PP
QQFFR ≈=
Post SB angioplasty
Post MB stenting
(worst case)
Post MB stenting
(best case)
SB
FFR
0.50
0.60
0.70
0.80
0.90
1.00
Time-averaged wall shear stress
Post SB angioplasty
Post MB stenting
(best case)Pre-stent
15Nov. 22, 2008Analysis of hemodynamics after bifurcation stentingLaDisa, Williams & Koo
Post MB stenting
(worst case)
REST
ADEN
OSI
NE
30
23
15
8
0Tim
e-av
erag
ed W
SS
(dyn
/cm
2 )
Quantification of Low WSS areas
16Nov. 22, 2008Analysis of hemodynamics after bifurcation stentingLaDisa, Williams & Koo
0
10
20
30
40
50
RESTEXERCISE
Post SB angioplasty
Post MB stenting
(worst case)
Post MB stenting
(best case)
Per
cent
of L
umen
Sur
face
Pre-stent
Amount of Lumen Surface with Low Time-averaged WSS (< 4 dyn/cm2)
RESTADENOSINE
There are no differences in the total area of low TAWSS so the potential for neointimal hyperplasia or thrombus are the same from a fluid dynamics perspective
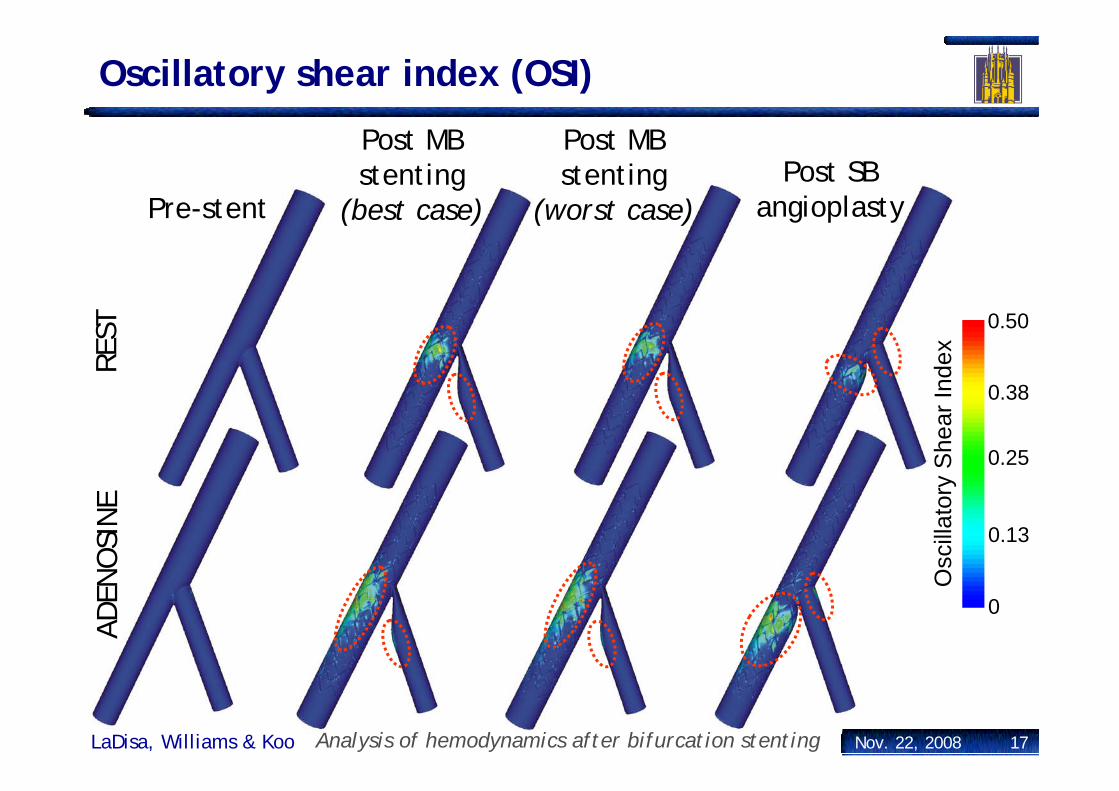
Oscillatory shear index (OSI)
Post SB angioplasty
Post MB stenting
(best case)Pre-stent
17Nov. 22, 2008Analysis of hemodynamics after bifurcation stentingLaDisa, Williams & Koo
Post MB stenting
(worst case)
REST
ADEN
OSI
NE
0.50
0.38
0.25
0.13
0
Osc
illat
ory
She
ar In
dex
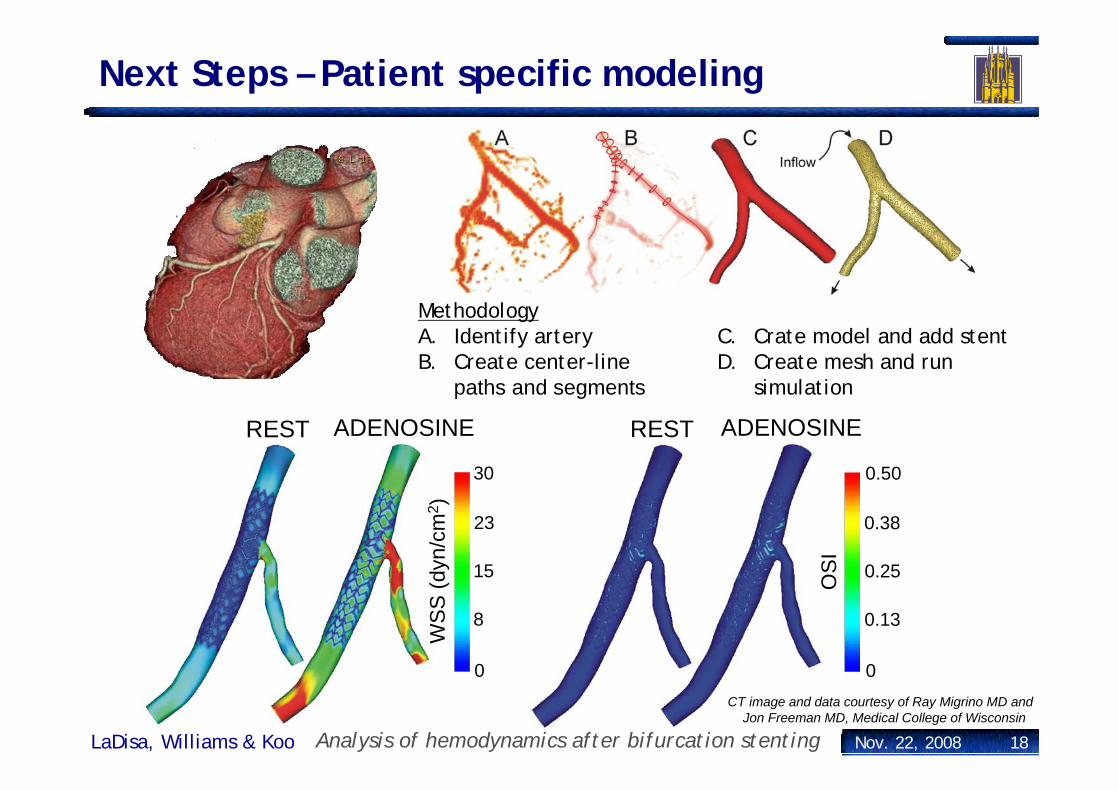
Next Steps – Patient specific modeling
MethodologyA. Identify artery C. Crate model and add stentB. Create center-line D. Create mesh and run
paths and segments simulation
18Nov. 22, 2008Analysis of hemodynamics after bifurcation stentingLaDisa, Williams & Koo
0.50
0.38
0.25
0.13
0
OS
I
30
23
15
8
0
WSS
(dyn
/cm
2 )
CT image and data courtesy of Ray Migrino MD andJon Freeman MD, Medical College of Wisconsin
REST ADENOSINE REST ADENOSINE
Next Steps – Modeling multi-stent deployment
19Nov. 22, 2008Analysis of hemodynamics after bifurcation stentingLaDisa, Williams & Koo
Summary
20Nov. 22, 2008Analysis of hemodynamics after bifurcation stentingLaDisa, Williams & Koo
• CFD can be used to quantify and increase our knowledge of altered hemodynamics in the stented LAD/D1 bifurcation
• Simple MB stenting caused flow disturbances
1. Stenting caused low time-averaged WSS (TAWSS) near struts that diminished during adenosine infusion
2. MB stenting caused eccentric areas of low time-averaged WSS and elevated OSI opposite the carina
• SB angioplasty did not alleviate these flow disturbances
1. The total area of low TAWSS was the same for MB stenting and after SB angioplasty
2. SB angioplasty restored carina position, but caused concentric low TAWSS and high OSI in the distal MB