BioOne sees sustainable scholarly publishing as an inherently collaborative enterprise connecting authors, nonprofit publishers, academic institutions, research libraries, and research funders in the common goal of maximizing access to critical research. Combining Pest Control and Resistance Management: Synergy of Engineered Insects With Bt Crops Author(s): Nina Alphey, Michael B. Bonsall, and Luke Alphey Source: Journal of Economic Entomology, 102(2):717-732. 2009. Published By: Entomological Society of America DOI: http://dx.doi.org/10.1603/029.102.0233 URL: http://www.bioone.org/doi/full/10.1603/029.102.0233 BioOne (www.bioone.org ) is a nonprofit, online aggregation of core research in the biological, ecological, and environmental sciences. BioOne provides a sustainable online platform for over 170 journals and books published by nonprofit societies, associations, museums, institutions, and presses. Your use of this PDF, the BioOne Web site, and all posted and associated content indicates your acceptance of BioOne’s Terms of Use, available at www.bioone.org/page/terms_of_use . Usage of BioOne content is strictly limited to personal, educational, and non-commercial use. Commercial inquiries or rights and permissions requests should be directed to the individual publisher as copyright holder.
Transcript
BioOne sees sustainable scholarly publishing as an inherently collaborative enterprise connecting authors, nonprofit publishers,academic institutions, research libraries, and research funders in the common goal of maximizing access to critical research.
Combining Pest Control and Resistance Management: Synergy ofEngineered Insects With Bt CropsAuthor(s): Nina Alphey, Michael B. Bonsall, and Luke AlpheySource: Journal of Economic Entomology, 102(2):717-732. 2009.Published By: Entomological Society of AmericaDOI: http://dx.doi.org/10.1603/029.102.0233URL: http://www.bioone.org/doi/full/10.1603/029.102.0233
BioOne (www.bioone.org) is a nonprofit, online aggregation of core research in thebiological, ecological, and environmental sciences. BioOne provides a sustainable onlineplatform for over 170 journals and books published by nonprofit societies, associations,museums, institutions, and presses.
Your use of this PDF, the BioOne Web site, and all posted and associated content indicatesyour acceptance of BioOne’s Terms of Use, available at www.bioone.org/page/terms_of_use.
Usage of BioOne content is strictly limited to personal, educational, and non-commercialuse. Commercial inquiries or rights and permissions requests should be directed to theindividual publisher as copyright holder.
Combining Pest Control and Resistance Management: Synergy ofEngineered Insects With Bt Crops
NINA ALPHEY,1,2,3 MICHAEL B. BONSALL,1 AND LUKE ALPHEY2,4
J. Econ. Entomol. 102(2): 717Ð732 (2009)
ABSTRACT Transgenic crops producing insecticidal toxins are widely used to control insect pests.Their beneÞts would be lost if resistance to the toxins became widespread in pest populations. Themost widely used resistance management method is the high-dose/refuge strategy. This requirestoxin-free host plants as refuges near insecticidal crops, and toxin doses intended to be sufÞciently highto kill insects heterozygous for a resistant allele, thereby rendering resistance functionally recessive.We have previously shown by mathematical modeling that mass-release of harmless susceptible(toxin-sensitive) insects engineered with repressible female-speciÞc lethality using release of insectscarrying a dominant lethal ([RIDL] Oxitec Limited, United Kingdom) technology could substantiallydelay or reverse the spread of resistance and reduce refuge sizes. Here, we explore this proposal indepth, studying a wide range of scenarios, considering impacts on population dynamics as well asevolution of allele frequencies, comparing with releases of natural fertile susceptible insects, andexamining the effect of seasonality. We investigate the outcome for pest control for which theplant-incorporated toxins are not necessarily at a high dose (i.e., they might not kill all homozygoussusceptible and all heterozygous insects). We demonstrate that a RIDL-based approach could forman effective component of a resistance management strategy in a wide range of genetic and ecologicalcircumstances. Because there are signiÞcant threshold effects for several variables, we expect that amargin of error would be advisable in setting release ratios and refuge sizes, especially as the frequencyand properties of resistant alleles may be difÞcult to measure accurately in the Þeld.
KEY WORDS resistance management, Bt crops, mathematical modeling, RIDL, high-dose/refugestrategy
Transgenic plants, mainly maize, Zea mays L., andcotton,Gossypium hirsutum L., producing insecticidalproteins derived fromBacillus thuringiensis (Berliner)(Bt) are widely used to control insect pests (James2007). They can provide economic, health and envi-ronmental beneÞts (Shelton et al. 2002, Huang et al.2003, Brookes and Barfoot 2006), so attention hasfocused on methods to prevent or reverse the spreadof resistance to these toxins.
One approach is the high-dose/refuge strategy. Thisis a common tool for managing resistance to Bt cropsand is mandatory in several countries. This aims torender any resistance functionally recessive by usingsuch high toxin concentrations that heterozygotes donot survive. Refuges of host plants that produce notoxins (non-Bt), provide a source of susceptible ge-notypes to dilute the frequency of resistant (r) alleles.Theoretical models, now supported by empirical ev-
idence from monitoring, predict that this strategyslows or prevents the spread of resistance (Alstad andAndow 1995; Gould 1998; Carriere and Tabashnik2001; Tabashnik et al. 2005, 2008).
In principle, instead of refuges an alternative sourceof susceptible (s) alleles could be provided by mass-rearing susceptible insects and releasing them into theenvironment. In the sterile insect technique (SIT), acontrol method used to eliminate or suppress pestpopulations, insects are mass-reared, sterilized by ir-radiation, and released (Dyck et al. 2005); however, noviable hybrids are formed so there is no introgressionof alleles into the wild population. Releasing natural,fertile, susceptible insects would allow such introgres-sion, but released fertile females would contribute topopulation growth (very few reliable sex-separationmethods have been developed for large-scale use inSIT, so generally both sexes would be released). Ge-netic technology (release of insects carrying a dom-inant lethal [RIDL], Oxitec Limited, United King-dom) could modify the SIT by releasing insects thatare not irradiated but instead are homozygous for oneor more dominant lethal genetic constructs that arerepressible during mass-rearing (Thomas et al. 2000,Alphey 2007, Alphey et al. 2007a). A female-lethalversion of RIDL, with male insects homozygous for
1 Mathematical Ecology Research Group, Department of Zoology,University of Oxford, South Parks Rd., Oxford OX1 3PS, United King-dom.
2 Oxitec Limited, 71 Milton Park, Oxford OX14 4RX, United King-dom.
3 Corresponding author, e-mail: [email protected] Department of Zoology, University of Oxford, South Parks Rd.,
Oxford OX1 3PS, United Kingdom.
0022-0493/09/0717Ð0732$04.00/0 � 2009 Entomological Society of America
one or more female-speciÞc dominant lethals (“RIDLmales”), has been constructed in several species, in-cluding the major pests Mediterranean fruit ßy, Cer-atitis capitata (Wiedemann) (Fu et al. 2007), andMexican fruit ßy, Anastrepha ludens (Loew) (K. C.Stainton et al., unpublished data). F1 progeny of RIDLmales and wild females inherit a dominant female-speciÞc lethal; the F1 females die, thereby reducingthe reproductive potential of the wild population, butthe F1 males are viable and fertile, so alleles from themass-reared strain might be introgressed into the wildpopulation. We previously proposed that control pro-grams could combine the release of such engineeredinsects with plants incorporating Bt or similar toxins tomanage pests with fully recessive resistance where thetoxins are fully lethal to susceptible genotypes (Al-phey et al. 2007b). Here, we investigate applying thisapproach to a wider range of ecological and geneticcircumstances.
The evolution of allele frequencies depends on se-lection pressure due to relative areas of Bt crop andrefuge, and relative Þtnesses of the genotypes in each.There are critical threshold proportions for habitatdivision that determine equilibrium allele frequencies(Alphey et al. 2008). If susceptible (ss) homozygotesare released each generation at a constant ratio to thewild population, these thresholds increase, allowingfor equivalent resistance management to be providedby a smaller refuge (Alphey et al. 2007b), which couldincrease crop yields.
Our previous work, in which we explored fully re-cessive resistance (where the r allele is recessive on Btand non-Bt plants so that both the effects and Þtnesscosts are recessive), found that release of RIDL malesslows the spread of resistance and sufÞcient releasescan prevent or reverse the spread of the r allele (Al-phey et al. 2007b). This analysis suggested that releaseof RIDL male insects, at release ratios considerablylower than those typical for effective SIT pest sup-pression programs, could allow a signiÞcant reductionin refuge size while maintaining equivalent resistancemanagement beneÞts.
There is a tension between the beneÞt of usingrefuges to delay or prevent the spread of resistanceand the beneÞt foregone by not planting insecticidalplants there (which would reduce crop damage bykilling pest insects). In contrast, RIDL release couldcontribute simultaneously to reducing pest densitiesand managing resistance. The presence of releasedmales will lead to some females mating with thoseinstead of with wild males, so assuming that repro-duction was not limited by the availability of males,release of males only does not increase the number ofprogeny (the cause of crop damage). The female-lethal effect of the RIDL construct would therefore beexpected to have a population suppression effect syn-ergistic with that provided by the Bt crops. Bt cropsgreatly reduce population sizes of susceptible insects(Caprio 2001, Carriere et al. 2003, Sisterson et al.2004); the additional suppression provided by theRIDL strategy should improve this and might in somecases result in localeliminationof thepest.Toexplore this
potential synergy, which would cause desirable effectson population size as well as on resistant allele fre-quency, we must combine a population dynamics ap-proach within the population genetics framework.
Whatever the approach used, resistance manage-mentanalyses typically focusonpreventing the spreadof resistance from a very low initial level. A RIDLrelease program potentially could also be deployed asremedial action where resistance has become wide-spread. Higher release ratios, more typical of SIT pop-ulation suppression programs, could achieve a muchmore rapid reduction in r allele frequency than wouldbe possible using only refuges (even with no Bt crops,i.e., 100% refuge, the rate of recovery would otherwisebe driven only by the Þtness cost of resistant insectson non-Bt plants).
As well as a low initial r allele frequency, it is com-mon for modeling studies to assume that Bt crops killall susceptible larvae and that resistance is recessive.These assumptions are consistent with available evi-dence for some pests but not for others; there is a needalso to understand the evolution of resistance in pestsfor which the toxins are not high-dose. For example,Cry1Ac cotton does not kill all susceptible larvae ofthe economically important pests bollworm, Helicov-erpa zea (Boddie), and Helicoverpa armigera (Hub-ner), and some laboratory-selected resistance is notrecessive (EPA 1998, Gould 1998, Akhurst et al. 2003,Gujar et al. 2007, Luttrell and Ali 2007). It is often alsoassumedthatÞtness costs exist andare recessive.How-ever, Þtness costs observed in resistant strains rangefrom undetectable to substantial, and recessive to par-tially dominant, and may be environment-dependent(Ramachandran et al. 1998, Tang et al. 1999, Liu et al.2001, Bates et al. 2005, Carriere et al. 2005a, Raymondet al. 2005).
The resistance trait in some species has been shownto have further Þtness costs for overwintering (inaffected regions), observed as reduced emergencefrom diapause (Alyokhin and Ferro 1999, Carriere etal. 2001b, Bird and Akhurst 2004). Conversely, con-tinuous crop cultivation throughout the year isthought to be one key factor responsible for signiÞcantdamage to Cry1F Bt corn (maize) by larvae of fallarmy worm Spodoptera frugiperda (J.E. Smith) inPuerto Rico in 2006 (Reynolds 2007). We investigatethe impact of seasonality on our results and conclu-sions.
Here, through mathematical modeling, we explorethese issues for the proposed RIDL strategy for resis-tance management. We examine the relationship be-tween critical release ratio, initial allele frequency andequilibrium allele frequency, Þrst considering the evo-lution of resistant allele frequency for recessive resis-tance with nonrecessive Þtness costs. We then explorethe interaction between pest control and resistancemanagement by modeling relative population sizeover time (and compare this with release of wild type,fertile, susceptible insects instead of RIDL males), andthen consider the effect of seasonality on our conclu-sions about fully recessive resistance. Finally we in-vestigate scenarios where Bt crops are not high dose
718 JOURNAL OF ECONOMIC ENTOMOLOGY Vol. 102, no. 2
and either resistance or Þtness costs vary in domi-nance.
Materials and Methods
Underlying Population Genetics Model.We used adeterministic, discrete-generation population geneticmodel (Carriere and Tabashnik 2001, Alphey et al.2008) and assume a closed homogeneous population,with random mating, and no immigration, emigrationor mutation. We assume a 1:1 sex ratio. Larvae, theBt-susceptible life stage, are assumed to spend theirwholedevelopmenteitheronBtcropsor in the refuge;dispersal occurs after emergence as adults and beforemating.
We assume a Þxed crop population, a proportion �of which are Bt plants, so the (non-Bt) refuge size is1 � �. Hard selection (Wallace 1968) acts in these twoenvironments, with the number of larvae surviving toreproductive maturity from each environment de-pending on the relative Þtness values of the eggs laidthere. Larval susceptibility to Bt toxins is assumed tobe controlled by a single autosomal locus with twoalternative alleles: resistant r (frequency p) and sus-ceptible s (frequency q, p � q � 1). There are threepossible genotypes at this locus: ss, sr, and rr.
All insects are affected by Bt toxins. We assume thatall Þtness costs associated with the s and r alleles takeeffect during the larval stage. Assuming that larvae aredistributed at random across Bt and non-Bt crops, theaverage relative Þtness of larvae of genotype i (i: ss, sr,or rr) across the area is
�i � �i� � �i�1 � �� [1]
where �i is the relative Þtness of larvae on Bt crops and�i is relative Þtness of larvae in non-Bt crops. Fitnessis measured relative to ss homozygotes on non-Btplants (so �ss� 1). By deÞnition of resistance �rr �ssWe assume that no genotype is Þtter on Bt crops thanon non-Bt plants (�i� �i). We assume that the resis-tant allele may have a Þtness cost (on non-Bt plants�rr� �sr� �ss� 1), and that on Bt crops resistance is notover- or underdominant (�ss� �sr� �rr). Resistancemay be incomplete (�rr� �rr).
With no release of insects, the change in r allelefrequency is given by
p �pq� p�rr � �q � p��sr � q�ss�
q2�ss � 2pq�sr � p2�rr[2]
Using equation 2, we have demonstrated that there aretwo critical threshold values, �1 and �2, resulting fromthe interplay between the costs and beneÞts of resis-tance, that determine the possible outcomes for the rallele (Alphey et al. 2008). The outcome is determinedby the proportion of Bt crops (�) in relation to thesethresholds and, in some cases, by the alleleÕs initialfrequency (p0).
�1 ��1 � �sr�
�1 � �sr � �sr � �ss�[3]
�2 ���rr � �sr�
��rr � �sr � �sr � �rr�[4]
where �1 � �2, if the proportion of Bt crops is belowor equal to �1 the resistant allele will decline to ex-tinction; if � is above or equal to �2, the resistant allelewill go to Þxation; if � lies between �1 and �2, thefrequency of the resistant allele will settle at a stableinternal equilibrium value (i.e., between 0 and 1) thatcan be calculated.
Where �1 �2, the resistant allele will go either toextinction or Þxation, depending on whether the pro-portion of Bt crops is below or above a third threshold�3. The value of �3 is dependent on the initial fre-quency of the resistant allele p0. �3 lies between �1
(the two are equal when p0 � 0) and �2 (they areequal when p0 � 1), and decreases as p0 increases.
In special cases, where the r allele is recessive onboth Bt and non-Bt plants, dominant on both or co-dominant on both, one of equations 3 or 4 is notdeÞned or they are equal, and there is a single thresh-old determining whether the r allele goes to Þxation orextinction.
To explore resistance with a range of genetic pa-rameter values, it is helpful to deÞne the dominanceof resistance and the dominance of the Þtness costs ofresistance. We then vary the relative Þtness values bychanging those parameters. We deÞne the dominanceof resistance h (0 � h� 1) as (Tabashnik et al. 2008)
h ��sr � �ss
�rr � �ss[5]
(so h � 0 for recessive resistance and h � 1 for dom-inant resistance) and, where appropriate, calculateheterozygote relative Þtness on Bt plants using h
�sr � �1 � h��ss � h�rr [6]
Similarly, we deÞne the dominance of the Þtness costsof resistance g (0 � g� 1, g� 0 for recessive costs andg � 1 for dominant costs) as
g ��sr � �ss
�rr � �ss�
1 � �sr
1 � �rr[7]
so that heterozygote relative Þtness in the refuge be-comes
�sr � �1 � g��ss � g�rr � 1 � g�1 � �rr� [8]
Release ofWild-Type (WT) Insects. To extend thisbasic model to incorporate the effects of the release offertile wild-type insects, we assume that at each gen-eration, as adults emerge before mating, mass-rearedadult insects are released at a Þxed ratio (the “releaseratio”) to the number of males in the wild populationin that generation that survived to reproductive ma-turity. All released adults are assumed to be homozy-gous susceptible to Bt toxins (ss). Males and femalesare released in equal numbers. Wild and releasedadults mix homogeneously and mate at random.
With release of homozygote susceptible adults (sswild type) in ratio d:1 to naturally emerging males inthe wild, the change in r allele frequency is given by
April 2009 ALPHEY ET AL.: ENGINEERED INSECTS AND BT CROPS 719
p�
p�pq�rr� �q�1
2d��q� p��sr� �q�
1
2d�2
�ss��q�
1
2d�2
�ss� 2p�q�1
2d��sr� p2�rr
[9]
In practice, rather than determining the r allele fre-quency by calculating p from equation 9, we used asimulation approach that involved calculating the fre-quencies of every genotype (Alphey et al. 2007b). Thisapproach allowed us to analyze the model in the sameway for both release of wild-type insects and the morecomplicated case of release of engineered insects.Release of Engineered Insects. We further extend
the model to reßect the release of males carrying adominant female-lethal RIDL construct, which ren-ders female progeny inviable but allows male progenyto survive. For this purpose, we assume that at eachgeneration, as adults emerge before mating, mass-reared adult RIDL males are released at a Þxed ratio(the “RIDL release ratio”) to the number of males inthe wild population (of any genotype) that survived toreproductive maturity. Females mate with wild orreleased males at random.
All engineered released males are assumed to behomozygous susceptible to Bt toxins (ss), and ho-mozygous for the RIDL construct. There are two pos-sible alleles at the insertion site of the RIDL construct:L, representing insertion of the construct, and thewild-type allele w, representing absence of the con-struct. We assume the RIDL insertion and the locuscontrolling resistance to Bt are not linked and neitherof these is sex-linked.
We assume the RIDL construct imposes a sex-spe-ciÞc Þtness cost during the larval stage. The averagerelative Þtness of larvae of genotype i is then
�i � �1 � i���i� � �i�1 � �� [10]
where i is the sex-speciÞc, relative Þtness cost im-posed by RIDL.
This results in a complex system of 18 differenceequations that cannot be reduced to expressions interms of p. There are no analytical solutions for alleleor genotype frequencies or for the critical releaseratios or critical refuge sizes.Population Dynamics. R0 is the average number of
progeny produced per adult pest insect that survive toadulthood in a density-independent population, com-monly expressed as female offspring per adult female.For agricultural pests under Þeld conditions, after tak-ing into account factors such as egg hatch rates, pre-dation and pathogens that are common to all geno-types throughout the habitat,R0 might typically rangefrom Þve to10 but can be much higher (Dyck et al.2005). The population size is determined by
Nt� 1 � 2R0Ftt [11]
where Nt is the population size of mature adults atgeneration t relative to the initial pest density (setN0 � 1), of which Ft are female. The growth rate is 2R0
(each adult female contributes R0 male and R0 female
larvae to the next generation) and t is the proportionof offspring surviving to maturity (simulated by ap-plying the Þtness costs of r alleles, Bt toxins and theRIDL construct as appropriate to each genotype). Ntis indicative of the level of crop damage, because everyindividual that survives to reproductive maturity hascompleted larval development on plants.
Equation 11 is unrealistic at very high densities(where limited resources would cause density-depen-dent mortality) or very low densities (where rareinsects could fail to Þnd mates and stochastic effectswould be observed, and our model can yield fractionsof insects rather than whole numbers). However, thismeasure of relative population size is useful because itillustrates trends in pest densities.Seasonality. It has been observed that the resistance
trait can reduce emergence from diapause (Alyokhinand Ferro 1999, Carriere et al. 2001b, Bird and Akhurst2004). To represent the effects of winter on a pest inwhich resistance is fully recessive, we apply furtherÞtness penalties to larvae in every nth generation,where the insect goes through n generations in a year.One factor reduces survival of all genotypes, and an-other factor further reduces survival only of resistantrr genotypes to represent an overwintering cost asso-ciated with the resistant phenotype (e.g., impairingthe ability to enter and emerge from diapause or thetiming of those). The average relative Þtness of larvaeof genotype i in winter generations is then
�i � [overwinter survival] for i � rr
�rr � [overwinter survival]
� [relative overwinter survival of rr] for rr
Simulations.We assume the RIDL construct is fullydominant and completely lethal to females (but not tomales), so for Lw females female � 1 and averageÞtness �i� 0, irrespective of �, �i, and �i.Under theseconditions, LL homozygotes do not arise in the Þeldand there are seven male and three female viablegenotypes deÞned at the L/w and s/r loci. The LLssmale genotype is the engineered released RIDL male,and the other six male genotypes (Lwss, Lwsr, Lwrr,wwss, wwsr, and wwrr) and three female genotypes(wwss,wwsr,andwwrr)arise frommatings in theÞeld.In these simulations, male was set to 0.1 for Lw malelarvae, to allow for a modest Þtness penalty that mightbe associated with the RIDL insertion (e.g., due toinsertional mutagenesis and/or expression of themarker gene; Marrelli et al. 2006).
We explore the effects of release of RIDL males bysimulating different combinations of � and � repre-senting varying strength and Þtness costs of resistance,over a range of refuge sizes (0Ð1 or a subset thereof)and release ratios from 1:1000 (one RIDL male perthousand males in the wild, 0.001) to 25:1 (or a subsetthereof). We simulate the frequencies of all genotypesover 2,500 generations when estimating the value of anequilibrium allele frequency; 200 generations whenexploring population dynamics and seasonality; and500 generations when estimating minimum refuge
720 JOURNAL OF ECONOMIC ENTOMOLOGY Vol. 102, no. 2
sizes for the r allele not to reach 0.5 frequency in theperiod simulated, for pests for which Bt crops are nothigh dose. These durations are far beyond the realisticpractical lifetime of any single insecticidal crop prod-uct, but we use them to illustrate the direction ofchange of r allele frequency (which can take a longtime to become apparent especially where it is initiallyvery rare) and to facilitate estimation of long-termresults such as an equilibrium value toward which ther allele frequency will tend.
A standard genetic criterion for the time to evolveresistance is the number of generations taken for rallele frequency to exceed 0.5 (Comins 1977, Tabas-hnik et al. 2008); this is deemed to indicate a “resis-tance event.” In some circumstances, the allele cantend to an internal equilibrium frequency (between 0and 1), so this criterion can make a seemingly arbitrarydistinction between a resistance management regimedeemed unsuccessful because the r allele settles justabove 0.5 and a regime deemed adequate because ther allele settles just below 0.5. However, there seems tobe a strong connection between the effect on popu-lation size and the r allele exceeding 0.5 (see Results,including Fig. 1), so the distinction is relevant. For anygiven set of parameter values, trial and error can beused to ascertain the minimum refuge size for the rallelenot to reach0.5 frequency.Formultipledatasets,the approach was automated to approximate the min-imum refuge size needed to prevent the r allele fre-quency reaching 0.5 during the generations simulated.(Alternative cut-off points such as frequency 0.3 give
the same conclusions on relative times to resistancewhen comparing scenarios; we use 0.5 because of itscommon acceptance and the clear impact on popula-tion size shortly after that value is reached.)
Conditions favoring resistance (e.g., high r allelefrequency, nonrecessive resistance and low Þtnesscosts) are more likely to warrant extra measures suchas RIDL to delay resistance. For such situations, weparameterized the model using published data for pestinsects (Table 1), adapting values as appropriate to theaspect under investigation.
We modeled initial allele frequency p0 of 0.01 or0.001. Although for many pests, r allele frequencies areof the order of 10�3 based on Þeld data (Gould et al.1997, Tabashnik et al. 2005, Stodola et al. 2006, Huanget al. 2007, Mahon et al. 2007), the frequency hasincreased substantially in some Þeld populations ofH.zea (Ali et al. 2006, Tabashnik et al. 2008) and H.armigera (Liu et al. 2008) and resistant fall armywormhave caused Bt corn crop failure (Reynolds 2007), sohigher values could be relevant to situations where aRIDL strategy might be implemented. Overestimatingthe p0 value is likely to underestimate potential ben-eÞts of RIDL releases implemented at lower allelefrequencies; for fully recessive resistance with givenÞtness parameters, we previously showed that a highervalue of p0 would need a higher RIDL release ratio toprevent the r allele from spreading (Alphey et al.2007b).
For fully recessive resistance and p0 � 0.001 (re-ßecting Þeld data), we showed previously that a re-
Fig. 1. RIDL release acts in synergy with Bt crops, and wild-type release is of variable relative merit. The top graphs showthe frequency of the r allele in naturally emerging adults, and the bottom graphs show the relative population size, over time,for no release of insects (black lines), RIDL release (green lines), and wild-type (WT) release (dashed red lines) with releaseratio (a) 1:2, i.e., one RIDL male or WT adult (male or female in equal numbers) per two males in the wild or (b) 1:5. Genotyperelative Þtness values represent a generic pest for which Bt plants are high-dose and resistance is recessive: in refuge, �sr �0.9, �rr� 0.7; on Bt plants, �ss� �sr� 0, �rr� 0.6. Initial r allele frequency p0 is 0.01. Offspring per female 2R0� 16. Refugeis 4%. (Online Þgure in color.)
April 2009 ALPHEY ET AL.: ENGINEERED INSECTS AND BT CROPS 721
lease ratio as low as 1:4 could justify a refuge as smallas 2Ð3% of the size required without RIDL release(Alphey et al. 2007b). In this study, we generallysimulated release ratios (5:1 and below) lower thanthose typically employed in an SIT program aimed atpest suppression or elimination. Because we were in-terested in assessing RIDL release combined withsmaller refuges, for most purposes we modeled refugesizes lower than are typically observed (e.g., the state-wide mean refuge size for Bt cotton in Arizona is�50%, varying from 14 to 78% per county; Carriere etal. 2005b). We generally used 4 or 5% refuge, notingthat these were the minimum options for mandatoryBt cotton refuge in the USA pre- and post-2001, re-spectively. When addressing questions of dominance,we used empirical data for pests with relevant resis-tance characteristics and considered refuge sizes ap-propriate to those. For dominance of resistance, wemodeled 39% refuge, as estimated for Arkansas andMississippi where Þeld-evolved resistance to Cry1Accotton has been detected in H. zea (Tabashnik et al.2008), 20% refuge, one of the options under U.S. re-quirements, and 5% refuge. Decreased H. armigerasusceptibility to Cry1Ac has not been observed in theÞeld, likely due to large effective refuge sizes (70% ormore in Australia and 87Ð95% in China; Tabashnik etal. 2008), except for one report where the effectiverefuge size is 32% (Liu et al. 2008). Unsurprisingly,when we modeled 70% refuge with even a modestRIDL release, we found that the r allele was drivenextinct in most cases. To explore fully the effects ofvarying Þtness costs, and for consistency, we againmodeled 39, 20, and 5% refuge.
Results
The r allele never reaches Þxation with RIDL re-lease because of the dilution effect of adding new salleles at each generation, but the equilibrium fre-quency can be very close to 1. Simulations reveal thatfor any given set of parameter values there is a critical
release ratio, above which the r allele tends to extinc-tion. This critical value depends on the genotypesÕrelative Þtness values, the initial allele frequency andthe refuge size. We conclude that extending the modelto RIDL releases alters the critical refuge sizes (equa-tions 3 and 4) by the inclusion of terms incorporatingthe RIDL release ratio and p0. If we were able toexpress these modiÞed formulae explicitly, we couldin principle rearrange them to show critical values forany element while keeping the others constant. In-stead of determining critical � keeping all else con-stant, we might thus determine the critical value forRIDL release ratio (for givenp0, refuge size and Þtnessvalues) or derive a critical value for initial frequencyp0 (for given RIDL release ratio, refuge size and Þtnessvalues). We therefore begin by considering the crit-ical release ratio and its relationship with refuge sizeand initial r allele frequency. Resistance is generallythought to be recessive for most pests, so we start byanalyzing that situation. Later, we consider the fullrange of dominance of resistance or of Þtness costs.
Where resistance is recessive (�1 � 1, equation 3)but Þtness costs are not (�2 � 1, equation 4) withoutreleases the r allele will go to extinction or Þxationdepending on the refuge size and initial allele fre-quency (�2 � �1, and there is one critical refuge sizeat 1 � �3, which depends on the value of p0). Weconsidered such cases where resistance would not goextinct with no release, and assessed which factorsinßuence the evolution of r allele frequency.
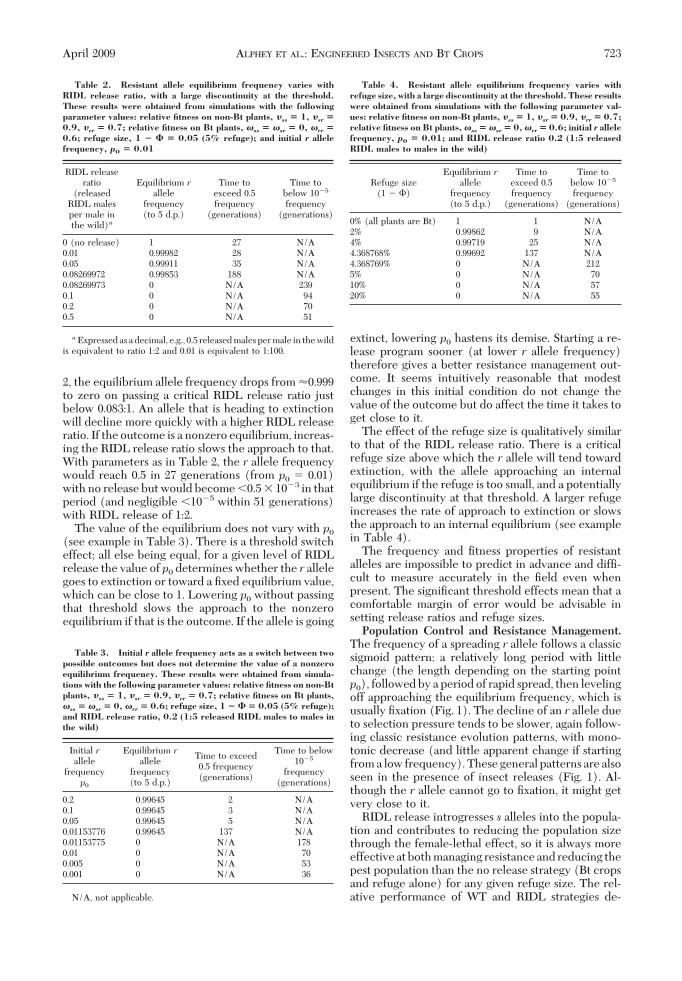
The equilibrium r allele frequency decreases withincreasing RIDL release ratio (see example in Table2). The release ratio affects the equilibrium valuebecause it affects the level of dilution by s alleles fromreleased insects that prevents the r allele reachingÞxation. This value does not decrease smoothly fromclose to one (for a very small RIDL release ratio)down to 0 (at or above the critical release ratio) butjumps discontinuously from a positive level to zero.This threshold nonzero equilibrium value could not bedetermined analytically. With parameters as in Table
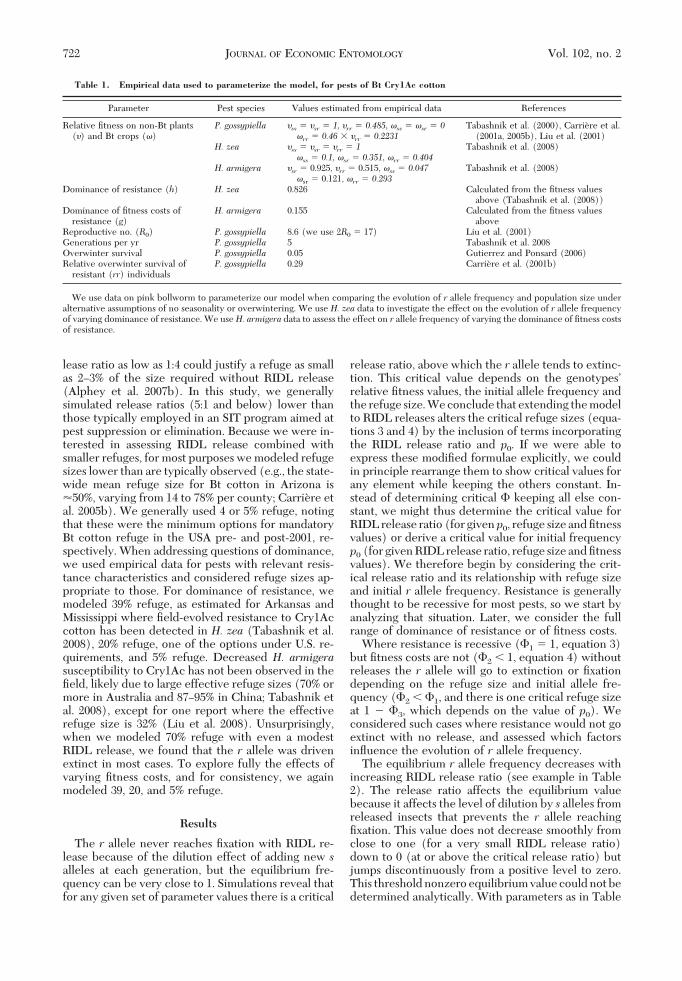
Table 1. Empirical data used to parameterize the model, for pests of Bt Cry1Ac cotton
Parameter Pest species Values estimated from empirical data References
Relative Þtness on non-Bt plants(�) and Bt crops (�)
Dominance of resistance (h) H. zea 0.826 Calculated from the Þtness valuesabove (Tabashnik et al. (2008))
Dominance of Þtness costs ofresistance (g)
H. armigera 0.155 Calculated from the Þtness valuesabove
Reproductive no. (R0) P. gossypiella 8.6 (we use 2R0 � 17) Liu et al. (2001)Generations per yr P. gossypiella 5 Tabashnik et al. 2008Overwinter survival P. gossypiella 0.05 Gutierrez and Ponsard (2006)Relative overwinter survival of
resistant (rr) individualsP. gossypiella 0.29 Carriere et al. (2001b)
We use data on pink bollworm to parameterize our model when comparing the evolution of r allele frequency and population size underalternative assumptions of no seasonality or overwintering. We use H. zea data to investigate the effect on the evolution of r allele frequencyof varying dominance of resistance. We useH. armigera data to assess the effect on r allele frequency of varying the dominance of Þtness costsof resistance.
722 JOURNAL OF ECONOMIC ENTOMOLOGY Vol. 102, no. 2
2, the equilibrium allele frequency drops from �0.999to zero on passing a critical RIDL release ratio justbelow 0.083:1. An allele that is heading to extinctionwill decline more quickly with a higher RIDL releaseratio. If the outcome is a nonzero equilibrium, increas-ing the RIDL release ratio slows the approach to that.With parameters as in Table 2, the r allele frequencywould reach 0.5 in 27 generations (from p0 � 0.01)with no release but would become �0.5 � 10�3 in thatperiod (and negligible �10�5 within 51 generations)with RIDL release of 1:2.
The value of the equilibrium does not vary with p0(see example in Table 3). There is a threshold switcheffect; all else being equal, for a given level of RIDLrelease the value of p0 determines whether the r allelegoes to extinction or toward a Þxed equilibrium value,which can be close to 1. Lowering p0 without passingthat threshold slows the approach to the nonzeroequilibrium if that is the outcome. If the allele is going
extinct, lowering p0 hastens its demise. Starting a re-lease program sooner (at lower r allele frequency)therefore gives a better resistance management out-come. It seems intuitively reasonable that modestchanges in this initial condition do not change thevalue of the outcome but do affect the time it takes toget close to it.
The effect of the refuge size is qualitatively similarto that of the RIDL release ratio. There is a criticalrefuge size above which the r allele will tend towardextinction, with the allele approaching an internalequilibrium if the refuge is too small, and a potentiallylarge discontinuity at that threshold. A larger refugeincreases the rate of approach to extinction or slowsthe approach to an internal equilibrium (see examplein Table 4).
The frequency and Þtness properties of resistantalleles are impossible to predict in advance and difÞ-cult to measure accurately in the Þeld even whenpresent. The signiÞcant threshold effects mean that acomfortable margin of error would be advisable insetting release ratios and refuge sizes.Population Control and Resistance Management.
The frequency of a spreading r allele follows a classicsigmoid pattern: a relatively long period with littlechange (the length depending on the starting pointp0), followed by a period of rapid spread, then levelingoff approaching the equilibrium frequency, which isusually Þxation (Fig. 1). The decline of an r allele dueto selection pressure tends to be slower, again follow-ing classic resistance evolution patterns, with mono-tonic decrease (and little apparent change if startingfrom a low frequency). These general patterns are alsoseen in the presence of insect releases (Fig. 1). Al-though the r allele cannot go to Þxation, it might getvery close to it.
RIDL release introgresses s alleles into the popula-tion and contributes to reducing the population sizethrough the female-lethal effect, so it is always moreeffectiveatbothmanaging resistanceandreducing thepest population than the no release strategy (Bt cropsand refuge alone) for any given refuge size. The rel-ative performance of WT and RIDL strategies de-
Table 2. Resistant allele equilibrium frequency varies withRIDL release ratio, with a large discontinuity at the threshold.These results were obtained from simulations with the followingparameter values: relative fitness on non-Bt plants, �ss � 1, �sr �0.9, �rr � 0.7; relative fitness on Bt plants, �ss � �sr � 0, �rr �0.6; refuge size, 1 � � � 0.05 (5% refuge); and initial r allelefrequency, p0 � 0.01
a Expressed as a decimal, e.g., 0.5 released males per male in the wildis equivalent to ratio 1:2 and 0.01 is equivalent to 1:100.
Table 3. Initial r allele frequency acts as a switch between twopossible outcomes but does not determine the value of a nonzeroequilibrium frequency. These results were obtained from simula-tions with the following parameter values: relative fitness on non-Btplants, �ss � 1, �sr � 0.9, �rr � 0.7; relative fitness on Bt plants,�ss � �sr � 0, �rr � 0.6; refuge size, 1 � � � 0.05 (5% refuge);and RIDL release ratio, 0.2 (1:5 released RIDL males to males inthe wild)
Table 4. Resistant allele equilibrium frequency varies withrefuge size, with a large discontinuity at the threshold. These resultswere obtained from simulations with the following parameter val-ues: relative fitness on non-Bt plants, �ss � 1, �sr � 0.9, �rr � 0.7;relative fitness on Bt plants, �ss � �sr � 0, �rr � 0.6; initial r allelefrequency, p0 � 0.01; and RIDL release ratio 0.2 (1:5 releasedRIDL males to males in the wild)
April 2009 ALPHEY ET AL.: ENGINEERED INSECTS AND BT CROPS 723
pends on whether both (Fig. 1a), WT only (Fig. 1b)or neither (not shown) control resistance.
If the release ratio is sufÞcient (for the refuge andÞtness values) that both RIDL and WT release strat-egies reverse the spread of resistance (Fig. 1a, top),RIDL release is better at suppressing the populationthan WT release and no release (Fig. 1a, bottom). (Forparameters as in Fig. 1, the minimum sufÞcient releaseratio is 0.2916, i.e., a little 1:3.5). The direction ofchange in population size depends on the populationgrowth rate. With relatively low growth both releaseregimes can reduce the population size (Fig. 1a). Forsome higher values of population growth rate, popu-lation growth is only slowed not reversed with WTrelease, but the population decreases with RIDL re-lease (e.g., with parameter values as in Fig. 1a, thishappens where 2R0 40 instead of 16, but with p0 �0.05 and 20% refuge it occurs with 2R0 � 16). Withvery high growth rates, the pest densities can increaseunder all three regimes.
WT releases are more effective than RIDL releasesat managing resistance because s alleles are inheritedby both male and female progeny of released insects,not just through the male line as with RIDL insects.Release of wild-type insects, including fertile females,contributes to pest population growth. However, thiseffect can be mitigated by the resistance managementaspect; by reversing the spread of resistance, releaseshelp the Bt crops to be more effective at populationsuppression. If WT releases control resistance, theyinitially cause the population to decline more slowlythan with no release, but after resistance becomessubstantial (0.5 frequency), with no release the pop-ulation quickly starts to grow and no release becomesthe worst strategy in the long-term (Fig. 1a and b).
If the release ratio is too low, neither strategy con-trols resistance (for parameters as in Fig. 1, this occursfor release ratios �0.0750, i.e., 1:13.3). Population sizesare higher with inadequate WT release than withinsufÞcient RIDL release in the shorter term (whilethe Bt crops are still reducing the pest population).After resistance becomes substantial under RIDL re-lease, populations may become larger than they wouldwith WT release. If there is only a short period beforeresistance becomes widespread under WT release too,this effect might only be temporary and in the longerterm (after resistance is widespread) population sizesare again lower with RIDL releases than with WTreleases. (For example, we observed such effects withhigher p0 and larger refuge than in Fig. 1.) However,if resistance spreads signiÞcantly later with WT re-lease than with RIDL release, the further populationdecline during that period may be too great for thefemale-lethal effect of the RIDL strategy to catch upwith over a reasonable timeframe. (We observed thiswith parameters as in Fig. 1 and smaller release ratios.)Again, the population growth rate can affect whetherthe population ultimately grows or declines. In situ-ations where neither strategy controls resistance, it ispossible after resistance has spread for the populationto decline with RIDL releases but increase with WTreleases (e.g., with parameter values as in Fig. 1b
except with p0 � 0.05, 20% refuge and low growth rate2R0 � 4).
For a small range of release ratios, WT release re-verses the spread of resistance whereas RIDL releaseonly slows its spread and prevents it reaching Þxation(Fig. 1b). By controlling resistance, the combinationof WT release and Bt crops reduces the pest popula-tion effectively. With the other strategies, the popu-lation starts to grow again after resistance becomessubstantial. The value and spread of release ratios forwhich this situation arises depends on the r allelefrequency, Þtness parameters and refuge size. Withparameters as in Fig. 1, it occurs with release ratiosfrom 0.075 (�1:13.3) to 0.2916 (�1:3.5) (with p0 �0.001 and 0.5% refuge, the range is roughly 1:29Ð1:8;with p0 � 0.1 and 15% refuge, it is �1:3 to nearly 2.5:1).
We have not modeled in detail the situation whereRIDL genetic construct is not fully lethal (female � 1).In that case, the performance of the RIDL insectswould be intermediate between the fully lethal RIDL(female � 1) and WT (female � 0) releases as modeledabove, with a similar trade-off between populationsuppression and resistance management.
We stress that the proportional release policy in-herent in our model is not the only possibility. Forexample, an alternative would be to release a constantnumber of RIDL males or wild type insects at everygeneration, rather than a number proportional to thenumber of males in the current population. If thenumber released in the Þrst generation were the same,the constant policy would have a greater impact thanthe proportional policy, but success would be moreexpensive, as the release numbers do not decline withthe population size. However, the constant policywould have an advantage in terms of monitoring; alimitation of the proportional policy is that the adultmale population at each generation should be knownor predictable (but apart from pink bollworm, Pecti-nophora gossypiella (Saunders), in recent years, pop-ulations of Bt crop pests are generally highly variablein space and time), which would complicate imple-mentation in practice.
RIDL release could be used for pest control in itsown right, being a modiÞed version of the SIT, andhigher release ratios improve its effectiveness for re-sistance management. Together, these features showthat RIDL is a potential tool for remedial action wherea resistance event has occurred. Simulations con-Þrmed that RIDL release can reverse the spread ofresistance even from very high frequencies (for pa-rameter values in Fig. 2a, RIDL release at 10:1 canreverse the spread of resistance, although with a ref-uge of only 15% it takes 30 generations to return toa low value). Where p0 exceeds 0.5, RIDL releasemight cause the r allele to decline to an internal equi-librium value rather than to extinction. If the combi-nation of release ratio and refuge size are not sufÞ-ciently high, this equilibrium value can be above 0.5and so the resistance problem would not have beendealt with (Fig. 2b), or the rate of decline to extinctioncan be too slow to be of practical use. For the extensiveresistance modeled in Fig. 2b, increasing the release
724 JOURNAL OF ECONOMIC ENTOMOLOGY Vol. 102, no. 2
ratio from 5:1 to 10:1 would result in r allele frequency0.37; also increasing the refuge from 10 to 20% refugewould reduce the frequency below 0.01 in 27 gener-ations.Seasonality. Although Bt crops control pest densi-
ties initially, the population would increase rapidlyafter resistance is established, especially in an envi-ronment with no seasonal effects, whereas RIDL re-lease could suppress the population effectively andlocal elimination might result (Figs. 1 and 3). Wherelarvae in each relevant generation incur costs of over-wintering, the population suffers a step reductiononce in every year (Fig. 3). These steps can be seenin the population curves for both no release and RIDLrelease, but an overall trend in pest numbers is clearand dominates the results more than the in-year vari-ation.
Winter mortality helps to suppress the population.For example, with seasonal parameter values for pinkbollworm (Table 1), although the efÞcacy of Bt cropsis signiÞcantly reduced after resistance arises, it seemsto remain just good enough to keep pest densities incheck (Fig. 3). If individuals harboring one or more r
alleles die disproportionately in winter, then the alleleprogresses more slowly toward Þxation, or more rap-idly toward extinction, than in a nonseasonal scenario,especially bearing in mind that without any winter theinsects could have more generations per year (Fig. 3;with no release and 10% refuge, from p0 � 0.1 the rallele exceeds 0.5 in 73 generations with no seasons but96 generations with winter). Comparing the two sce-narios, the program of RIDL release has a greatereffect on the evolution of allele frequency than winterhas.
Winter seems to have little effect on the relativebeneÞt of the RIDL strategy. For example, the non-seasonal model with no release, using pink bollwormdata, has a critical proportion of Bt crops (equation 4)at 0.698, i.e., a critical refuge size of �30%; with asmaller refuge the r allele frequency will increasetoward Þxation. Simulated RIDL release at 1:5 reduces
Fig. 2. RIDL release can “clean up” extensive resistance,provided release ratio and refuge are sufÞciently high. Thegraphs show the frequency over time of the r allele for norelease (black lines) and for RIDL release (green). (a) Rel-ative Þtnesses are as follows: in refuge, �sr� 0.9, �rr� 0.4; onBt plants, �ss� 0, �sr� 0, �rr� 0.3. Initial r allele frequencyp0 � 0.6. Refuge 15%. (b) Relative Þtness values, representingnonseasonal pink bollworm data: in refuge, �sr � 0.9, �rr �0.485; on Bt plants, �ss � 0, �sr � 0, �rr � 0.223. p0 � 0.8.Refuge 10%. (Online Þgure in color.)
Fig. 3. Winter slows resistance evolution and populationgrowth but does not signiÞcantly alter the relative beneÞts ofRIDL release. The top graph shows the frequency of the rallele, and the bottom graph shows the relative populationsize, over time, for no release of insects (black lines) and fora RIDL release ratio of 1:5 (green). Parameter values rep-resent pink bollworm: relative Þtness in refuge, �sr� 1, �rr�0.485; on Bt plants, �ss � �sr � 0, �rr � 0.223; winter occursevery Þfth generation, overwinter survival 0.05, rr relativeoverwinter survival 0.29; offspring per female 2R0 � 17. Ref-uge is 10%. Initial r allele frequency p0 � 0.01. Where con-ditions are maintained year-round (thick lines), populationreduction is slower and resistance management is weakerthan where winter imposes survival penalties for all geno-types and extra Þtness costs for resistant homozygotes (thin-ner lines). (Online Þgure in color.)
April 2009 ALPHEY ET AL.: ENGINEERED INSECTS AND BT CROPS 725
that minimum refuge to 6.4%, only about a Þfth (21%)of the refuge required with no release. When over-wintering costs are taken into account, the minimumrefuge sizes are �25% for no release and 5.5% for RIDLrelease, which is also about a Þfth (22%) of the refugeneeded with no release.Dominance of resistance.With no released insects,
we can deduce what effects varying dominance ofresistance can have on the equilibrium r allele fre-quency. Increasing dominance of resistance moves therelative Þtness of heterozygotes on Bt plants �sr fur-ther from �ss and closer to �rr. Altering �sr in thatmanner, while keeping all other Þtness values con-stant, decreases the �1 critical threshold for Bt crops(equation 3) (except where costs of resistance arerecessive, in which case �1 � 0) and increases �2
(equation 4) (except where costs are dominant, whichforces �2 � 0). If the relative Þtness values are suchthat �1 � �2, greater dominance widens the range of� for which �1 � � � �2 (where heterozygotes havethe overall advantage, i.e., “marginal overdomi-nance”), and the r allele will persist and settle at aninternal equilibrium value, in some cases instead ofgoing to extinction (where � � �1 with the lowerdominance) or to Þxation (where previously �2 � �).If �1 �2, increasing dominance could change �1 and�2 sufÞciently to reverse that relationship. This wouldadd to the range of potential outcomes by making aninternal equilibrium allele frequency possible (whichonly occurs when �1 � � � �2). In summary, in-creasing dominance of resistance can change out-comes by altering thresholds and creates morepossibilities for the r allele to persist.
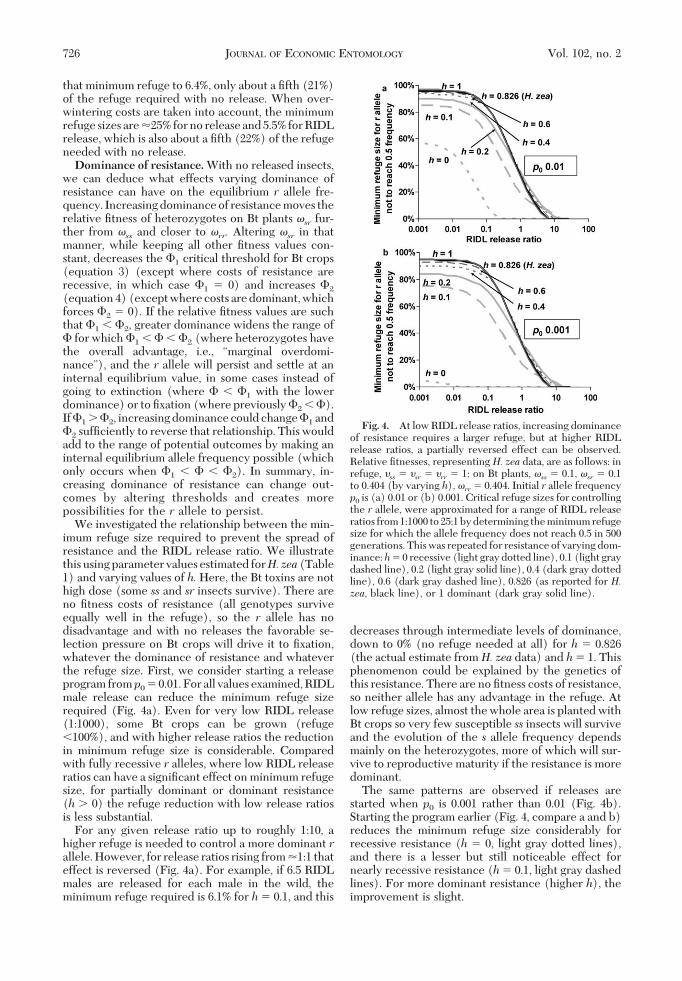
We investigated the relationship between the min-imum refuge size required to prevent the spread ofresistance and the RIDL release ratio. We illustratethis using parameter values estimated forH.zea(Table1) and varying values of h.Here, the Bt toxins are nothigh dose (some ss and sr insects survive). There areno Þtness costs of resistance (all genotypes surviveequally well in the refuge), so the r allele has nodisadvantage and with no releases the favorable se-lection pressure on Bt crops will drive it to Þxation,whatever the dominance of resistance and whateverthe refuge size. First, we consider starting a releaseprogram fromp0 � 0.01. For all values examined, RIDLmale release can reduce the minimum refuge sizerequired (Fig. 4a). Even for very low RIDL release(1:1000), some Bt crops can be grown (refuge�100%), and with higher release ratios the reductionin minimum refuge size is considerable. Comparedwith fully recessive r alleles, where low RIDL releaseratios can have a signiÞcant effect on minimum refugesize, for partially dominant or dominant resistance(h 0) the refuge reduction with low release ratiosis less substantial.
For any given release ratio up to roughly 1:10, ahigher refuge is needed to control a more dominant rallele. However, for release ratios rising from �1:1 thateffect is reversed (Fig. 4a). For example, if 6.5 RIDLmales are released for each male in the wild, theminimum refuge required is 6.1% for h� 0.1, and this
decreases through intermediate levels of dominance,down to 0% (no refuge needed at all) for h � 0.826(the actual estimate fromH. zea data) and h� 1. Thisphenomenon could be explained by the genetics ofthis resistance. There are no Þtness costs of resistance,so neither allele has any advantage in the refuge. Atlow refuge sizes, almost the whole area is planted withBt crops so very few susceptible ss insects will surviveand the evolution of the s allele frequency dependsmainly on the heterozygotes, more of which will sur-vive to reproductive maturity if the resistance is moredominant.
The same patterns are observed if releases arestarted when p0 is 0.001 rather than 0.01 (Fig. 4b).Starting the program earlier (Fig. 4, compare a and b)reduces the minimum refuge size considerably forrecessive resistance (h � 0, light gray dotted lines),and there is a lesser but still noticeable effect fornearly recessive resistance (h� 0.1, light gray dashedlines). For more dominant resistance (higher h), theimprovement is slight.
Fig. 4. At low RIDL release ratios, increasing dominanceof resistance requires a larger refuge, but at higher RIDLrelease ratios, a partially reversed effect can be observed.Relative Þtnesses, representing H. zea data, are as follows: inrefuge, �ss � �sr � �rr � 1; on Bt plants, �ss � 0.1, �sr � 0.1to 0.404 (by varying h), �rr� 0.404. Initial r allele frequencyp0 is (a) 0.01 or (b) 0.001. Critical refuge sizes for controllingthe r allele, were approximated for a range of RIDL releaseratios from1:1000 to25:1bydetermining theminimumrefugesize for which the allele frequency does not reach 0.5 in 500generations. This was repeated for resistance of varying dom-inance:h� 0 recessive (light gray dotted line), 0.1 (light graydashed line), 0.2 (light gray solid line), 0.4 (dark gray dottedline), 0.6 (dark gray dashed line), 0.826 (as reported for H.zea, black line), or 1 dominant (dark gray solid line).
726 JOURNAL OF ECONOMIC ENTOMOLOGY Vol. 102, no. 2
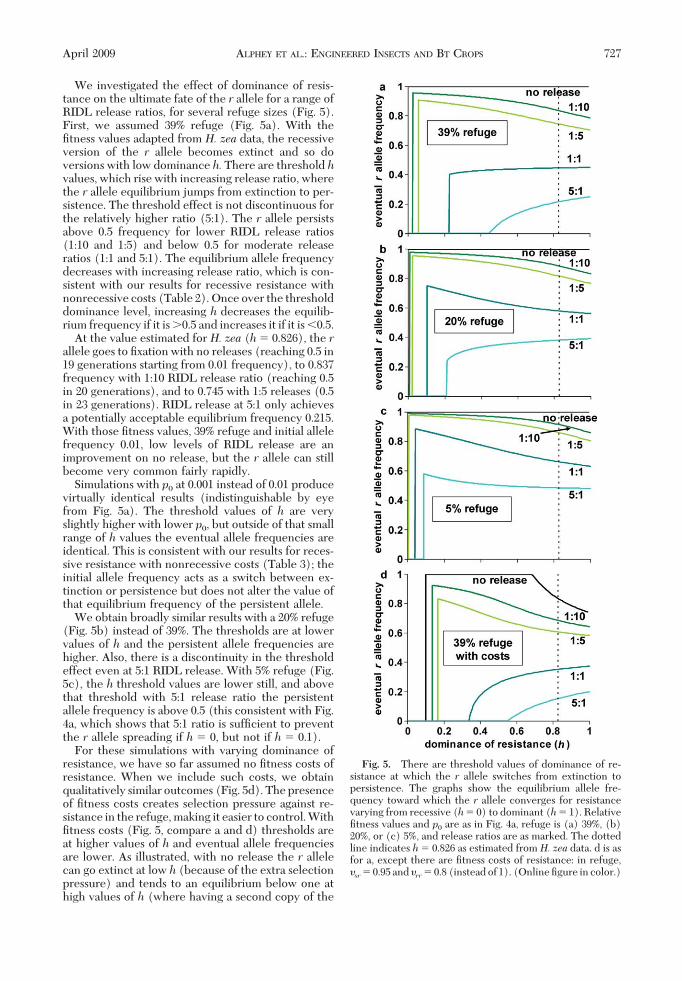
We investigated the effect of dominance of resis-tance on the ultimate fate of the r allele for a range ofRIDL release ratios, for several refuge sizes (Fig. 5).First, we assumed 39% refuge (Fig. 5a). With theÞtness values adapted from H. zea data, the recessiveversion of the r allele becomes extinct and so doversions with low dominance h. There are threshold hvalues, which rise with increasing release ratio, wherethe r allele equilibrium jumps from extinction to per-sistence. The threshold effect is not discontinuous forthe relatively higher ratio (5:1). The r allele persistsabove 0.5 frequency for lower RIDL release ratios(1:10 and 1:5) and below 0.5 for moderate releaseratios (1:1 and 5:1). The equilibrium allele frequencydecreases with increasing release ratio, which is con-sistent with our results for recessive resistance withnonrecessive costs (Table 2). Once over the thresholddominance level, increasing h decreases the equilib-rium frequency if it is 0.5 and increases it if it is �0.5.
At the value estimated for H. zea (h� 0.826), the rallele goes to Þxation with no releases (reaching 0.5 in19 generations starting from 0.01 frequency), to 0.837frequency with 1:10 RIDL release ratio (reaching 0.5in 20 generations), and to 0.745 with 1:5 releases (0.5in 23 generations). RIDL release at 5:1 only achievesa potentially acceptable equilibrium frequency 0.215.With those Þtness values, 39% refuge and initial allelefrequency 0.01, low levels of RIDL release are animprovement on no release, but the r allele can stillbecome very common fairly rapidly.
Simulations with p0 at 0.001 instead of 0.01 producevirtually identical results (indistinguishable by eyefrom Fig. 5a). The threshold values of h are veryslightly higher with lower p0, but outside of that smallrange of h values the eventual allele frequencies areidentical. This is consistent with our results for reces-sive resistance with nonrecessive costs (Table 3); theinitial allele frequency acts as a switch between ex-tinction or persistence but does not alter the value ofthat equilibrium frequency of the persistent allele.
We obtain broadly similar results with a 20% refuge(Fig. 5b) instead of 39%. The thresholds are at lowervalues of h and the persistent allele frequencies arehigher. Also, there is a discontinuity in the thresholdeffect even at 5:1 RIDL release. With 5% refuge (Fig.5c), the h threshold values are lower still, and abovethat threshold with 5:1 release ratio the persistentallele frequency is above 0.5 (this consistent with Fig.4a, which shows that 5:1 ratio is sufÞcient to preventthe r allele spreading if h � 0, but not if h � 0.1).
For these simulations with varying dominance ofresistance, we have so far assumed no Þtness costs ofresistance. When we include such costs, we obtainqualitatively similar outcomes (Fig. 5d). The presenceof Þtness costs creates selection pressure against re-sistance in the refuge, making it easier to control. WithÞtness costs (Fig. 5, compare a and d) thresholds areat higher values of h and eventual allele frequenciesare lower. As illustrated, with no release the r allelecan go extinct at low h (because of the extra selectionpressure) and tends to an equilibrium below one athigh values of h (where having a second copy of the
Fig. 5. There are threshold values of dominance of re-sistance at which the r allele switches from extinction topersistence. The graphs show the equilibrium allele fre-quency toward which the r allele converges for resistancevarying from recessive (h� 0) to dominant (h� 1). RelativeÞtness values and p0 are as in Fig. 4a, refuge is (a) 39%, (b)20%, or (c) 5%, and release ratios are as marked. The dottedline indicates h� 0.826 as estimated from H. zea data. d is asfor a, except there are Þtness costs of resistance: in refuge,�sr� 0.95 and �rr� 0.8 (instead of 1). (Online Þgure in color.)
April 2009 ALPHEY ET AL.: ENGINEERED INSECTS AND BT CROPS 727
r allele confers little or no advantage but has someextra cost, so the heterozygote has an advantage overthe resistant homozygote).
Although the equilibrium value conveys informa-tion about the evolution of r allele frequency, thepattern during the early years is of more practicalinterest. These transient dynamics follow the classicsigmoid curves evident in Figs. 1Ð3. If the r alleleexceeds 0.5 frequency, the population growth ratethen increases signiÞcantly, as illustrated in Figs. 1 and3. We investigated the effect of RIDL release ratio onthe time taken to reach 0.5 frequency for a range ofvalues of dominance of resistance. With Þtness pa-rameters adapted fromH. zea data and 5% refuge (Fig.6), a recessive r allele (h � 0) would not reach 0.5frequency with no (or any) releases, but with domi-nance h � 0.1, the frequency passes 0.5 in 29 gener-ations (from p0 � 0.001) with no release and thatperiod is reduced as dominance increases. Very lowRIDL releases have little effect on the timing, but atmoderate levels they can slow the spread of resistance.This slowing effect is less marked as dominance ofresistance increases, although greater dominance hreduces the critical release ratio with which the rallelewill not reach 0.5 frequency.
We conclude that for highly dominant resistancethe advantages of the RIDL strategy are not assubstantial as they are for recessive or nearly re-cessive resistance. As with other resistance man-agement strategies, more dominant resistance isharder to defeat.
Dominance of Fitness Costs of Resistance. Greaterdominance of Þtness costs of resistance reduces therelative Þtness of heterozygotes in the refuge (�sr)while keeping all other Þtness values constant. We cananalyze the situation with no releases. More dominantcosts raise the critical proportion of Bt crops �1 (equa-tion 3) (unless resistance is recessive, which forces�1 � 1) and lower �2 (equation 4) (unless resistanceis dominant, which makes �2 � 1). These are theoppositeof theeffects seen for increasingh.Generally,increasing dominance of Þtness costs creates fewerpossibilities for the r allele to tend to an internalequilibrium frequency and more opportunities for ex-tinction.
To illustrate this, consider an example (data for H.armigera, Table 1) where the Bt toxins are not high-dose, Þtness costs are not very dominant (g � 0.155)and the no-release critical proportions of Bt crops are�1 and �2 (to 3 decimal places) so �1 � �2. With 70%refuge (� � 0.3, so � � �1), the r allele will declineto extinction. With 39% refuge (� � 0.61 and �1 �� � �2) the r allele will tend toward an intermediateequilibrium frequency, in this case 0.224. With a 20%refuge (� � 0.8, �2 � �), the r allele will go to Þxation.If we now make the costs of resistance more dominantby lowering heterozygote Þtness in the refuge, thecritical values would change as described above. With39% refuge the r allele equilibrium frequency starts at0.349 with recessive costs of resistance (g � 0), de-creases in value with increasing g and reaches 0 wheng is 0.239. (This happens because if g� 0.239 then �1 �0.61 � �2, if 0.239 � g � 0.301 then 0.61 � �1 � �2,and if g 0.301, �2 � �1 and with p0 � 0.01 � liesbelow �3.) With 20% refuge and p0 � 0.01, the r alleleswitches from Þxation to extinction when g increasesabove 0.621 (because �3 changes from �0.8 to 0.8).These outcomes for no releases are conÞrmed by sim-ulation (black lines in Fig. 8; see below).
According to this analysis, with no releases the low-est refuge size for the r allele represented in thisexample data (H. armigera) to tend to extinction is�49.7% (so that � � �1 � 0.504). Decreasing therefuge below 49.7% at Þrst results in the r allele tend-ing toward an internal equilibrium and although thatremains below 0.5 frequency, the lower refuge sizewould still satisfy our criterion that the r allele fre-quency does not reach 0.5. Simulations show that theminimum refuge size deÞned this way is �33.7%. If theÞtness costs were instead dominant (make g � 1 bysetting �sr equal to �rr), that minimum refuge size is13.6%.
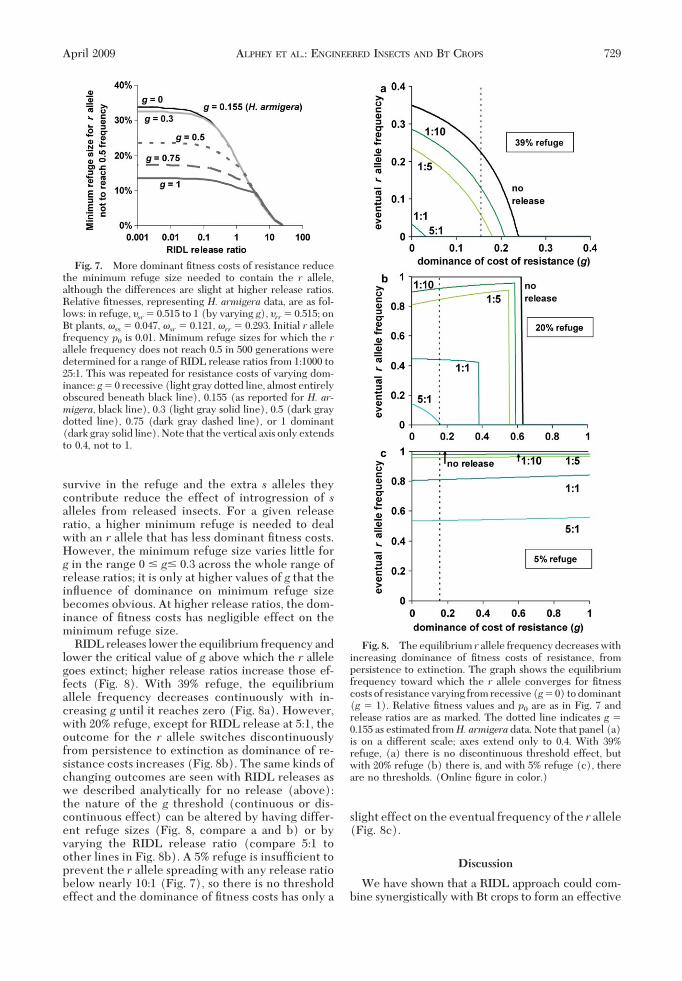
We investigated the relationship between theminimum refuge size required to prevent the spreadof resistance (starting from p0 � 0.01) and the RIDLrelease ratio, for various values of g (Fig. 7). RIDLrelease over �1:10 reduces noticeably the minimumrefuge required (at lower ratios RIDL release givesonly a marginal improvement on no release). Thereduction in minimum refuge size can be consider-able and there is more beneÞt where the costs ofresistance are less dominant. When costs of the rallele are less dominant, more heterozygous insects
Fig. 6. RIDL releases slow the spread of the r allele,with higher dominance of resistance reducing this slowingeffect but also reducing the critical release ratio that issufÞcient to stop resistance spreading. The graph showsthe number of generations after which the r allele exceeds0.5 frequency, starting from p0 � 0.001, for resistance ofvarying dominance as marked: h � 0.1 (light gray dashedline), 0.2 (light gray solid line), 0.4 (dark gray dotted line),0.6 (dark gray dashed line), 0.826 (as reported for H. zea,black line), or 1 dominant (dark gray solid line). RelativeÞtness values are as in Figs. 4 and 5. Refuge is 5%. Recessiveresistance (h � 0) is not shown, because the r allele doesnot reach 0.5 frequency regardless of releases. The RIDLrelease ratio axis is on a log scale except that the values for0 (no release) are plotted and joined to those for 0.01(1:100) by straight lines.
728 JOURNAL OF ECONOMIC ENTOMOLOGY Vol. 102, no. 2
survive in the refuge and the extra s alleles theycontribute reduce the effect of introgression of salleles from released insects. For a given releaseratio, a higher minimum refuge is needed to dealwith an r allele that has less dominant Þtness costs.However, the minimum refuge size varies little forg in the range 0 � g� 0.3 across the whole range ofrelease ratios; it is only at higher values of g that theinßuence of dominance on minimum refuge sizebecomes obvious. At higher release ratios, the dom-inance of Þtness costs has negligible effect on theminimum refuge size.
RIDL releases lower the equilibrium frequency andlower the critical value of g above which the r allelegoes extinct; higher release ratios increase those ef-fects (Fig. 8). With 39% refuge, the equilibriumallele frequency decreases continuously with in-creasing g until it reaches zero (Fig. 8a). However,with 20% refuge, except for RIDL release at 5:1, theoutcome for the r allele switches discontinuouslyfrom persistence to extinction as dominance of re-sistance costs increases (Fig. 8b). The same kinds ofchanging outcomes are seen with RIDL releases aswe described analytically for no release (above):the nature of the g threshold (continuous or dis-continuous effect) can be altered by having differ-ent refuge sizes (Fig. 8, compare a and b) or byvarying the RIDL release ratio (compare 5:1 toother lines in Fig. 8b). A 5% refuge is insufÞcient toprevent the r allele spreading with any release ratiobelow nearly 10:1 (Fig. 7), so there is no thresholdeffect and the dominance of Þtness costs has only a
slight effect on the eventual frequency of the r allele(Fig. 8c).
Discussion
We have shown that a RIDL approach could com-bine synergistically with Bt crops to form an effective
Fig. 7. More dominant Þtness costs of resistance reducethe minimum refuge size needed to contain the r allele,although the differences are slight at higher release ratios.Relative Þtnesses, representing H. armigera data, are as fol-lows: in refuge, �sr� 0.515 to 1 (by varying g), �rr� 0.515; onBt plants, �ss � 0.047, �sr� 0.121, �rr� 0.293. Initial r allelefrequency p0 is 0.01. Minimum refuge sizes for which the rallele frequency does not reach 0.5 in 500 generations weredetermined for a range of RIDL release ratios from 1:1000 to25:1. This was repeated for resistance costs of varying dom-inance: g� 0 recessive (light gray dotted line, almost entirelyobscured beneath black line), 0.155 (as reported for H. ar-migera, black line), 0.3 (light gray solid line), 0.5 (dark graydotted line), 0.75 (dark gray dashed line), or 1 dominant(dark gray solid line). Note that the vertical axis only extendsto 0.4, not to 1.
Fig. 8. The equilibrium r allele frequency decreases withincreasing dominance of Þtness costs of resistance, frompersistence to extinction. The graph shows the equilibriumfrequency toward which the r allele converges for Þtnesscosts of resistance varying from recessive (g� 0) to dominant(g � 1). Relative Þtness values and p0 are as in Fig. 7 andrelease ratios are as marked. The dotted line indicates g �0.155 as estimated fromH. armigera data. Note that panel (a)is on a different scale; axes extend only to 0.4. With 39%refuge, (a) there is no discontinuous threshold effect, butwith 20% refuge (b) there is, and with 5% refuge (c), thereare no thresholds. (Online Þgure in color.)
April 2009 ALPHEY ET AL.: ENGINEERED INSECTS AND BT CROPS 729
component of a pest management strategy. The ef-fectiveness for managing resistance can be improvedby any combination of increasing the RIDL releaseratio, commencing releases earlier (when the resistantallele is at a lower frequency) and increasing therefuge size. These measures slow the onset of resis-tance and may reverse it. Increasing the ratio of re-leased RIDL males to males in the wild also has abeneÞcial impact on the size of the pest population.
Simulated RIDL release is consistently better thanBt crops and refuge alone for both resistance man-agement and population control. Wild-type release ispredicted to be more effective for resistance manage-ment than the release of RIDL males. However, re-lease of wild type males and females has a marginallydetrimental effect on population size (and thereforeon crop damage) compared with no release, until suchtime as resistance would have become substantial withno releases (likely to be several years for most keypests targeted by Bt crops).
RIDL release could potentially achieve a consider-able reduction in the minimum refuge size required toprevent the spread of resistance. The relative beneÞtseems unaffected by environmental seasonality. Thedegree of advantage for resistance management de-pends on the Þtness parameters associated with theresistant allele and the allele frequency. Generally,RIDL is of greater beneÞt in situations that are alreadymore favorable for resistance management Ð whereresistance is rarer, is less dominant or has more dom-inant Þtness costs. Like the high-dose refuge strategyitself, RIDL release is less effective when applied todominant resistant alleles in pest populations where Btplants do not kill all susceptible individuals.
The existence of signiÞcant threshold effects arisingfrom multiple parameters highlights the need for goodinformation about the target pest population, whenplanning a resistance management strategy. The ge-netic Þtness parameters and frequency of rare (pos-sibly nonexistent) resistant alleles are difÞcult to mea-sure or estimate in practice. It would be advisable toselect a release ratio comfortably above the estimatedcritical value to avoid inaccuracy or ßuctuationsswitching the situation to one where a large frequencycould result instead of extinction.
The economic attractiveness of the RIDL strategydepends on an assessment of the costs of a releaseprogram compared with the net beneÞts of refugecosts foregone. For growers, refuges are an inter-tem-poral economic trade-off; farmers lose the short-termbeneÞts of Bt technology in the areas planted as refugein return for extending the period over which Bt plantsretain their efÞcacy (Frisvold and Reeves 2008). Es-timates of the costs of refuges vary widely and, al-though generally agreeing that some refuge is prefer-able to none, various economic studies have come toinconsistent conclusions about what refuge policieswould be optimal for grower returns. Entomologicaland economic information, both subject to uncer-tainty, are needed to assess where any particular re-gionÕs agricultural producers are on the trade-off sur-faces charting the longer-term beneÞts and costs of
refuge policies. RIDL release would add an extra di-mension to such analyses. The costs of a RIDL releaseprogram depend on factors such as pest densities (thenumber of insects released vary with population sizeand change over time) and the availability of modestspare capacity in existing SIT facilities. RIDL releaseis more likely to be implemented as an areawide pro-gram and so would be inßuenced more by regionaladoption choices than by individual growersÕ deci-sions.
There is evidence that many growers have plantedless Bt crops than permitted (Carriere et al. 2005b,Frisvold and Reeves 2008). This suggests that noneco-nomic factors are also inßuencing decisions, such ascautious adoption of new technology and a risk-averseattitude if the variance of proÞts is higher for Bt plants(Frisvold and Reeves 2008). Another possible expla-nation is a halo effect, where long-term regional pestsuppression in areas of high adoption can reduce pestpressure in the region generally, thereby generatingbeneÞts for non-Bt plants too and reducing the mar-ginal advantage of planting more Bt crops (Carriere etal. 2003, Frisvold and Reeves 2008). In such circum-stances, where mandatory refuge sizes might not ac-tually be binding constraints, a RIDL option withlower permitted refuges may not have an apparenteconomic beneÞt.
An economic case for a RIDL approach might bemore persuasive in situations where the strategies incurrentusehave failed.Potential short-termresponsesto a resistance event include additional chemical con-trol, early harvest, SIT releases and biological control(such as parasitic nematode treatments), and remedialaction the following year could include temporarycessation of cultivating the relevant Bt crop and up-ward revision of mandatory refuge sizes (Frisvold andReeves 2008). RIDL release could be added to thistoolkit and, unlike the other options available, it wouldcontribute to both reduction of pest densities anddecrease of resistant allele frequencies. For a success-ful outcome using only RIDL release and refuge ma-nipulation, it would be important to use a sufÞcientlyhigh combination of refuge and release ratio to bringthe resistant allele rapidly down to a low level.
Dynamic selection pressures and rapidly updatedand expanding technology make it impossible to for-mulate a universally optimal resistance managementstrategy. Instead, it is sensible to adopt a frameworkwithin which an appropriate mix of measures can beselected, tailored to the particular genetically modi-Þed crop and incorporated toxin(s), and the local pestspecies, economic factors, environmental conditionsand agricultural practices. For example, in the USA,for each approved crop type a few alternative refugerequirements are speciÞed, with some choice as to theposition of refuges and whether they may be sprayed,and special cases for particular geographic regions.Within this context, the addition of appropriate RIDLstrategies to the menu of options could be a sensibleextension to existing crop pest management regimes.
730 JOURNAL OF ECONOMIC ENTOMOLOGY Vol. 102, no. 2
Acknowledgments
WethankPaulColeman forcontribution to theunderlyingtheoryandsimulationmodel.Thisworkwas supportedby theUK Biotechnology and Biological Sciences Research Coun-cil. M.B.B. is a Royal Society University Research Fellow.
References Cited
Akhurst, R. J., W. James, L. J. Bird, and C. Beard. 2003.Resistance to the Cry1Ac �-Endotoxin of Bacillus thurin-giensis in the cotton bollworm, Helicoverpa armigera(Lepidoptera: Noctuidae). J. Econ. Entomol. 96: 1290Ð1299.
Ali, M. I., R. G. Luttrell, and S. Y. Young. 2006. Suscepti-bilities of Helicoverpa zea and Heliothis virescens (Lepi-doptera: Noctuidae) populations to Cry1Ac insecticidalProtein. J. Econ. Entomol. 99: 164Ð175.
Alphey, L. S. 2007. Engineering insects for the sterile insecttechnique, pp. 51Ð60. In M. Vreysen, A. Robinson, andJ. Hendrichs [eds.], Area-wide control of insect pests:from research to Þeld implementation. Springer, Dordre-cht, The Netherlands.
Alphey, L., D. Nimmo, S. O’Connell, and N. Alphey. 2007a.Insect population suppression using engineered insects.In S. Aksoy [ed.], Transgenesis and the management ofvector-borne disease. Landes Bioscience, Austin, TX.(http://www.eurekah.com/chapter/3233).
Alphey, N., P. G. Coleman, C. A. Donnelly, and L. Alphey.2007b. Managing insecticide resistance by mass releaseof engineered insects. J. Econ. Entomol. 100: 1642Ð1649.
Alphey, N., P. G. Coleman, M. B. Bonsall, and L. Alphey.2008. Proportions of different habitat types are critical tothe fateof a resistanceallele.Theor.Ecol. 1: 103Ð115. (doi:10.1007/s12080-008-0010-8).
Alstad, D. N., and D. A. Andow. 1995. Managing the evolu-tion of insect resistance to transgenic plants. Science(Wash., D.C.) 268: 1894Ð1896.
Alyokhin, A. V., and D. N. Ferro. 1999. Relative Þtness ofColorado potato beetle (Coleoptera: Chrysomelidae) re-sistant and susceptible to theBacillus thuringiensisCry3Atoxin. J. Econ. Entomol. 92: 510Ð515.
Bates, S. L., J. Z. Zhao, A. M. Shelton and R. T. Roush. 2005.Insect resistance management in GM crops: past, presentand future. Nat. Biotechnol. 23: 57Ð62. (doi:10.1038/nbt1056).
Bird,L. J., andR. J. Akhurst. 2004. Relative Þtness of Cry1A-resistant and -susceptible Helicoverpa armigera (Lepi-doptera: Noctuidae) on conventional and transgenic cot-ton. J. Econ. Entomol. 97: 1699Ð1709.
Brookes, G., and P. Barfoot. 2006. GM crops: the Þrst tenyearsÐglobal socio-economic and environmental im-pacts. ISAAA Brief no. 36. International Service for theAcquisition of Agri-biotech Applications, Ithaca, NY.
Caprio, M. A. 2001. Source-sink dynamics between trans-genic and non-transgenic habitats and their role in theevolution of resistance. J. Econ. Entomol. 94: 698Ð705.
Carriere, Y., and B. Tabashnik. 2001. Reversing insect ad-aptation to transgenic insecticidal plants. Proc. R. Soc.(Lond) B 268: 1475Ð1480.
Carriere, Y., C. Ellers-Kirk, Y. B. Liu,M. A. Sims, A. L. Patin,T. J. Dennehy, and B. E. Tabashnik. 2001a. Fitness costsand maternal effects associated with resistance to trans-genic cotton in the pink bollworm (Lepidoptera:Gelechiidae). J. Econ. Entomol. 94: 1571Ð1576.
Carriere, Y., C. Ellers-Kirk, A. L. Patin,M. A. Sims, S.Meyer,Y. B. Liu, T. J. Dennehy, and B. E. Tabashnik. 2001b.Overwintering cost associated with resistance to trans-
genic cotton in the pink bollworm (Lepidoptera:Gelechiidae). J. Econ. Entomol. 94: 935Ð941.
Carriere, Y., C. Ellers-Kirk,M. Sisterson, L. Antilla,M.Whit-low, T. J. Dennehy, and B. E. Tabashnik. 2003. Long-term regional suppression of pink bollworm by Bacillusthuringiensis cotton. Proc. Natl. Acad. Sci. U.S.A. 100:1519Ð1523. (doi: 10.1073/pnas.0436708100).
Carriere, Y., C. Ellers-Kirk, R. Biggs, B. Degain, D. Holley,C. Yafuso, P. Evans, T. J. Dennehy, and B. E. Tabashnik.2005a. Effects of cotton cultivar on Þtness costs associ-ated with resistance of pink bollworm (Lepidoptera:Gelechiidae) to Bt cotton. J. Econ. Entomol. 98: 947Ð954.(doi: 10.1002/ps.1039).
Carriere, Y., C. Ellers-Kirk, K. Kumar, S. Heuberger, M.Whitlow, L. Antilla, T. J. Dennehy, and B. E. Tabashnik.2005b. Long-term evaluation of compliance with refugerequirements for Bt cotton. Pest Manag. Sci. 61: 327Ð330.(doi: 10.1002/ps. 1039).
Comins, H. N. 1977. The development of insecticide resis-tance in the presence of migration. J. Theor. Biol. 64:177Ð197.
Dyck, V. A., J. Hendrichs, and A. S. Robinson [eds.]. 2005.Sterile insect technique: principles and practice in area-wide integrated pest management. Springer, Amsterdam,The Netherlands.
[EPA] The Environmental Protection Agency. 1998. TheEnvironmental Protection AgencyÕs white paper on Btplant-pesticide resistance management. OfÞce of Pesti-cides Programs, U.S. Environmental Protection Agency,Washington, DC.
Frisvold, G. B., and J. M. Reeves. 2008. The costs and ben-eÞts of refuge requirements: the case of Bt cotton. Ecol.Econ. 65: 87Ð97. (doi:10.1016/j.ecolecon.2007.06.002).
Fu, G., K. C. Condon, M. J. Epton, P. Gong, L. Jin, G. C.Condon, N. I. Morrison, T. H. Dafa’Alla, and L. Alphey.2007. Female-speciÞc insect lethality engineered usingalternative splicing. Nat. Biotechnol. 25: 353Ð357. (doi:10.1038/nbt1283).
Gould, F. 1998. Sustainability of transgenic insecticidal cul-tivars: integrating genetics and ecology. Annu. Rev. En-tomol. 43: 701Ð726.
Gould, F., A. Anderson, A. Jones, D. Sumerford, D. G.Heckel, J. Lopez, S. Micinski, R. Leonard, andM. Laster.1997. Initial frequency of alleles for resistance toBacillusthuringiensis toxins in Þeld populations of Heliothis vire-scens. Proc. Natl. Acad. Sci. U.S.A. 94: 3519Ð3523.
Gujar, G. T., V. Kalia, A. Kumari, B. P. Singh, A. Mittal, R.Nair, and M. Mohan. 2007. Helicoverpa armigera base-line susceptibility to Bacillus thuringiensis Cry toxins andresistance management for Bt cotton in India. J. Inver-tebr. Pathol. 95: 214Ð219.
Gutierrez, A. P., and S. Ponsard. 2006. Physiologically baseddemographics of Bt cotton-pest interactions: I. Pink boll-worm resistance, refuge and risk. Ecol. Model. 191: 346.
Huang, J., R. Hu, C. Pray, F. Qiao and S. Rozelle. 2003.Biotechnology as an alternative to chemical pesticides: acase study of Bt cotton in China. Agric. Econ. 29: 55Ð67.(doi:10.1016/S0169-5150(03)00044-6).
Huang,F.,B.R.Leonard, andD.A.Andow. 2007. Sugarcaneborer (Lepidoptera: Crambidae) resistance to transgenicBacillus thuringiensis maize. J. Econ. Entomol. 100: 164Ð171.
James, C. 2007. Global status of commercialized bio-tech/GM crops: 2007 ISAAA Brief No. 37. InternationalService for the Acquisition of Agri-biotech Applications,Ithaca, NY.
Liu, F., Z. Xu, J. Chang, J. Chen, F. Meng, Y. C. Zhu, and J.Shen. 2008. Resistance Allele frequency to Bt cotton in
April 2009 ALPHEY ET AL.: ENGINEERED INSECTS AND BT CROPS 731
Þeld populations of Helicoverpa armigera (Lepidoptera:Noctuidae) in China. J. Econ. Entomol. 101: 933Ð943.
Liu, Y. B., B. E. Tabashnik, T. J. Dennehy, A. L. Patin, M. A.Sims, S. K. Meyer, and Y. Carriere. 2001. Effects of Btcotton and Cry1Ac toxin on survival and development ofpink bollworm (Lepidoptera: Gelechiidae). J. Econ. En-tomol. 94: 1237Ð1242.
Luttrell, R.G., andM. I. Ali. 2007. Exploring selection for Btresistance in heliothines: results of laboratory and Þeldstudies, pp. 1073Ð1086. In Proceedings, Beltwide CottonConference, New Orleans, LA.
Mahon, R. J., K. M. Olsen, S. Downes, and S. Addison. 2007.Frequency of alleles conferring resistance to the Bt toxinsCry1Ac and Cry2Ab in Australian populations of Heli-coverpa armigera (Lepidoptera: Noctuidae). J. Econ. En-tomol. 100: 1844Ð1853.
Marrelli, M. T., C. K. Moreira, D. Kelly, L. Alphey, and M.Jacobs-Lorena. 2006. Mosquito transgenesis: what is theÞtness cost? TRENDS in Parasitology 22: 197Ð202. (doi:10.1016/j.pt.2006.03.004).
Ramachandran, S., G. D. Buntin, J. N. All, B. E. Tabashnik,P. L. Raymer, M. J. Adang, D. A. Pulliam, and C. N.Stewart, Jr. 1998. Survival, development, and oviposi-tion of resistant diamondback moth (Lepidoptera: Plute-llidae) on transgenic canola producing a Bacillus thurin-giensis toxin. J. Econ. Entomol. 91: 1239Ð1244.
Raymond, B., A. H. Sayyed, and D. J. Wright. 2005. Genesand environment interact to determine the Þtness costsof resistance toBacillus thuringiensis.Proc. R. Soc. B: Biol.Sci. 272: 1519Ð1524. (doi: 10.1098/rspb.2005.3103).
Reynolds, A. 2007. Why EPA thinks resistance monitoringfor Bt crops has been important and where do we go fromhere, Entomological Society of America Annual Meeting,San Diego, CA. (http://esa.confex.com/esa/2007/tech-program/paper_27964.htm).
Shelton, A.M., J. Z. Zhao, and R. T. Roush. 2002. Economic,ecological, food safety, and social consequences of thedeployment of Bt transgenic plants. Annu. Rev. Entomol.47: 845Ð881.
Sisterson, M. S., L. Antilla, Y. Carriere, C. Ellers-Kirk, andB. E. Tabashnik. 2004. Effects of insect population sizeon evolution of resistance to transgenic crops. J. Econ.Entomol. 97: 1413Ð1424.
Stodola, T. J., D. A. Andow, A. R. Hyden, J. L. Hinton, J. J.Roark, L. L. Buschman, P. Porter, and G. B. Cronholm.2006. Frequency of resistance to Bacillus thuringiensistoxin Cry1Ab in southern United States corn belt popu-lation of European corn borer (Lepidoptera: Crambi-dae). J. Econ. Entomol. 99: 502Ð507.
Tabashnik, B. E., A. L. Patin, T. J. Dennehy, Y. B. Liu, Y.Carriere, M. A. Sims, and L. Antilla. 2000. Frequency ofresistance to Bacillus thuringiensis in Þeld populations ofpink bollworm. Proc. Natl. Acad. Sci. U.S.A. 97: 12980Ð12984.
Tabashnik, B. E., T. J. Dennehy, and Y. Carriere. 2005. De-layed resistance to transgenic cotton in pink bollworm.Proc. Natl. Acad. Sci. U.S.A. 102: 15389Ð15393. (doi:10.1073/pnas.0507857102).
Tabashnik, B. E., A. J. Gassmann, D. W. Crowder, and Y.Carriere. 2008. Insect resistance to Bt crops: evidenceversus theory. Nat Biotech 26: 199Ð202. (doi:10.1038/nbt1382).
Tang, J.D.,H.L.Collins,R.T.Roush,T.D.Metz,E.D.Earle,and A. M. Shelton. 1999. Survival, weight gain, and ovi-position of resistant and susceptible Plutella xylostella(Lepidoptera: Plutellidae) on broccoli expressingCry1Ac toxin of Bacillus thuringiensis. J. Econ. Entomol.92: 47Ð55.
Thomas, D. D., C. A. Donnelly, R. J.Wood, and L. S. Alphey.2000. Insect population control using a dominant, re-pressible, lethal genetic system. Science (Wash., D.C.)287: 2474Ð2476.
Wallace, B. 1968. Topics in population genetics. Norton,New York.
Received 17 July 2008; accepted 3 November 2008.
732 JOURNAL OF ECONOMIC ENTOMOLOGY Vol. 102, no. 2