Combining Quantitative and Qualitative Methods in Assessing Chronic Poverty: The Case of Rwanda Article (Unspecified) http://sro.sussex.ac.uk Howe, Gerard and Mckay, Andrew (2007) Combining Quantitative and Qualitative Methods in Assessing Chronic Poverty: The Case of Rwanda. World Development, 35 (2). pp. 197-211. ISSN 0305-750X This version is available from Sussex Research Online: http://sro.sussex.ac.uk/1498/ This document is made available in accordance with publisher policies and may differ from the published version or from the version of record. If you wish to cite this item you are advised to consult the publisher’s version. Please see the URL above for details on accessing the published version. Copyright and reuse: Sussex Research Online is a digital repository of the research output of the University. Copyright and all moral rights to the version of the paper presented here belong to the individual author(s) and/or other copyright owners. To the extent reasonable and practicable, the material made available in SRO has been checked for eligibility before being made available. Copies of full text items generally can be reproduced, displayed or performed and given to third parties in any format or medium for personal research or study, educational, or not-for-profit purposes without prior permission or charge, provided that the authors, title and full bibliographic details are credited, a hyperlink and/or URL is given for the original metadata page and the content is not changed in any way.
Transcript
Combining Quantitative and Qualitative Methods in Assessing Chronic Poverty: The Case of Rwanda
Article (Unspecified)
http://sro.sussex.ac.uk
Howe, Gerard and Mckay, Andrew (2007) Combining Quantitative and Qualitative Methods in Assessing Chronic Poverty: The Case of Rwanda. World Development, 35 (2). pp. 197-211. ISSN 0305-750X
This version is available from Sussex Research Online: http://sro.sussex.ac.uk/1498/
This document is made available in accordance with publisher policies and may differ from the published version or from the version of record. If you wish to cite this item you are advised to consult the publisher’s version. Please see the URL above for details on accessing the published version.
Copyright and reuse: Sussex Research Online is a digital repository of the research output of the University.
Copyright and all moral rights to the version of the paper presented here belong to the individual author(s) and/or other copyright owners. To the extent reasonable and practicable, the material made available in SRO has been checked for eligibility before being made available.
Copies of full text items generally can be reproduced, displayed or performed and given to third parties in any format or medium for personal research or study, educational, or not-for-profit purposes without prior permission or charge, provided that the authors, title and full bibliographic details are credited, a hyperlink and/or URL is given for the original metadata page and the content is not changed in any way.
This paper argues for the importance of, and opportunity provided by, combining qualitative and quantitative methods, and their corresponding disciplinary perspectives, in analysing chronic or persistent poverty. Quantitative analysis to date has been based on longitudinal or panel survey data, and mostly on income measures, but this analysis only provides a partial picture of chronic poverty and in any case is not feasible in the large number of countries which do not have panel data. Qualitative analysis often stresses the diversity of experiences of poverty, and highlights some of the processes underlying it, but does not provide information on magnitudes and patterns of chronic poverty. Our understanding of chronic poverty can be considerably enriched by integrating qualitative and quantitative information and tools from the beginning. This paper illustrates this for the case of Rwanda using a good quality participatory poverty assessment in conjunction with a single round household survey, using the qualitative study in its own right and in directing the quantitative analysis to build this understanding of chronic poverty.
Combining Quantitative and Qualitative Methods in Assessing Chronic Poverty: The Case of Rwanda
1. Introduction Our intention in writing this paper is to demonstrate the value, as well as the need, of employing a multidisciplinary approach to the analysis of chronic poverty in Rwanda. In doing so we aim to promote sound and useful poverty analysis (Ravallion, 2001). We understand multidisciplinarity as set out by Kanbur (2002), allowing different disciplines to ‘do their best’, making use of the best of each discipline and using those results to create a richer and more useful dialogue and synthesis. The problem that this allows us to explore is a current lack of understanding of chronic or persistent poverty (Hulme, Moore and Shepherd, 2001) in Rwanda. A specific focus on chronic poverty is important both for the understanding of poverty, with the persistent nature of much deprivation being a key message in most qualitative poverty assessments, but it is important also for policy responses, (McCulloch and Baulch, 2000), often predominantly informed by quantitative analysis. This paper sets out the initial results of a dialogue which we see as only possible through an approach marked by respect for validity, rigor and complementarity between disciplines. We do not seek in this paper to verify between differing methods’. As argued by Appleton and Booth (2001) in the case of Uganda, this is often not appropriate because the questions each addresses are different. In our approach we encounter tensions and argue that those tensions further illuminate the discussion, dialogue and approach. At a methodological level much analysis of chronic poverty to date has been based on quantitative data, in particular using panel data sets (Baulch and Hoddinott, 2000; McKay and Lawson, 2003). While this has been very informative, it also suffers from significant limitations, in terms of the level of understanding it provides of the factors and processes underlying chronic poverty; the short time periods it typically focuses on; and its susceptibility to measurement error. As such there is a strong case for combining qualitative and quantitative methods to understand the extent, pattern and nature of chronic poverty. In the case of Rwanda – as with many other countries – the absence of panel data and the importance of the issue of chronic poverty means that a different approach is essential. We argue in this paper that in this case combining qualitative insights from a participatory poverty assessment and quantitative information from a single round household survey offers substantial additional insights on chronic poverty over each individually. Further, this argument is likely to apply more generally in the understanding and analysis of chronic poverty. This paper is structured as follows. The following section discusses the concept of chronic poverty, among other things trying to set out the case to build further on insights based on appropriate participatory poverty assessments and household surveys to enable a multi-disciplinary approach. Section 3 then provides relevant background information on Rwanda, focusing in particular on recently available qualitative and quantitative information on poverty and setting out the intuition that suggests the likely widespread extent of chronic poverty there. Following this, the paper then discusses the approach used to identify a core group of chronic poor in section 4, and assesses the robustness of
1
the approach relative to other possible methods in section 5. This then leads into a discussion in section 6 of the characteristics of those that have been identified as chronically poor, and shows that this core chronic poor group have important distinct characteristics that differentiate them from other poor households. Section 7 concludes, focusing particularly on the value of a combined qualitative and quantitative approach in assessing chronic poverty.
2. Understandings of chronic poverty Chronic poverty is generally understood as poverty that persists over a long period of time, which in different instances may be several years, a generation or several generations; its key feature is an inability to escape in any reasonable time horizon. The key point about chronic poverty is its past and perceived future persistence. Chronic poverty contrasts with transitory poverty where individuals and households move into and out of poverty over time, depending on factors such as the state of the harvest, prices or opportunities for wage labour. Different policy responses are likely to be appropriate to these two types of poverty (Hulme and Shepherd, 2003) – even though it may be difficult to make this differentiation precisely in practice. The difficulty for many people of escaping from poverty and its persistence is an issue that features strongly in many participatory poverty assessments. In the Rwandan PPA (Government of Rwanda, 2001) participants described the ‘ever vulnerable’ as those ‘persistently in poverty’, with no means to change and who require direct assistance. Despite this, to date, discussion and analysis of chronic poverty have tended to rely on quantitative methods, using longitudinal or panel household survey data and income poverty. The focus on income poverty is understandable given that such measures of wellbeing tend to be volatile, so that measures at a single point in time do not capture dynamics well. This contrasts with several other aspects of well being where one off measures often can provide more insight about the past, including illiteracy, stunting and ownership of different categories of assets. However, panel data typically cover relatively short time periods (generally a few years) and involve a limited number of waves (typically two or three observations). And the links between poverty persistence over horizons of a few years and those over substantially longer periods – a key aspect of chronic poverty – are not known. In addition, such panel data sets do not provide information about poverty status in the periods in between the years when households are observed. Another significant issue is the effect of measurement error1. This becomes important in analysing panel data, in that measurement error at the individual household level is often substantial. To the extent that this is idiosyncratic (random) measurement error, the volatility in income or consumption will be exaggerated, such that, without appropriate corrections for measurement error, a higher proportion of poverty appears to be transitory than is actually the case. Corrections for the effects of measurement error are sometimes made, but are necessarily imprecise.
1 Attrition is also another important issue in the analysis of panel data, though perhaps less important over the short time horizons typically considered for this purpose.
2
In addition, panel data are only available relatively rarely. For all of these reasons interest has focused on using quantitative indicators available at a point in time as proxies for chronic poverty. In particular attention has focused on poverty severity or multidimensionality. While there are intuitive reasons for these proxies (and they sometimes appear to work quite well; Okidi and McKay, 2003), there may still be significant mobility among the severe poor as appeared to be the case for some households in the Kwa-Zulu Natal panel data set in South Africa (Aliber, 2003). In other words, the reliability of these proxies is not guaranteed. Further, moving beyond the income dimension and quantitative measures is important in seeking to capture better the multidimensionality of poverty and its dynamics as described and understood by individuals. Drawing on qualitative studies in considering chronic poverty is therefore important and necessary. There are a number of ways in which this can potentially done, including life history studies or longitudinal village studies. Some – though by no means all – participatory poverty assessments (PPAs) also offer a valuable opportunity.2 In a number of PPAs, including the one for Rwanda used in this paper, respondents identify different categories among the poor; and stress the dynamic nature of poverty whereby some people move in and out while others are trapped in poverty. Moreover, PPAs often help provide understanding of the causal and contextual factors underlying these different types of poverty, as well as the characteristics of these different categories of the poor. Such findings are important in providing guidance for policy. But they do not provide a basis for estimating the extent and geographic distribution of chronic poor, nor do they necessarily allow an analysis of other possible relevant factors not directly highlighted in the PPA. In seeking to draw from a broader range of sources in thinking about chronic poverty, a livelihoods framework (Ellis, 2000) may offer a useful approach (Hulme, Moore and Shepherd, 2001), which also captures the key dynamic issues. Livelihood strategies can be seen in terms of assets (financial, human, natural, physical and social capital); factors modifying access (social relations, institutions and organisations); and contextual factors (trends and shocks – economic, physical, social etc.). Hulme et al (2001, Table 5) develop a broader framework in terms of a wider range of categories of what can loosely be referred to as “assets” (including now psychological, political and security assets), and discuss their relevance for the chronic poor. This framework also makes clearer the links between chronic poverty and conflict or its consequences. This is clearly of critical relevance in Rwanda, not just because of the devastating consequences of the genocide and civil war, but also continued internal and cross border insecurity in the five years or so afterwards as well as the continuing legacy since. The consequences of this for chronic poverty can be understood in terms of the destruction of a wide range of assets (not just Hulme et al’s security and political assets), many of which can be rebuilt only slowly if at all. But the relationship between chronic poverty and conflict is almost certainly a two way, with chronic poverty itself potentially being an important factor underlying conflict. Chronic poverty reflects a lack of assets, but also the outcome of processes that exclude. Importantly, it is apparent that much of the analysis and perceptions outlined in qualitative work readily lends itself to this framework. For example, social pressures are often of particular importance, with some of the chronic poor often been seen by others, 2 For instance, the analysis conducted in this paper would not be possible based on the widely-quoted Uganda Participatory Poverty Assessment.
3
including other poor households, as undeserving or responsible for their own plight. For example the Rwanda PPA describes the most vulnerable in the following terms; He is weak and often stays by him/herself. People confirm that the most vulnerable has no land, no resources, food or scarcely eats and seeks help. He looks is dressed like a fool, in brief he/she has nothing. The most vulnerable cannot afford cash to pay the children’s education, is characterised by ignorance, is not respected and is discriminated’. White (2002) makes a similar comment in respect of the hawa watu in Tanzania (p518). The focus on social process and context and exploring understandings of persistent poverty adds an important aspect to a discussion of chronic poverty. Therefore the framework argues strongly for combining qualitative and quantitative approaches in thinking about chronic poverty and offers the scope to link with perspectives from other disciplines and traditions (e.g. social exclusion), although this paper will not focus on this. Many aspects of chronic poverty, and especially the understanding of the social processes that underlie persistent exclusion or deprivation, are only amenable to a qualitative analysis. But the quantitative approach is of value in understanding the extent of access to some key assets (e.g. land or human capital) and the returns that different individuals are able to earn from these assets. If an appropriate methodology for identifying the chronic poor can be developed, a quantitative approach also offers the opportunity of understanding the extent and patterns of chronic poverty, as well as some of the characteristics of those that are chronically poor. We argue here that an appropriate methodology for quantitative work is one that draws insight and understanding from qualitative work.
3. Poverty in Rwanda Rwanda is one of the poorest countries in the world, ranked 158th out of 175 countries in terms of its HDI and 153rd out of the same 175 countries in terms of per capita GDP in PPP US$ (UNDP, 2003). It is most well known for the genocide the country experienced in the Spring of 1994. The violent legacy of the genocide, civil war, an authoritarian state and a decade of economic decline has been compounded in recent years by continuing regional instability, a highly vulnerable rural majority, political and social fragility, extreme environmental degradation, the highest population density in Africa, high levels of inequality, an emerging HIV/AIDS epidemic, severe skills shortages and severely limited market and trade links. Recent evidence on poverty in Rwanda comes from two main sources: an integrated household survey (EICV) carried out between 1999 and 2001, and a nationwide participatory poverty assessment (PPA) undertaken in 2001. Based on the survey data, 60.3% of the population are identified as being poor relatively to a fairly austere poverty line; with 97.5% of the poor living in rural areas compared to 89.5% of the population. 40% of then population are classed as being in extreme poverty (Table 1; Government of Rwanda, 2002). A recent World Bank Poverty Assessment (World Bank, 2003) estimates that GNI per capita today is 25-30% lower today due to the genocide3.
3 Whether such a calculation can ever be meaningful is a serious and deep question, but in any case it fails to take account of the fact that the genocide was a horrific culmination of processes that had been underway for several years beforehand.
4
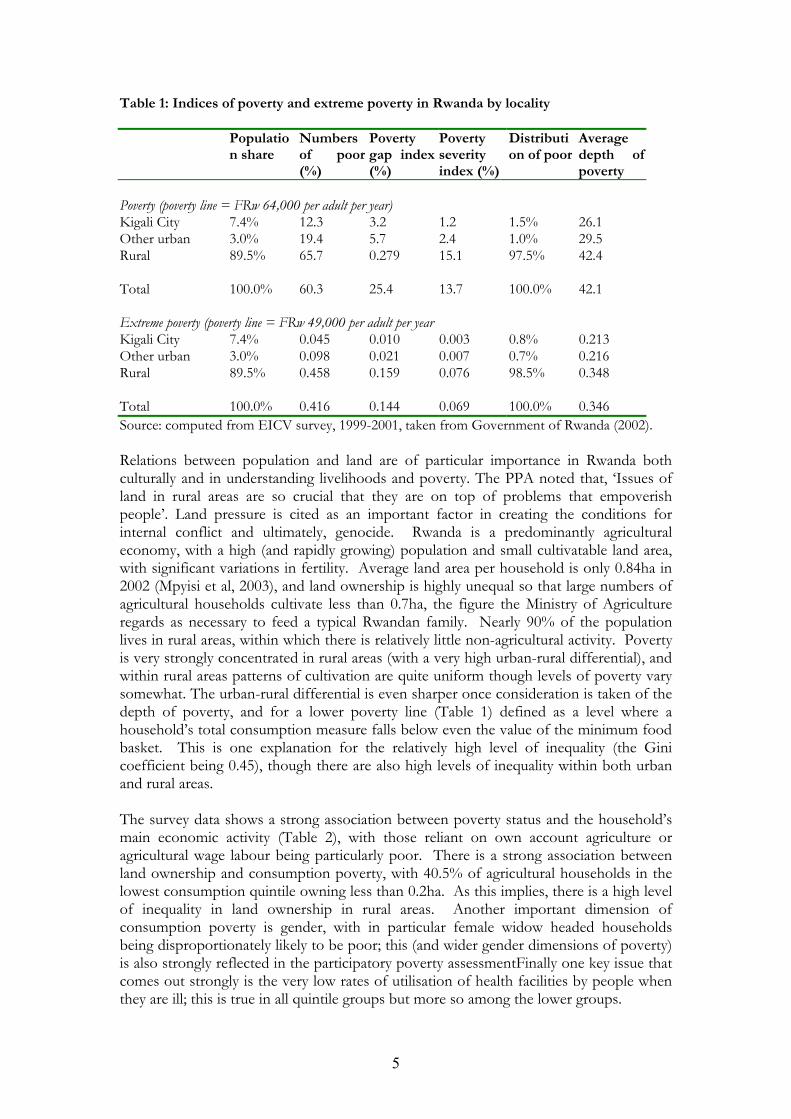
Table 1: Indices of poverty and extreme poverty in Rwanda by locality
Population share
Numbers of poor (%)
Poverty gap index (%)
Poverty severity index (%)
Distribution of poor
Average depth of poverty
Poverty (poverty line = FRw 64,000 per adult per year) Kigali City 7.4% 12.3 3.2 1.2 1.5% 26.1 Other urban 3.0% 19.4 5.7 2.4 1.0% 29.5 Rural 89.5% 65.7 0.279 15.1 97.5% 42.4 Total 100.0% 60.3 25.4 13.7 100.0% 42.1 Extreme poverty (poverty line = FRw 49,000 per adult per year Kigali City 7.4% 0.045 0.010 0.003 0.8% 0.213 Other urban 3.0% 0.098 0.021 0.007 0.7% 0.216 Rural 89.5% 0.458 0.159 0.076 98.5% 0.348 Total 100.0% 0.416 0.144 0.069 100.0% 0.346
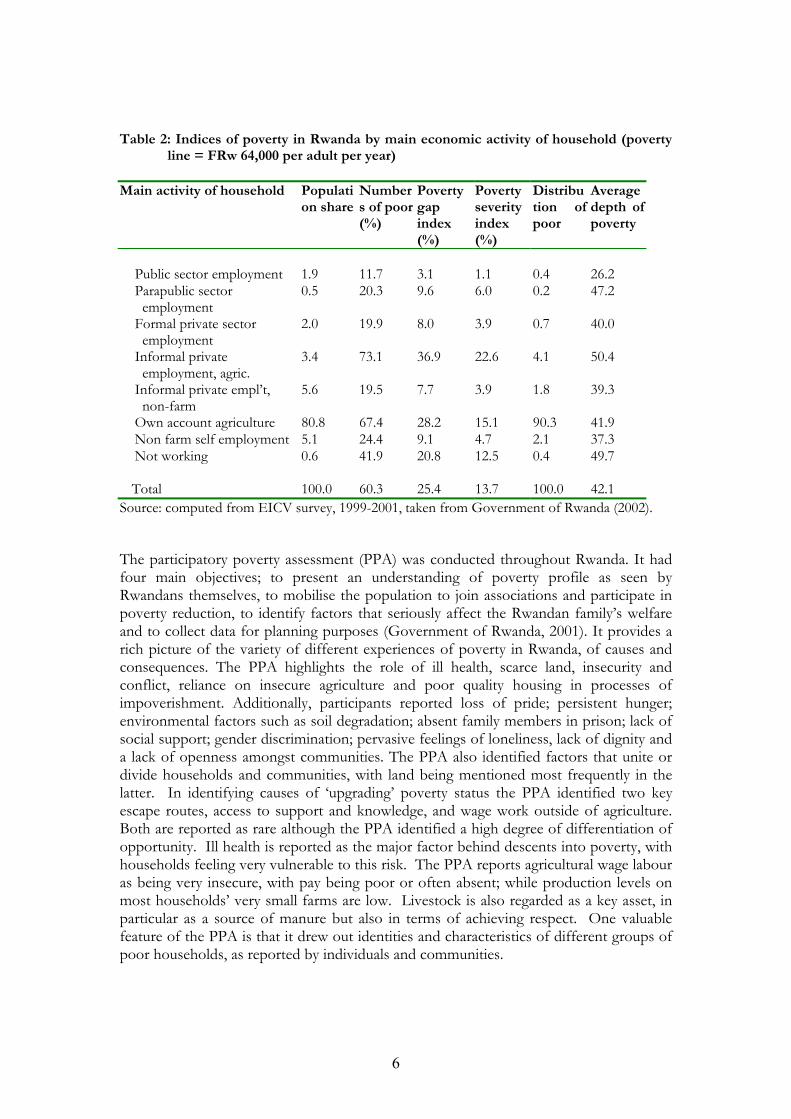
Source: computed from EICV survey, 1999-2001, taken from Government of Rwanda (2002). Relations between population and land are of particular importance in Rwanda both culturally and in understanding livelihoods and poverty. The PPA noted that, ‘Issues of land in rural areas are so crucial that they are on top of problems that empoverish people’. Land pressure is cited as an important factor in creating the conditions for internal conflict and ultimately, genocide. Rwanda is a predominantly agricultural economy, with a high (and rapidly growing) population and small cultivatable land area, with significant variations in fertility. Average land area per household is only 0.84ha in 2002 (Mpyisi et al, 2003), and land ownership is highly unequal so that large numbers of agricultural households cultivate less than 0.7ha, the figure the Ministry of Agriculture regards as necessary to feed a typical Rwandan family. Nearly 90% of the population lives in rural areas, within which there is relatively little non-agricultural activity. Poverty is very strongly concentrated in rural areas (with a very high urban-rural differential), and within rural areas patterns of cultivation are quite uniform though levels of poverty vary somewhat. The urban-rural differential is even sharper once consideration is taken of the depth of poverty, and for a lower poverty line (Table 1) defined as a level where a household’s total consumption measure falls below even the value of the minimum food basket. This is one explanation for the relatively high level of inequality (the Gini coefficient being 0.45), though there are also high levels of inequality within both urban and rural areas. The survey data shows a strong association between poverty status and the household’s main economic activity (Table 2), with those reliant on own account agriculture or agricultural wage labour being particularly poor. There is a strong association between land ownership and consumption poverty, with 40.5% of agricultural households in the lowest consumption quintile owning less than 0.2ha. As this implies, there is a high level of inequality in land ownership in rural areas. Another important dimension of consumption poverty is gender, with in particular female widow headed households being disproportionately likely to be poor; this (and wider gender dimensions of poverty) is also strongly reflected in the participatory poverty assessmentFinally one key issue that comes out strongly is the very low rates of utilisation of health facilities by people when they are ill; this is true in all quintile groups but more so among the lower groups.
5
Table 2: Indices of poverty in Rwanda by main economic activity of household (poverty
Own account agriculture 80.8 67.4 28.2 15.1 90.3 41.9 Non farm self employment 5.1 24.4 9.1 4.7 2.1 37.3 Not working
0.6 41.9 20.8 12.5 0.4 49.7
Total 100.0 60.3 25.4 13.7 100.0 42.1
Source: computed from EICV survey, 1999-2001, taken from Government of Rwanda (2002).
The participatory poverty assessment (PPA) was conducted throughout Rwanda. It had four main objectives; to present an understanding of poverty profile as seen by Rwandans themselves, to mobilise the population to join associations and participate in poverty reduction, to identify factors that seriously affect the Rwandan family’s welfare and to collect data for planning purposes (Government of Rwanda, 2001). It provides a rich picture of the variety of different experiences of poverty in Rwanda, of causes and consequences. The PPA highlights the role of ill health, scarce land, insecurity and conflict, reliance on insecure agriculture and poor quality housing in processes of impoverishment. Additionally, participants reported loss of pride; persistent hunger; environmental factors such as soil degradation; absent family members in prison; lack of social support; gender discrimination; pervasive feelings of loneliness, lack of dignity and a lack of openness amongst communities. The PPA also identified factors that unite or divide households and communities, with land being mentioned most frequently in the latter. In identifying causes of ‘upgrading’ poverty status the PPA identified two key escape routes, access to support and knowledge, and wage work outside of agriculture. Both are reported as rare although the PPA identified a high degree of differentiation of opportunity. Ill health is reported as the major factor behind descents into poverty, with households feeling very vulnerable to this risk. The PPA reports agricultural wage labour as being very insecure, with pay being poor or often absent; while production levels on most households’ very small farms are low. Livestock is also regarded as a key asset, in particular as a source of manure but also in terms of achieving respect. One valuable feature of the PPA is that it drew out identities and characteristics of different groups of poor households, as reported by individuals and communities.
6
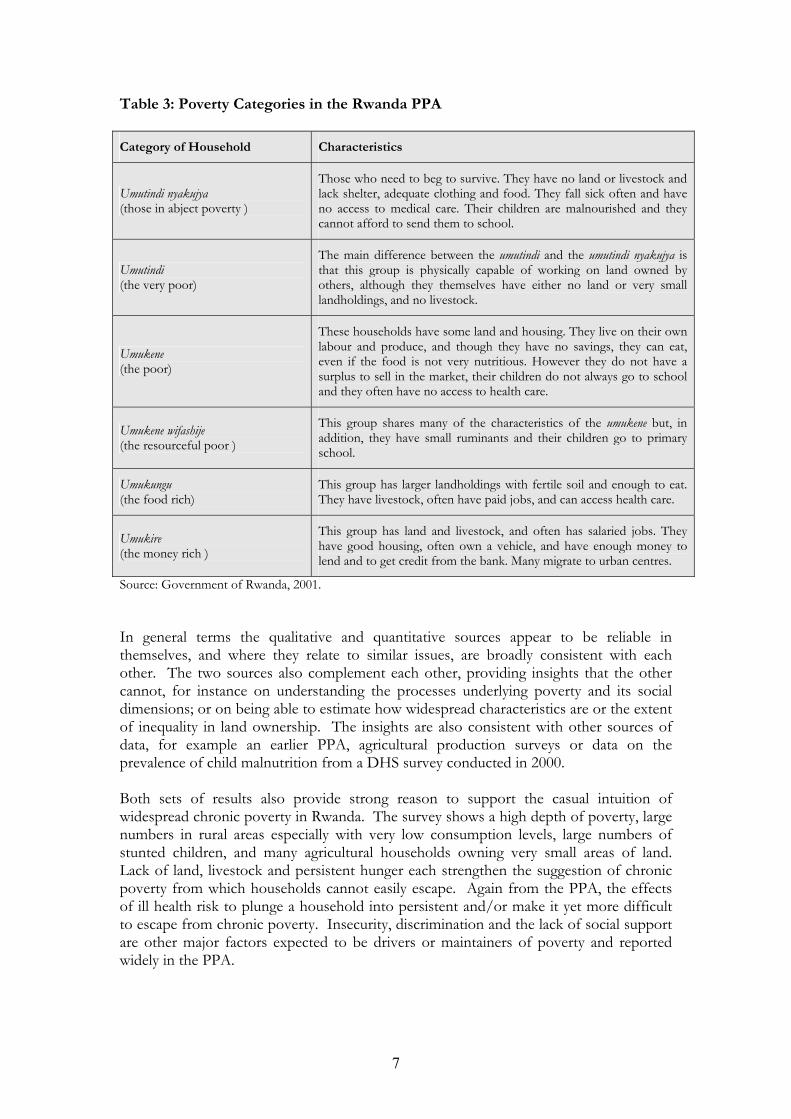
Table 3: Poverty Categories in the Rwanda PPA
Category of Household Characteristics
Umutindi nyakujya (those in abject poverty )
Those who need to beg to survive. They have no land or livestock and lack shelter, adequate clothing and food. They fall sick often and have no access to medical care. Their children are malnourished and they cannot afford to send them to school.
Umutindi (the very poor)
The main difference between the umutindi and the umutindi nyakujya is that this group is physically capable of working on land owned by others, although they themselves have either no land or very small landholdings, and no livestock.
Umukene (the poor)
These households have some land and housing. They live on their own labour and produce, and though they have no savings, they can eat, even if the food is not very nutritious. However they do not have a surplus to sell in the market, their children do not always go to school and they often have no access to health care.
Umukene wifashije (the resourceful poor )
This group shares many of the characteristics of the umukene but, in addition, they have small ruminants and their children go to primary school.
Umukungu (the food rich)
This group has larger landholdings with fertile soil and enough to eat. They have livestock, often have paid jobs, and can access health care.
Umukire (the money rich )
This group has land and livestock, and often has salaried jobs. They have good housing, often own a vehicle, and have enough money to lend and to get credit from the bank. Many migrate to urban centres.
Source: Government of Rwanda, 2001.
In general terms the qualitative and quantitative sources appear to be reliable in themselves, and where they relate to similar issues, are broadly consistent with each other. The two sources also complement each other, providing insights that the other cannot, for instance on understanding the processes underlying poverty and its social dimensions; or on being able to estimate how widespread characteristics are or the extent of inequality in land ownership. The insights are also consistent with other sources of data, for example an earlier PPA, agricultural production surveys or data on the prevalence of child malnutrition from a DHS survey conducted in 2000. Both sets of results also provide strong reason to support the casual intuition of widespread chronic poverty in Rwanda. The survey shows a high depth of poverty, large numbers in rural areas especially with very low consumption levels, large numbers of stunted children, and many agricultural households owning very small areas of land. Lack of land, livestock and persistent hunger each strengthen the suggestion of chronic poverty from which households cannot easily escape. Again from the PPA, the effects of ill health risk to plunge a household into persistent and/or make it yet more difficult to escape from chronic poverty. Insecurity, discrimination and the lack of social support are other major factors expected to be drivers or maintainers of poverty and reported widely in the PPA.
7
4. Combining qualitative and quantitative methods to identify chronically poor households in Rwanda This paper builds on information from the PPA and the different categories it identifies according to reported perceptions of poverty status. We then seek to apply this to the survey data in order to allow a more detailed consideration of characteristics (for example by location or demographic characteristics) as well as judgement about the quantitative importance of chronic poverty in Rwanda. As shown above, respondents to the PPA in all localities clearly and consistently make what they consider meaningful distinctions in the local language (kinyarwanda) between different categories of the poor and non-poor. Respondents describe the characteristics of these categories in some detail though of course the precise characteristics that are mentioned vary from case to case. Those reported in Table 3 above focus on characteristics that are reported most frequently and across most of the country. The first four categories are clearly poor while the fifth and sixth are not. In the categories, the first two, the umutindi nyakujya and the umutindi correspond to concepts of chronic poverty, in terms of persistence attributed to these groups in the PPA, and to the livelihood framework described earlier. Whether or not the umukene should be considered as chronically poor is perhaps more an issue of debate; persistence is still mentioned by PPA participants in relation to this group and several of the characteristics are ones corresponding to concepts of chronic poverty discussed by Hulme et al (2001) or possessed by the chronic poor identified by panel data typically in other similar countries, such as Uganda. The fourth category, the umukene witashije are predominantly not chronically poor. Some of the distinctions between the groups are not clear at the margin, given some similarity in certain characteristics across groups. But there does seem to be a clear distinction drawn in meaningful and consistent terms between the umukene and the umukene witashije. We interpret this as the boundary between chronic and transitory poverty. Thus, we argue that the first three categories correspond to the chronic poor as identified by the PPA, though we cannot claim a one to one mapping between these concepts; in particular some of the umukene category might be better considered as among the transitory poor. We also argue that the consistency of response shown across the PPA in defining these groups means that this information can be ‘generalised’ to lend itself for the combination with other representative data and is therefore a crucial building block (Hentschel, 2001). There are important limits to the extent to which matching these first three categories to the survey can be achieved with confidence. To start with, the first group, the umutindi nyakujya, will generally not be covered in the household survey as they are described as being characterised by lack of shelter ; “[ They ] have no support at all. Most of them live in others houses, the rest still stay in buildings devoted to public activities or stay in small huts” and so are unlikely to be covered in a conventional household survey. Second, while many of the characteristics used to describe the groups are available from the survey questionnaire, others are not or are not easily interpreted in terms of the information in the survey (e.g. “eat badly”), while other characteristics may be not applicable for some households (e.g. school attendance for households without school age children). Third some important characteristics overlap across the groups, partly because the distinctions are not easily expressed in precise terms and different communities may legitimately have different understandings of the distinction between
8
umutindi and umukene say. For instance in either of these groups, household members may work for others, have a small amount of land or not send their children to school. For this reason, we seek to identify households that are either umutindi or umukene without seeking to distinguish them. A number of issues will arise in trying to identify this group of households in the survey. Obviously this can only focus on characteristics in the PPA on which information is available in the survey, but that still provides many characteristics common to both: economic activity; ownership of land and livestock; use of education and health facilities; food consumption levels; housing quality; keeping seeds. If we require households in the survey to possess too many of these characteristics, then this risks identifying only a very small number of households, who are undoubtedly chronically poor. If we require too few then this may risk including households that are not in fact chronically poor even if deprived according to one criterion. Thus there is a trade off between type one and type two errors (as in statistical hypothesis testing) in applying this classification (cf. Cornia and Stewart, 1995). A second issue noted above is that some characteristics are relevant only for a subgroup of households; it is not possible to assess whether a household used health care facilities unless a member was sufficiently ill over the time horizon covered by the survey for this to be relevant. Thus it will not be possible to identify this group of umutindi plus umukene comprehensively from the survey. It is necessary therefore to choose criteria on which this identification can be made. The criteria that we have used are those that are consistently reported in the PPA as being the most important characteristics of the umutindi and umukene, which are meaningful for all households in this category and which offer the possibility of definition in more precise terms. The criteria are as follows:
(i) The household’s main activity is own account agriculture; agricultural wage labour; informal non-agricultural wage labour in rural areas only; or none (i.e. no-one in the household works); and
(ii) The household cultivates less than 0.2ha; and (iii) The household does not own any of the following livestock: cattle, sheep,
pigs or goats. The PPA repeatedly highlights the dependence of these poor groups on working for others; “From the poor downwards, we have people who mostly live working on others’ farms” or on very marginal household farming activities, while others may not work at all – particularly the umutindi nyakujya.4 Cultivating a small area is also repeatedly mentioned; ‘the category of those considered most vulnerable has no land at all. The umukene has people with small land who say that even all the agricultural inputs were made available the products could not make the household survive’. Having no or only minor livestock is similarly stressed in PPA as an important characteristic of the poorest two groups and relates importantly to land; ‘She is characterised by low harvest because of his/her small land with no livestock to bring manure’. These issues are relevant to almost all rural residents given that they almost all rely on agricultural activity in some form or other, as well as some (semi) urban residents.
4 The information on main economic activity could be used as the basis for seeking to distinguish between the umutindi and the umukene, but as this is not the main focus of this paper we do not pursue this. Later though we will compare those reliant on agricultural wage labour with those enaged in small-scale own account agriculture.
9
Interpretation of these criteria in specific terms is highly subjective; we have chosen 0.2ha as this represents very marginal cultivation, and in applying the livestock criterion have not excluded the possibility that households that are clearly chronically poor according to other criteria might still possess low value livestock that do not produce manure, such as poultry or rabbits. This obviously does not take into account of land quality, frequently mentioned in the PPA and of which there are large variations (hilltops, steep slopes and valley bottoms), but we do not have the information to assess this. Given these criteria the focus will implicitly be more on rural poverty, where the vast majority of poverty is found and also where the PPA criteria are more meaningfully interpreted, but it will also cover relevant forms of urban poverty (the non-working and those engaged in marginal agricultural livelihoods). In adopting this definition, we have chosen not to use the level of food expenditure, not because perpetual hunger is not a major aspect of chronic poverty (the PPA strongly confirms this) but rather because of a concern that, at the lower end of the distribution, food expenditure may be underestimated. However, in the next section we compare the group identified above with those with low levels of food expenditure and other criteria that have not been used to assess the extent of chronic poverty. The above criterion is a strict definition of chronic poverty due to the multiple criteria it imposes, and thus excludes many people that should rightly be considered as chronically poor. The PPA is not necessarily saying that households in the different groups have all the characteristics used to describe them; rather they are typical characteristics that many people in these groups possess. As we have chosen very specific interpretations of the characteristics of the PPA groups without any clear guidance in many cases, and as we have privileged some characteristics over others, it is important to conduct a sensitivity analysis to see to what extent the group identified changes when the criteria are altered.
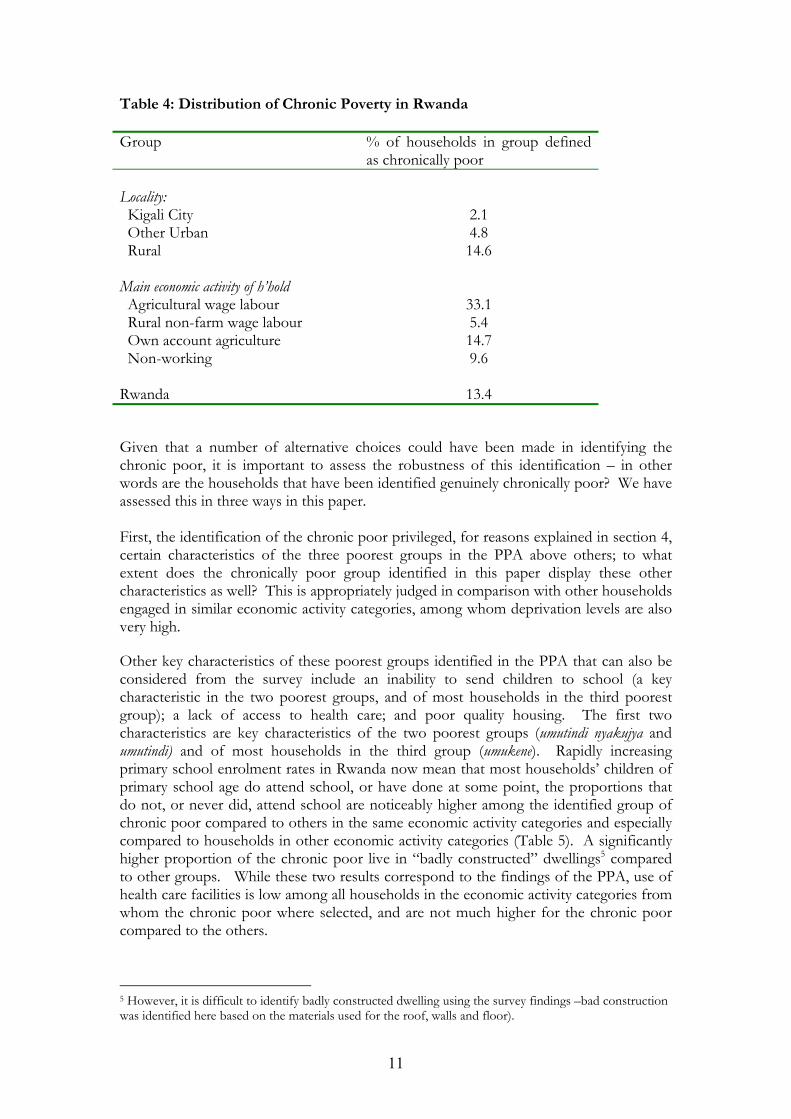
5. Identifying chronic poor groups in Rwanda The above criteria enable a group of households to be identified that are clearly chronically poor according to both the PPA and the survey data. This group constitutes 13.4% of the Rwandan population or 14.6% of the rural population (Table 4). This is emphatically not an estimate of the extent of chronic poverty in Rwanda. These households are almost certainly chronically poor, assuming the identification criteria are meaningful (to be judged shortly). But equally they almost certainly represent only a subset the chronically poor (perhaps the chronic ultra-poor, in that 0.2ha. is a very small area). The criteria applied are strict and this, plus the need to satisfy different criteria simultaneously, means that many chronically poor households are likely not to be included. In addition the umutindi nyakujya, will not be adequately covered in the household survey given that one of their defining characteristics is not having shelter.
10
Table 4: Distribution of Chronic Poverty in Rwanda
Group % of households in group defined as chronically poor
Locality: Kigali City 2.1 Other Urban 4.8 Rural 14.6 Main economic activity of h’hold Agricultural wage labour 33.1 Rural non-farm wage labour 5.4 Own account agriculture 14.7 Non-working 9.6 Rwanda 13.4
Given that a number of alternative choices could have been made in identifying the chronic poor, it is important to assess the robustness of this identification – in other words are the households that have been identified genuinely chronically poor? We have assessed this in three ways in this paper. First, the identification of the chronic poor privileged, for reasons explained in section 4, certain characteristics of the three poorest groups in the PPA above others; to what extent does the chronically poor group identified in this paper display these other characteristics as well? This is appropriately judged in comparison with other households engaged in similar economic activity categories, among whom deprivation levels are also very high.
Other key characteristics of these poorest groups identified in the PPA that can also be considered from the survey include an inability to send children to school (a key characteristic in the two poorest groups, and of most households in the third poorest group); a lack of access to health care; and poor quality housing. The first two characteristics are key characteristics of the two poorest groups (umutindi nyakujya and umutindi) and of most households in the third group (umukene). Rapidly increasing primary school enrolment rates in Rwanda now mean that most households’ children of primary school age do attend school, or have done at some point, the proportions that do not, or never did, attend school are noticeably higher among the identified group of chronic poor compared to others in the same economic activity categories and especially compared to households in other economic activity categories (Table 5). A significantly higher proportion of the chronic poor live in “badly constructed” dwellings5 compared to other groups. While these two results correspond to the findings of the PPA, use of health care facilities is low among all households in the economic activity categories from whom the chronic poor where selected, and are not much higher for the chronic poor compared to the others.
5 However, it is difficult to identify badly constructed dwelling using the survey findings –bad construction was identified here based on the materials used for the roof, walls and floor).
11
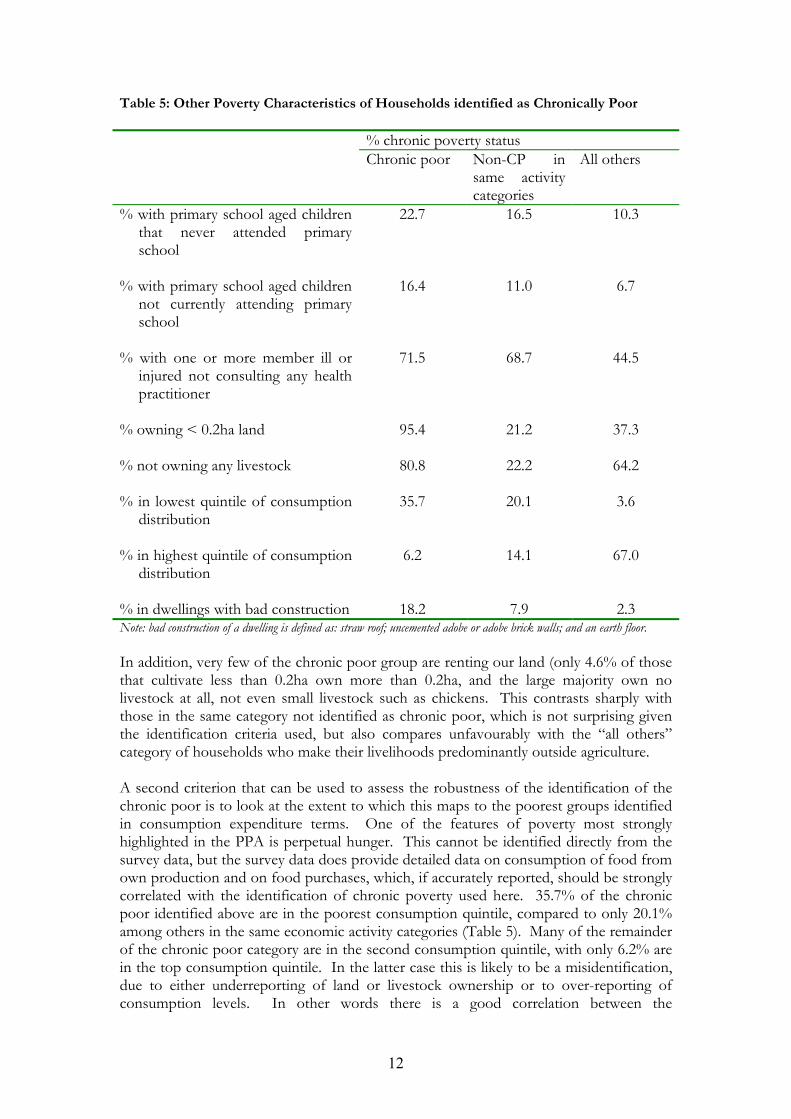
Table 5: Other Poverty Characteristics of Households identified as Chronically Poor
% chronic poverty status Chronic poor Non-CP in
same activity categories
All others
% with primary school aged children that never attended primary school
22.7 16.5 10.3
% with primary school aged children not currently attending primary school
16.4 11.0 6.7
% with one or more member ill or injured not consulting any health practitioner
71.5 68.7 44.5
% owning < 0.2ha land
95.4 21.2 37.3
% not owning any livestock
80.8 22.2 64.2
% in lowest quintile of consumption distribution
35.7 20.1 3.6
% in highest quintile of consumption distribution
6.2 14.1 67.0
% in dwellings with bad construction 18.2 7.9 2.3 Note: bad construction of a dwelling is defined as: straw roof; uncemented adobe or adobe brick walls; and an earth floor.
In addition, very few of the chronic poor group are renting our land (only 4.6% of those that cultivate less than 0.2ha own more than 0.2ha, and the large majority own no livestock at all, not even small livestock such as chickens. This contrasts sharply with those in the same category not identified as chronic poor, which is not surprising given the identification criteria used, but also compares unfavourably with the “all others” category of households who make their livelihoods predominantly outside agriculture. A second criterion that can be used to assess the robustness of the identification of the chronic poor is to look at the extent to which this maps to the poorest groups identified in consumption expenditure terms. One of the features of poverty most strongly highlighted in the PPA is perpetual hunger. This cannot be identified directly from the survey data, but the survey data does provide detailed data on consumption of food from own production and on food purchases, which, if accurately reported, should be strongly correlated with the identification of chronic poverty used here. 35.7% of the chronic poor identified above are in the poorest consumption quintile, compared to only 20.1% among others in the same economic activity categories (Table 5). Many of the remainder of the chronic poor category are in the second consumption quintile, with only 6.2% are in the top consumption quintile. In the latter case this is likely to be a misidentification, due to either underreporting of land or livestock ownership or to over-reporting of consumption levels. In other words there is a good correlation between the
12
identification of the chronic poor used here and the extreme poor in consumption terms, even though the latter does not focus on dynamics at all and despite inevitable significant measurement errors associated with recording consumption levels and land areas. A third criterion to assess the identification of the chronic poor here is by using data on agricultural production from rural household surveys conducted by Ministry of Agriculture in conjunction with Michigan State University as part of the USAID funded Food Security Research Project (FSRP). As part of this a household agricultural production panel survey was conducted each agricultural season for six rounds over the 2000 to 2002 period. Moreover, the households used for these surveys were selected as a sub-sample of the EICV household survey used in this paper. In other words, for these households it is possible to know not just their characteristics at a point in time from the EICV survey, but also the dynamics of their agricultural production over six agricultural seasons (three years). This mostly comprises households whose principal livelihood is own-account farming activities on their own or rented land, but these constitute a large majority of the chronic poor. It will include only some of those reliant mostly on agricultural wage labour. Agricultural production does not equate to wellbeing, as agricultural households will have other income or consumption sources. However, for most households there other sources are usually small (McKay and Loveridge, 2004), so that the majority of their consumption is derived from own production (sometimes indirectly via market exchange). As such production levels are likely to be a good correlate of wellbeing for these households. There are issues in aggregating agricultural production data, collected in quantity terms (convertible into kilogrammes), across different crops. There is not sufficient price data to be able to do this in value terms, but in any case a better way for present purposes is to work out calorie equivalents of the production quantities for each crop, and these then can be aggregated across crops. Calorie conversion factors are available for all the most important crops, so an estimate of total calories produced from 13 main crops could be computed for all households. On this basis it is possible to use the panel aspect of the data to consider dynamics of household production in calorie terms over the agricultural seasons. For the reasons stated above, this is not directly a measure of the dynamics of wellbeing, but it is likely to be strongly correlated with it. This correlation can only be considered for 1322 households covered in both surveys (including all six waves of the panel), a minority of those used for the identification of chronic poverty above, but the group remains nationally representative of agricultural households. Of these 1322 households, 205 (15.5%) are identified as chronically poor above. Based on the FSRP data there is no clear calorie production threshold to use to identify poor households, especially because this cannot be computed for all crops. However, Table 6 reports the match between whether are identified as chronically poor based on the previous analysis (using the same groupings of households as before) against the number of agricultural seasons (out of six) for which the household produces output of less than 1500kcal per adult equivalent per day.
13
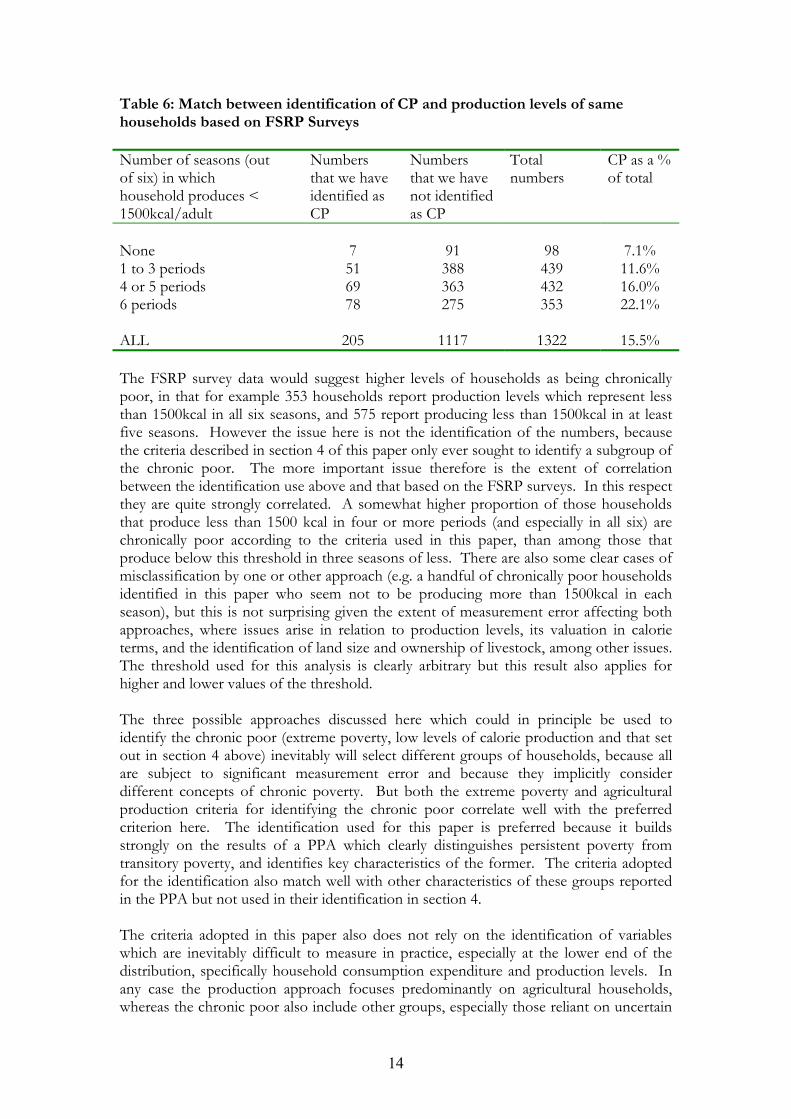
Table 6: Match between identification of CP and production levels of same households based on FSRP Surveys
Number of seasons (out of six) in which household produces < 1500kcal/adult
Numbers that we have identified as CP
Numbers that we have not identified as CP
Total numbers
CP as a % of total
None 7 91 98 7.1% 1 to 3 periods 51 388 439 11.6% 4 or 5 periods 69 363 432 16.0% 6 periods 78 275 353 22.1% ALL 205 1117 1322 15.5%
The FSRP survey data would suggest higher levels of households as being chronically poor, in that for example 353 households report production levels which represent less than 1500kcal in all six seasons, and 575 report producing less than 1500kcal in at least five seasons. However the issue here is not the identification of the numbers, because the criteria described in section 4 of this paper only ever sought to identify a subgroup of the chronic poor. The more important issue therefore is the extent of correlation between the identification use above and that based on the FSRP surveys. In this respect they are quite strongly correlated. A somewhat higher proportion of those households that produce less than 1500 kcal in four or more periods (and especially in all six) are chronically poor according to the criteria used in this paper, than among those that produce below this threshold in three seasons of less. There are also some clear cases of misclassification by one or other approach (e.g. a handful of chronically poor households identified in this paper who seem not to be producing more than 1500kcal in each season), but this is not surprising given the extent of measurement error affecting both approaches, where issues arise in relation to production levels, its valuation in calorie terms, and the identification of land size and ownership of livestock, among other issues. The threshold used for this analysis is clearly arbitrary but this result also applies for higher and lower values of the threshold. The three possible approaches discussed here which could in principle be used to identify the chronic poor (extreme poverty, low levels of calorie production and that set out in section 4 above) inevitably will select different groups of households, because all are subject to significant measurement error and because they implicitly consider different concepts of chronic poverty. But both the extreme poverty and agricultural production criteria for identifying the chronic poor correlate well with the preferred criterion here. The identification used for this paper is preferred because it builds strongly on the results of a PPA which clearly distinguishes persistent poverty from transitory poverty, and identifies key characteristics of the former. The criteria adopted for the identification also match well with other characteristics of these groups reported in the PPA but not used in their identification in section 4. The criteria adopted in this paper also does not rely on the identification of variables which are inevitably difficult to measure in practice, especially at the lower end of the distribution, specifically household consumption expenditure and production levels. In any case the production approach focuses predominantly on agricultural households, whereas the chronic poor also include other groups, especially those reliant on uncertain
14
and insecure agricultural wage labour. And as already noted in section 2, in the extreme poverty approach, the extent of correlation between the depth of poverty and its duration is unknown. In summary it is possible to be confident that the vast majority of the group identified here are indeed chronically poor, and we turn now to examine their characteristics as revealed by the household survey data, again with the intention of seeing how well these match to those reported in the PPA.
6. Characteristics of the chronically poor group We now consider the characteristics of the chronically poverty group identified above. First it is appropriate to note that the economic activity categories that have been used to identify the chronic poor are the same categories with the highest levels of consumption poverty (Table 2), especially so households reliant on working as agricultural wage labourers and the much larger group engaged in own account farming. Following from the definition, the incidence of this measure of chronic poverty is highest in rural areas (Table 4) though chronic poverty also exists in urban areas among those engaged in agriculture-related livelihoods (many other urban areas not being much more than a large village) or not working. The geographic distribution of chronic poverty is broadly similar to the pattern of overall consumption poverty, though with two or three significant differences. By main economic activity (Table 4), fully one third of (the relatively small number of) households reliant mainly on agricultural wage labour are chronically poor, and nearly 15% of the much larger group of own account farmers.
15
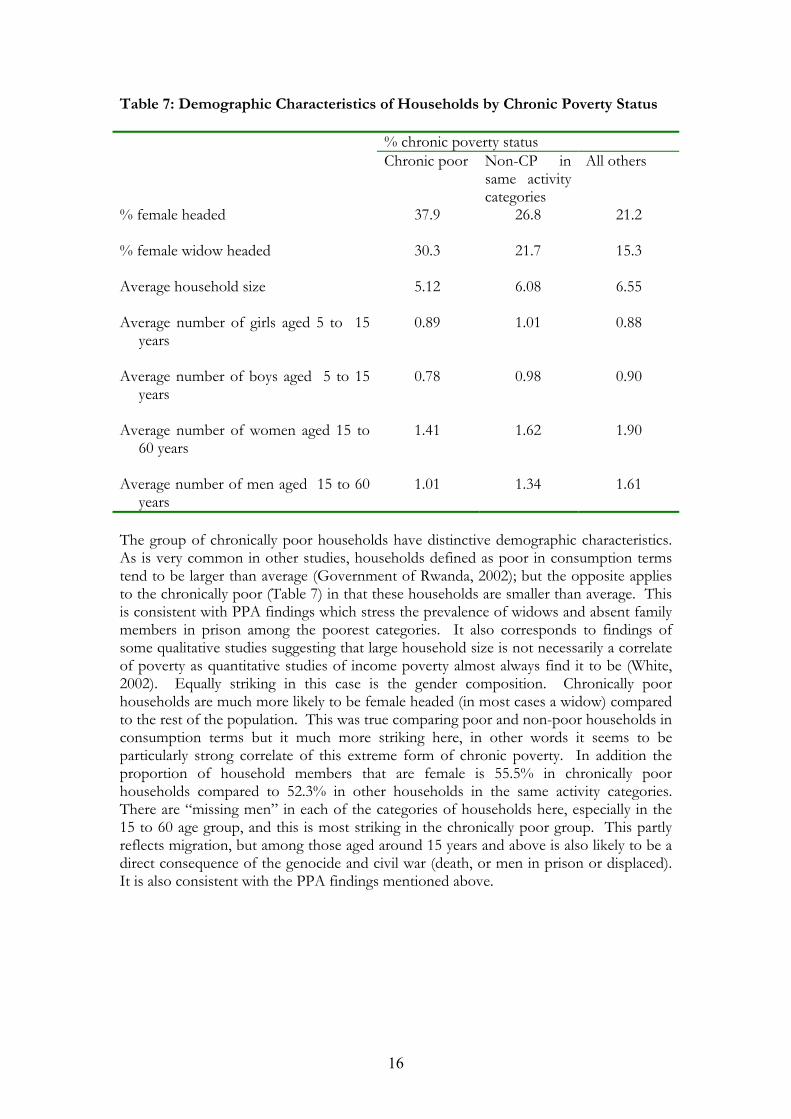
Table 7: Demographic Characteristics of Households by Chronic Poverty Status
% chronic poverty status Chronic poor Non-CP in
same activity categories
All others
% female headed
37.9 26.8 21.2
% female widow headed
30.3 21.7 15.3
Average household size
5.12 6.08 6.55
Average number of girls aged 5 to 15 years
0.89 1.01 0.88
Average number of boys aged 5 to 15 years
0.78 0.98 0.90
Average number of women aged 15 to 60 years
1.41 1.62 1.90
Average number of men aged 15 to 60 years
1.01 1.34 1.61
The group of chronically poor households have distinctive demographic characteristics. As is very common in other studies, households defined as poor in consumption terms tend to be larger than average (Government of Rwanda, 2002); but the opposite applies to the chronically poor (Table 7) in that these households are smaller than average. This is consistent with PPA findings which stress the prevalence of widows and absent family members in prison among the poorest categories. It also corresponds to findings of some qualitative studies suggesting that large household size is not necessarily a correlate of poverty as quantitative studies of income poverty almost always find it to be (White, 2002). Equally striking in this case is the gender composition. Chronically poor households are much more likely to be female headed (in most cases a widow) compared to the rest of the population. This was true comparing poor and non-poor households in consumption terms but it much more striking here, in other words it seems to be particularly strong correlate of this extreme form of chronic poverty. In addition the proportion of household members that are female is 55.5% in chronically poor households compared to 52.3% in other households in the same activity categories. There are “missing men” in each of the categories of households here, especially in the 15 to 60 age group, and this is most striking in the chronically poor group. This partly reflects migration, but among those aged around 15 years and above is also likely to be a direct consequence of the genocide and civil war (death, or men in prison or displaced). It is also consistent with the PPA findings mentioned above.
16
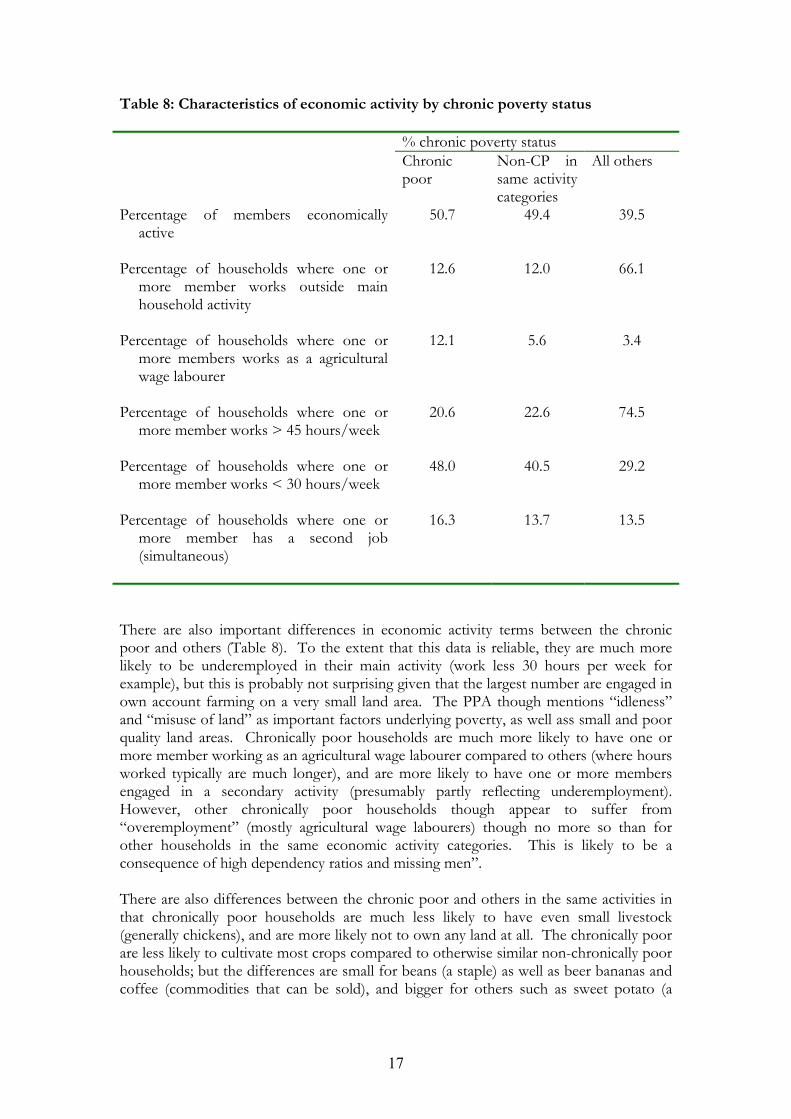
Table 8: Characteristics of economic activity by chronic poverty status
% chronic poverty status Chronic poor
Non-CP in same activity categories
All others
Percentage of members economically active
50.7 49.4 39.5
Percentage of households where one or more member works outside main household activity
12.6 12.0 66.1
Percentage of households where one or more members works as a agricultural wage labourer
12.1 5.6 3.4
Percentage of households where one or more member works > 45 hours/week
20.6 22.6 74.5
Percentage of households where one or more member works < 30 hours/week
48.0 40.5 29.2
Percentage of households where one or more member has a second job (simultaneous)
16.3 13.7 13.5
There are also important differences in economic activity terms between the chronic poor and others (Table 8). To the extent that this data is reliable, they are much more likely to be underemployed in their main activity (work less 30 hours per week for example), but this is probably not surprising given that the largest number are engaged in own account farming on a very small land area. The PPA though mentions “idleness” and “misuse of land” as important factors underlying poverty, as well ass small and poor quality land areas. Chronically poor households are much more likely to have one or more member working as an agricultural wage labourer compared to others (where hours worked typically are much longer), and are more likely to have one or more members engaged in a secondary activity (presumably partly reflecting underemployment). However, other chronically poor households though appear to suffer from “overemployment” (mostly agricultural wage labourers) though no more so than for other households in the same economic activity categories. This is likely to be a consequence of high dependency ratios and missing men”. There are also differences between the chronic poor and others in the same activities in that chronically poor households are much less likely to have even small livestock (generally chickens), and are more likely not to own any land at all. The chronically poor are less likely to cultivate most crops compared to otherwise similar non-chronically poor households; but the differences are small for beans (a staple) as well as beer bananas and coffee (commodities that can be sold), and bigger for others such as sweet potato (a
17
staple, but that requires good quality land). All of these factors are likely causes, as well as consequences, of very high levels of vulnerability and poverty. Though this point is not stressed in the PPA, in fact the chronic poor may be more engaged with the market economy than other poor categories, because of their greater reliance on wage labour or secondary activities; their inability to cultivate sufficient amounts of food; and their slightly greater propensity to grow crops that can be sold, notably beer bananas. Consistent with this, according to the survey data the chronically poor purchase a much higher proportion of their food consumption (49.1%) compared to the non-chronically poor in the same economic activity categories (38.9%). The characteristics of the chronic poor group identified here correspond quite closely to those mentioned in respect of the umutindi and umukene groups in the PPA, although the qualitative approach of the PPA gives a number of additional, very important perspectives not available from the survey – not only on processes but also on the much wider category of assets in the livelihoods framework. The quantitative data here though has added a number of important additional perspectives, for instance on household composition issues, the extent of (rather lack of) diversification of economic activities of the chronic poor, and the extent of their reliance on market transactions. Again the combined approach provides insights not available from either individually, and in future this could be developed further by refining the PPA approach and survey instruments used.
7. Conclusion In this paper we set out to demonstrate the value and need of employing a multi-disciplinary approach to chronic poverty. The value is a level of analysis and understanding of chronic poverty that moves beyond its individual components by combining insights from quality qualitative and quantitative work. This has provided a better understanding of the nature of chronic poverty; its multidimensionality; and the key characteristics of chronically poor households in terms of information available from the PPA and household survey. The group we have identified is quite distinctive from the remainder of the poor; as the poor themselves report in the PPA. This is the beginning of a conversation that we see as necessary between different data sources in examining chronic poverty. We argue that even from this, initial analysis, we are able to offer a better defined picture of chronic poverty in Rwanda than has been previously available. While we are not claiming to have estimated numbers comprehensively, the analysis in this paper established that chronic poverty is a quantitatively substantial (more than one million people in a population of just over eight milltion) and geographically widespread phenomenon in Rwanda. This then identifies a need in the policy context to consider this issue further. For example, we would suggest that any ex-ante consideration of policy choice on agricultural growth would need to pay greater attention to poverty persistence and to the aspects of analysis that we present here. Similarly, consideration of how this relates to proposed social protection mechanisms or promotion of community programmes, for example ubudehe6, would also 6 Ubudehe is the continuation of the PPA process in Rwanda where the process of enquiry and discussion on poverty is supported by a collective action and problem-solving process, backed up with small grants from government to be used collectively in resolving those issues identified. As part of this process the
18
19
be important. We would also argue that part of this approach would be to further explore the experience of chronic poverty for Rwandans, in particular understanding the processes that reinforce persistent poverty. Some of these are already clear from the PPA, and sometimes unintentionally to the extent that responses reveal possible discriminatory attitudes towards the poorest categories. We recognise that in setting criteria for analysing chronic poverty we have concentrated on the commonality between the data, in terms of labour, land and livestock. But in invigorating the debate we also stress the importance and rigour of the data individually; of orders of magnitude, patterns and correlations from survey data and on insights on the social context of persistent poverty in Rwanda and the heterogeneity of social experience beyond physical assets. In taking this approach further it is necessary to build strongly on the key insights from the PPA. Further, this paper has focused quite a lot on using the qualitative results to direct relevant quantitative analysis, but it is equally important to consider the implications of quantitative findings for qualitative analysis. Analysing and presenting information in this manner is intended to and indeed can focus further policy and research attention on this issue. This has relevance in a context such as Rwanda where conventional methods for assessing chronic or persistent poverty, such as panel surveys are absent. But the value is also in offering an outline approach that moves beyond panel surveys in considering chronic poverty. Further embracing multi-disciplinarity is of particular importance in the study of chronic poverty, given the much wider conception of chronic poverty and of the processes that underlie it, such as exclusion, (or movements into and out of poverty) than simply analysing panel data and monetary measures alone. That all said, it would be informative to undertake such an exercise in an environment where panel data was already available, to see to what extent chronic poverty identified using a conventional approach corresponds to that identified using combined quantitative and qualitative methods as here. There are also important lessons to learn from Indian village studies that have used qualitative as well as quantitative income measures of poverty to examine persistence (Lanjouw and Stern, 1991), and quantitative studies that have used non-income indicators (e.g. socio-economic category or land size, e.g. Swaminathan, 1991). Finally, there is the scope and opportunity to develop this further in employing sequential mixing of approaches and analysis. Mixing also implies a continued conversation between methodologies and approaches. We have asked ourselves how in the future, can the design and process of PPA work and survey work better draw from each others’ strengths. This can contribute to better, more policy relevant, information collection and analysis in each case.
References Aliber, M. (2001), ”An Overview of the Incidence and Nature of Chronic Poverty in
South Africa”, Chronic Poverty Research Centre Background Paper No. 3, May. Appleton, S. and D. Booth (2001), “Combining Participatory and Survey-based
Approaches to Poverty Monitoring and Analysis - Background Paper”, ODI.
communities also identified the poorest household in their locality to be a target for specific assistance from collective action.
20
Available at: http://www.odi.org.uk/pppg/publications/papers_reports/gov/ug_ws01/bp.html
Baulch, B. and J. Hoddinott (2000), “Economic Mobility and Poverty Dynamics in Developing Countries”, Journal of Development Studies, 36: (6), 1-24.
Government of Rwanda (2001), “Report on Poverty Profile Survey in Rwanda”, National Poverty Reduction Programme, Government of Rwanda, October.
Government of Rwanda (2002), “A Profile of Poverty in Rwanda: A report based on the results of the Household Living Standards Survey”, Ministry of Finance and Economic Planning, February.
Hentschel, J. (2001), “Integrating the Qual and the Quan: When and Why?”, in R. Kanbur (ed.), “Qualitative and Quantitative Poverty Appraisal: Complementarities, Tensions and the Way Forward”, Working Paper 2001-05, Cornell University, 2001
Hulme, D, K. Moore and A. Shepherd (2001), “Chronic poverty: meanings and analytical frameworks”, Chronic Poverty Research Centre Working Paper No. 2, November.
Hulme, D. and A. Shepherd (2003), “Conceptualising Chronic Poverty”, World Development, 31(3), 411-423.
Kanbur, R. (2002), “Economics, Social Science and Development”, World Development, 30(3), 477-486.
Lanjouw, P. and N. Stern (1991), “Poverty in Palanpur”, World Bank Economic Review, 5(1),
23-55. McCulloch, N. and B. Baulch (2000), “Simulating the Impact of Policy on Chronic and
Transitory Poverty in Rural Pakistan”, Journal of Development Studies, 36(6), 100-130.
McKay, A. and D. Lawson (2003), “Assessing the Extent and Nature of Chronic Poverty in Low Income Countries: Issues and Evidence”, World Development, 31(3), 425-439.
McKay, A. and S. Loveridge (2004), “Agricultural Household Income Strategies in the Context of Political Instability and Decreasing Land Availability: Comparing Rwanda in 1990 with 2000”, mimeo, University of Bath and Michigan State University, February.
Mpyisi, E., M. Weber, E. Shingiro and S. Loveridge (2003), “Changes in Allocation of Land Holdings, Production and Farm Size in the Rwandan Smallholder Sector Over the Period 1984/1990 to 2002”, Agricultural Policy Synthesis Number 6E, Ministry of Agriculture and Michigan state University Food Security Research Project.
Okidi, J. and A. McKay (2003), “Poverty Dynamics in Uganda: 1992 to 2000”, Chronic Poverty Research Centre Working Paper No. 27, May.
Ravallion, M. (2001), “Can qualitative methods help quantitative poverty measurement”, in R. Kanbur (ed.), “Qual–quant: Qualitative and quantitative poverty appraisal—complementarities, tensions and the way forward”, Cornell University. http://www.people.cornell.edu/pages/sk145/papers.htm.
Swaminathan, M. (1991)….Development and Change White, H. (2002), “Combining quantitative and qualitative approaches in poverty