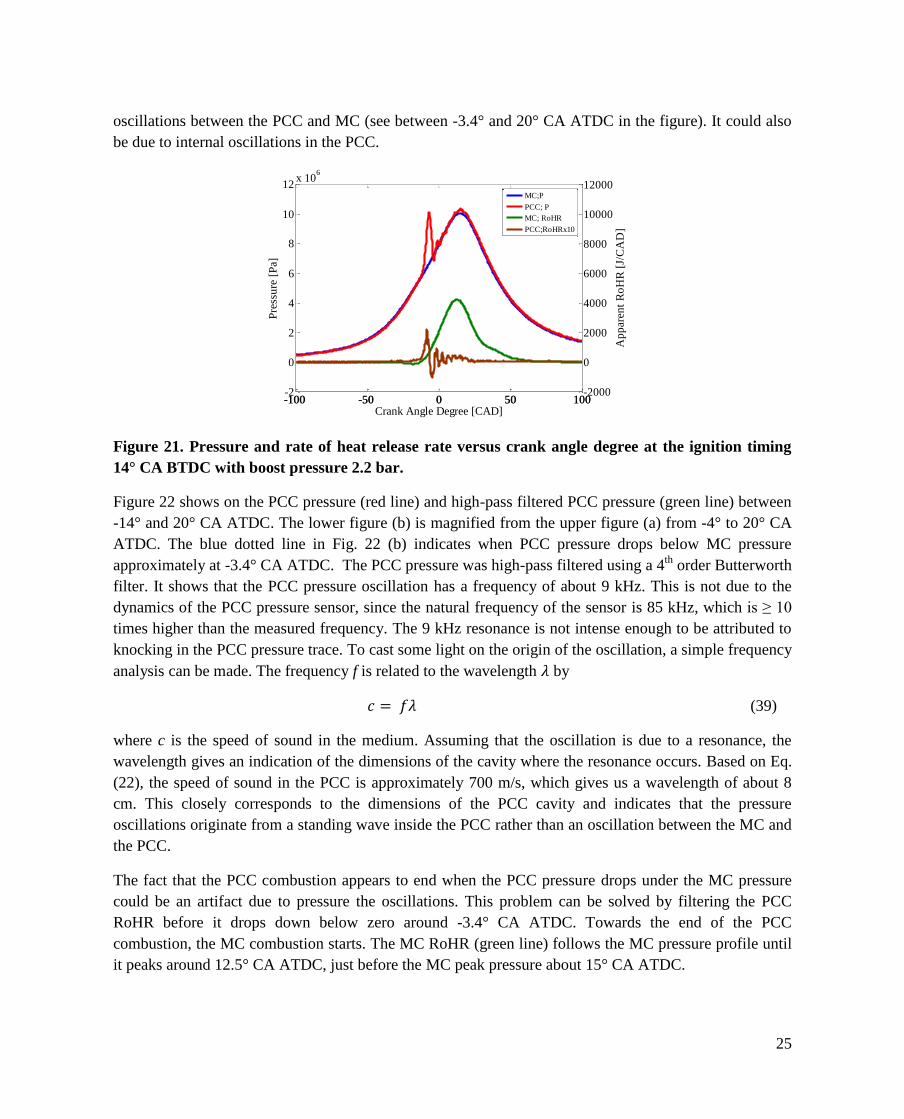
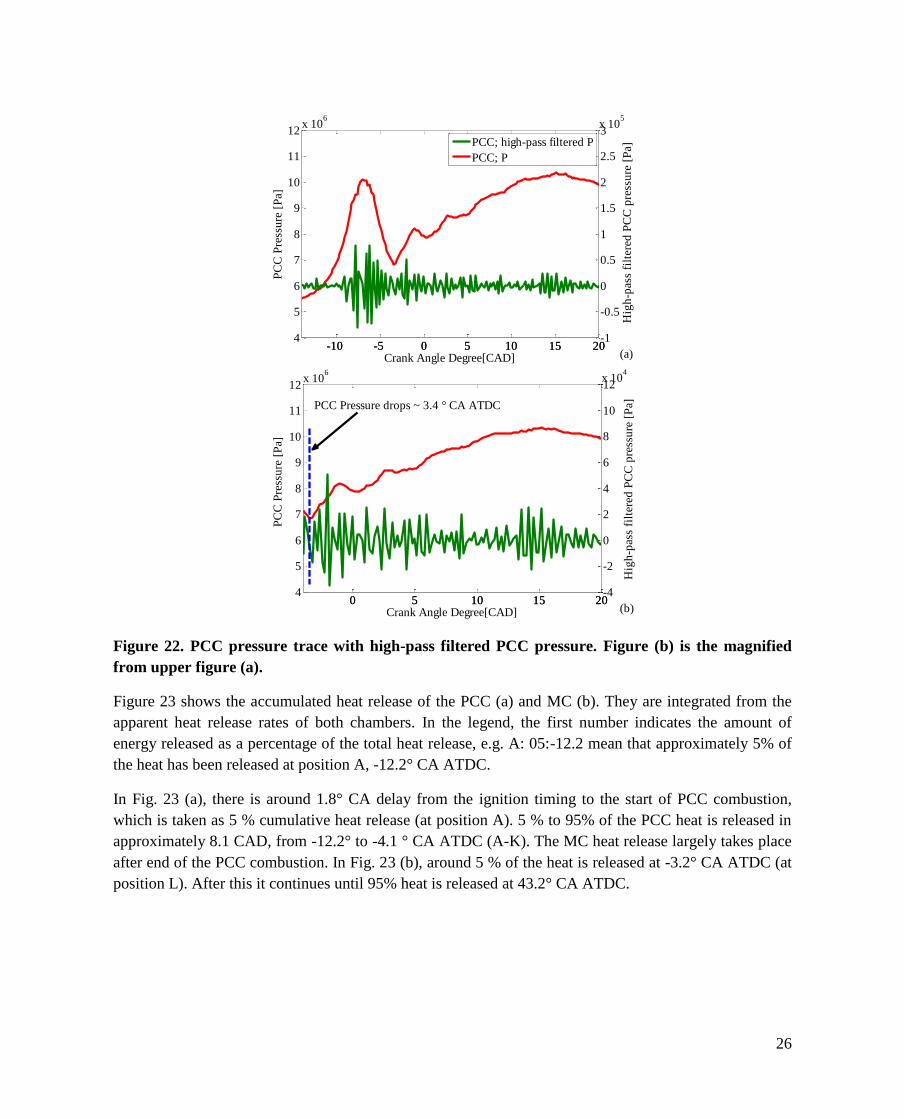
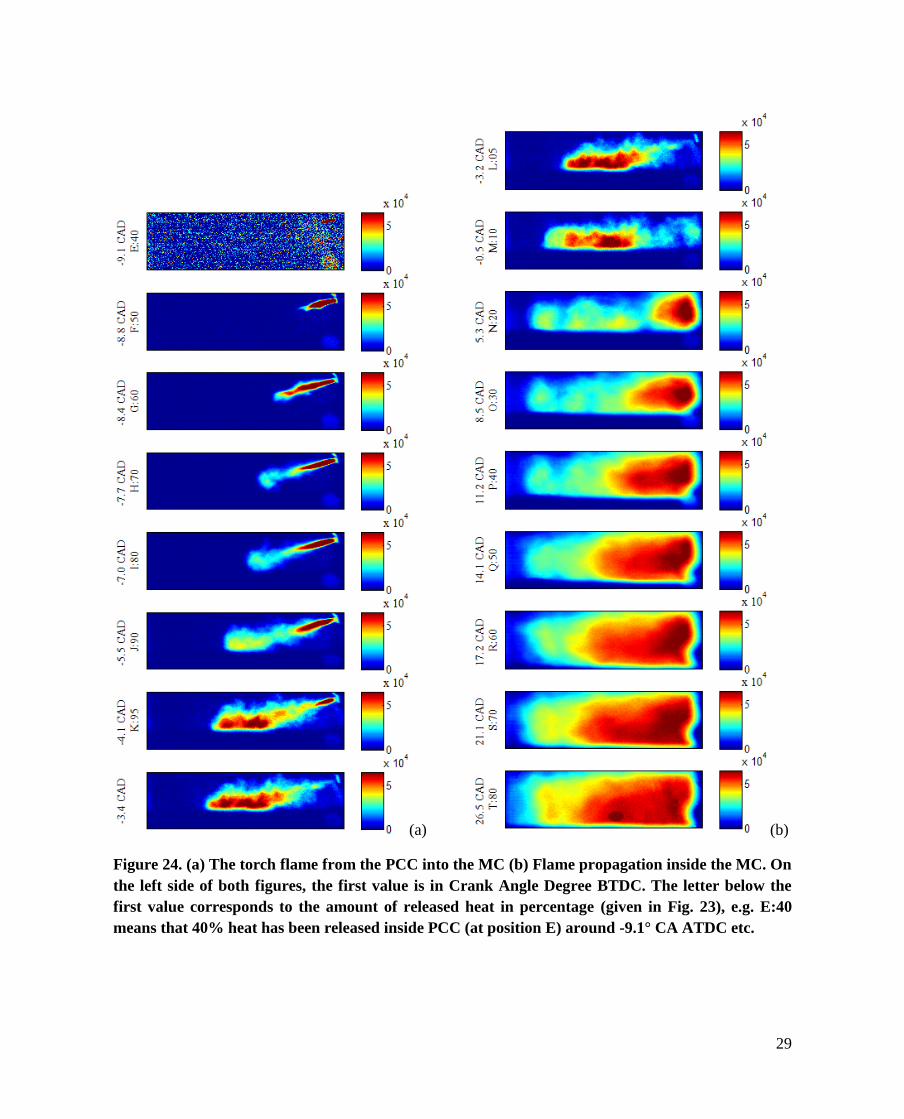
Combustion Visualization in a Large Bore Gas Engine Jeudi Duong Thesis for the Degree of Licentiate in Engineering, 2013 Division of Combustion Engines Department of Energy Sciences Faculty of Engineering (LTH) Lund University www.energy.lth.se
Transcript
Combustion Visualization in a
Large Bore Gas Engine
Jeudi Duong
Thesis for the Degree of Licentiate in Engineering, 2013
Division of Combustion Engines
Department of Energy Sciences
Faculty of Engineering (LTH)
Lund University
www.energy.lth.se
Copyright Jeudi Loan Duong, 2013
Division of Combustion Engines
Department of Energy Sciences
Faculty of Engineering (LTH)
Lund University
P.O. Box 118, SE-22100, Lund, Sweden
ISBN 978-91-7473-738-4
ISRN LUTMDN/TMHP-13/7084-SE
ISSN 0282-1990
I
List of publications
Paper I
Visualization of the Combustion in Wärtsilä 34SG Pre-chamber ignited Lean Burn Gas Engine
Jeudi Duong1, 2
, Rikard Wellander3, Jari Hyvönen
2, Öivind Andersson
1, Mattias Richter
3
1 Division of Combustion Engines, Lund University, Sweden
2 Wärtsilä Finland Oy, Finland
3 Division of Combustion Physics, Lund University, Sweden
Presented in 27th
CIMAC World Congress, Shanghai, China, May 13th
– 16th
2013, Paper no.: 414
Paper II
High speed combustion imaging in a large bore gas engine – the relationship between pre- and main
chamber heat release
Jeudi Duong1, 2
, Rikard Wellander3, Jari Hyvönen
2, Öivind Andersson
1, Mattias Richter
3, Bengt
Johansson1, Marcus Aldén
3
1 Division of Combustion Engines, Lund University, Sweden
2 Wärtsilä Finland Oy, Finland
3 Division of Combustion Physics, Lund University, Sweden
Will be presented in ASME IMECE Congress, San Diego, U.S.A, November 15th
– 21th
2013, Paper no.:
IMECE2013-64286
Related work
Study of the early flame development in a spark-ignited lean burn four-stroke large bore gas engine
by planar laser induced fluorescence
Rikard Wellander1, Jeudi Duong
2, 3, Joakim Rosell
1, Mattias Richter
1, Öivind Andersson
2, Jari Hyvönen
3,
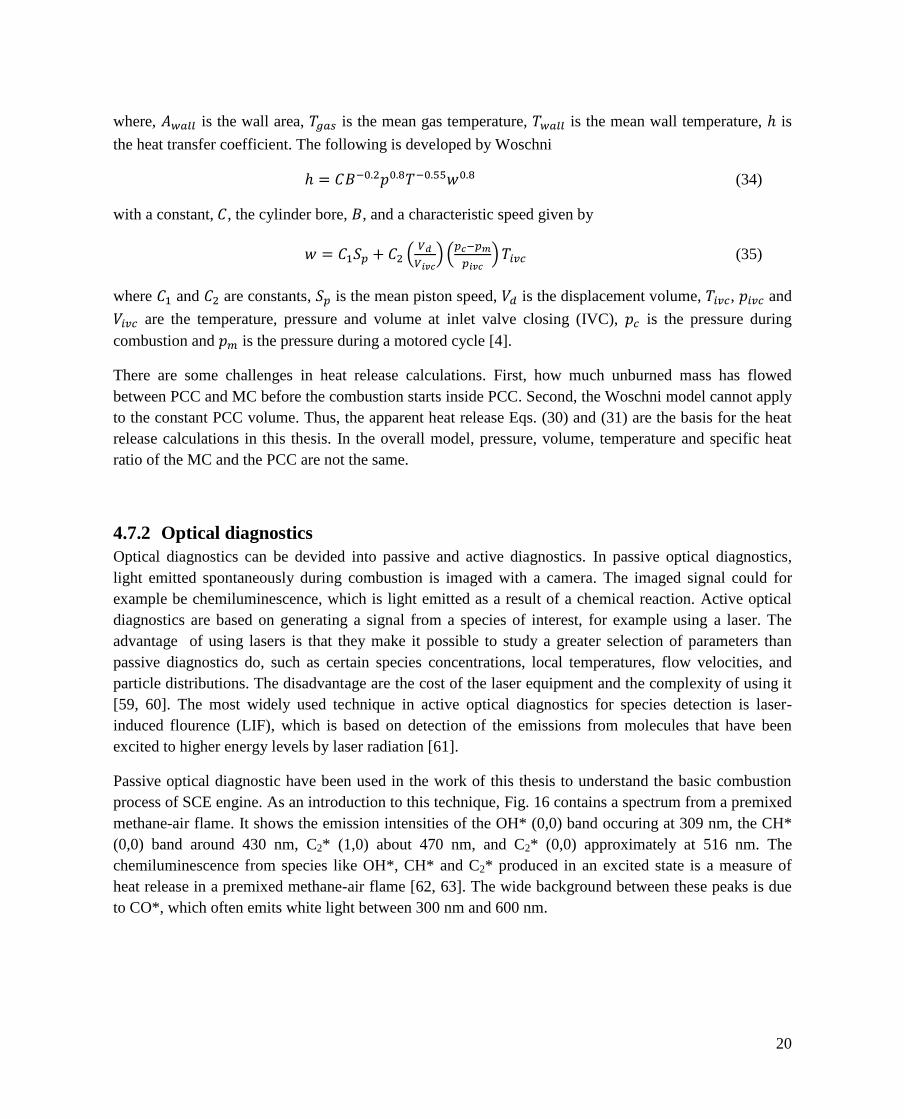
Bengt Johansson2, Marcus Aldén
1
1 Division of Combustion Physics, Lund University, Sweden
2 Division of Combustion Engines, Lund University, Sweden
3 Wärtsilä Finland Oy, Finland
Abstract for SAE World Congress, Detroit, U.S.A, April 8th
– 10th
2014
II
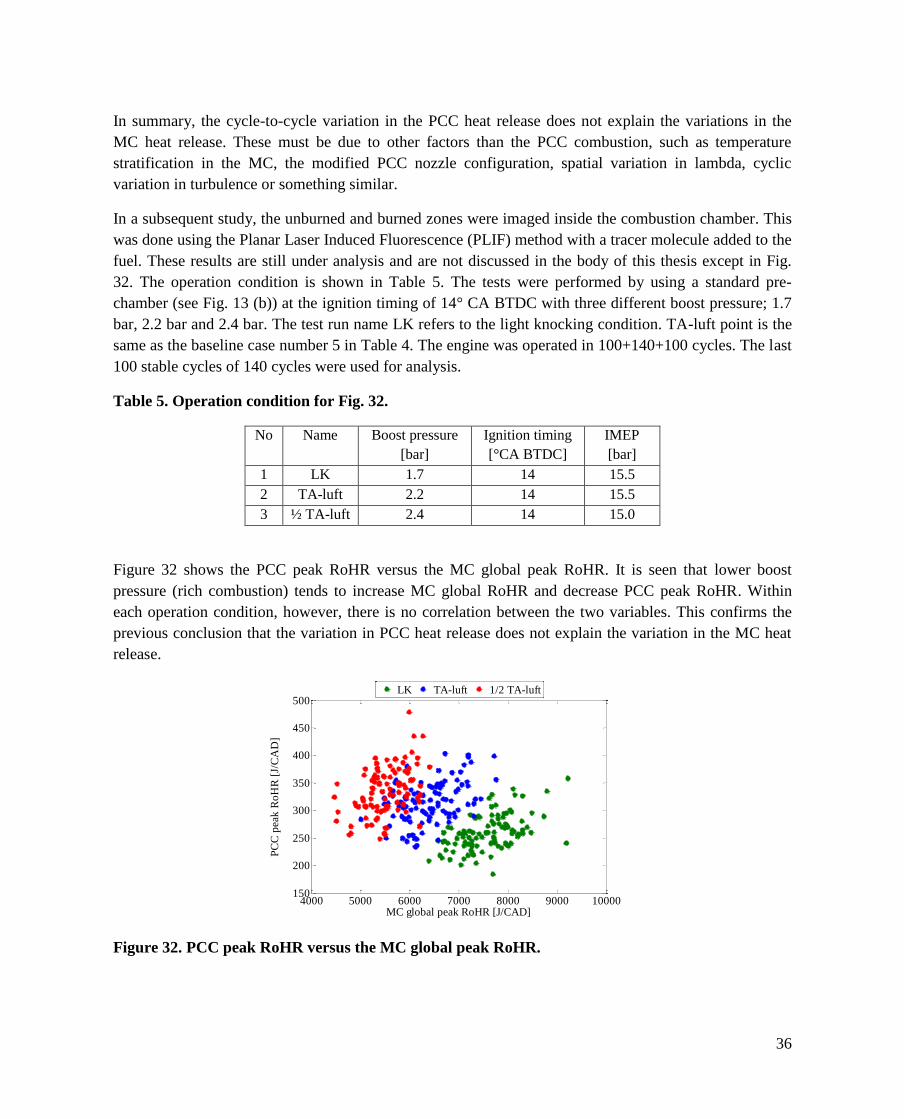
Acknowledgement This work has been conducted at Waskiluoto Validation Center of Wärtsilä Finland Oy. It was partially
financed by NordForsk PPP (Private Public Partnership) program, ref. no: 080345.
First of all, I would like to thank my supervisor and former boss Jari Hyvönen at Wärtsilä, for his support,
knowledge and for always sparing time for a discussion despite his busy schedule. Everything he taught
me will surely stay with me and help me in the future. I never had a good boss like him!
I would also like to thank my supervisor Professor Öivind Andersson for giving various suggestions on
problem solving. His incredible knowledge within combustion engines and combustion physics are
remarkable. I am very grateful to him for teaching me the difference between a scientific and an
engineering work!
I would like to express my gratitude to entire personnel of the SCE engine team; Jussi Autio, Jussi Seppä,
Staffan Nysand, Alberto Cafari, Kristian Haka, Jukka Ylimartimo, Lasse Soinila, Jarkko Ruutiainen, and
Mikko Huissi for the help and co-operation during the past years. Especially I would like to thank my co-
supervisor Mattias Richter and Rikard Wellander from the division of combustion physics, together with
SCE team we struggled long hours to get the engine and the camera system to work. Mattias Richter gave
the exact advice about optical diagnostics. Especially I am thankful to Rikard Wellander for conducting
endless image processing from our experiments.
I would like to extend my sincerest thanks to my co-supervisor Professor Bengt Johanssons for accepting
me as an Industrial Ph.D student and for sharing his knowledge and good ideas. I would also like to show
my appreciation to Professor Marcus Aldén, Robert Ollus and Arto Järvi, for their involvement related to
this study.
Furthermore, I would like to thank all my colleagues at the division of combustion engines for fun
discussions during coffee breaks. Special thanks go to Peter Larsson, Ted Lind, Yann Gallo, my room
mates, for making me laugh everyday. Guillaume Lequien, for interesting discussions about optical
reseach. Kenan Muric, for helping me solving mysterious Matlab problems. Gökhan Coskun, for
introducing me into the world of Turkish yogurt. Maja Novakovic, for always being a good listener.
Prakash Arunachalam Narayanan, for being a non-chili master chef. Marcus Lundgren, for showing
formula student racing cars. Ashish Shah, for always helping out in every situation and become one of my
good friends.
Last but certainly not least, I would like to thank my family for all the support during early years of my
life and studies.
III
Nomenclature
ANG Adsorbed Natural Gas
AT Area of the nozzle holes
ATDC After Top Dead Centre
Awall Area of the wall
B Bore
BDC Bottom Dead Centre
BTDC Before Top Dead Centre
CA Crank Angle
CI Compression-Ignited
CNG Compressed Natural Gas
CO Carbon Monixide
CO2 Carbon Dioxide
Cd Discharge coefficient
cp Specific heat capacity of pressure
cv Specific heat capacity of volume
DF Dual fuel
dm Mass flow
ECA Emission Control Area
EGR Exhaust Gas Recirculation
F Frequency
h Heat transfer coefficient
hf Sensible enthalphy of the fuel
HC Hydrocarbon
HCN Hydrocyanic Acid
IV
H2O Hydrogen Hydroxide or water
IMEP Indicated Mean Effective Pressure
IMO International Maritime Organization
IVC Inlet Valve Closing
LAG Lavinia Aktyvatsia Gorenia
LNG Liquefied Natural Gas
LIF Laser-Induced Fluorence
MC Main Chamber
MEPC Marine Environment Protection Committee
m1 Main Chamber mass
m2 Pre-Combustion Chamber mass
mf Mass flow
NH3 Ammonia
NHV Net Heating Value
NO Nitric Oxide
NO2 Nitrogen Dioxide
NOx Nitrogen Oxides
O3 Ozone
PCC Pre-Combustion Chamber
PJC Pulsed Jet Combustion
PM Particular Matter
pc Combustion pressure
ρ Density
pivc Inlet Valve Closing pressure
p1 Main Chamber pressure
p2 Pre-Combustion Chamber pressure
V
pm Motored pressure
R Specific gas constant
RoHR Rate of Heat Release
rpm Revolutions per minute
SCE Single Cylinder Engine
SCR Selective Catalyst Reduction
SI Spark Ignition
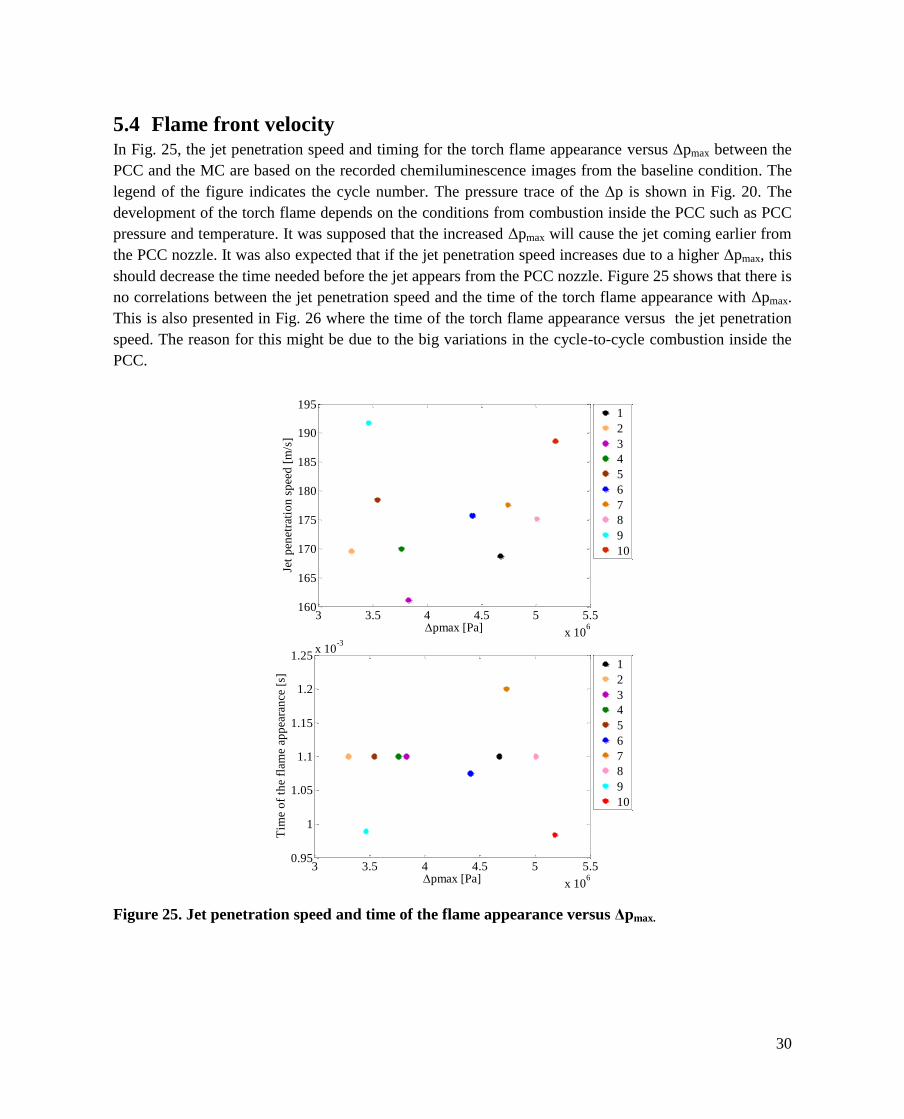
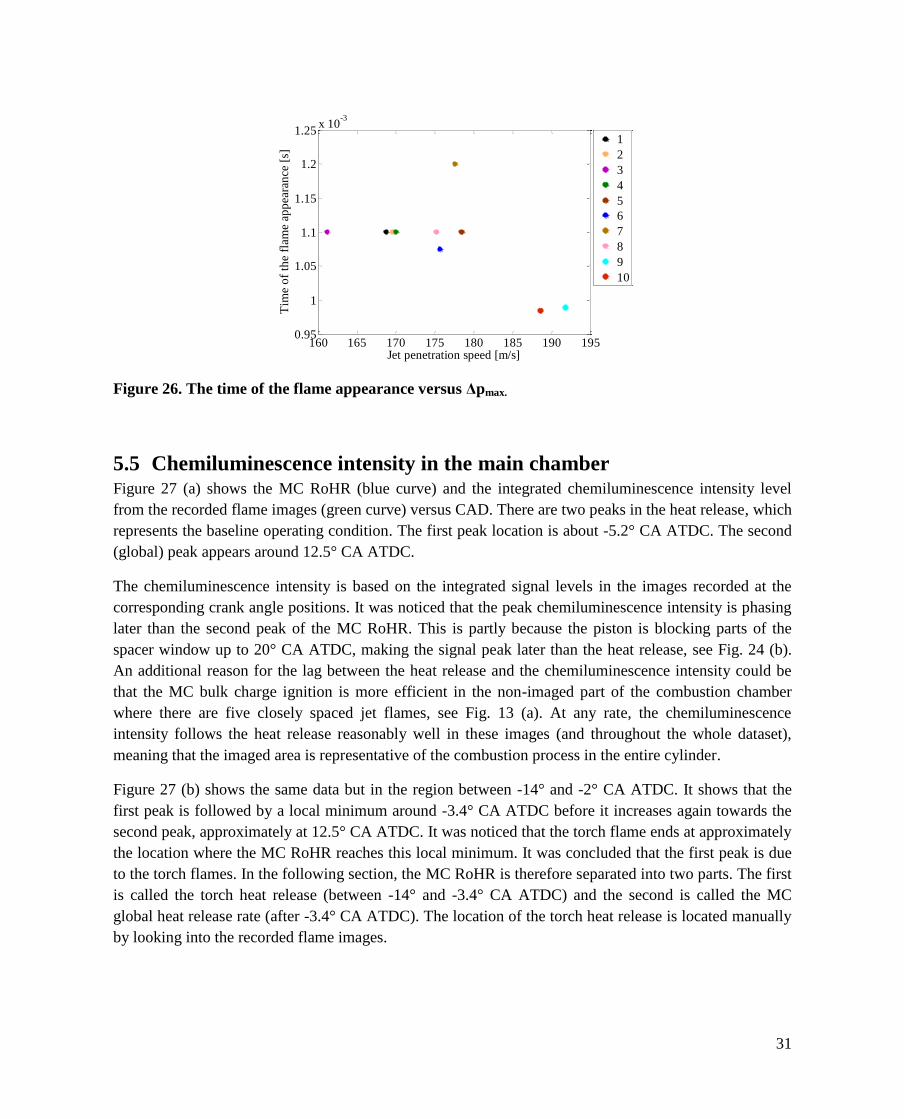
Sp Mean piston speed
TA Luft Technische Anleitung zur Reinhaltung der Luft
TDC Top Dead Centre
T1 Main Chamber temperature
T2 Pre-Combustion Chamber temperature
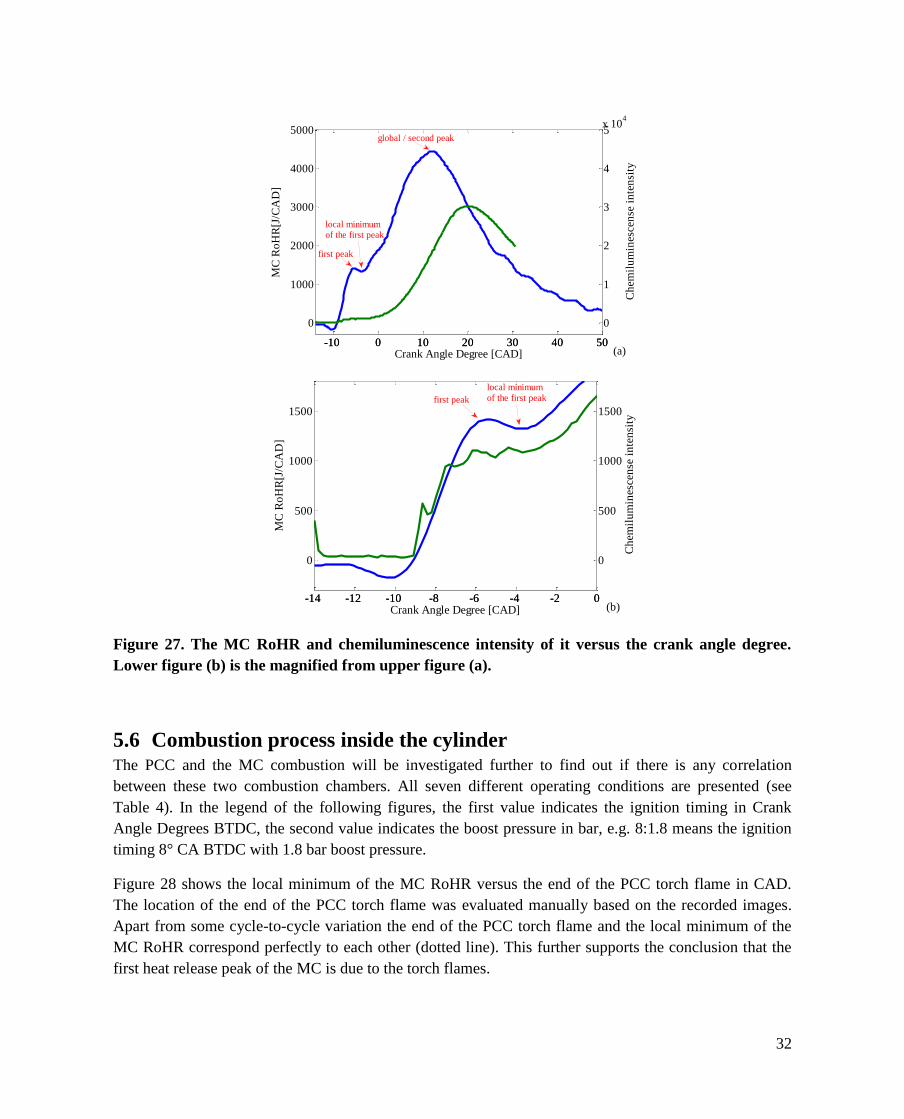
Tgas Gas temperature
Tivc Inlet Valve Closing temperature
Tref Reference temperature
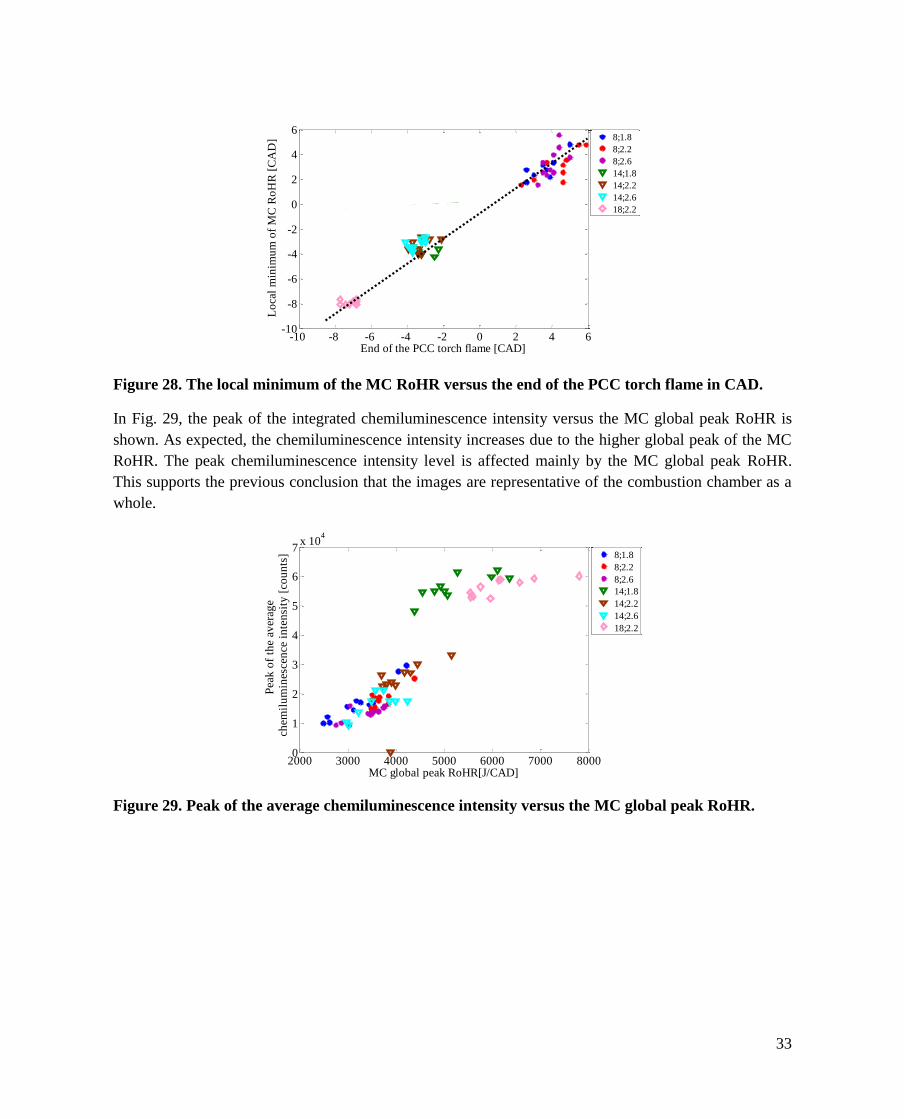
Twall Wall temperature
U1 Internal Energy of the Pre-Combustion Chamber
U2 Internal Energy of the Main Chamber
UN United Nations
Vd Displacement volume
Vivc Inlet Valve Closing volume
V1 Main Chamber volume
V2 Pre-Combustion Chamber volume
γ Specific Heat Ratio
γ0 Reference Value of Specific Heat Ratio
Δp Delta pressure
III
Contents
List of publications ...................................................................................................................................... I
Acknowledgement ....................................................................................................................................... II
Nomenclature ............................................................................................................................................ III
1.1 Combustion engines Internal combustion engines have been developed over a hundred years. In 1859, Etienne Lenoir built the
first gas-fired internal combustion engine despite a little knowledge of thermodynamics. Four years later,
Alphonson Beau de Rochas developed the four-stroke cycle. He realized the importance of compressing
the charge before combustion, but never managed to build an engine. It was Nikolaus A. Otto who built
the first four-stroke cycle spark ignition (SI) engine in 1876. After that Rudolf Diesel invented the
compression-ignited (CI) engine in 1892 [1- 4].
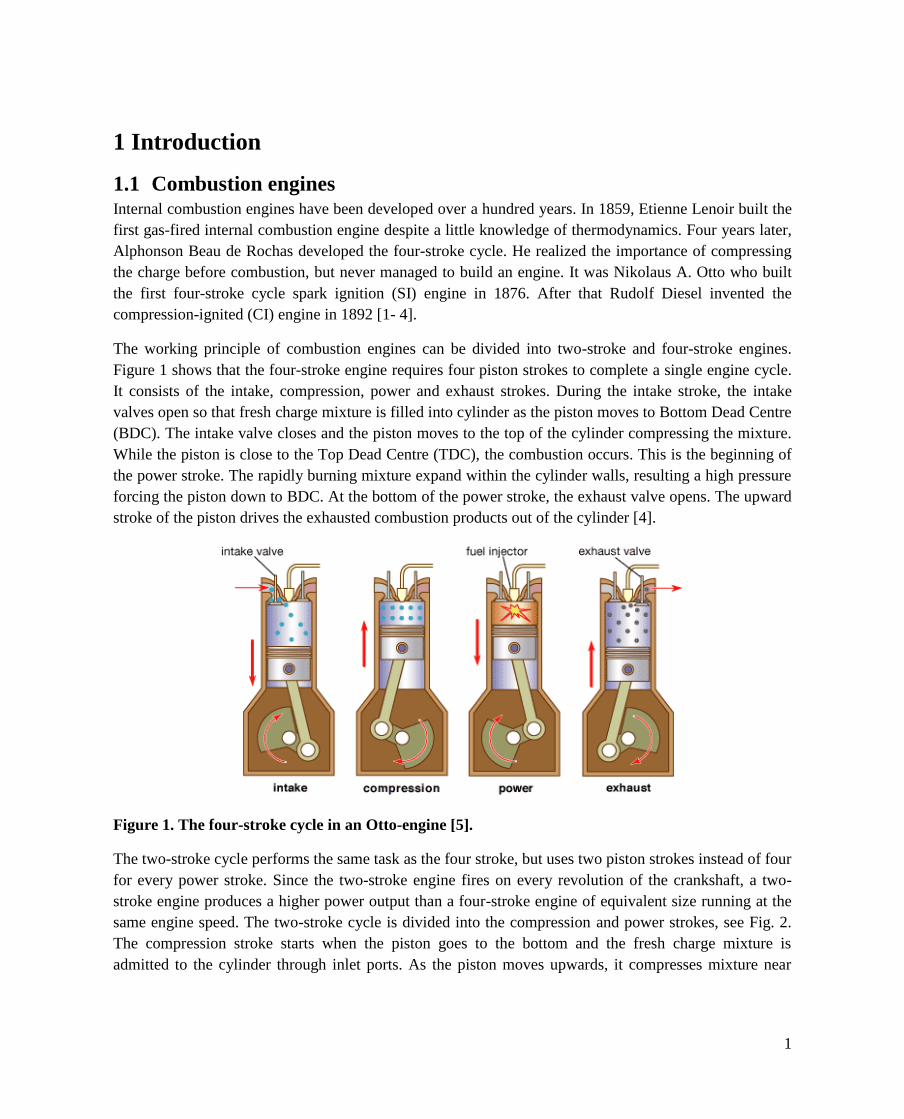
The working principle of combustion engines can be divided into two-stroke and four-stroke engines.
Figure 1 shows that the four-stroke engine requires four piston strokes to complete a single engine cycle.
It consists of the intake, compression, power and exhaust strokes. During the intake stroke, the intake
valves open so that fresh charge mixture is filled into cylinder as the piston moves to Bottom Dead Centre
(BDC). The intake valve closes and the piston moves to the top of the cylinder compressing the mixture.
While the piston is close to the Top Dead Centre (TDC), the combustion occurs. This is the beginning of
the power stroke. The rapidly burning mixture expand within the cylinder walls, resulting a high pressure
forcing the piston down to BDC. At the bottom of the power stroke, the exhaust valve opens. The upward
stroke of the piston drives the exhausted combustion products out of the cylinder [4].
Figure 1. The four-stroke cycle in an Otto-engine [5].
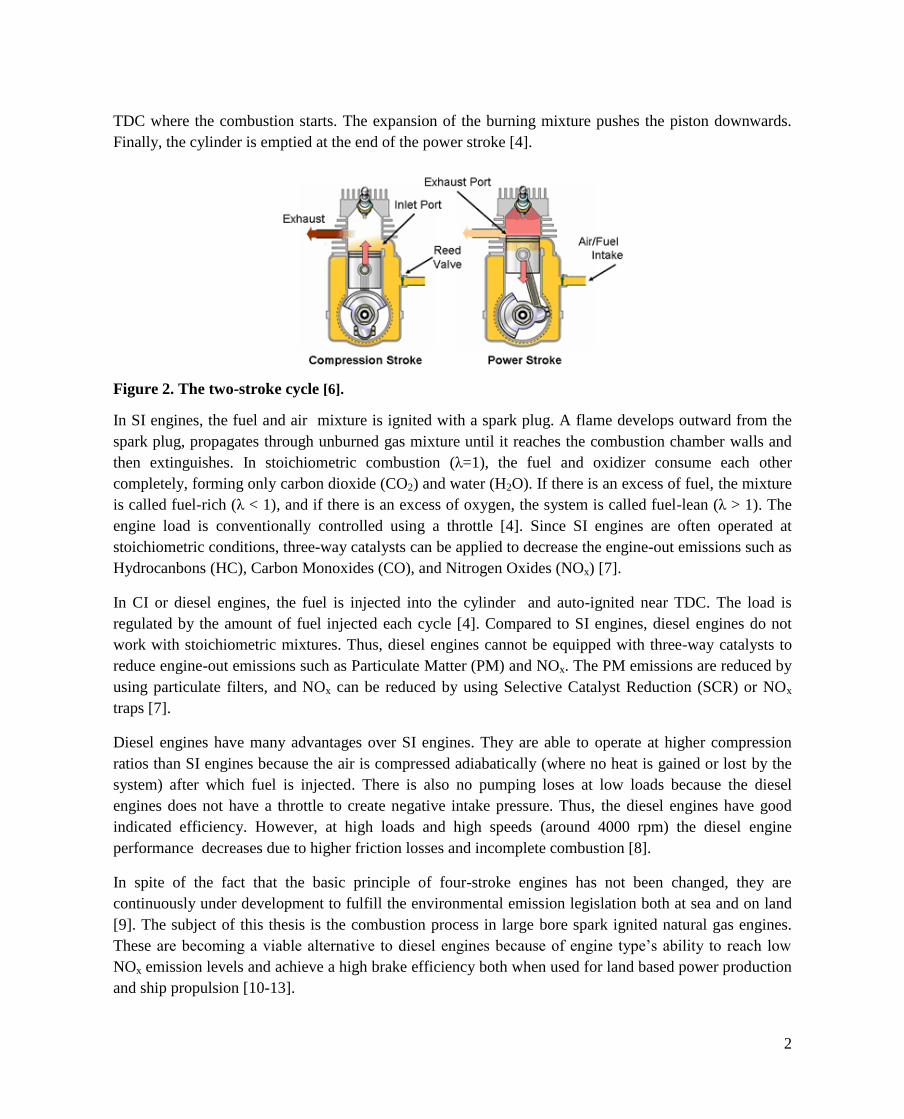
The two-stroke cycle performs the same task as the four stroke, but uses two piston strokes instead of four
for every power stroke. Since the two-stroke engine fires on every revolution of the crankshaft, a two-
stroke engine produces a higher power output than a four-stroke engine of equivalent size running at the
same engine speed. The two-stroke cycle is divided into the compression and power strokes, see Fig. 2.
The compression stroke starts when the piston goes to the bottom and the fresh charge mixture is
admitted to the cylinder through inlet ports. As the piston moves upwards, it compresses mixture near
2
TDC where the combustion starts. The expansion of the burning mixture pushes the piston downwards.
Finally, the cylinder is emptied at the end of the power stroke [4].
Figure 2. The two-stroke cycle [6].
In SI engines, the fuel and air mixture is ignited with a spark plug. A flame develops outward from the
spark plug, propagates through unburned gas mixture until it reaches the combustion chamber walls and
then extinguishes. In stoichiometric combustion (λ=1), the fuel and oxidizer consume each other
completely, forming only carbon dioxide (CO2) and water (H2O). If there is an excess of fuel, the mixture
is called fuel-rich (λ < 1), and if there is an excess of oxygen, the system is called fuel-lean (λ > 1). The
engine load is conventionally controlled using a throttle [4]. Since SI engines are often operated at
stoichiometric conditions, three-way catalysts can be applied to decrease the engine-out emissions such as
Hydrocanbons (HC), Carbon Monoxides (CO), and Nitrogen Oxides (NOx) [7].
In CI or diesel engines, the fuel is injected into the cylinder and auto-ignited near TDC. The load is
regulated by the amount of fuel injected each cycle [4]. Compared to SI engines, diesel engines do not
work with stoichiometric mixtures. Thus, diesel engines cannot be equipped with three-way catalysts to
reduce engine-out emissions such as Particulate Matter (PM) and NOx. The PM emissions are reduced by
using particulate filters, and NOx can be reduced by using Selective Catalyst Reduction (SCR) or NOx
traps [7].
Diesel engines have many advantages over SI engines. They are able to operate at higher compression
ratios than SI engines because the air is compressed adiabatically (where no heat is gained or lost by the
system) after which fuel is injected. There is also no pumping loses at low loads because the diesel
engines does not have a throttle to create negative intake pressure. Thus, the diesel engines have good
indicated efficiency. However, at high loads and high speeds (around 4000 rpm) the diesel engine
performance decreases due to higher friction losses and incomplete combustion [8].
In spite of the fact that the basic principle of four-stroke engines has not been changed, they are
continuously under development to fulfill the environmental emission legislation both at sea and on land
[9]. The subject of this thesis is the combustion process in large bore spark ignited natural gas engines.
These are becoming a viable alternative to diesel engines because of engine type’s ability to reach low
NOx emission levels and achieve a high brake efficiency both when used for land based power production
and ship propulsion [10-13].
3
1.2 Emissions The emission levels of the lean burn spark ignited natural gas engine are legally regulated when operating
an engine both at sea and on land. One of the most important regulations is made by the Marine
Environment Protection Committee (MEPC) of the International Maritime Organization (IMO) as a
United Nations (UN) specialized agency from 1948. Currently IMO has 170 (out of 193 UN) member
states and three associate members, i.e. Faroes, Hong Kong and Macao. The purpose of IMO is to
promoto maritime safety and control of marine pollution from ships when operating inside the Emission
Control Areas (ECA), i.e. the North American Emission Control Area and the United States Caribbean
Sea Area [14].
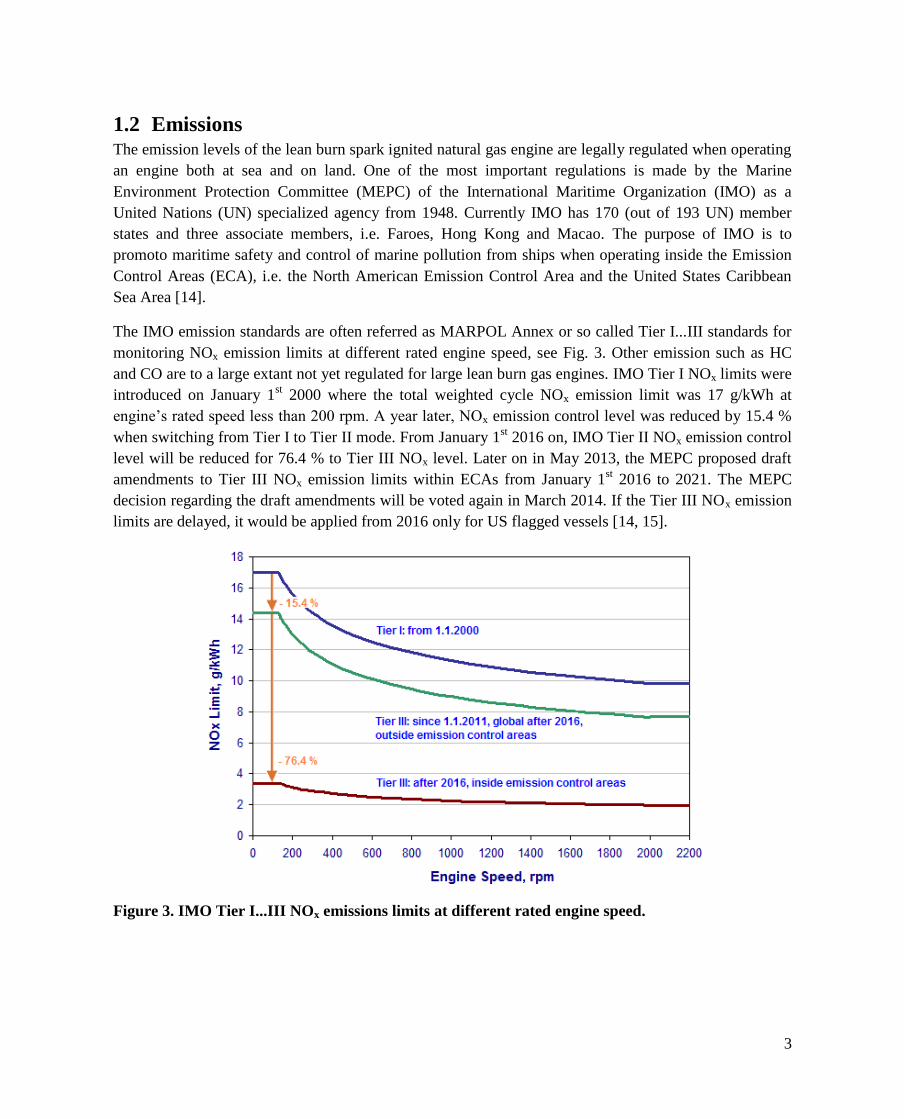
The IMO emission standards are often referred as MARPOL Annex or so called Tier I...III standards for
monitoring NOx emission limits at different rated engine speed, see Fig. 3. Other emission such as HC
and CO are to a large extant not yet regulated for large lean burn gas engines. IMO Tier I NOx limits were
introduced on January 1st 2000 where the total weighted cycle NOx emission limit was 17 g/kWh at
engine’s rated speed less than 200 rpm. A year later, NOx emission control level was reduced by 15.4 %
when switching from Tier I to Tier II mode. From January 1st 2016 on, IMO Tier II NOx emission control
level will be reduced for 76.4 % to Tier III NOx level. Later on in May 2013, the MEPC proposed draft
amendments to Tier III NOx emission limits within ECAs from January 1st 2016 to 2021. The MEPC
decision regarding the draft amendments will be voted again in March 2014. If the Tier III NOx emission
limits are delayed, it would be applied from 2016 only for US flagged vessels [14, 15].
Figure 3. IMO Tier I...III NOx emissions limits at different rated engine speed.
4
The lean burn natural gas engines used in a power plant application producing electricity is controlled
with German TA Luft air pollution regulation (Technische Anleitung zur Reinhaltung der Luft). It is
legally regulated by the German Federal Ministry for the Environment, Nature Conservation and Nuclear
Safety, BMU (Bundesministerium für Umwelt, Naturschutz und Reaktorsicherheit) in 1986. The latest
revision of TA Luft from July 24th
2002 have been widely applied all over the world within a specific
country regulation regarding NOx, CO and HC emissions [16].Hence, the local emission limits in the
countries are the strongest driver for future natural gas engine development [17]. Table 1 shows some
example countries about TA Luft regulations
Table 1. TA Luft regulations for gas engines in different countries.
Country NOx
[mg/Nm3] 1)
CO
[mg/Nm3]
1)
HC
[mg/Nm3]
1)
Finland < 150 - -
Germany 500 500 -
France 350-875 2)
650 -
Italy 500 650 600
Switzerland 400 650 - 1)
The exhaust volume is based on dry exhaust with 5% residual
oxygen under standardized conditions (g/Nm3)
2)NOx limit depends on the operating time (h/year) and the power
of the engine
NOx is composed primarily of Nitric Oxide (NO) and Nitrogen dioxide (NO2). Emissions of NOx from
combustion are primaly in form of NO [4], and all NO2 is subsequently formed from NO. In all types of
combustion there are three mechanisms for NO formation, i.e. fuel, prompt and thermal NO. Fuel NO
results from fuels that contain nitrogen and can be describe as
(1)
Here the fuel nitrogen compounds into HCN (hydrocyanic acid) and NH3 (ammonia) which are later
oxidized to form NO. The rest is converted to N2 [18]. Promp NO is formed from molecular N2 in the air
combining with hydrocarbon radicals in fuel-rich conditions is indicated as
(2)
The CH, which is formed at the flame front reacts with the nitrogen of the air, forming HCN, which
reacts further to NO [18]. Thermal NO is controlled by the nitrogen and oxygen molar concentrations at
high combustion temperatures above 1600K. It can be characterized by a strong dependence on
5
temperature and relatively slow reaction rates. In case of natural gas fuelled engines, thermal NO is the
dominating mechanism behind the NO emissions. The reaction mechanism of thermal NO or so called
Zeldovich mechanism [19] can be expressed as
(3)
(4)
(5)
where in the Eq. (3) O atoms react with N2 producing NO and N radical species. Then N atoms react
quickly with O2 in Eq. (4) to form another NO and O radicals. By adding Eq. (5) we obtain the extended
Zeldovich mechanism. NOx is not only an important air pollutant by itself, but also reacts in the
atmosphere to form trospospheric ozone (O3) in the ambient air and acid rain. There are several ways to
reduce NOx when operating large bore gas engines, e.g. lean burn (facilitated through pre-combustion
chamber (PCC) technology), ignition timing, and exhaust gas recirculation (EGR) [14, 20].
HC is produced due to incomplete combustion, for example due to low temperature, quenching of flames
on cold walls or hydrocarbons absorbed by the lubrication oil [4]. The wall quenching mechanism occurs
when combustion temperature near combustion chamber walls becomes too low to fully oxidize the fuel
due to heat loss. This phenomena is very sensitive to wall temperatures and lambda (λ). The latter one is
defined as the ratio of the actual air quantity relative to the ideal stoichiometrically required quantity.
Other sources of HC are mixtures that are either too rich (λ < 1) or too lean (λ > 1) to burn completely. In
large bore spark ignited gas engines, with λ < 1, HC increases due to a little amount of oxygen for
complete combustion in the combustion chamber. The amount of HC can thereby be reduced by
increasing lambda (λ ≤1) until specific limit and the ignition limit of the mixture is reached, which leads
to misfiring when there is homogeneous mixture formation. An increase in compression ration results in a
better lean-off capability and allows the ignition to be retarded due to the fast combustion. This enables
reduced HC and NOx emissions. Another is the EGR technique where recycled exhaust gas is mixed with
fresh intake air to reduce the flame temperature [21-23]. High rates of EGR tend to increase the HC
emissions.
CO is one reaction step in the hydrocarbon oxidation mechanism, the last being the oxidation of CO into
CO2 can be describe as
(6)
Thus, CO emissions are the results of incomplete combustion in intermediate temperature regions where
OH concentration becomes low and results in diminished conversion of CO to CO2. Therefore, the
combustion temperature affects CO emissions significantly where the CO emissions decrease
substantially when the temperature reaches the critical temperature level. CO emissions are controlled
mainly by the lambda. When λ > 1, the CO is very low and nearly independent of lambda value. CO
emissions can be reduced by using an oxidation catalyst in the exhaust duct, converting CO in the exhaust
gas to CO2 through reaction with O2 [4, 23].
6
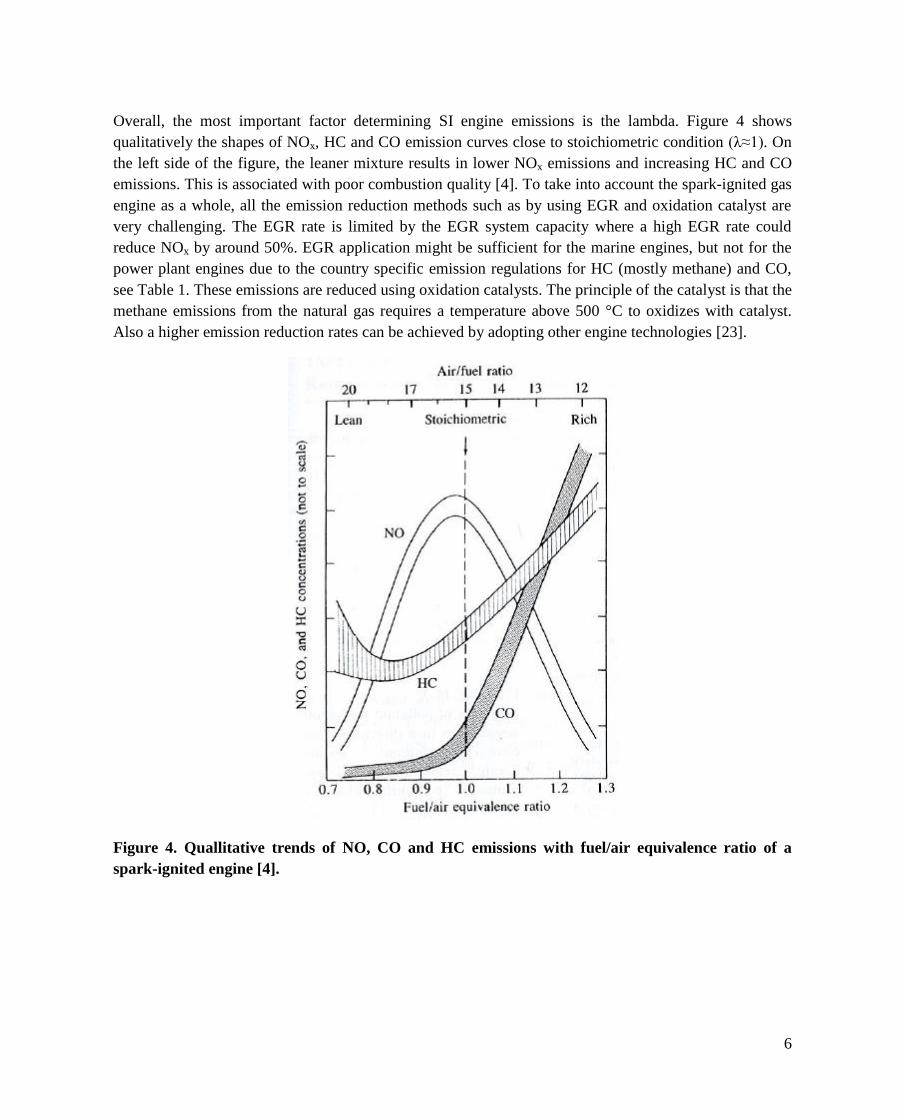
Overall, the most important factor determining SI engine emissions is the lambda. Figure 4 shows
qualitatively the shapes of NOx, HC and CO emission curves close to stoichiometric condition (λ≈1). On
the left side of the figure, the leaner mixture results in lower NOx emissions and increasing HC and CO
emissions. This is associated with poor combustion quality [4]. To take into account the spark-ignited gas
engine as a whole, all the emission reduction methods such as by using EGR and oxidation catalyst are
very challenging. The EGR rate is limited by the EGR system capacity where a high EGR rate could
reduce NOx by around 50%. EGR application might be sufficient for the marine engines, but not for the
power plant engines due to the country specific emission regulations for HC (mostly methane) and CO,
see Table 1. These emissions are reduced using oxidation catalysts. The principle of the catalyst is that the
methane emissions from the natural gas requires a temperature above 500 °C to oxidizes with catalyst.
Also a higher emission reduction rates can be achieved by adopting other engine technologies [23].
Figure 4. Quallitative trends of NO, CO and HC emissions with fuel/air equivalence ratio of a
spark-ignited engine [4].
7
2 Gas engine combustion
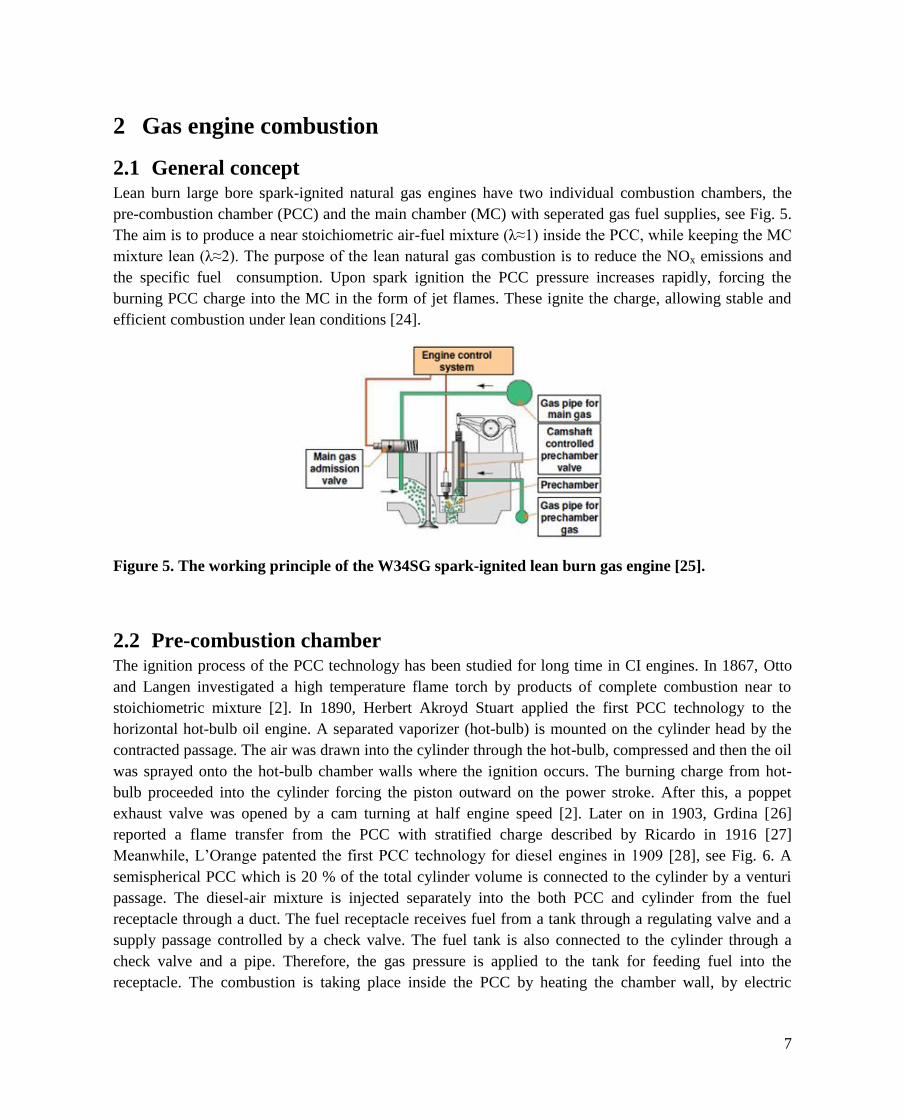
2.1 General concept Lean burn large bore spark-ignited natural gas engines have two individual combustion chambers, the
pre-combustion chamber (PCC) and the main chamber (MC) with seperated gas fuel supplies, see Fig. 5.
The aim is to produce a near stoichiometric air-fuel mixture (λ≈1) inside the PCC, while keeping the MC
mixture lean (λ≈2). The purpose of the lean natural gas combustion is to reduce the NOx emissions and
the specific fuel consumption. Upon spark ignition the PCC pressure increases rapidly, forcing the
burning PCC charge into the MC in the form of jet flames. These ignite the charge, allowing stable and
efficient combustion under lean conditions [24].
Figure 5. The working principle of the W34SG spark-ignited lean burn gas engine [25].
2.2 Pre-combustion chamber The ignition process of the PCC technology has been studied for long time in CI engines. In 1867, Otto
and Langen investigated a high temperature flame torch by products of complete combustion near to
stoichiometric mixture [2]. In 1890, Herbert Akroyd Stuart applied the first PCC technology to the
horizontal hot-bulb oil engine. A separated vaporizer (hot-bulb) is mounted on the cylinder head by the
contracted passage. The air was drawn into the cylinder through the hot-bulb, compressed and then the oil
was sprayed onto the hot-bulb chamber walls where the ignition occurs. The burning charge from hot-
bulb proceeded into the cylinder forcing the piston outward on the power stroke. After this, a poppet
exhaust valve was opened by a cam turning at half engine speed [2]. Later on in 1903, Grdina [26]
reported a flame transfer from the PCC with stratified charge described by Ricardo in 1916 [27]
Meanwhile, L’Orange patented the first PCC technology for diesel engines in 1909 [28], see Fig. 6. A
semispherical PCC which is 20 % of the total cylinder volume is connected to the cylinder by a venturi
passage. The diesel-air mixture is injected separately into the both PCC and cylinder from the fuel
receptacle through a duct. The fuel receptacle receives fuel from a tank through a regulating valve and a
supply passage controlled by a check valve. The fuel tank is also connected to the cylinder through a
check valve and a pipe. Therefore, the gas pressure is applied to the tank for feeding fuel into the
receptacle. The combustion is taking place inside the PCC by heating the chamber wall, by electric
8
sparks, or by the compression heat alone. The fast combustion inside PCC causes a high pressure driving
the burning mixture into the cylinder trough a venturi pass [29].
Figure 6. Pre-combustion chamber by Prosper L’Orange [29].
The research of PCC flame ignition by a high-temperature flame torch ejected by an auxiliary
stoichiometric mixture was carried out for the first time in 1935 at the Institute of Chemical Physics in
Internal Combustion Engines, Moscow. Until 1941 the PCC flame ignition process was studied on a
kerosene tractor engine. Then it was applied to various internal combustion engines until 1952 [30].
Based on the previous studies by others, the Gussak brothers proposed a stratified charge and cut-off PCC
system in 1950. Here a high temperature torch from the PCC was passed to the combustion through
nozzle holes. They also demonstrated the impact of the vortex flow velocity with different PCC nozzle
geometry design based on Chenau’s studies [31] and an application of the LAG-process in PCC engines.
The LAG-process (Lavinia Aktyvatsia Gorenia), which means Avalanche Activated Combustion, is a
process where the rich mixture inside the PCC creates an excess of radicals. These radicals are then
mixed into the lean mixture in the cylinder by the turbulent jet emerging from PCC nozzle. The purpose
is to reduce the specific fuel consumption and improve the combustion stability [32]. In 1955, Schilling
improved starting of the engine at a low speed range, ameliorate the heat exchance condition in the PCC,
reducing knocking, and a better fuel supply to PCC and cylinder [33].
In 1990 Maxson et al. investigated the Pulsed Jet Combustion (PJC) process (based on Gussak’s studies)
or, in other words, the LAG-process in a constant volume PCC cavity of spark ignited engine. He
demonstated the formation of a turbulent jet plume from the PCC in PJC [34, 35]. Murase et al. continued
the PJC process research of Maxson et al. and demonstrated how the flame jet is produced and the speed
of it in a transparent rectangular combustion cavity [36]. Later on Kawabata et al. investigated the flame
propagation inside the main chamber of a natural gas engine but did not analyze the PCC heat release
[37]. Tsunoda et al. established the effect of the Miller cycle in the natural gas engine [38] and
Roethlisberger et al. presented a comparison between direct and indirect PCC spark ignition in a natural
gas engine [39].
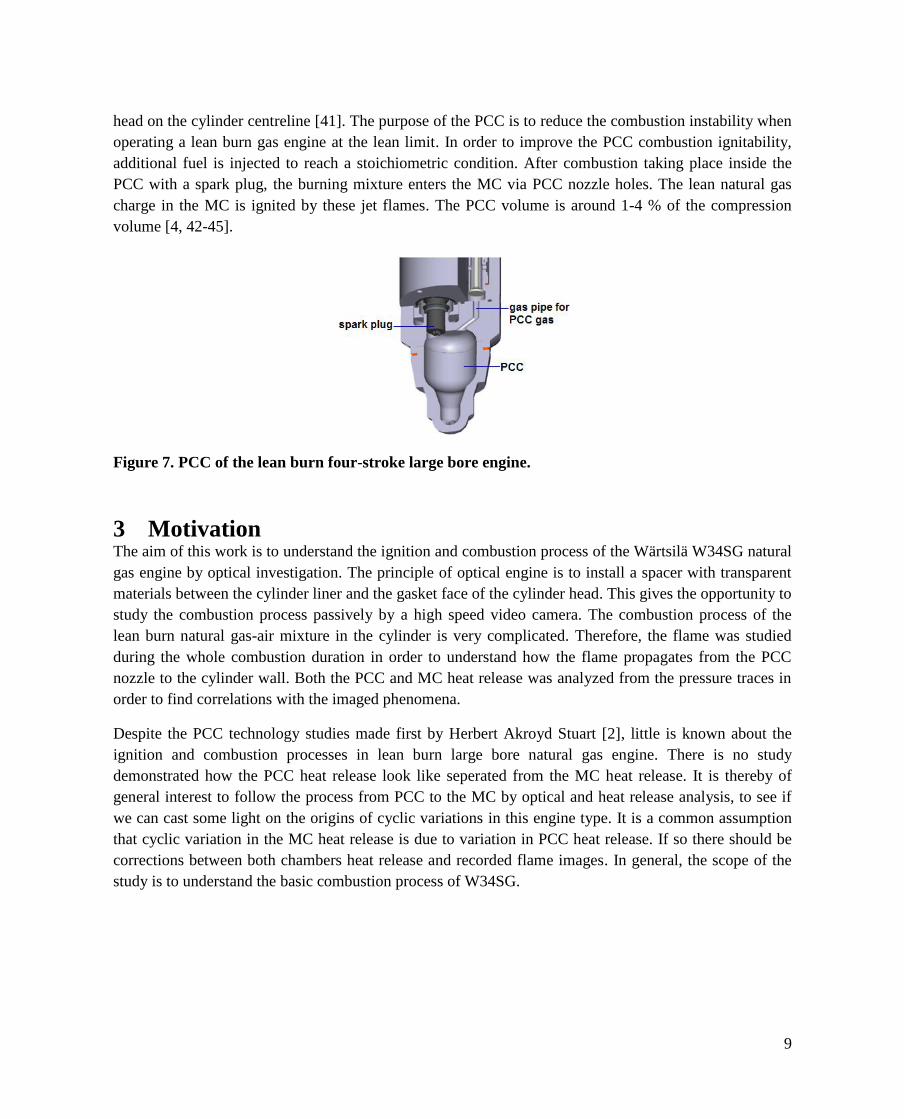
Although the PCC has a very long history, it is very vague who first applied it to a natural gas engine.
Wärtsilä introduced their first spark ignited (SG) lean burn four-stroke large bore engine with PCC
technology in 1993 [40], see Fig.7. The PCC is rotationally symmetrical and it is built into the cylinder
9
head on the cylinder centreline [41]. The purpose of the PCC is to reduce the combustion instability when
operating a lean burn gas engine at the lean limit. In order to improve the PCC combustion ignitability,
additional fuel is injected to reach a stoichiometric condition. After combustion taking place inside the
PCC with a spark plug, the burning mixture enters the MC via PCC nozzle holes. The lean natural gas
charge in the MC is ignited by these jet flames. The PCC volume is around 1-4 % of the compression
volume [4, 42-45].
Figure 7. PCC of the lean burn four-stroke large bore engine.
3 Motivation The aim of this work is to understand the ignition and combustion process of the Wärtsilä W34SG natural
gas engine by optical investigation. The principle of optical engine is to install a spacer with transparent
materials between the cylinder liner and the gasket face of the cylinder head. This gives the opportunity to
study the combustion process passively by a high speed video camera. The combustion process of the
lean burn natural gas-air mixture in the cylinder is very complicated. Therefore, the flame was studied
during the whole combustion duration in order to understand how the flame propagates from the PCC
nozzle to the cylinder wall. Both the PCC and MC heat release was analyzed from the pressure traces in
order to find correlations with the imaged phenomena.
Despite the PCC technology studies made first by Herbert Akroyd Stuart [2], little is known about the
ignition and combustion processes in lean burn large bore natural gas engine. There is no study
demonstrated how the PCC heat release look like seperated from the MC heat release. It is thereby of
general interest to follow the process from PCC to the MC by optical and heat release analysis, to see if
we can cast some light on the origins of cyclic variations in this engine type. It is a common assumption
that cyclic variation in the MC heat release is due to variation in PCC heat release. If so there should be
corrections between both chambers heat release and recorded flame images. In general, the scope of the
study is to understand the basic combustion process of W34SG.
10
4 Engine experiments
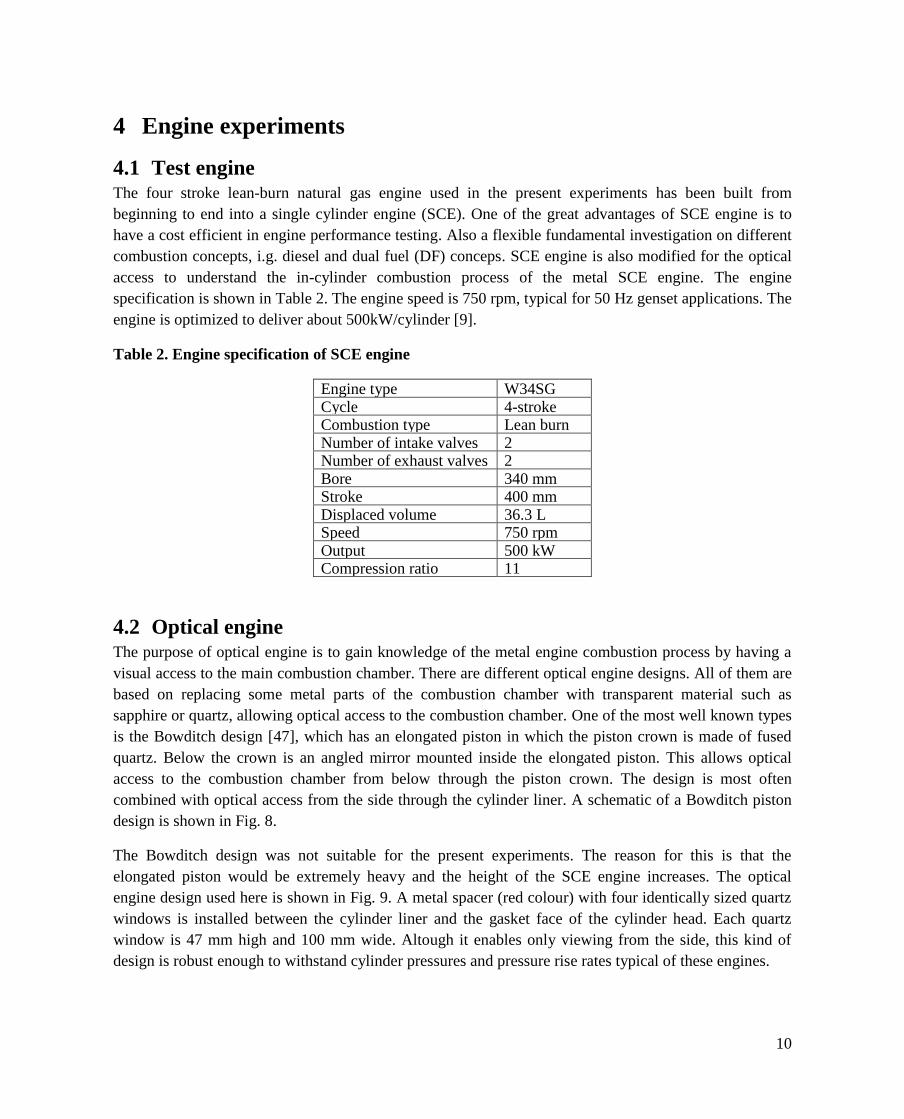
4.1 Test engine The four stroke lean-burn natural gas engine used in the present experiments has been built from
beginning to end into a single cylinder engine (SCE). One of the great advantages of SCE engine is to
have a cost efficient in engine performance testing. Also a flexible fundamental investigation on different
combustion concepts, i.g. diesel and dual fuel (DF) conceps. SCE engine is also modified for the optical
access to understand the in-cylinder combustion process of the metal SCE engine. The engine
specification is shown in Table 2. The engine speed is 750 rpm, typical for 50 Hz genset applications. The
engine is optimized to deliver about 500kW/cylinder [9].
Table 2. Engine specification of SCE engine
Engine type W34SG Cycle 4-stroke Combustion type Lean burn Number of intake valves 2 Number of exhaust valves 2 Bore 340 mm Stroke 400 mm Displaced volume 36.3 L
Speed 750 rpm Output 500 kW
kW/cylinder Compression ratio 11
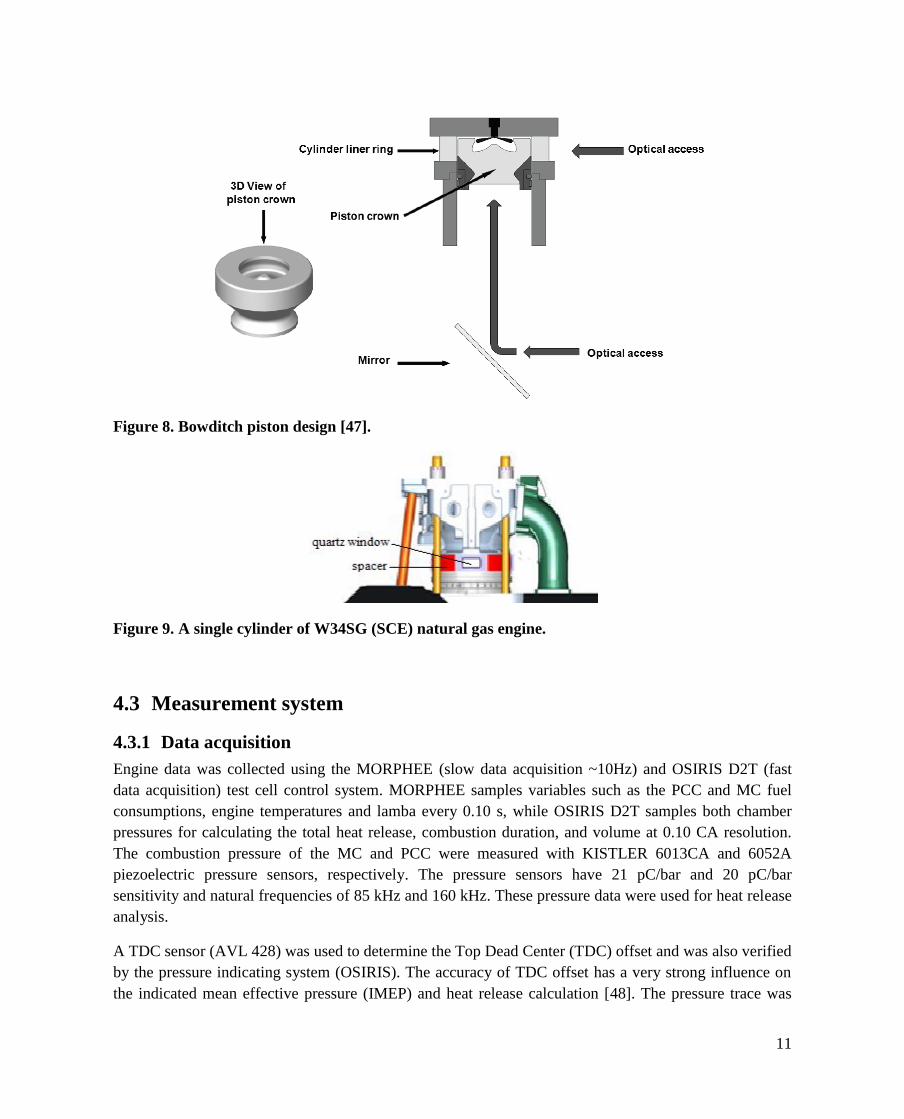
4.2 Optical engine The purpose of optical engine is to gain knowledge of the metal engine combustion process by having a
visual access to the main combustion chamber. There are different optical engine designs. All of them are
based on replacing some metal parts of the combustion chamber with transparent material such as
sapphire or quartz, allowing optical access to the combustion chamber. One of the most well known types
is the Bowditch design [47], which has an elongated piston in which the piston crown is made of fused
quartz. Below the crown is an angled mirror mounted inside the elongated piston. This allows optical
access to the combustion chamber from below through the piston crown. The design is most often
combined with optical access from the side through the cylinder liner. A schematic of a Bowditch piston
design is shown in Fig. 8.
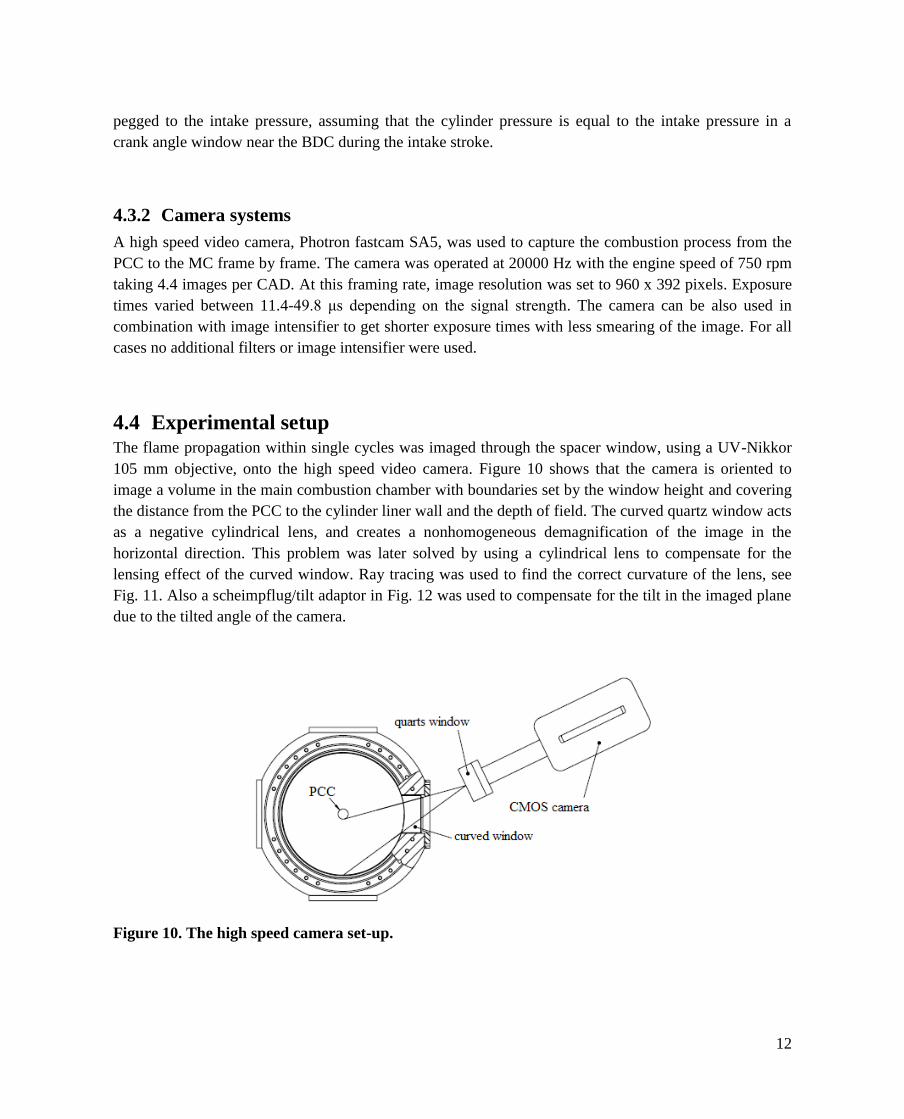
The Bowditch design was not suitable for the present experiments. The reason for this is that the
elongated piston would be extremely heavy and the height of the SCE engine increases. The optical
engine design used here is shown in Fig. 9. A metal spacer (red colour) with four identically sized quartz
windows is installed between the cylinder liner and the gasket face of the cylinder head. Each quartz
window is 47 mm high and 100 mm wide. Altough it enables only viewing from the side, this kind of
design is robust enough to withstand cylinder pressures and pressure rise rates typical of these engines.
11
Figure 8. Bowditch piston design [47].
Figure 9. A single cylinder of W34SG (SCE) natural gas engine.
4.3 Measurement system
4.3.1 Data acquisition
Engine data was collected using the MORPHEE (slow data acquisition ~10Hz) and OSIRIS D2T (fast
data acquisition) test cell control system. MORPHEE samples variables such as the PCC and MC fuel
consumptions, engine temperatures and lamba every 0.10 s, while OSIRIS D2T samples both chamber
pressures for calculating the total heat release, combustion duration, and volume at 0.10 CA resolution.
The combustion pressure of the MC and PCC were measured with KISTLER 6013CA and 6052A
piezoelectric pressure sensors, respectively. The pressure sensors have 21 pC/bar and 20 pC/bar
sensitivity and natural frequencies of 85 kHz and 160 kHz. These pressure data were used for heat release
analysis.
A TDC sensor (AVL 428) was used to determine the Top Dead Center (TDC) offset and was also verified
by the pressure indicating system (OSIRIS). The accuracy of TDC offset has a very strong influence on
the indicated mean effective pressure (IMEP) and heat release calculation [48]. The pressure trace was
12
pegged to the intake pressure, assuming that the cylinder pressure is equal to the intake pressure in a
crank angle window near the BDC during the intake stroke.
4.3.2 Camera systems
A high speed video camera, Photron fastcam SA5, was used to capture the combustion process from the
PCC to the MC frame by frame. The camera was operated at 20000 Hz with the engine speed of 750 rpm
taking 4.4 images per CAD. At this framing rate, image resolution was set to 960 x 392 pixels. Exposure
times varied between 11.4-49.8 μs depending on the signal strength. The camera can be also used in
combination with image intensifier to get shorter exposure times with less smearing of the image. For all
cases no additional filters or image intensifier were used.
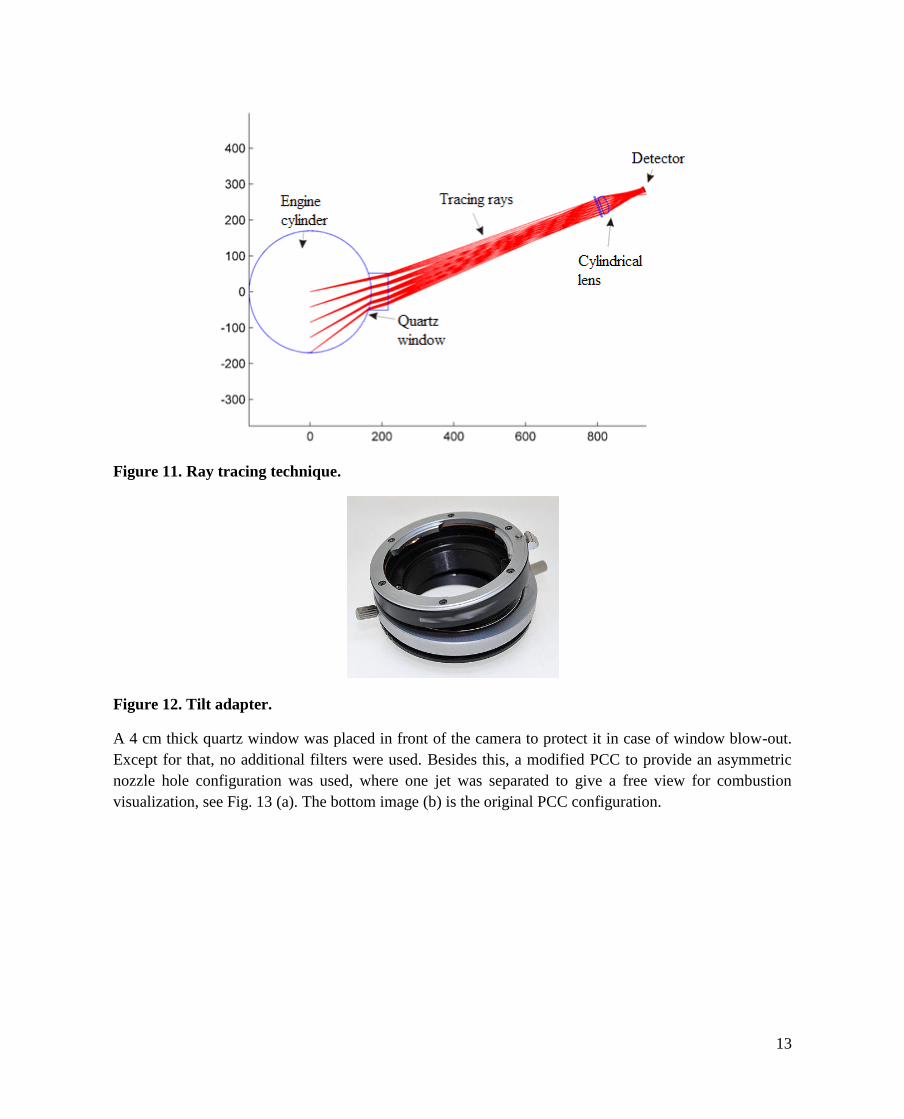
4.4 Experimental setup The flame propagation within single cycles was imaged through the spacer window, using a UV-Nikkor
105 mm objective, onto the high speed video camera. Figure 10 shows that the camera is oriented to
image a volume in the main combustion chamber with boundaries set by the window height and covering
the distance from the PCC to the cylinder liner wall and the depth of field. The curved quartz window acts
as a negative cylindrical lens, and creates a nonhomogeneous demagnification of the image in the
horizontal direction. This problem was later solved by using a cylindrical lens to compensate for the
lensing effect of the curved window. Ray tracing was used to find the correct curvature of the lens, see
Fig. 11. Also a scheimpflug/tilt adaptor in Fig. 12 was used to compensate for the tilt in the imaged plane
due to the tilted angle of the camera.
Figure 10. The high speed camera set-up.
13
Figure 11. Ray tracing technique.
Figure 12. Tilt adapter.
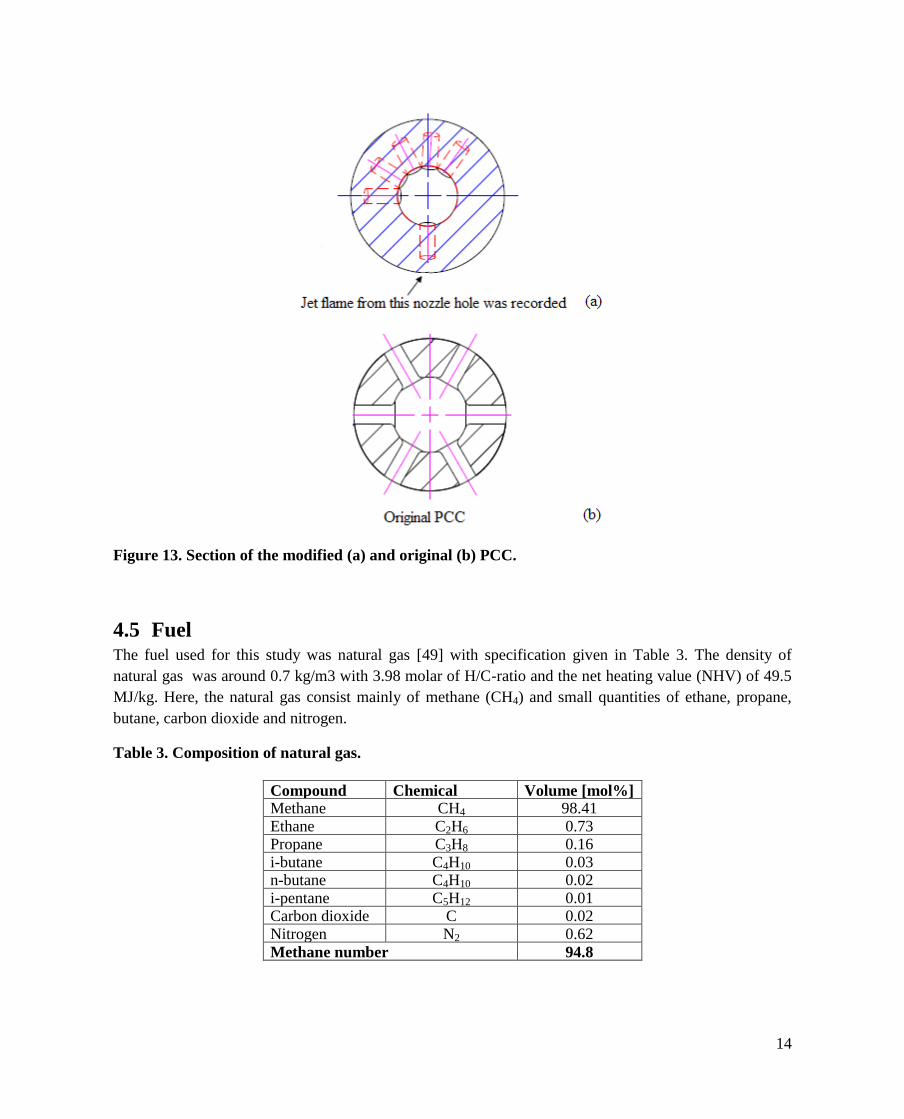
A 4 cm thick quartz window was placed in front of the camera to protect it in case of window blow-out.
Except for that, no additional filters were used. Besides this, a modified PCC to provide an asymmetric
nozzle hole configuration was used, where one jet was separated to give a free view for combustion
visualization, see Fig. 13 (a). The bottom image (b) is the original PCC configuration.
14
Figure 13. Section of the modified (a) and original (b) PCC.
4.5 Fuel The fuel used for this study was natural gas [49] with specification given in Table 3. The density of
natural gas was around 0.7 kg/m3 with 3.98 molar of H/C-ratio and the net heating value (NHV) of 49.5
MJ/kg. Here, the natural gas consist mainly of methane (CH4) and small quantities of ethane, propane,
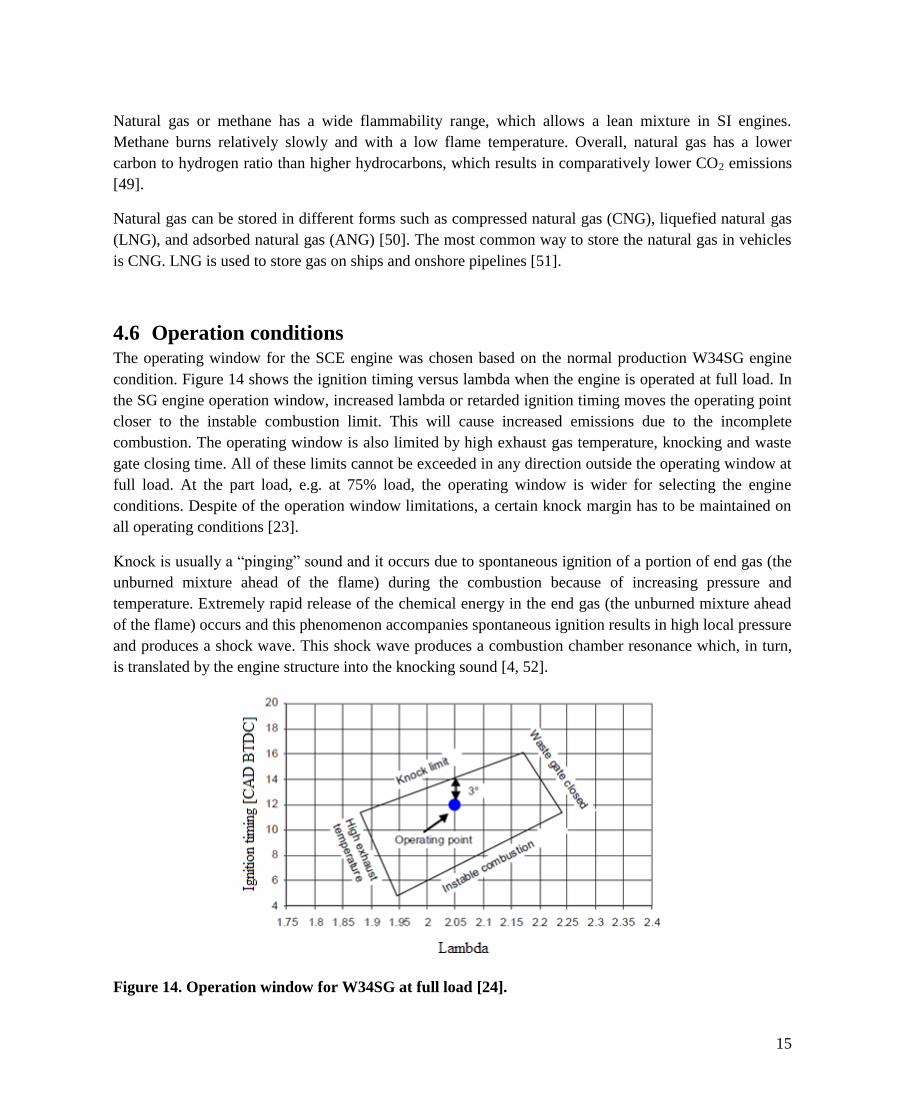
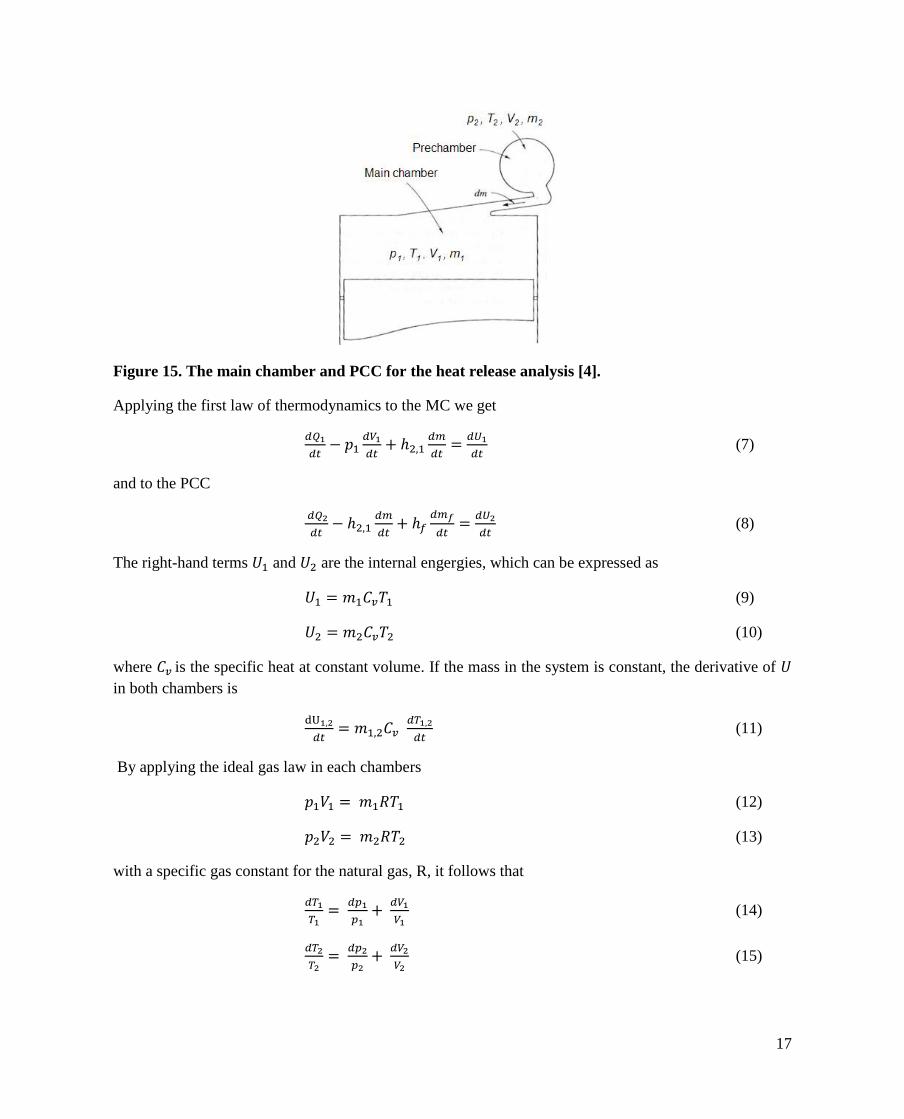
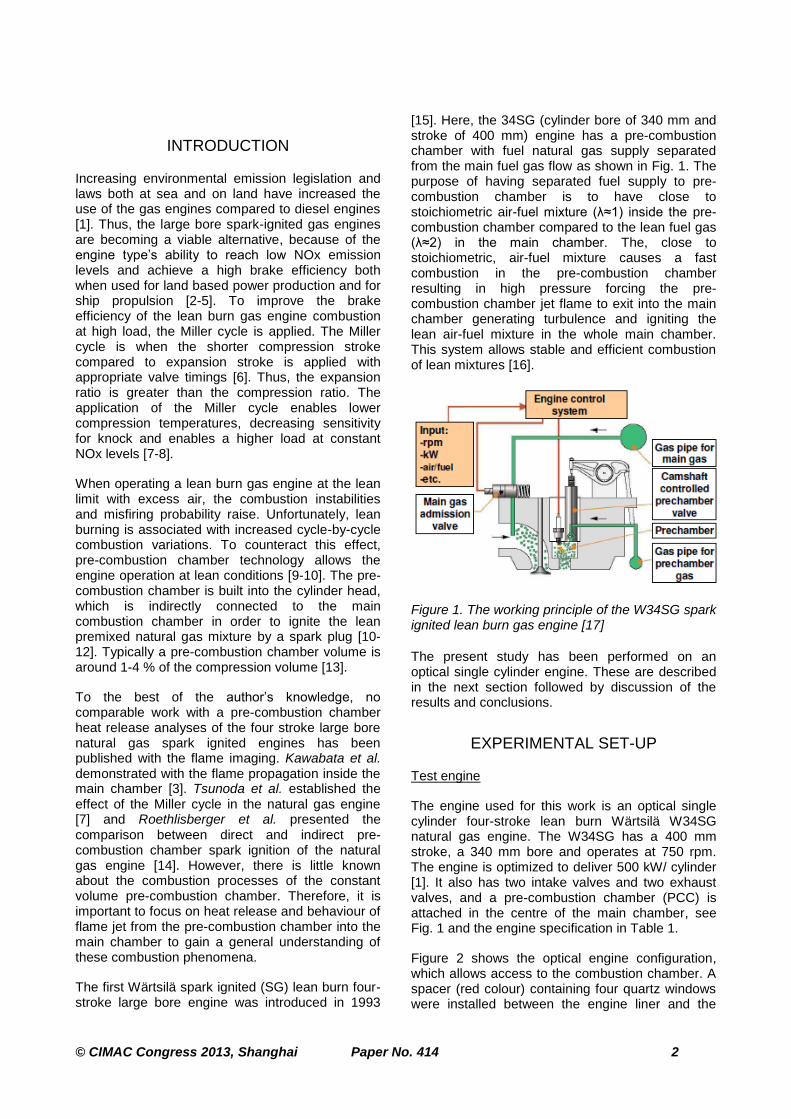
Increasing environmental emission legislation and laws both at sea and on land have increased the use of the gas engines compared to diesel engines [1]. Thus, the large bore spark-ignited gas engines are becoming a viable alternative, because of the engine type’s ability to reach low NOx emission levels and achieve a high brake efficiency both when used for land based power production and for ship propulsion [2-5]. To improve the brake efficiency of the lean burn gas engine combustion at high load, the Miller cycle is applied. The Miller cycle is when the shorter compression stroke compared to expansion stroke is applied with appropriate valve timings [6]. Thus, the expansion ratio is greater than the compression ratio. The application of the Miller cycle enables lower compression temperatures, decreasing sensitivity for knock and enables a higher load at constant NOx levels [7-8].
When operating a lean burn gas engine at the lean limit with excess air, the combustion instabilities and misfiring probability raise. Unfortunately, lean burning is associated with increased cycle-by-cycle combustion variations. To counteract this effect, pre-combustion chamber technology allows the engine operation at lean conditions [9-10]. The pre-combustion chamber is built into the cylinder head, which is indirectly connected to the main combustion chamber in order to ignite the lean premixed natural gas mixture by a spark plug [10-12]. Typically a pre-combustion chamber volume is around 1-4 % of the compression volume [13].
To the best of the author’s knowledge, no comparable work with a pre-combustion chamber heat release analyses of the four stroke large bore natural gas spark ignited engines has been published with the flame imaging. Kawabata et al. demonstrated with the flame propagation inside the main chamber [3]. Tsunoda et al. established the effect of the Miller cycle in the natural gas engine [7] and Roethlisberger et al. presented the comparison between direct and indirect pre-combustion chamber spark ignition of the natural gas engine [14]. However, there is little known about the combustion processes of the constant volume pre-combustion chamber. Therefore, it is important to focus on heat release and behaviour of flame jet from the pre-combustion chamber into the main chamber to gain a general understanding of these combustion phenomena.
The first Wärtsilä spark ignited (SG) lean burn four-stroke large bore engine was introduced in 1993
[15]. Here, the 34SG (cylinder bore of 340 mm and stroke of 400 mm) engine has a pre-combustion chamber with fuel natural gas supply separated from the main fuel gas flow as shown in Fig. 1. The purpose of having separated fuel supply to pre-combustion chamber is to have close to stoichiometric air-fuel mixture (λ≈1) inside the pre-combustion chamber compared to the lean fuel gas (λ≈2) in the main chamber. The, close to stoichiometric, air-fuel mixture causes a fast combustion in the pre-combustion chamber resulting in high pressure forcing the pre-combustion chamber jet flame to exit into the main chamber generating turbulence and igniting the lean air-fuel mixture in the whole main chamber. This system allows stable and efficient combustion of lean mixtures [16].
Figure 1. The working principle of the W34SG spark ignited lean burn gas engine [17]
The present study has been performed on an optical single cylinder engine. These are described in the next section followed by discussion of the results and conclusions.
EXPERIMENTAL SET-UP
Test engine
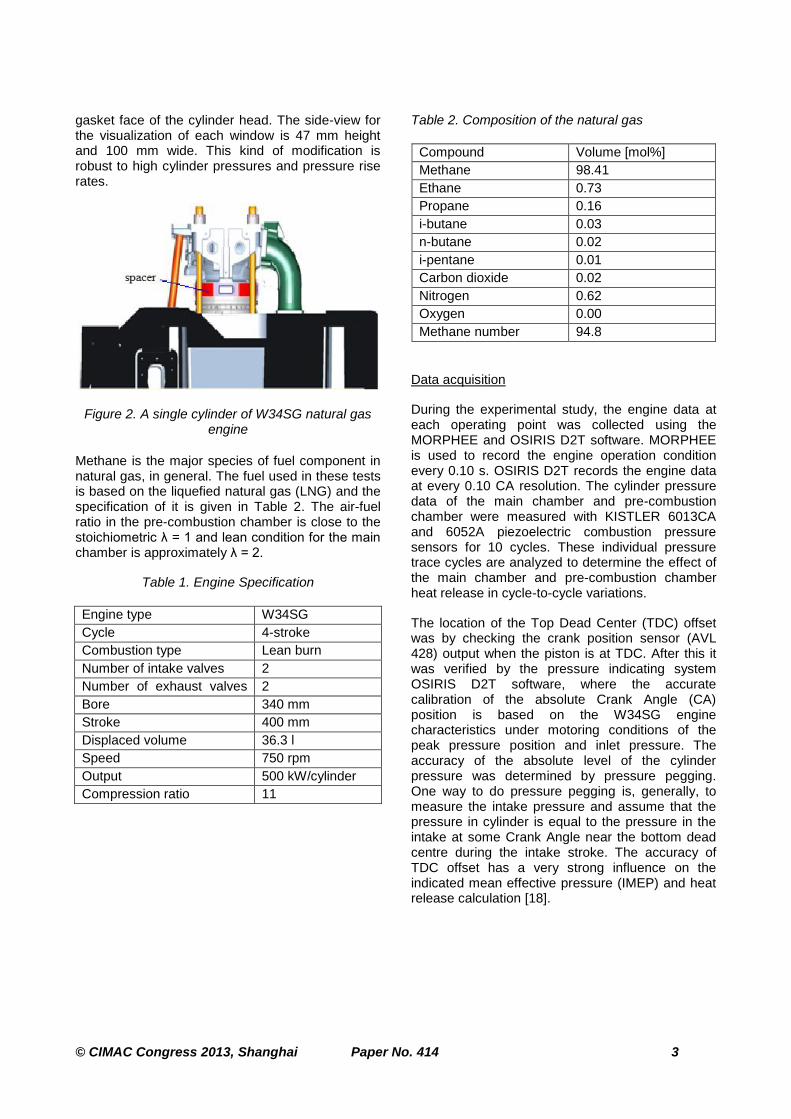
The engine used for this work is an optical single cylinder four-stroke lean burn Wärtsilä W34SG natural gas engine. The W34SG has a 400 mm stroke, a 340 mm bore and operates at 750 rpm. The engine is optimized to deliver 500 kW/ cylinder [1]. It also has two intake valves and two exhaust valves, and a pre-combustion chamber (PCC) is attached in the centre of the main chamber, see Fig. 1 and the engine specification in Table 1.
Figure 2 shows the optical engine configuration, which allows access to the combustion chamber. A spacer (red colour) containing four quartz windows were installed between the engine liner and the
gasket face of the cylinder head. The side-view for the visualization of each window is 47 mm height and 100 mm wide. This kind of modification is robust to high cylinder pressures and pressure rise rates.
Figure 2. A single cylinder of W34SG natural gas engine
Methane is the major species of fuel component in natural gas, in general. The fuel used in these tests is based on the liquefied natural gas (LNG) and the specification of it is given in Table 2. The air-fuel ratio in the pre-combustion chamber is close to the stoichiometric λ = 1 and lean condition for the main chamber is approximately λ = 2.
Table 1. Engine Specification
Engine type W34SG
Cycle 4-stroke
Combustion type Lean burn
Number of intake valves 2
Number of exhaust valves vvvvvalvalves
2
Bore 340 mm
Stroke 400 mm
Displaced volume 36.3 l
Speed 750 rpm
Output 500 kW/cylinder
Compression ratio 11
Table 2. Composition of the natural gas
Compound Volume [mol%]
Methane 98.41
Ethane 0.73
Propane 0.16
i-butane 0.03
n-butane 0.02
i-pentane 0.01
Carbon dioxide 0.02
Nitrogen 0.62
Oxygen 0.00
Methane number 94.8
Data acquisition
During the experimental study, the engine data at each operating point was collected using the MORPHEE and OSIRIS D2T software. MORPHEE is used to record the engine operation condition every 0.10 s. OSIRIS D2T records the engine data at every 0.10 CA resolution. The cylinder pressure data of the main chamber and pre-combustion chamber were measured with KISTLER 6013CA and 6052A piezoelectric combustion pressure sensors for 10 cycles. These individual pressure trace cycles are analyzed to determine the effect of the main chamber and pre-combustion chamber heat release in cycle-to-cycle variations.
The location of the Top Dead Center (TDC) offset was by checking the crank position sensor (AVL 428) output when the piston is at TDC. After this it was verified by the pressure indicating system OSIRIS D2T software, where the accurate calibration of the absolute Crank Angle (CA) position is based on the W34SG engine characteristics under motoring conditions of the peak pressure position and inlet pressure. The accuracy of the absolute level of the cylinder pressure was determined by pressure pegging. One way to do pressure pegging is, generally, to measure the intake pressure and assume that the pressure in cylinder is equal to the pressure in the intake at some Crank Angle near the bottom dead centre during the intake stroke. The accuracy of TDC offset has a very strong influence on the indicated mean effective pressure (IMEP) and heat release calculation [18].
The optical engine was operated in skip-fired mode to avoid contamination of the windows and breaking them due to thermal stress [19]. The skip firing consisted of unlimited amount of non-firing cycles in combination with 100 consecutive firing cycles to stabilize combustion. The last 10 cycles of these 100 firing cycles were used for visualization and analysis. The reason for this was that the engine was not stable until then.
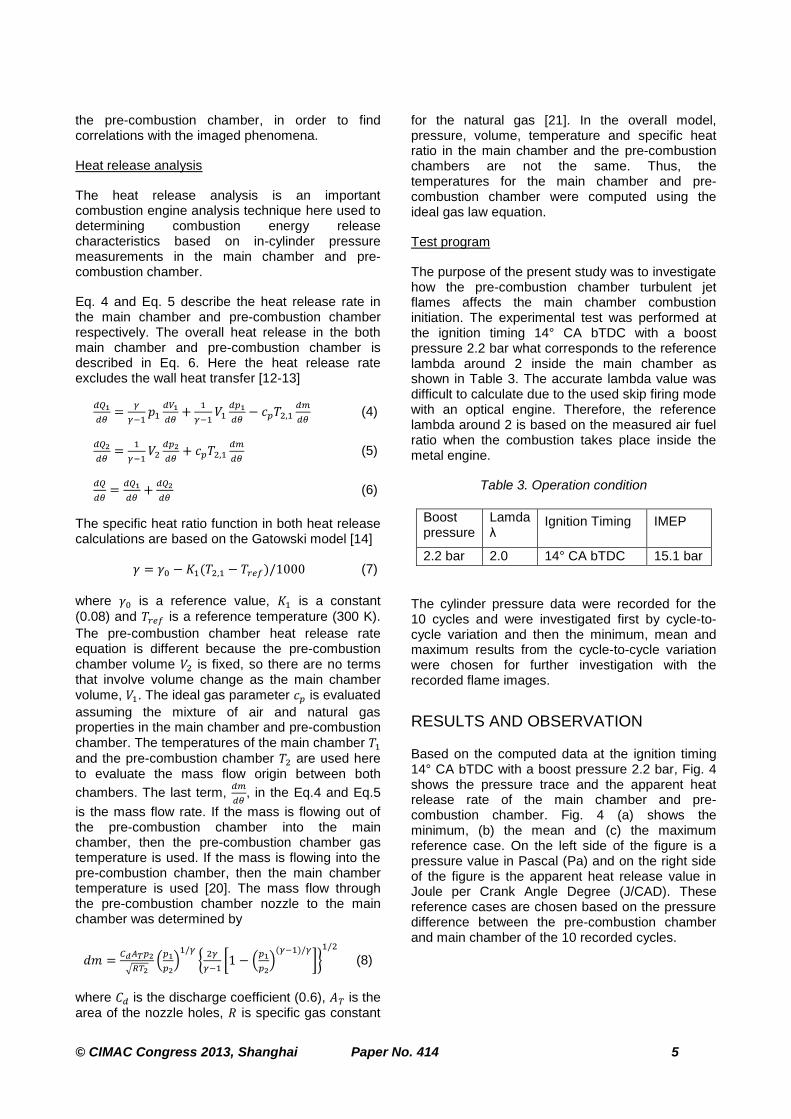
The flame propagation within single cycles were imaged through the spacer window on to a high speed video camera (Photron fastcam SA5), operated at 20 kHz, using a Nikkor 105 mm UV objective. The camera resolution was set to 960x392 pixels and exposure times varied between 11.4-49.8 μs depending on the signal strength.
Figure 3. The high speed camera set-up
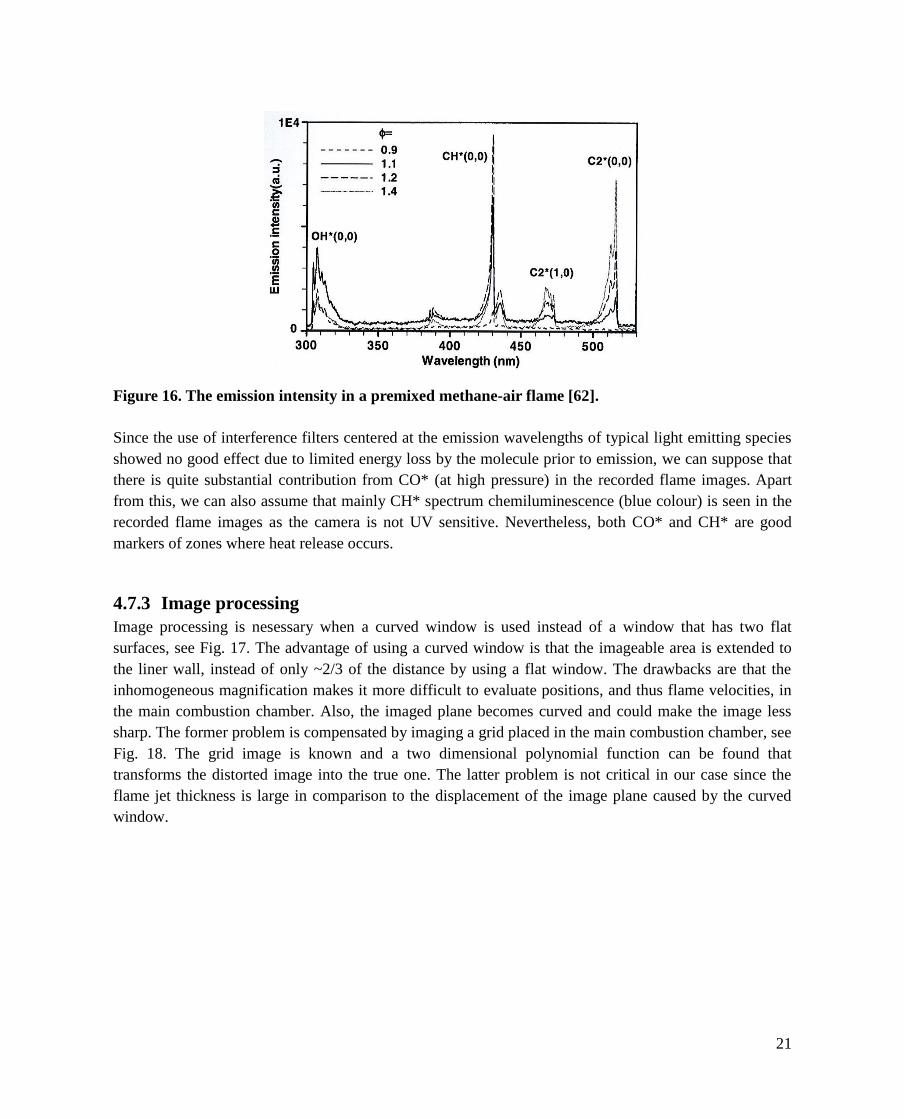
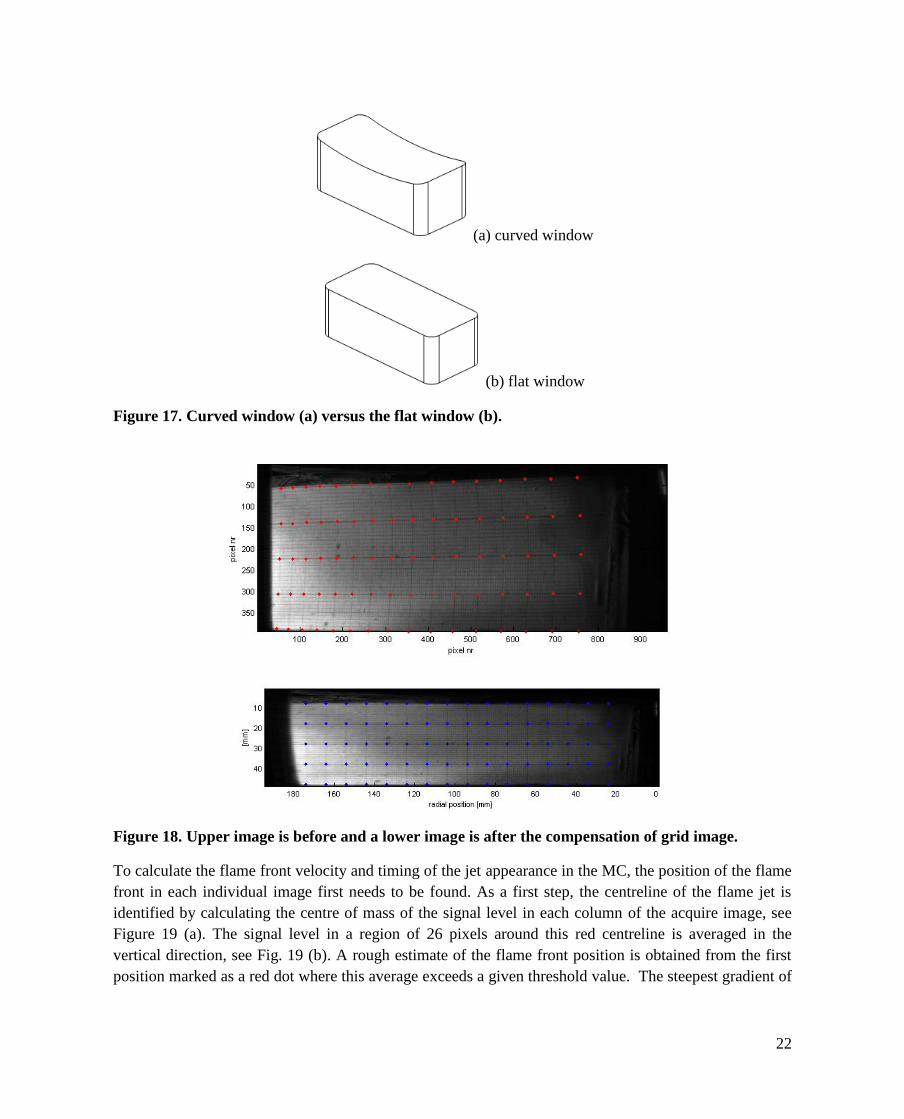
Figure 3 shows that the camera is oriented to image a volume in the main combustion chamber with boundaries set by the window height, the distance from the pre-combustion chamber to the cylinder liner wall and the field of depth. The curved window acts as a negative cylindrical lens, and creates a nonhomogeneous demagnification of the image in the horizontal direction. The advantage of using such a window is that the imitable area is extended to the liner wall, instead of only ~2/3 of the distance, as would be the case with a window that has two flat surfaces. The drawbacks are that the inhomogeneous magnification makes it more difficult to evaluate positions, and thus flame velocities, in the main combustion chamber. Also, the imaged plane becomes curved and could make the image less sharp. The former problem is solved by imaging a grid placed in the main combustion chamber. The grid image is known and a two dimensional polynomial function can be found that transformed to sign in the distorted recording into their true origins. The latter problem is not critical in our case since the flame jet thickness is large in comparison to the displacement of the image plane caused by the curved window.
A 40 mm thick quarts window was placed between the engine and camera to protect it in case of window blow out. Except for that, no additional filters were used. From the recorded chemiluminescence images, the velocity of the flame jet and the timing of when it appears in the main chamber can be estimated.
To calculate the flame front velocity and timing of the jet appearance in the main chamber the position of the flame front in each individual image first needs to be found. As a first step, the centreline of the flame jet is identified by calculating the centre of mass of the signal level in each column. The signal level in a region of 26 pixels around this centreline is averaged in the vertical direction. A rough estimate of the flame front position is obtained from the first position where this average exceeds a given threshold value. However, a more robust estimate that is less dependent on the absolute signal level is obtained from the local maximum of its derivative adjacent to where the threshold value is exceeded (to reduce the sensitivity to noise for the calculation of the derivative, the signal is first filtered using a Butterworth filter of order two and cut of frequency 0.5 mm
-1).
The images are recorded with a time separation of 50 µs. The velocity of the flame front as it appears in the main chamber could be calculated from this time separation and the distance between the evaluated positions in the two images where the jet first can be seen. The time when it first appears could be estimated to the time when the first image containing a flame jet was recorded. However, these estimations would be noisy in the first case and coarse in the second. To obtain more precise and accurate estimates Eq. 1 is fitted to the evaluated data and the initial velocity and time of jet appearance is calculated from Eq. 2 and Eq. 3 respectively.
(1)
(2)
(3)
Here and are fitting coefficients. During these recorded images, a modified pre-combustion chamber was used with asymmetric nozzle holes configuration where one jet was separated to give a free view of sign for combustion visualization. The flame was studied during whole combustion duration in order to understand how the flame propagates from the pre-combustion chamber nozzle to cylinder wall. Additionally, the heat release analysis was carried out with emphasis on
the pre-combustion chamber, in order to find correlations with the imaged phenomena.
Heat release analysis
The heat release analysis is an important combustion engine analysis technique here used to determining combustion energy release characteristics based on in-cylinder pressure measurements in the main chamber and pre-combustion chamber.
Eq. 4 and Eq. 5 describe the heat release rate in the main chamber and pre-combustion chamber respectively. The overall heat release in the both main chamber and pre-combustion chamber is described in Eq. 6. Here the heat release rate excludes the wall heat transfer [12-13]
(4)
(5)
(6)
The specific heat ratio function in both heat release calculations are based on the Gatowski model [14]
(7)
where is a reference value, is a constant
(0.08) and is a reference temperature (300 K).
The pre-combustion chamber heat release rate equation is different because the pre-combustion chamber volume is fixed, so there are no terms that involve volume change as the main chamber volume, . The ideal gas parameter is evaluated
assuming the mixture of air and natural gas properties in the main chamber and pre-combustion chamber. The temperatures of the main chamber
and the pre-combustion chamber are used here to evaluate the mass flow origin between both
chambers. The last term,
, in the Eq.4 and Eq.5
is the mass flow rate. If the mass is flowing out of the pre-combustion chamber into the main chamber, then the pre-combustion chamber gas temperature is used. If the mass is flowing into the pre-combustion chamber, then the main chamber temperature is used [20]. The mass flow through the pre-combustion chamber nozzle to the main chamber was determined by
(8)
where is the discharge coefficient (0.6), is the area of the nozzle holes, is specific gas constant
for the natural gas [21]. In the overall model, pressure, volume, temperature and specific heat ratio in the main chamber and the pre-combustion chambers are not the same. Thus, the temperatures for the main chamber and pre-combustion chamber were computed using the ideal gas law equation.
Test program
The purpose of the present study was to investigate how the pre-combustion chamber turbulent jet flames affects the main chamber combustion initiation. The experimental test was performed at the ignition timing 14° CA bTDC with a boost pressure 2.2 bar what corresponds to the reference lambda around 2 inside the main chamber as shown in Table 3. The accurate lambda value was difficult to calculate due to the used skip firing mode with an optical engine. Therefore, the reference lambda around 2 is based on the measured air fuel ratio when the combustion takes place inside the metal engine.
Table 3. Operation condition
Boost pressure
Lamda λ
Ignition Timing IMEP
2.2 bar 2.0 14° CA bTDC 15.1 bar
The cylinder pressure data were recorded for the 10 cycles and were investigated first by cycle-to-cycle variation and then the minimum, mean and maximum results from the cycle-to-cycle variation were chosen for further investigation with the recorded flame images.
RESULTS AND OBSERVATION
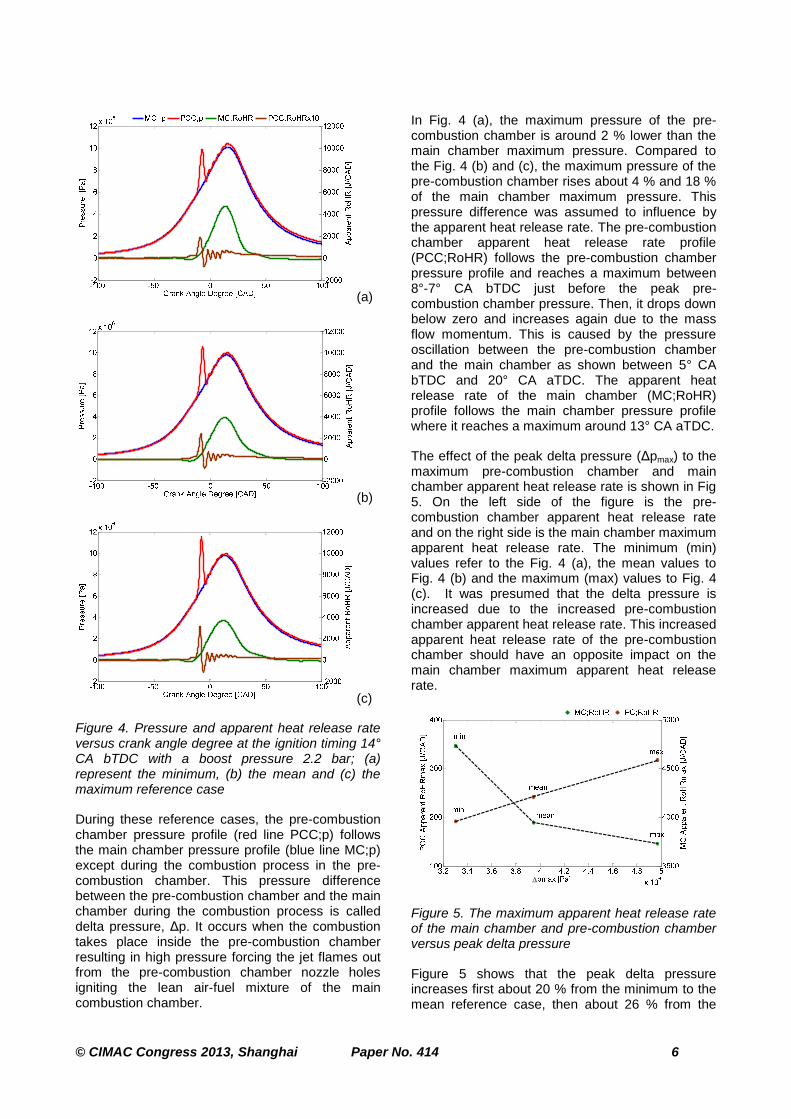
Based on the computed data at the ignition timing 14° CA bTDC with a boost pressure 2.2 bar, Fig. 4 shows the pressure trace and the apparent heat release rate of the main chamber and pre-combustion chamber. Fig. 4 (a) shows the minimum, (b) the mean and (c) the maximum reference case. On the left side of the figure is a pressure value in Pascal (Pa) and on the right side of the figure is the apparent heat release value in Joule per Crank Angle Degree (J/CAD). These reference cases are chosen based on the pressure difference between the pre-combustion chamber and main chamber of the 10 recorded cycles.
Figure 4. Pressure and apparent heat release rate versus crank angle degree at the ignition timing 14° CA bTDC with a boost pressure 2.2 bar; (a) represent the minimum, (b) the mean and (c) the maximum reference case
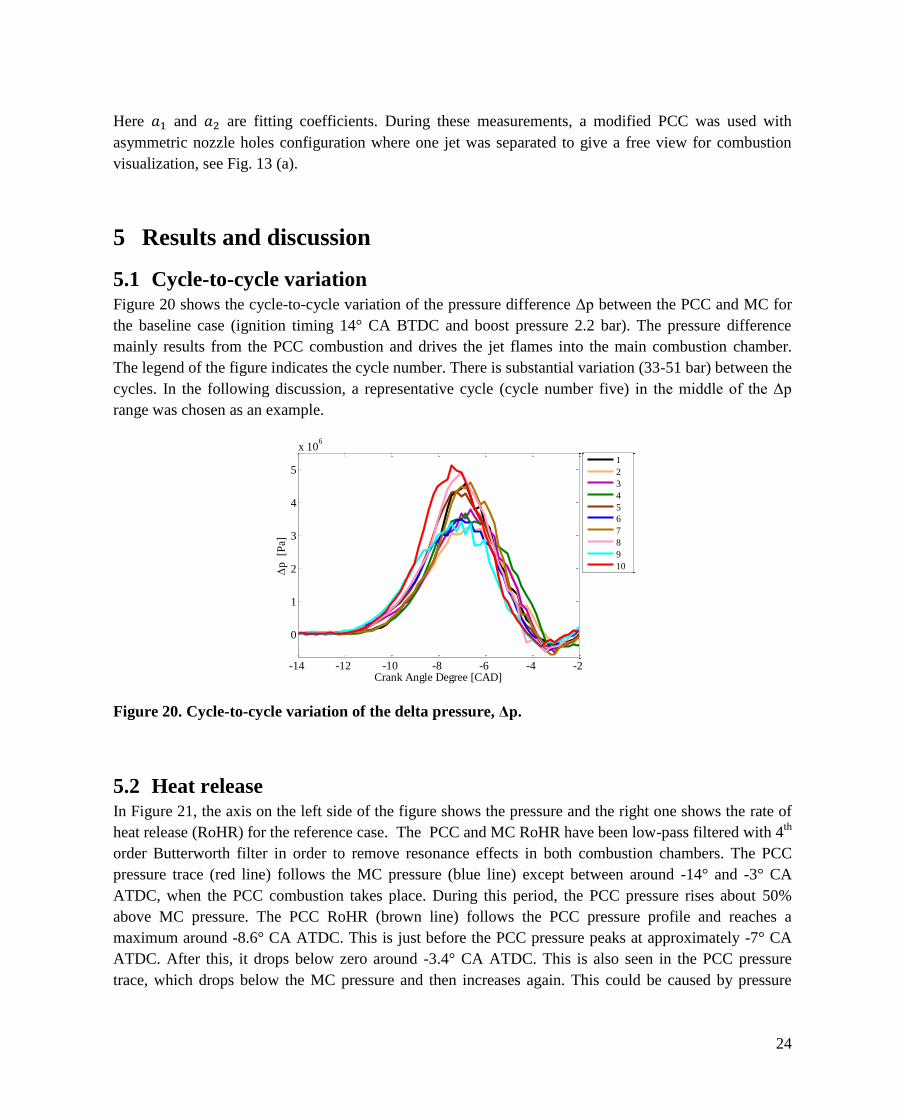
During these reference cases, the pre-combustion chamber pressure profile (red line PCC;p) follows the main chamber pressure profile (blue line MC;p) except during the combustion process in the pre-combustion chamber. This pressure difference between the pre-combustion chamber and the main chamber during the combustion process is called delta pressure, Δp. It occurs when the combustion takes place inside the pre-combustion chamber resulting in high pressure forcing the jet flames out from the pre-combustion chamber nozzle holes igniting the lean air-fuel mixture of the main combustion chamber.
In Fig. 4 (a), the maximum pressure of the pre-combustion chamber is around 2 % lower than the main chamber maximum pressure. Compared to the Fig. 4 (b) and (c), the maximum pressure of the pre-combustion chamber rises about 4 % and 18 % of the main chamber maximum pressure. This pressure difference was assumed to influence by the apparent heat release rate. The pre-combustion chamber apparent heat release rate profile (PCC;RoHR) follows the pre-combustion chamber pressure profile and reaches a maximum between 8°-7° CA bTDC just before the peak pre-combustion chamber pressure. Then, it drops down below zero and increases again due to the mass flow momentum. This is caused by the pressure oscillation between the pre-combustion chamber and the main chamber as shown between 5° CA bTDC and 20° CA aTDC. The apparent heat release rate of the main chamber (MC;RoHR) profile follows the main chamber pressure profile where it reaches a maximum around 13° CA aTDC.
The effect of the peak delta pressure (Δpmax) to the maximum pre-combustion chamber and main chamber apparent heat release rate is shown in Fig 5. On the left side of the figure is the pre-combustion chamber apparent heat release rate and on the right side is the main chamber maximum apparent heat release rate. The minimum (min) values refer to the Fig. 4 (a), the mean values to Fig. 4 (b) and the maximum (max) values to Fig. 4 (c). It was presumed that the delta pressure is increased due to the increased pre-combustion chamber apparent heat release rate. This increased apparent heat release rate of the pre-combustion chamber should have an opposite impact on the main chamber maximum apparent heat release rate.
Figure 5. The maximum apparent heat release rate of the main chamber and pre-combustion chamber versus peak delta pressure
Figure 5 shows that the peak delta pressure increases first about 20 % from the minimum to the mean reference case, then about 26 % from the
mean to the maximum reference case. The increased peak delta pressure is due to the increased maximum pre-combustion chamber apparent heat release rate. The heat release rate of the pre-combustion chamber rises approximately 26 % from minimum to the mean reference case and then around 31 % from the mean to the maximum reference case.
Compared to the main chamber maximum apparent heat release rate, it has an opposite effect. The increased pre-combustion chamber maximum apparent heat release rate decreases the main chamber maximum apparent heat release rate about 20 % from the minimum to the mean reference case and then around 6 % from the mean to the maximum reference case. The decreased main chamber maximum apparent heat release rate is due to the faster combustion profile taking place inside the pre-combustion chamber getting closer to TDC as shown from the computed results in Fig. 6. The combustion duration of the pre-combustion chamber of these three reference cases is around 10 % - 15 % of the main chamber combustion duration. Based on the computed result, it can be assumed that the pre-chamber combustion at the maximum reference point is slightly richer than the minimum reference point. Since the skip firing mode was used, it was impossible to calculate the accurate pre-combustion chamber lambda. But then, the pre-combustion chamber lambda was approximately 1 during the reference test run with the metal engine without the skip firing mode.
Figure 6. The combustion duration of the pre-combustion chamber and main chamber versus peak delta pressure
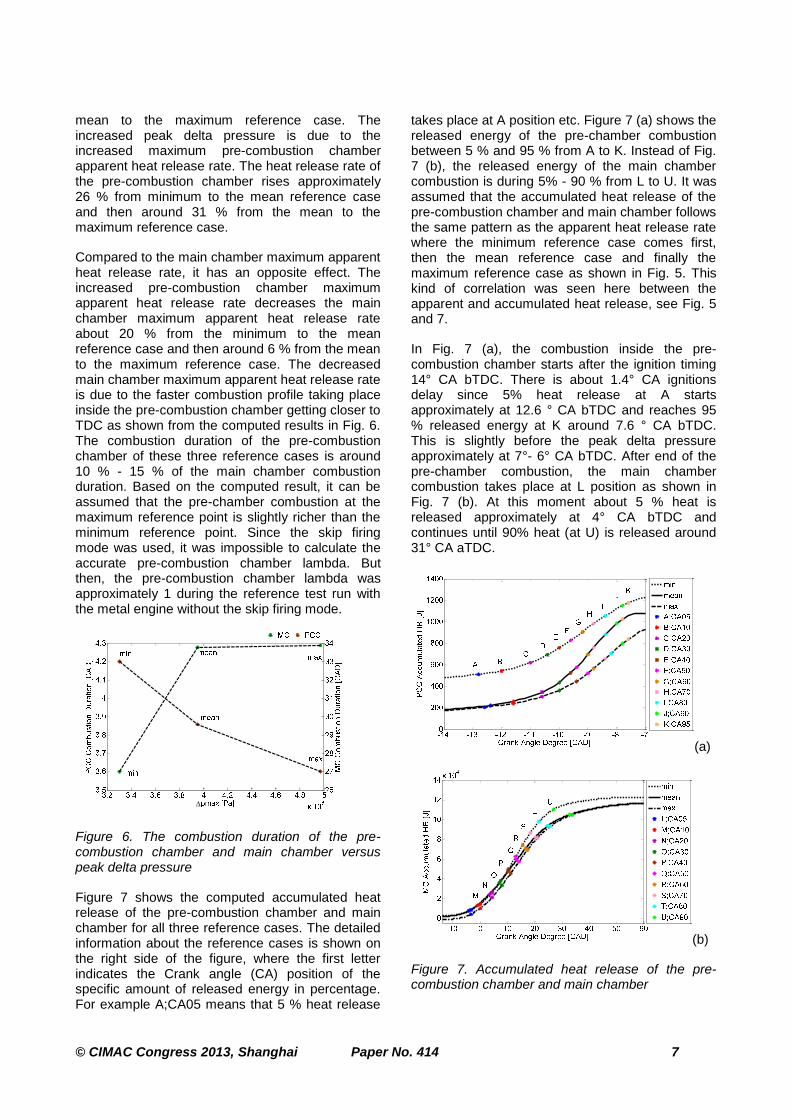
Figure 7 shows the computed accumulated heat release of the pre-combustion chamber and main chamber for all three reference cases. The detailed information about the reference cases is shown on the right side of the figure, where the first letter indicates the Crank angle (CA) position of the specific amount of released energy in percentage. For example A;CA05 means that 5 % heat release
takes place at A position etc. Figure 7 (a) shows the released energy of the pre-chamber combustion between 5 % and 95 % from A to K. Instead of Fig. 7 (b), the released energy of the main chamber combustion is during 5% - 90 % from L to U. It was assumed that the accumulated heat release of the pre-combustion chamber and main chamber follows the same pattern as the apparent heat release rate where the minimum reference case comes first, then the mean reference case and finally the maximum reference case as shown in Fig. 5. This kind of correlation was seen here between the apparent and accumulated heat release, see Fig. 5 and 7.
In Fig. 7 (a), the combustion inside the pre-combustion chamber starts after the ignition timing 14° CA bTDC. There is about 1.4° CA ignitions delay since 5% heat release at A starts approximately at 12.6 ° CA bTDC and reaches 95 % released energy at K around 7.6 ° CA bTDC. This is slightly before the peak delta pressure approximately at 7°- 6° CA bTDC. After end of the pre-chamber combustion, the main chamber combustion takes place at L position as shown in Fig. 7 (b). At this moment about 5 % heat is released approximately at 4° CA bTDC and continues until 90% heat (at U) is released around 31° CA aTDC.
(a)
(b)
Figure 7. Accumulated heat release of the pre-combustion chamber and main chamber
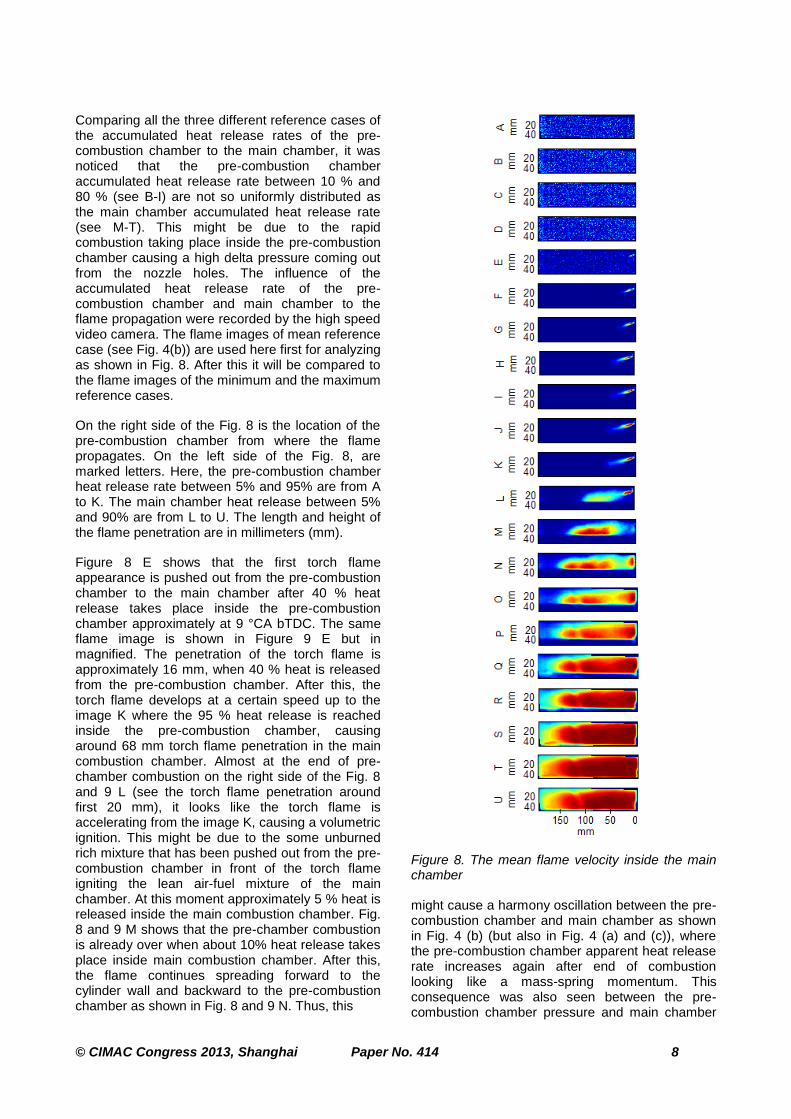
Comparing all the three different reference cases of the accumulated heat release rates of the pre-combustion chamber to the main chamber, it was noticed that the pre-combustion chamber accumulated heat release rate between 10 % and 80 % (see B-I) are not so uniformly distributed as the main chamber accumulated heat release rate (see M-T). This might be due to the rapid combustion taking place inside the pre-combustion chamber causing a high delta pressure coming out from the nozzle holes. The influence of the accumulated heat release rate of the pre-combustion chamber and main chamber to the flame propagation were recorded by the high speed video camera. The flame images of mean reference case (see Fig. 4(b)) are used here first for analyzing as shown in Fig. 8. After this it will be compared to the flame images of the minimum and the maximum reference cases.
On the right side of the Fig. 8 is the location of the pre-combustion chamber from where the flame propagates. On the left side of the Fig. 8, are marked letters. Here, the pre-combustion chamber heat release rate between 5% and 95% are from A to K. The main chamber heat release between 5% and 90% are from L to U. The length and height of the flame penetration are in millimeters (mm).
Figure 8 E shows that the first torch flame appearance is pushed out from the pre-combustion chamber to the main chamber after 40 % heat release takes place inside the pre-combustion chamber approximately at 9 °CA bTDC. The same flame image is shown in Figure 9 E but in magnified. The penetration of the torch flame is approximately 16 mm, when 40 % heat is released from the pre-combustion chamber. After this, the torch flame develops at a certain speed up to the image K where the 95 % heat release is reached inside the pre-combustion chamber, causing around 68 mm torch flame penetration in the main combustion chamber. Almost at the end of pre-chamber combustion on the right side of the Fig. 8 and 9 L (see the torch flame penetration around first 20 mm), it looks like the torch flame is accelerating from the image K, causing a volumetric ignition. This might be due to the some unburned rich mixture that has been pushed out from the pre-combustion chamber in front of the torch flame igniting the lean air-fuel mixture of the main chamber. At this moment approximately 5 % heat is released inside the main combustion chamber. Fig. 8 and 9 M shows that the pre-chamber combustion is already over when about 10% heat release takes place inside main combustion chamber. After this, the flame continues spreading forward to the cylinder wall and backward to the pre-combustion chamber as shown in Fig. 8 and 9 N. Thus, this
Figure 8. The mean flame velocity inside the main chamber
might cause a harmony oscillation between the pre-combustion chamber and main chamber as shown in Fig. 4 (b) (but also in Fig. 4 (a) and (c)), where the pre-combustion chamber apparent heat release rate increases again after end of combustion looking like a mass-spring momentum. This consequence was also seen between the pre-combustion chamber pressure and main chamber
pressures. The flame propagation reaches close to the end of the cylinder wall around 19° CA aTDC as shown in Fig. 8 S, when approximately 70 % heat is realized from the main chamber combustion with the flame penetration around 194 mm. Almost end of the main chamber combustion as shown in Fig. 7 (b) and Fig. 8 U, about 90% heat is released approximately at 31° CA aTDC. Based on the flame images, it could say that everything from image L on is flame propagation. It was also observed that the flame reaction zone develops in different way as compared to the flame images E-K. The fact that the reaction zone develops at a different rate after image L could be explained by a transition from jet penetration to flame propagation into the surrounding charge at this point.
Figure 9. Magnified mean flame velocity images from E to N
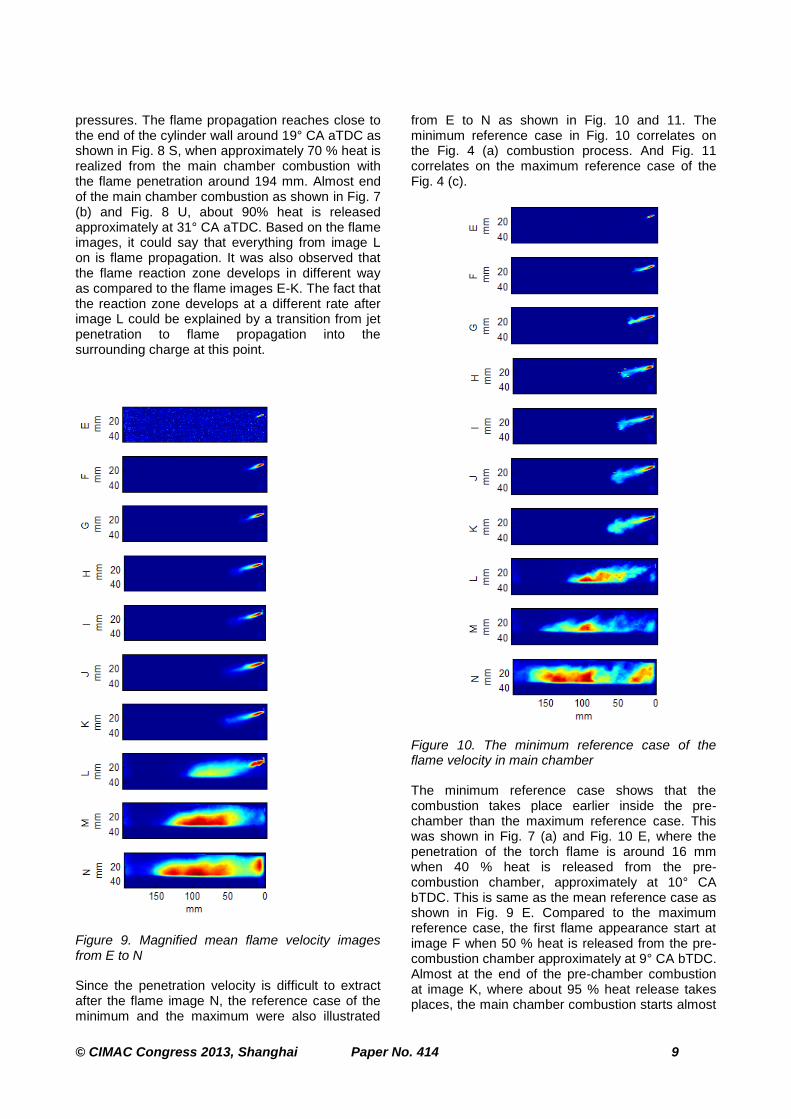
Since the penetration velocity is difficult to extract after the flame image N, the reference case of the minimum and the maximum were also illustrated
from E to N as shown in Fig. 10 and 11. The minimum reference case in Fig. 10 correlates on the Fig. 4 (a) combustion process. And Fig. 11 correlates on the maximum reference case of the Fig. 4 (c).
Figure 10. The minimum reference case of the flame velocity in main chamber
The minimum reference case shows that the combustion takes place earlier inside the pre- chamber than the maximum reference case. This was shown in Fig. 7 (a) and Fig. 10 E, where the penetration of the torch flame is around 16 mm when 40 % heat is released from the pre-combustion chamber, approximately at 10° CA bTDC. This is same as the mean reference case as shown in Fig. 9 E. Compared to the maximum reference case, the first flame appearance start at image F when 50 % heat is released from the pre-combustion chamber approximately at 9° CA bTDC. Almost at the end of the pre-chamber combustion at image K, where about 95 % heat release takes places, the main chamber combustion starts almost
the same way as the mean reference case as shown in Fig. 9 K.
The cycle-to-cycle variation of the minimum and maximum reference cases shows that from H to K where around 70 % - 95 % heats is released from the pre-combustion chamber, the turbulence and its stochastic features caused by the jet flame can be seen. Here the largest vortices, almost at the end of the flame, can be partly seen changing. The jet penetration itself and its mixing with the quiescent lean air/fuel mixture are stochastic causing cycle-to-cycle variations on the lean burn combustion. Compared to the mean flame images from H to K in Fig. 9, it was noticed that this kind of turbulence level was not seen so clear here.
Figure 11. The maximum reference case of the flame velocity in main chamber
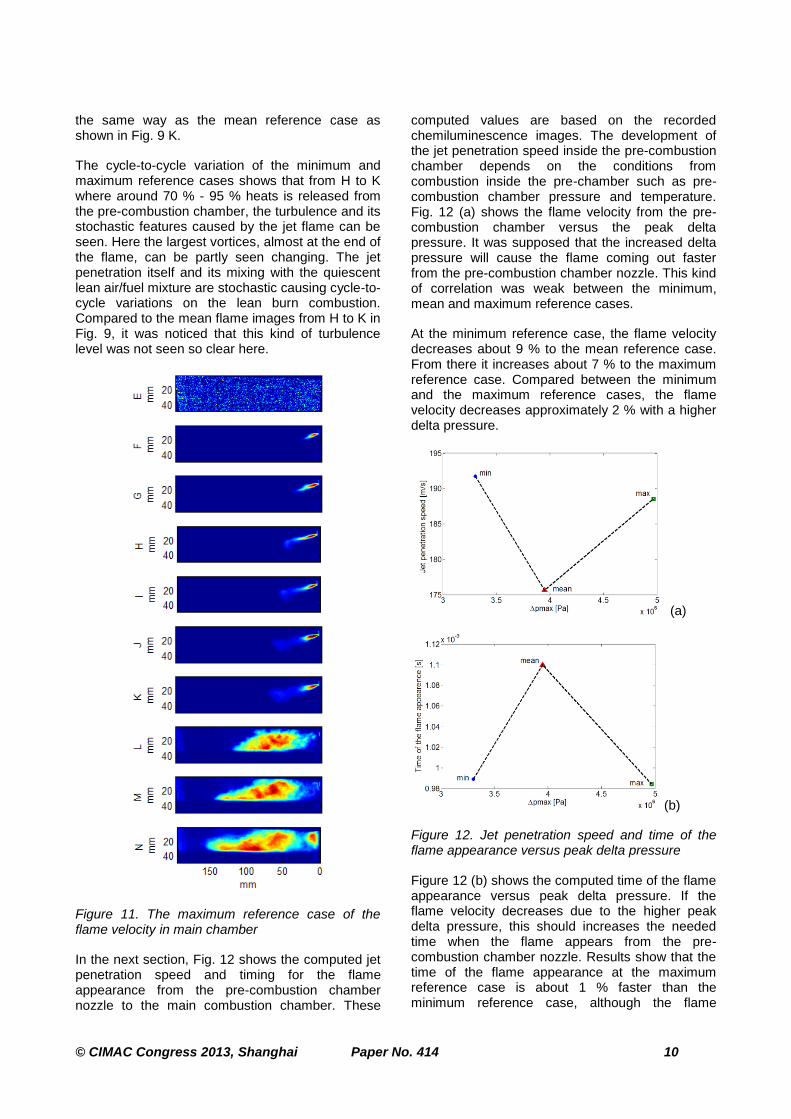
In the next section, Fig. 12 shows the computed jet penetration speed and timing for the flame appearance from the pre-combustion chamber nozzle to the main combustion chamber. These
computed values are based on the recorded chemiluminescence images. The development of the jet penetration speed inside the pre-combustion chamber depends on the conditions from combustion inside the pre-chamber such as pre-combustion chamber pressure and temperature. Fig. 12 (a) shows the flame velocity from the pre-combustion chamber versus the peak delta pressure. It was supposed that the increased delta pressure will cause the flame coming out faster from the pre-combustion chamber nozzle. This kind of correlation was weak between the minimum, mean and maximum reference cases.
At the minimum reference case, the flame velocity decreases about 9 % to the mean reference case. From there it increases about 7 % to the maximum reference case. Compared between the minimum and the maximum reference cases, the flame velocity decreases approximately 2 % with a higher delta pressure.
(a)
(b)
Figure 12. Jet penetration speed and time of the flame appearance versus peak delta pressure
Figure 12 (b) shows the computed time of the flame appearance versus peak delta pressure. If the flame velocity decreases due to the higher peak delta pressure, this should increases the needed time when the flame appears from the pre-combustion chamber nozzle. Results show that the time of the flame appearance at the maximum reference case is about 1 % faster than the minimum reference case, although the flame
velocity of the minimum reference case is about 2 % faster than the maximum reference case. Compared to mean reference case, the time of the flame appearance is about 11 % slower than the minimum and the maximum reference case. Base on these computed results, there is no correlations between the flame velocity and the time of the flame appearance except at the mean reference case. The reason for this might be due to the big variations in the cycle-to-cycle combustion inside the pre-combustion chamber as seen from the turbulence flame velocities between Fig. 9 and 11.
The further investigation about the impact of the engine parameters to the pre-chamber and main chamber combustion is covered in another paper. This fist part of the paper deals with the flame images from the pre-combustion chamber to the main chamber combustion.
CONCLUSION
An experimental study was made to investigate the in-cylinder combustion in a spark ignited four-stroke large bore gas engine of W34SG. The flame propagation in an optical single cylinder was recorded by the high speed video camera from the pre-combustion chamber to the cylinder wall. The results showed the combustion behavior from cycle-to-cycle variation between the minimum, mean and maximum reference case.
Base on the apparent heat release modeling from the pressure trace data, the following observation and conclusion are made with the computed flame images
The increased pressure difference between the pre-combustion chamber and main chamber is due to the increased pre-combustion chamber apparent heat release rate. This will have an opposite impact on the main chamber apparent heat release rate
The main chamber combustion takes places after 95 % heat is realized from the pre-combustion chamber
The flame propagation for the cycle-to-cycle variation is caused by the turbulence flow inside the main chamber
There is a weak correlation between the flame velocity and the time of the flame appearance. This is due to the cycle-to cycle variation inside the pre-combustion chamber
NOMENCLATURE
area of the nozzle holes
bTDC before top dead centre
CA crank angle
discharge coefficient
Hz hertz
IMEP indicated mean effective pressure
kW kilowatt
L liter
LNG liquefied natural gas
mm millimetre
PCC pre-combustion chamber
main chamber pressure
pre-combustion chamber pressure
specific gas constant
rpm revolutions per minute
TDC top dead centre
PCC temperature
reference temperature
main chamber volume
pre-combustion chamber volume
λ air excess ratio
reference value
ACKNOWLEDGEMENTS
This research work was carried out at Waskiluoto Validation Center of Wärtsilä Finland Oy. It was partially financed by Nordforsk. The authors wish to thank Staffan Nysand, Alberto Cafari, Jussi Seppä, Christian Haka, Jussi Autio, Herman Selvaraj, and Lendormy Eric for all their support during this study