26
CommBank Legal Market Pulse Conducted by Beaton Research + Consulting Quarter 3 FY15

CommBank Legal Market PulseConducted by Beaton Research + Consulting
Quarter 3 FY15

1
COMMBANK LEGAL MARKET PULSE – QUARTER 3 2014/15
Contents
Foreword 2
Economic outlook 3
Snapshot of report findings 4
Firm StructureOffice locations 7
Primary practice areas 7
Business conditionsPerceived performance of the Australian economy 8
Perception of business conditions - present to 2017 8
Perception of business conditions - by area 9
FY15 financial performanceTotal revenue change FY14 to FY15 10
FY15 budgeted and actual revenue results 10
FY15 budgeted and actual expenses results 11
Revenue predictionsChange in revenue over the next 6 months - by location 12
Change in revenue over the next 6 months - by practice area 13
Realised rates and fee structureExpected changes in realised rates - next 6 and 12 months 15
Expense and profitability predictionsChange in expenses over the next 6 months 16
Change in staffing over the next 6 months 17
Change in operating margins over the next 6 months 18
Managing people, staff and talentCore staff turnover between 1 July & 31 December 2014 19
Expected change in core staff turnover in FY15 19
Expected change in core staff remuneration in FY15 20
Contract staff headcount 20
Change in casual/contract staff headcount 21
Sourcing and outsourcingUse of LPOs - next 12 months 22
Client driven LPO usage 22
LPO impact on operating margin - next 12 months 23
Outsourcing back office functions - last 12 months 23
Outsource office functions to lower cost locations - last 12 months 24

2
COMMBANK LEGAL MARKET PULSE – QUARTER 3 2014/15
Marc Totaro National Manager, Professional Services Commonwealth Bank
Welcome to the third quarter edition of the CommBank Legal Market Pulse for the 2015 financial year.
It’s good to see confidence is rising among Australia’s top-tier law firms, with the vast majority expecting business conditions to improve over the next two years.Our latest report shows long-term optimism returning to the industry, fuelled by expectations of revenue growth, low interest rates and an improved economy. Every top-tier firm surveyed forecast higher revenues over the next six months in Europe, Asia and Sydney, with most also anticipating growth in Brisbane and Canberra.
But while sentiment has improved markedly among the top-tier, mid-tier firms are less positive. With comparatively little exposure to global economic growth and large transactions, these firms are less optimistic about revenue growth and are generally more subdued about conditions over the next 12 months, although most still expect an improvement by 2017.
Asked which practice areas were likely to outperform, firms nominated employment, insurance and property law as the most likely sources of increased revenues. However, government work looks set to decline as reduced state and federal spending take their toll, while revenue across construction, IT, telecommunications and media are also forecast to fall.
Investments in marketing and business development are expected to rise, as firms aggressively pursue revenue growth. Yet many are also looking to rein in non-essential expenses before the end of financial year, with spending on IT and staff training set to tighten.
The intensely competitive market is also reflected in the lateral hiring of partners and lawyers, which has continued apace over the last quarter. Firms continue to poach lawyers and partners from their rivals, while a growing number of junior staff has switched employers in search of greener pastures.
Both top and mid-tier firms are planning to decrease secretarial and shared service staff, with almost a quarter of all firms having outsourced office functions to lower cost locations. A key driver behind this trend is that half of all firms believe there is growing pressure from clients to use legal process outsourcing.
I hope you find this issue useful and informative. We look forward to continuing to monitor the legal industry’s sentiment and performance, and sharing these insights with you.
Email: [email protected] Tel: +61 2 9303 1940
Confidence set to rise over long-term, driven by optimism among top-tier firms
3
COMMBANK LEGAL MARKET PULSE – QUARTER 3 2014/15
Diana Mousina Associate Director Economics Commonwealth Bank
The latest growth figures have confirmed the Australian economy has expanded by a below-trend 2.7 percent over 2014. The story is really a tale of two halves, with annualised growth in the first half of 2014 tracking at 3.4 percent while growth in the second half was 1.7 percent. Below-trend growth is evidenced through soft readings across the business surveys. The latest CommBank Legal Market Pulse indicates a negative short-term outlook of business conditions across the legal industry. Perceptions of business conditions have increased marginally from last quarter but still remain weak.
The long-term outlook continues to remain positive. And top-tier firms are continuously more optimistic about future business conditions compared to mid-tier firms. Income growth in the economy is running at exceptionally weak levels. The significant decline in commodity prices over 2014 is the main reason behind this weakness. A lack of income has pushed consumers to defer spending and increase savings, businesses to defer or cancel capital spending and labour hiring and governments to tighten the fiscal screws. This income weakness is reflected in consumer and business surveys.
New sources of income are needed as the economy transitions from mining to non-mining led growth. Parts of this growth transition are on track. Resource exports are surging and will be a significant new source of income growth over the next two years. The residential construction upturn is also firmly entrenched. The labour-intensive nature of this sector will be positive for jobs growth. Mining related job losses are currently being more than offset with jobs related to rising dwelling investment.
Legal leaders surveyed in the CommBank Legal Market Pulse have mixed forecasts for staff numbers. Expectations for total staff numbers are relatively unchanged from last quarter however across the headline number there are variations across the different groups. Partner numbers are expected to decline, along with paralegals, secretarial and administrative staff. Graduate numbers are still expected to grow.
One part of the growth transition faltering is non-mining business capex. Recent data shows commercial lending growth, one of the funding sources for non-mining capex, has dropped after solid growth over 2014. This part of the transition needs to be stronger over 2015 for reasonable growth outcomes to be met. Business confidence and conditions will need to improve to drive non-mining capex higher.
The RBA downgraded their growth and inflation forecasts in early 2015 and were a key reason for their decision to cut the cash rate to 2.25 percent in February. The RBA’s rate cut is at odds with the central bank’s rhetoric regarding strong dwelling price growth in parts of Australia (particularly Sydney and Melbourne). The RBA expects macroprudential tools announced by the Australian Prudential Regulator in late 2014 will cool dwelling price growth this year. The RBA’s desire to influence consumption and investment patterns means that one standalone rate cut is unlikely. In an environment of low inflation, a rising unemployment rate and an uncertain growth transition, we and the market see another rate cut in the second quarter of this year, most probably in May.
Australian economic outlook

COMMBANK LEGAL MARKET PULSE – QUARTER 3 2014/15
Summary of Q1 FY2015 findingsSnapshot of survey findings
Perception of business conditions Perceived performance of the Australian economy over next 12 months
Net % (positive-negative)
-35% -31%
All firms
-17%
Top-tier firms Mid-tier firms
Net % (positive-negative)
Budgeted vs actual results
Revenue -1.3%
Expenses -3.2%
Total firms
Revenue 1.6%
Expenses -4.7%
Top-tier firms
Revenue -1.9%
Expenses -2.9%
Mid-tier firms
Mean %
-26% -24%
10% 29% 55% 10%
Q2 FY15 Q3 FY15 Q2 FY15 Q3 FY15 Q2 FY15 Q3 FY15
At the moment In 12 months In 24 months
Revenue expectations by state Highest revenue growth expectations – by practice area
Top-tier firms
Employment, workplace and OH&S
Net % (positive-negative)
IT, telecoms and media
Taxation
Insurance
Construction, engineering and major infrastructure
Employment, workplace and OH&S
67%
67%
50%
60%
50%
47%
Mid-tier firms
4

COMMBANK LEGAL MARKET PULSE – QUARTER 3 2014/15
Expected changes in realised rates
-0.5% -1.5%
Next 6 months
Next 12 months
Top-tier firms +0.4% +1.0%
Next 6 months
Next 12 months
Mid-tier firms
Operating margins
Top-tier firms
Mid-tier firms
67%
13%
Net % increase
Changes in staff numbers
Turnover of core workforce
Junior lawyers
Fixed share / salary partners Equity partners Senior lawyers Secretarial / admin staff Shared service staff Paralegals
Top-tier firms
Junior lawyers Fixed share / salary partners Senior lawyers Paralegals
Secretarial / admin staff Shared service staff
Mid-tier firms
Equity partners
Secretarial / admin
staff
9.7%
Junior lawyers
9.7%
Shared service
staff
8.1%
Senior lawyers
7.7%
Paralegals
7.5%
Fixed share / salary
partners
3.9%
Equity partners
2.8%
Expected change in staff turnover
21 14
28
7
-7 3
Senior lawyers
Fixed share / salary
partnersParalegals Secretarial /
admin staff
10
Junior lawyers Equity
partnersShared
service staffMean %
Mean %
Snapshot of survey findings
5
COMMBANK LEGAL MARKET PULSE – QUARTER 3 2014/15
Expected changes in realised rates
-0.5% -1.5%
Next 6 months
Next 12 months
Top-tier firms +0.4% +1.0%
Next 6 months
Next 12 months
Mid-tier firms
Operating margins
Top-tier firms
Mid-tier firms
67%
13%
Net % increase
Changes in staff numbers
Turnover of core workforce
Junior lawyers
Fixed share / salary partners Equity partners Senior lawyers Secretarial / admin staff Shared service staff Paralegals
Top-tier firms
Junior lawyers Fixed share / salary partners Senior lawyers Paralegals
Secretarial / admin staff Shared service staff
Mid-tier firms
Equity partners
Secretarial / admin
staff
9.7%
Junior lawyers
9.7%
Shared service
staff
8.1%
Senior lawyers
7.7%
Paralegals
7.5%
Fixed share / salary
partners
3.9%
Equity partners
2.8%
Expected change in staff turnover
21 14
28
7
-7 3
Senior lawyers
Fixed share / salary
partnersParalegals Secretarial /
admin staff
10
Junior lawyers Equity
partnersShared
service staffMean %
Mean %
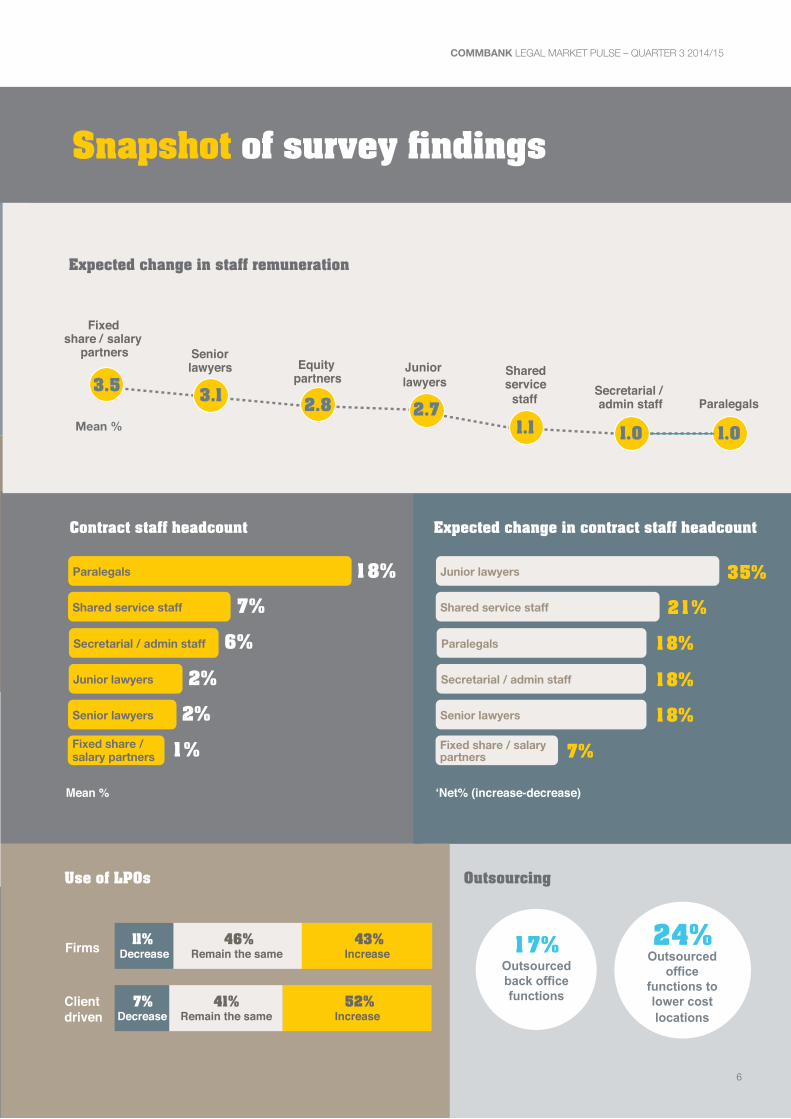
Contract staff headcount
Paralegals
Shared service staff
Secretarial / admin staff
Junior lawyers
Senior lawyers
Fixed share / salary partners
18%
7%
6%
2%
2%
1%
Expected change in contract staff headcount
Junior lawyers
Shared service staff
Paralegals
Secretarial / admin staff
Senior lawyers
Fixed share / salary partners
35%
21%
18%
18%
18%
7%
Mean % ‘Net% (increase-decrease)
Use of LPOs
46% Remain the same
43% Increase Firms
7% Decrease
41% Remain the same
52% Increase
Client driven
11% Decrease
Outsourcing
17% Outsourced back office functions
24% Outsourced
office functions to lower cost locations
Expected change in staff remuneration
3.1 2.8 3.5
1.1 1.0 1.0
Fixed share / salary
partners Senior lawyers Equity
partnersJunior lawyers
2.7
Shared service
staff Secretarial / admin staff Paralegals
Mean %
Snapshot of survey findings
6

7
COMMBANK LEGAL MARKET PULSE – QUARTER 3 2014/15
Firm structure
Office locations
76 72
69
41
28 24 24
21 21
0
20
40
60
80
Sydney Melbourne Brisbane Perth Asia Other Adelaide UK / Europe Canberra
%
Primary practice areas
55
62
66
69
69
69
76
76
79
79
83
86
86
93
97
0 20 40 60 80 100
Other general commercial work
Insurance
Taxation
Government
IT, telecoms and media
Energy and resources
Construction, engineering and major infrastructure (including project finance)
Competition, consumer law and trade practices
Intellectual property (including PTA and IP disputes)
Banking and finance (including funds management)
Insolvency and restructuring
Employment, workplace and OH&S
M&A and corporate advisory (including capital markets)
Property, environment and planning
Litigation and dispute resolution
%
8
COMMBANK LEGAL MARKET PULSE – QUARTER 3 2014/15
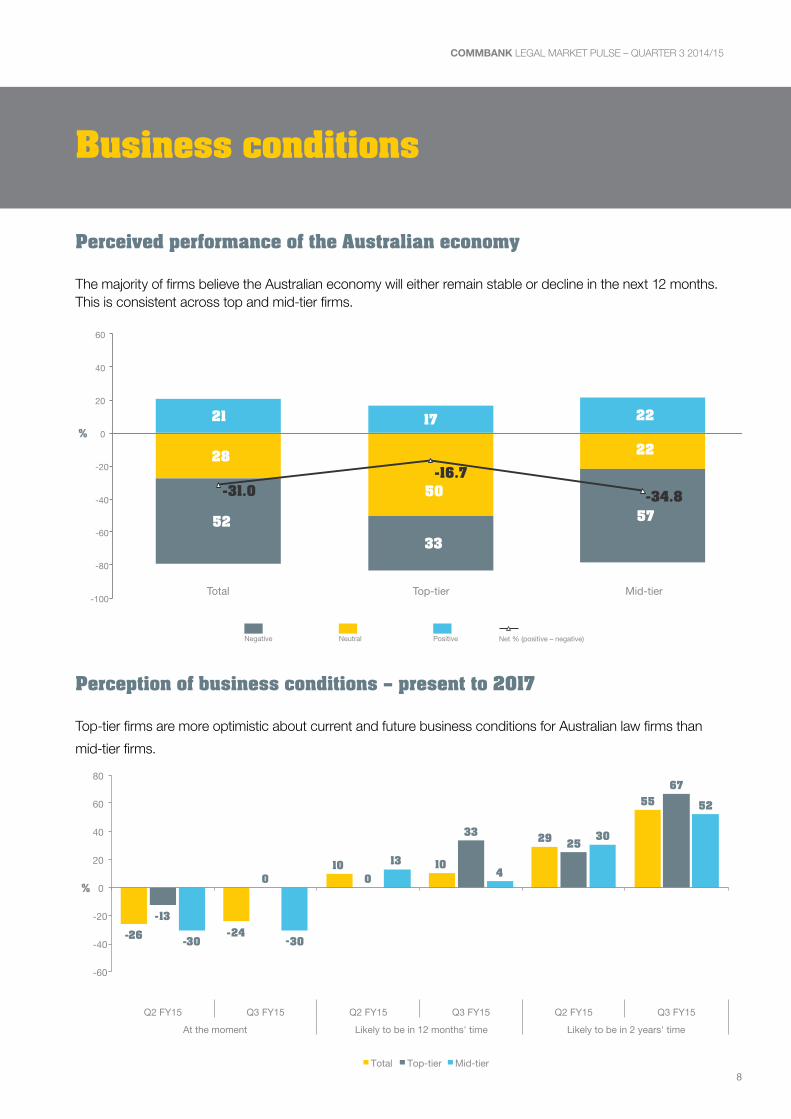
Business conditions
Perceived performance of the Australian economy
The majority of firms believe the Australian economy will either remain stable or decline in the next 12 months. This is consistent across top and mid-tier firms.
Positive Negative Neutral
32
18
21
39
18
29
Net % (positive – negative)
28
50
22
52 33
57
21 17 22
- 31.0 - 16.7
- 34.8
-100
-80
-60
-40
-20
0
20
40
60
Total Top-tier Mid-tier
%
Perception of business conditions – present to 2017
Top-tier firms are more optimistic about current and future business conditions for Australian law firms than
mid-tier firms.
- 26 - 24
10 10 29
55
- 13
0 0
33 25
67
- 30 - 30
13 4
30
52
-60
-40
-20
0
20
40
60
80
Q2 FY15 Q3 FY15 Q2 FY15 Q3 FY15 Q2 FY15 Q3 FY15 At the moment Likely to be in 12 months' time Likely to be in 2 years' time
%
Total Top-tier Mid-tier

9
COMMBANK LEGAL MARKET PULSE – QUARTER 3 2014/15
Perception of business conditions - by area
Mid-tier firms are finding it harder to collect invoices, find quality staff and keep expenses under control compared to the top-tier law firms.
39 55
- 13 - 3
- 42
- 28
50 50
- 13
0
- 25
0
35
57
- 13 - 4
- 48 - 35
-60 -40 -20
0 20 40 60
Q2 FY15 Q3 FY15 Q2 FY15 Q3 FY15 Q2 FY15 Q3 FY15 Accessing capital Keeping quality staff
- 26 - 14
- 23 - 17 - 13
0
- 13
0
- 30 - 17
- 26 - 22
Q2 FY15 Q3 FY15 Q2 FY15 Q3 FY15 Keeping expenses under
control Finding quality staff Collecting invoices
%
Total Top-tier Mid-tier
-100
-80
-60
-40
-20
0
20
40
60
- 55
- 41 - 50
- 33
- 57
- 43
Q2 FY15 Q3 FY15
Competing with other firms
- 55 - 48
- 75
- 50 - 48 - 48
Q2 FY15 Q3 FY15
Winning new business
- 45 - 55
- 50 - 50 - 43
- 57
Q2 FY15 Q3 FY15
Keeping staff fully utilised
- 81
- 66
- 88
- 67 - 78
- 65
Q2 FY15 Q3 FY15 Negotiating price with clients
%
Total Top-tier Mid-tier
10
COMMBANK LEGAL MARKET PULSE – QUARTER 3 2014/15
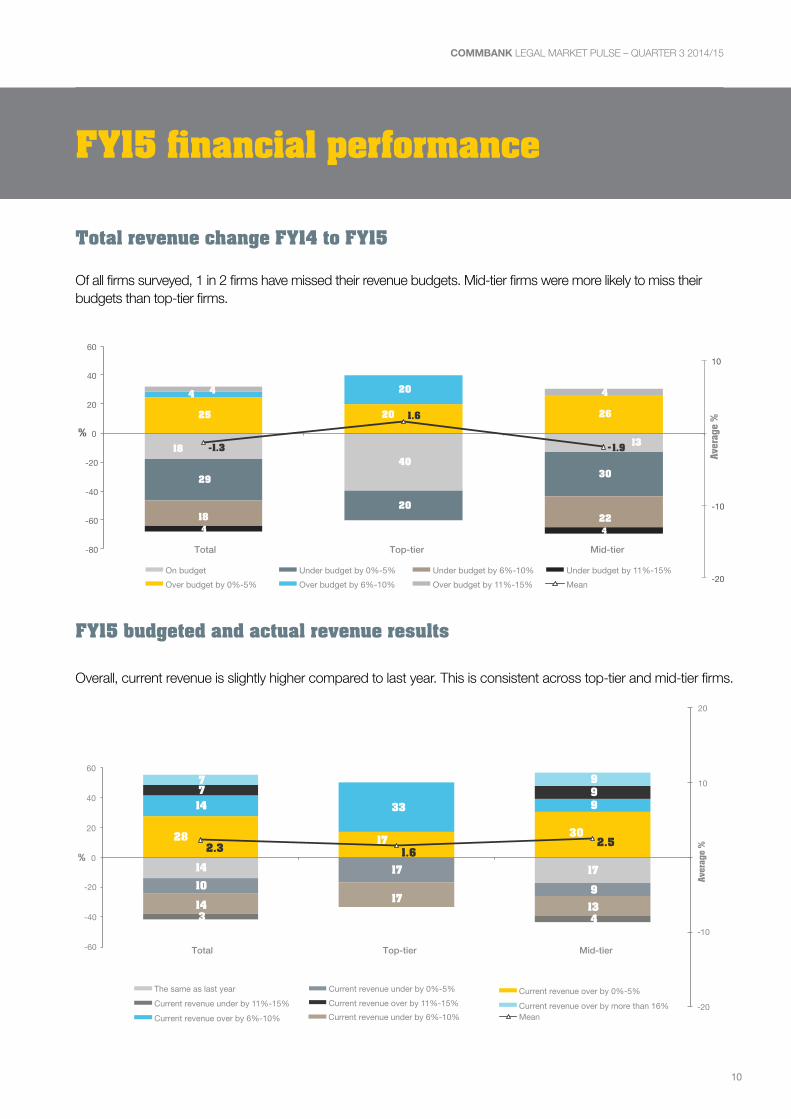
FY15 financial performance
Total revenue change FY14 to FY15
Of all firms surveyed, 1 in 2 firms have missed their revenue budgets. Mid-tier firms were more likely to miss their budgets than top-tier firms.
18 40
13
29
20
30
18 22 4 4
25 20 26
4 20 4 4
- 1.3
1.6
- 1.9
-20
-10
10
-80
-60
-40
-20
0
20
40
60
Total Top-tier Mid-tier
Aver
age
%
%
On budget Under budget by 0%-5% Under budget by 6%-10% Under budget by 11%-15% Over budget by 0%-5% Over budget by 6%-10% Over budget by 11%-15% Mean
FY15 budgeted and actual revenue results
Overall, current revenue is slightly higher compared to last year. This is consistent across top-tier and mid-tier firms.
14 17 10
17
9 14 17
13 3 4
28 17 30
14 33 9 7 9 7 9
2.3 1.6 2.5
-20
-10
10
20
-60
-40
-20
0
20
40
60
Total Top-tier Mid-tier
Aver
age
%
%
The same as last year Current revenue under by 0%-5%
Current revenue under by 6%-10% Current revenue under by 11%-15%
Current revenue over by 0%-5%
Current revenue over by 6%-10% Current revenue over by 11%-15% Current revenue over by more than 16%
Mean

11
COMMBANK LEGAL MARKET PULSE – QUARTER 3 2014/15
FY15 budgeted and actual expenses results
At this time of the financial year, 2 in 3 firms have managed to control their expenses and are tracking below budget.
25 20 26
43 60 39
14 17 7 20 4
11 13
- 3.2
- 4.7
- 2.9
- 20
-10
10
-100
-80
-60
-40
-20
0
20
40
Total Top-tier Mid-tier
Aver
age
%
%
On budget Under budget by 0%-5% Under budget by 6%-10% Under budget by 11%-15% Over budget by 0%-5% Mean
12
COMMBANK LEGAL MARKET PULSE – QUARTER 3 2014/15
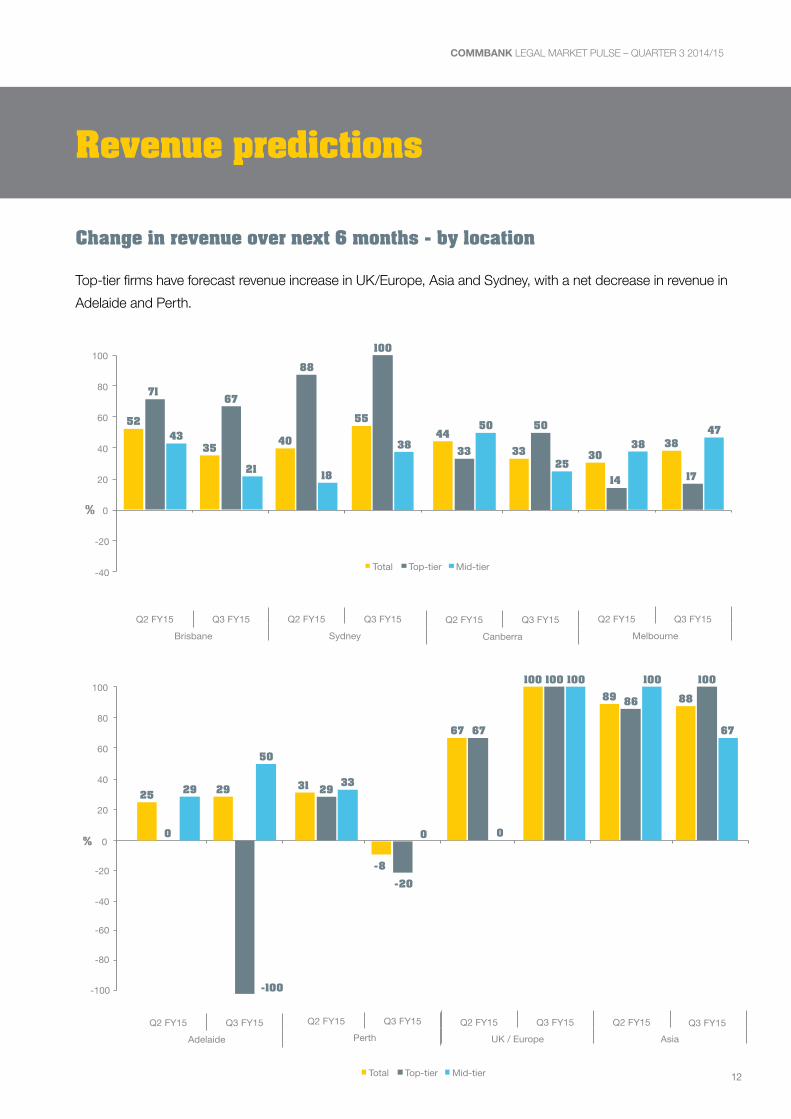
Revenue predictions
Change in revenue over next 6 months - by location
Top-tier firms have forecast revenue increase in UK/Europe, Asia and Sydney, with a net decrease in revenue in
Adelaide and Perth.
30 38
14 17
38 47
-40
-20
0
20
40
60
80
100
Q2 FY15 Q3 FY15 Melbourne
%
Total Top-tier Mid-tier
44 33 33
50 50
25
Q2 FY15 Q3 FY15 Canberra
52
35
71 67
43
21
Q2 FY15 Q3 FY15 Brisbane
40
55
88
100
18
38
Q2 FY15 Q3 FY15
Sydney
67
100 89 88
67 67
100
86
0
100 100 100
Q2 FY15 Q3 FY15 Q2 FY15 UK / Europe Asia
31
- 8
29
- 20
33
0
Q2 FY15 Q3 FY15 Perth
25 29
0
29
50
Q2 FY15 Q3 FY15 Adelaide
-100
-40
-60
-80
-100
-20
0
20
40
60
80
100
%
Q3 FY15
Total Top-tier Mid-tier
13
COMMBANK LEGAL MARKET PULSE – QUARTER 3 2014/15
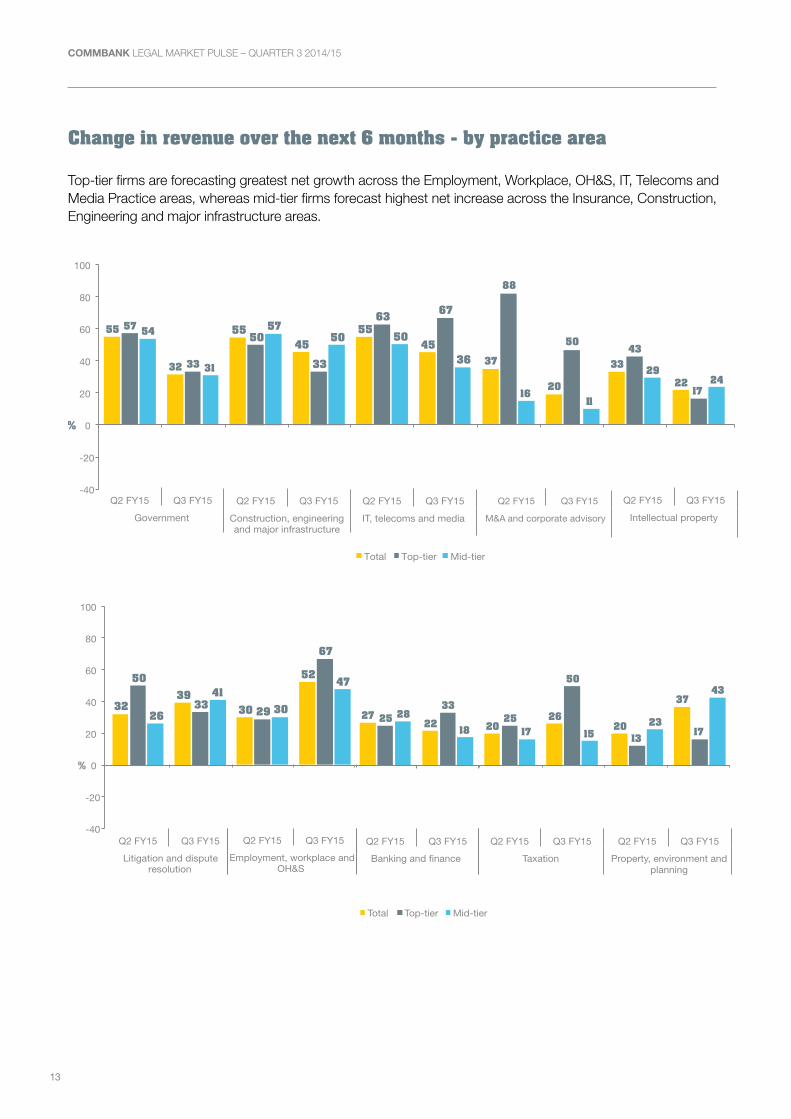
Change in revenue over the next 6 months - by practice area
Top-tier firms are forecasting greatest net growth across the Employment, Workplace, OH&S, IT, Telecoms and Media Practice areas, whereas mid-tier firms forecast highest net increase across the Insurance, Construction, Engineering and major infrastructure areas.
-40
-20
0
20
40
60
80
100
55 45
63 67
50
36
Q2 FY15 Q3 FY15 IT, telecoms and media
%
Total Top-tier Mid-tier
55
32
57
33
54
31
Q2 FY15 Q3 FY15 Government
55 45
50
33
57 50
Q2 FY15 Q3 FY15 Construction, engineering and major infrastructure
37
20
88
50
16 11
Q2 FY15 Q3 FY15 M&A and corporate advisory
33
22
43
17
29 24
Q2 FY15 Q3 FY15 Intellectual property
27 22 25
33 28
18
Q2 FY15 Q3 FY15 Banking and finance
20 26 25
50
17 15
Q2 FY15 Q3 FY15 Taxation
20
37
13 17
23
43
Q2 FY15 Q3 FY15 Property, environment and
planning
32 39
50
33 26
41
Q2 FY15 Q3 FY15 Litigation and dispute
resolution
30
52
29
67
30
47
Q2 FY15 Q3 FY15 Employment, workplace and
OH&S
-40
-20
0
20
40
60
80
100
%
Total Top-tier Mid-tier

14
COMMBANK LEGAL MARKET PULSE – QUARTER 3 2014/15
Change in revenue over the next 6 months - by practice area (continued)
17 14
63
50
- 6
0
Q2 FY15 Q3 FY15
Competition, consumer law and trade practices
15
50
- 25
0
25
60
Q2 FY15 Q3 FY15
Insurance
12 17 14
33
11 11
Q2 FY15 Q3 FY15
Insolvency and restructuring
5 6
- 20
50
12 0
Q2 FY15 Q3 FY15
Other general commercial work
- 30
- 15 - 25
50
- 33 - 43
Q2 FY15 Q3 FY15
Energy and resources
Total Top-tier Mid-tier
-40
-60
-20
0
20
40
60
80
100
%
15
COMMBANK LEGAL MARKET PULSE – QUARTER 3 2014/15
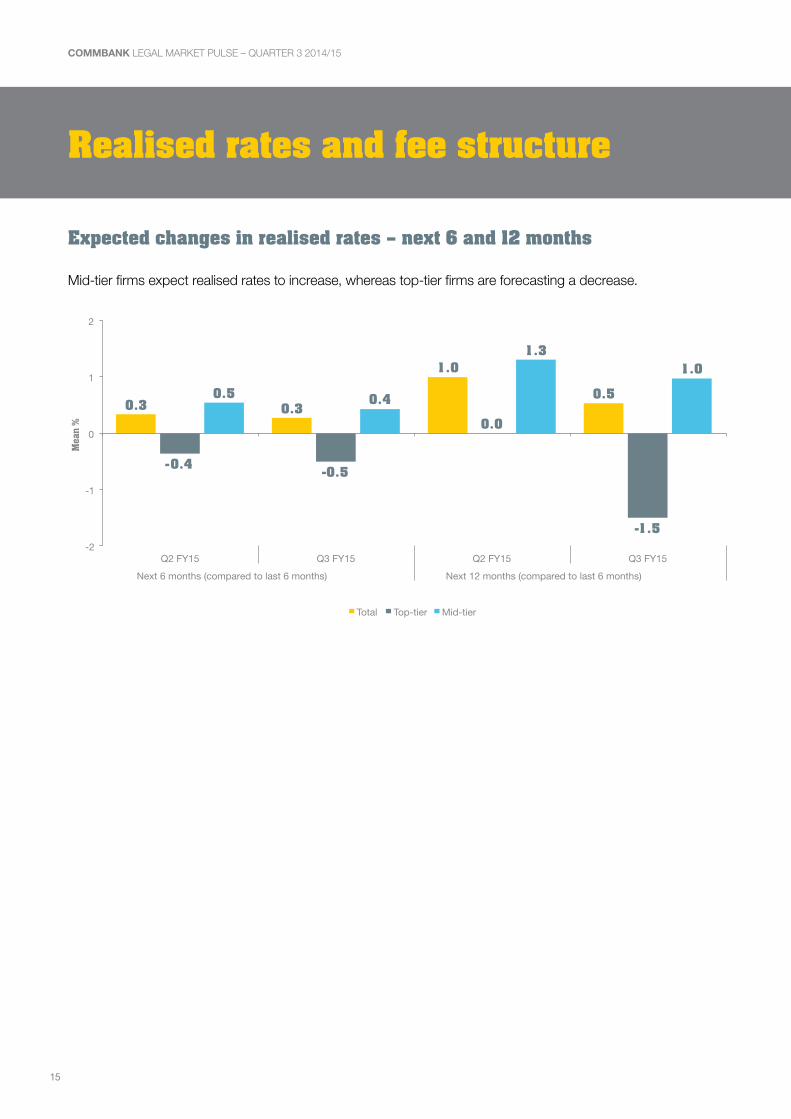
Realised rates and fee structure
Expected changes in realised rates – next 6 and 12 months
Mid-tier firms expect realised rates to increase, whereas top-tier firms are forecasting a decrease.
0.3 0.3
1.0
0.5
- 0.4 - 0.5
0.0
- 1.5
0.5 0.4
1.3 1.0
-2
-1
0
1
2
Q2 FY15 Q3 FY15 Q2 FY15 Q3 FY15 Next 6 months (compared to last 6 months) Next 12 months (compared to last 6 months)
Mea
n %
Total Top-tier Mid-tier
16
COMMBANK LEGAL MARKET PULSE – QUARTER 3 2014/15
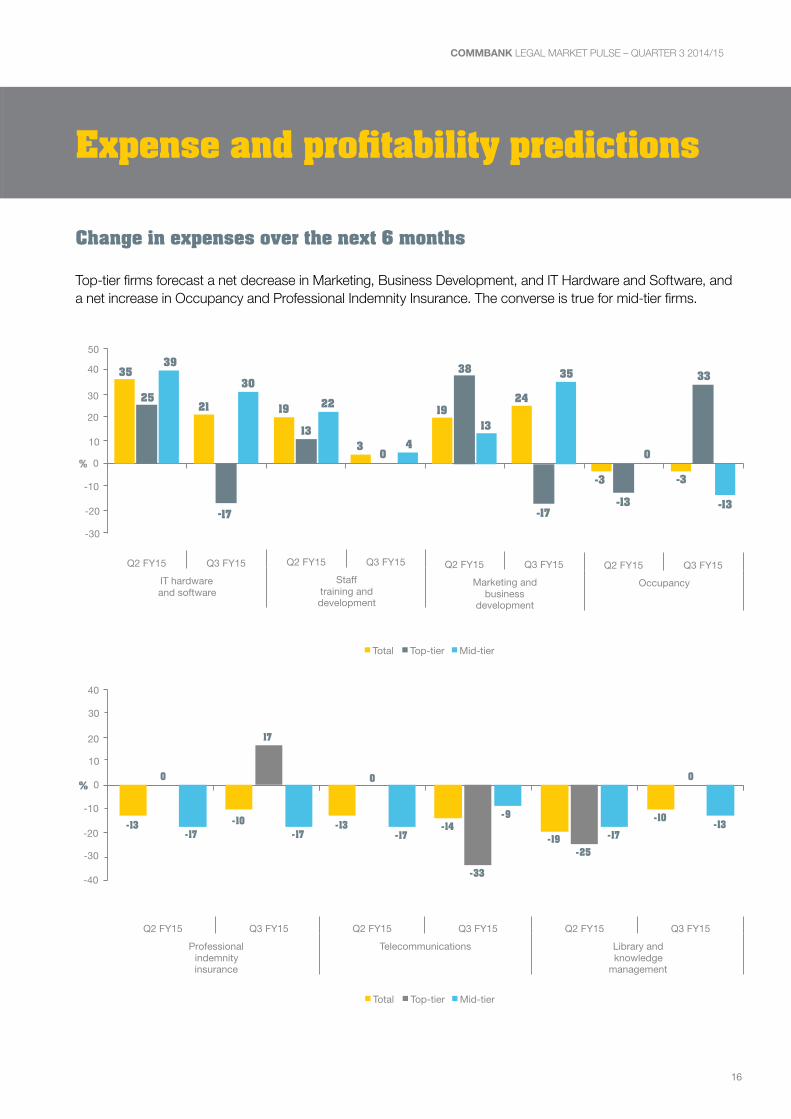
Expense and profitability predictions
Change in expenses over the next 6 months
Top-tier firms forecast a net decrease in Marketing, Business Development, and IT Hardware and Software, and a net increase in Occupancy and Professional Indemnity Insurance. The converse is true for mid-tier firms.
-20
-10 0
20
10
40
50
19 24
38
- 17
13
35
Q2 FY15
Q3 FY15
Marketing and
business
development
19
3 13
0
22
4
Q2 FY15 Q3 FY15
Staff
training and
development
- 3
- 3
- 13
33
0
- 13
Q2 FY15
Q3 FY15
Occupancy
%
Total
Top-tier
Mid-tier
35
21 25
- 17
39 30
Q2 FY15
Q3 FY15
IT hardware
and software
-30
30
-40
-20
0
20
10
-10
-30
30
40
- 13 - 10
0
17
- 17 - 17
Q2 FY15
Q3 FY15
Professional
indemnity insurance
- 19 - 10
- 25
0
- 17 - 13
Q2 FY15
Q3 FY15
Library and knowledge
management
%
Total
Top-tier
Mid-tier
- 13 - 14
0
- 33
- 17 - 9
Q2 FY15 Q3 FY15
Telecommunications

17
COMMBANK LEGAL MARKET PULSE – QUARTER 3 2014/15
Change in staffing over the next 6 months
There is a forecasted decline in net proportion of partner numbers which is being driven by top-tier firms.
6
- 7
26 17 16 17
26 31
0
- 33
- 13
- 67
13
- 33
13 17 9
0
39 39
17 30 30
35
-60
-80
-40
-20
0
20
40
Q2 FY15 Q3 FY15
Q2 FY15 Q3 FY15
Q2 FY15 Q3 FY15
Q2 FY15 Q3 FY15
Equity partner numbers
Fixed share / salary partner
numbers
Senior associates / senior lawyers
(4th year+)
Junior lawyer numbers (Graduates
– 3rd year)
%
Total
Top-tier
Mid-tier
- 26 - 18
- 29 - 31
6 3
- 25 - 20 - 25 - 33
- 13 - 17 - 26
- 17 - 30 - 30
13 9
-40
-20
0
20
40
Q2 FY15 Q3 FY15
Q2 FY15
Q3 FY15
Q2 FY15 Q3 FY15
Shared service staff numbers
Secretarial / admin staff numbers
Paralegals
%
Total
Top-tier
Mid-tier

18
COMMBANK LEGAL MARKET PULSE – QUARTER 3 2014/15
Change in operating margins over the next 6 months
Top-tier firm leaders forecast a greater increase in operating margins, compared to their peers in mid-tier firms.
23 24
50 67
13 13
-40
-20
0
20
40
60
80
Q2 FY15 Q3 FY15
%
Total Top-tier Mid-tier

19
COMMBANK LEGAL MARKET PULSE – QUARTER 3 2014/15
Managing people, staff and talent
Core staff turnover between 1 July & 31 December 2014
Top-tier firms are experiencing the highest turnover in staff, predominantly with junior lawyers.
10.5
2.8 3.9
7.7 9.7
7.5 8.1 9.7 10.0
2.0 3.8
7.0 9.2
7.4 7.3 8.9
12.0
5.7 4.3
10.3 11.5
8.0
11.2 12.7
0.0
5.0
10.0
15.0
Total core workforce
Equity partners
Fixed share / salary
partners Senior
associates / senior
lawyers
Junior lawyers
Paralegals Shared service staff
Secretarial / admin staff
Mea
n %
Total Top-tier Mid-tier
Expected change in core staff turnover in FY15
There is a high net forecast turnover among salary partners, senior lawyers and paralegals, driven by top-tier firms.
10 3
21 28
7 14
- 7
10 13
0
17 26
13 9
- 13
9 0
17
33 33
- 17
33
17 17
-20 -10
0 10 20 30 40
Total core workforce
Equity partners
Fixed share / salary
partners Senior
associates / senior
lawyers
Junior lawyers
Paralegals Shared service staff
Secretarial / admin staff
%
Total Top-tier Mid-tier
20
COMMBANK LEGAL MARKET PULSE – QUARTER 3 2014/15
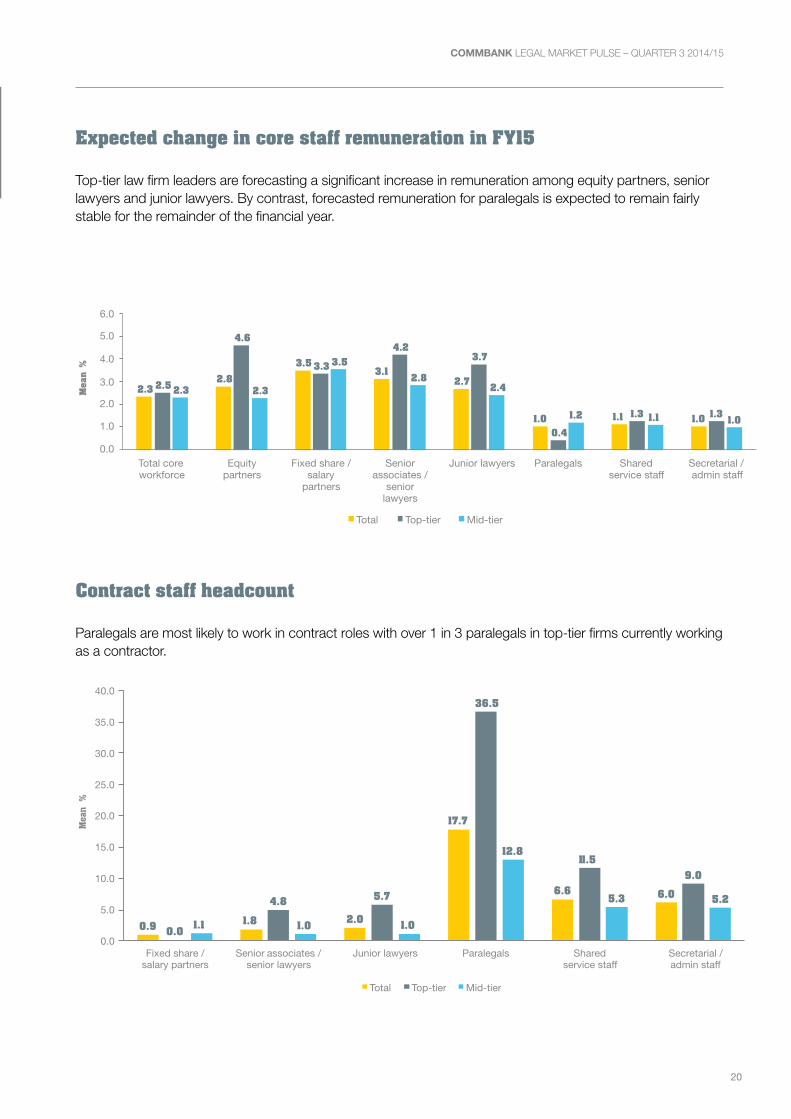
Expected change in core staff remuneration in FY15
Top-tier law firm leaders are forecasting a significant increase in remuneration among equity partners, senior lawyers and junior lawyers. By contrast, forecasted remuneration for paralegals is expected to remain fairly stable for the remainder of the financial year.
2.3 2.8
3.5 3.1
2.7
1.0 1.1 1.0
2.5
4.6
3.3
4.2 3.7
0.4 1.3 1.3
2.3 2.3
3.5 2.8
2.4
1.2 1.1 1.0
0.0
2.0
4.0
6.0
5.0
3.0
1.0
Total core workforce
Equity partners
Fixed share / salary
partners Senior
associates / senior
lawyers
Junior lawyers
Paralegals Shared service staff
Secretarial / admin staff
Mea
n %
Total Top-tier Mid-tier
Contract staff headcount
Paralegals are most likely to work in contract roles with over 1 in 3 paralegals in top-tier firms currently working as a contractor.
0.9 1.8 2.0
17.7
6.6 6.0
0.0
4.8 5.7
36.5
11.5 9.0
1.1 1.0 1.0
12.8
5.3 5.2
0.0
5.0
10.0
15.0
20.0
25.0
30.0
35.0
40.0
Fixed share / salary partners
Senior associates / senior lawyers
Junior lawyers
Paralegals Shared service staff
Secretarial / admin staff
Mea
n %
Total Top-tier Mid-tier
21
COMMBANK LEGAL MARKET PULSE – QUARTER 3 2014/15
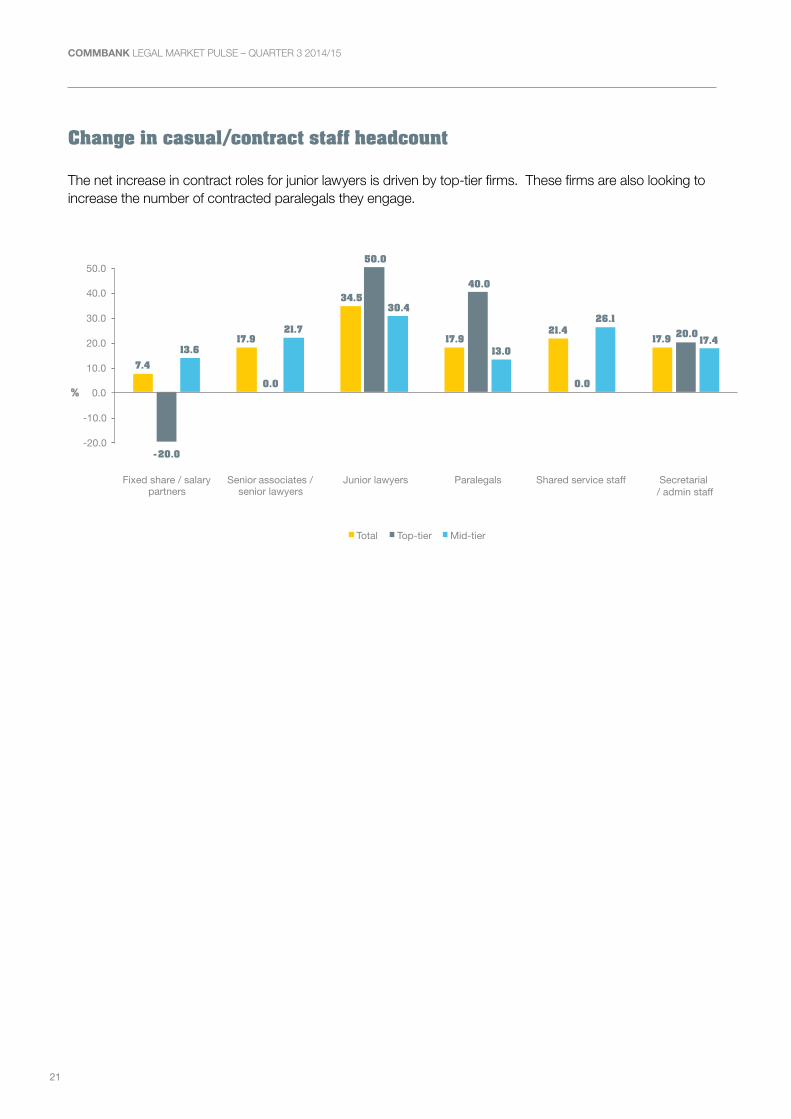
Change in casual/contract staff headcount
The net increase in contract roles for junior lawyers is driven by top-tier firms. These firms are also looking to increase the number of contracted paralegals they engage.
13.6 21.7
30.4
13.0
26.1 17.4
7.4 17.9
34.5
17.9 21.4 17.9
- 20.0
0.0
50.0 40.0
0.0
20.0
-20.0 -10.0
0.0 10.0 20.0 30.0 40.0 50.0
Fixed share / salary partners
Senior associates / senior lawyers
Junior lawyers Paralegals Shared service staff Secretarial / admin staff
%
Total Top-tier Mid-tier

22
COMMBANK LEGAL MARKET PULSE – QUARTER 3 2014/15
Sourcing and outsourcing
Use of LPOs - next 12 months
The majority of firms believe use of LPOs among firms and clients will either increase or remain the same over the next 12 months.
- 46 - 33 - 50 - 41 - 50 - 38
- 7 - 17
- 5 - 4 - 5
- 4 -
5 -
4
- 5
43 50 41 52 50 52
-60
-40
-20
0
20
40
60
Total Mid-tier Total Mid-tier Firm useTop-tier
Client useTop-tier
%
Remain the same Decrease Decrease significantly Increase
Client driven LPO usage
Of the firms surveyed, 1 in 2 top-tier firms believe there is growing pressure from their clients to use LPOs. This sentiment is less prevalent among mid-tier firms.
- 48 - 50 - 48
- 21
0
- 26
31 50 26 10.3
50.0
0.0
-80
-60
-40
-20
0
20
40
60
Total Top-tier Mid-tier
%
Neutral Disagree Agree Net % (agree-disagree)
23
COMMBANK LEGAL MARKET PULSE – QUARTER 3 2014/15
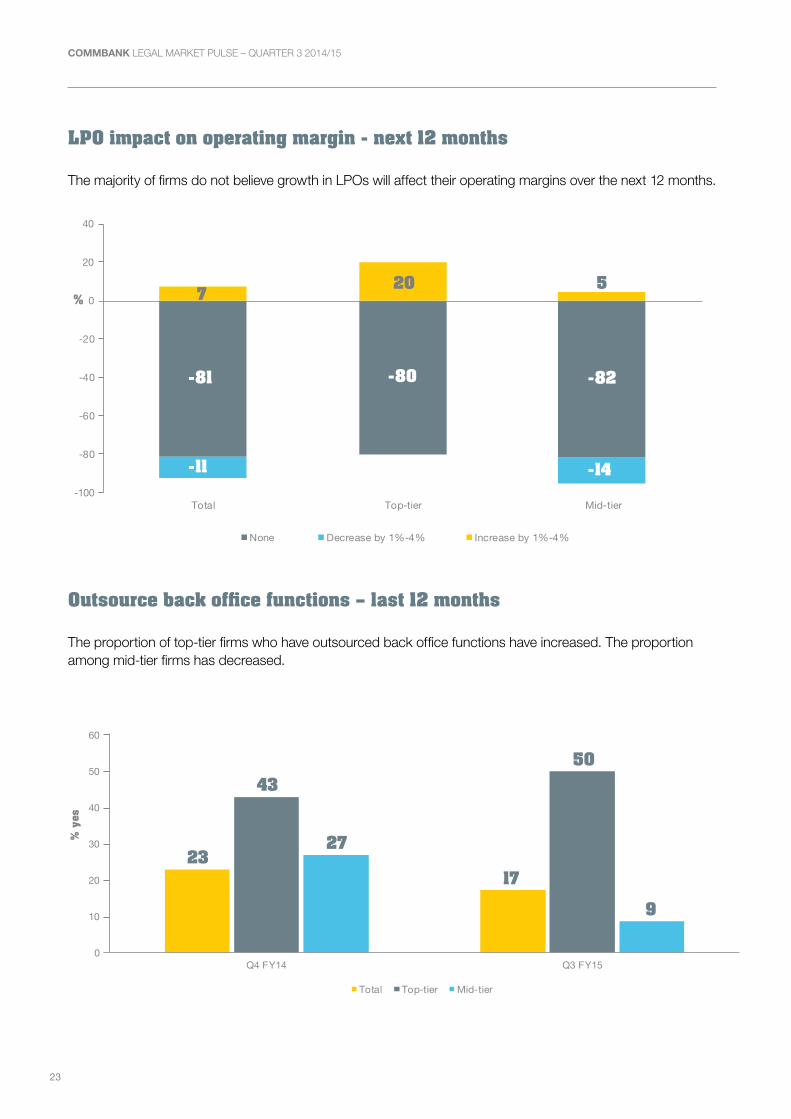
LPO impact on operating margin - next 12 months
The majority of firms do not believe growth in LPOs will affect their operating margins over the next 12 months.
-81 -80 -82
-11 -14
7 20 5
-100
-80
-60
-40
-20
0
20
40
Total Top-tier Mid-tier
%
None Decrease by 1%-4% Increase by 1%-4%
Outsource back office functions – last 12 months
The proportion of top-tier firms who have outsourced back office functions have increased. The proportion among mid-tier firms has decreased.
4350
27
9
2317
0
10
20
30
40
50
60
Q4 FY14 Q3 FY15
% y
es
Total Top-tier Mid-tier
24
COMMBANK LEGAL MARKET PULSE – QUARTER 3 2014/15
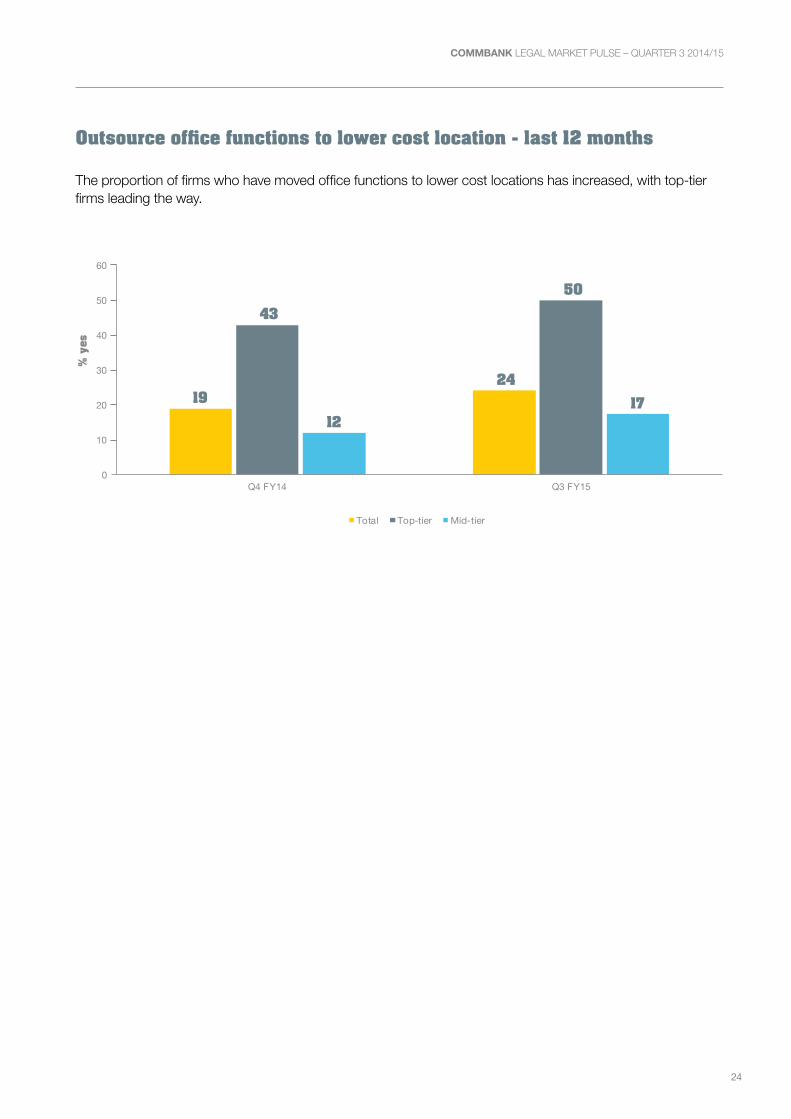
Outsource office functions to lower cost location - last 12 months
The proportion of firms who have moved office functions to lower cost locations has increased, with top-tier firms leading the way.
1924
4350
1217
0
10
20
30
40
50
60
Q4 FY14 Q3 FY15
% y
es
Total Top-tier Mid-tier

25
COMMBANK LEGAL MARKET PULSE – QUARTER 3 2014/15
Further information
For further insights or information, please contact:
Marc Totaro, National Manager Professional Services
Mobile: 0477 739 315 Phone: +61 2 9303 1940 Email: [email protected] Web: commbank.com.au/legalmarketpulse
For media inquiries, please contact:
Sarah Gibbons, Public Relations Advisor Phone: +61 2 9118 1706 Email: [email protected]
About Beaton Research + Consulting
Beaton Research + Consulting is a full-service research firm which offers a full range of solutions for professional services firms, financial services firms and associations. Their expertise includes benchmarking, thought leadership, brand solutions, customised solutions and client satisfaction.
Things to know before you Can: This report is published solely for information purposes. As this report has been prepared without considering your objectives, financial situation or needs, you should before acting on the information in this report, consider its appropriateness to your circumstances and if necessary seek the appropriate professional advice. This quarterly report has been prepared independently by Beaton Research + Consulting and commissioned by Commonwealth Bank. The confidential on-line survey used to prepare this report was undertaken by Beaton Research + Consulting in February 2015. The report is based on the views of 31 legal firms across Australia and any opinions, conclusions or recommendations are reasonably held or made, based on the information available at the time of its compilation, but no representation or warranty, either expressed or implied, is made or provided as to the accuracy, reliability or completeness of any statement made in this report. The project was undertaken in compliance with the requirements of ISO 20252. Commonwealth Bank of Australia ABN 48 123 123 124.


