18
Comments on “Labor Force and Wage Dynamics” by French, Mazumder and Taber
| Date post: | 19-Dec-2015 |
| Category: |
Documents |
| View: | 216 times |
| Download: | 0 times |

Comments on “Labor Force and Wage Dynamics”
by French, Mazumder and Taber

Discussant dilemma
• Two approaches– Interpret results– Focus on methods
• I follow the latter– Results are preliminary– Conference to guide revisions

Question
• How do wage and employment dynamics – differ over the business cycle?– differ across workers?
• Policy relevance– Do recessions affect wage growth?– Does welfare to work have potentially large
long term effects?• Do the least advantaged have different dynamics?

Overview
• Methodological issues
• Data
• Presentation

Methodology
• General comments– Quality is what I expect from these authors– Face difficult issues that can’t be avoided
• Technique not for technique’s sake

Methodology
• Issue #1-- Returns to Tenure – Standard framework--wages grow
• Within job due to – returns to job specific skills (tenure)– returns to general skills (experience)
• Between job due to – better job match– offset due to lost returns to tenure

Methodology
• Authors don’t try to separate returns to tenure from returns to experience– I’m sympathetic since
• Requires additional strong assumptions• Previous studies have shown low returns to tenure
for less educated
– But it would be useful to policy community• Do welfare recipients lose wage gains when they
job hop?

Methodology
– Suggestion• Change exposition to focus on
– wage changes within jobs and between jobs– rather than on returns to experience and job match
• This is all that is identified in this model• Study doesn’t provide information on
– Returns to specific and general human capital– Whether policy should encourage or discourage job
hoping

Methodology
• Issue #2 -separating returns to experience from shifts in wages that affect everyone– Suppose average wages of workers increase
by 4%• Does this reflect
– returns to experience (and tenure)?– aggregate shifts that affect everyone?
• Answer important given focus on cycle
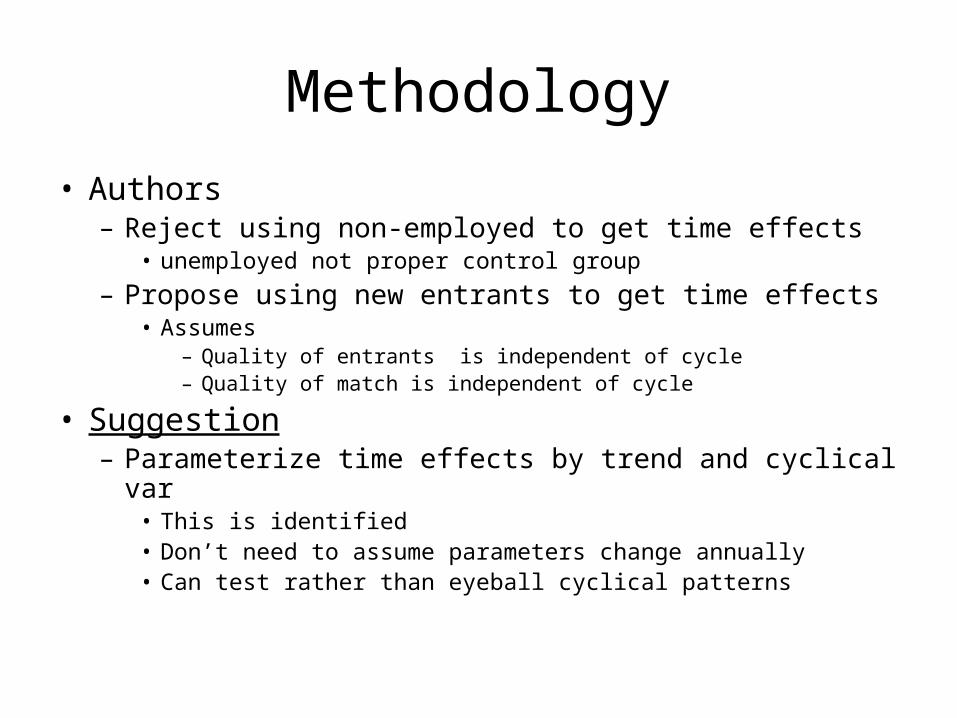
Methodology
• Authors – Reject using non-employed to get time effects
• unemployed not proper control group
– Propose using new entrants to get time effects• Assumes
– Quality of entrants is independent of cycle– Quality of match is independent of cycle
• Suggestion– Parameterize time effects by trend and cyclical var
• This is identified• Don’t need to assume parameters change annually• Can test rather than eyeball cyclical patterns

Methodology
• Issue #3 – Selection – Wages increase if
• workers earn more• low wage workers drop out
– Solution requires identifying assumption • Authors’ assumption: work is independent of
– Cyclical variation in wages» make hay while the sun shines
– Job match» make hay when farm next door offers job
– No suggestion for this problem

Data
• Use 1984 to 2001 SIPP panels– Good information on
• Wages• employer
• Problem with monthly data– Seam bias– 96 and 01 panels collect employer id only
once a wave– Suggestion– treat wave as unit of observation

Presentation
• Provide better evidence on cyclicality of series
• Currently cycle is in the eye of the beholder
– Indicate recessions– Plot confidence intervals– Parameterize trend and cycle
• Provide links to trend and cycle in wage inequality

Presentation
• Provide information on diversity within education groups– Does mean experience of education group
apply to most members?• Are most (all) welfare recipients likely to have
same experiences as average experience of dropouts?
• Previous evidence suggests not– – Non-managerial job in food industry– In poor family

$ % $ % $ % $ %
(1) (2) (3) (4) (5) (6) (7) (8)# Observations 114 125 65 71 mean - 2.5% 0.18 2.6% 0.03 0.4% 0.08 1.4% -0.35 -4.2%mean 0.70 7.2% 0.32 3.9% 0.69 7.4% 0.30 2.2%mean + 2.5% 1.23 11.7% 0.62 7.4% 1.29 13.4% 0.94 8.6%10th Percentile -0.51 -6.8% -0.53 -9.1% -0.78 -13.3% -0.90 -14.8%15th Percentile -0.35 -4.2% -0.24 -4.3% -0.39 -6.4% -0.31 -4.3%20th Percentile -0.27 -3.9% -0.20 -3.6% -0.32 -3.9% -0.23 -3.2%25th Percentile -0.20 -3.4% -0.17 -2.9% -0.25 -3.3% -0.17 -2.8%30th Percentile -0.16 -2.7% -0.13 -2.3% -0.20 -3.1% -0.15 -2.6%35th Percentile -0.13 -2.2% -0.11 -1.7% -0.15 -2.6% -0.13 -2.5%40th Percentile -0.06 -0.9% -0.05 -1.0% -0.09 -1.6% -0.12 -1.9%45th Percentile -0.01 0.2% 0.01 0.2% -0.05 -0.3% -0.06 -1.6%50th Percentile 0.05 0.7% 0.12 2.2% 0.03 1.0% -0.01 -0.3%55th Percentile 0.15 3.0% 0.18 3.5% 0.21 2.8% 0.07 0.7%60th Percentile 0.32 5.2% 0.30 5.1% 0.29 4.6% 0.13 2.3%65th Percentile 0.49 6.9% 0.35 6.3% 0.48 6.0% 0.19 3.7%70th Percentile 0.57 8.3% 0.53 8.0% 0.63 8.4% 0.34 5.1%75th Percentile 0.70 10.6% 0.63 10.5% 0.80 10.6% 0.52 8.0%80th Percentile 0.82 13.9% 0.80 12.0% 0.94 12.8% 0.91 13.8%85th Percentile 1.05 15.3% 0.93 14.3% 1.53 19.5% 1.34 16.5%90th Percentile 1.57 18.9% 1.41 19.6% 2.44 27.9% 1.93 28.2%
Females
Table 4. Distribution of Wage Growth (average annualized, base sample, by gender)
In Sample > 18 MonthsAll IndividualsMales Females Males
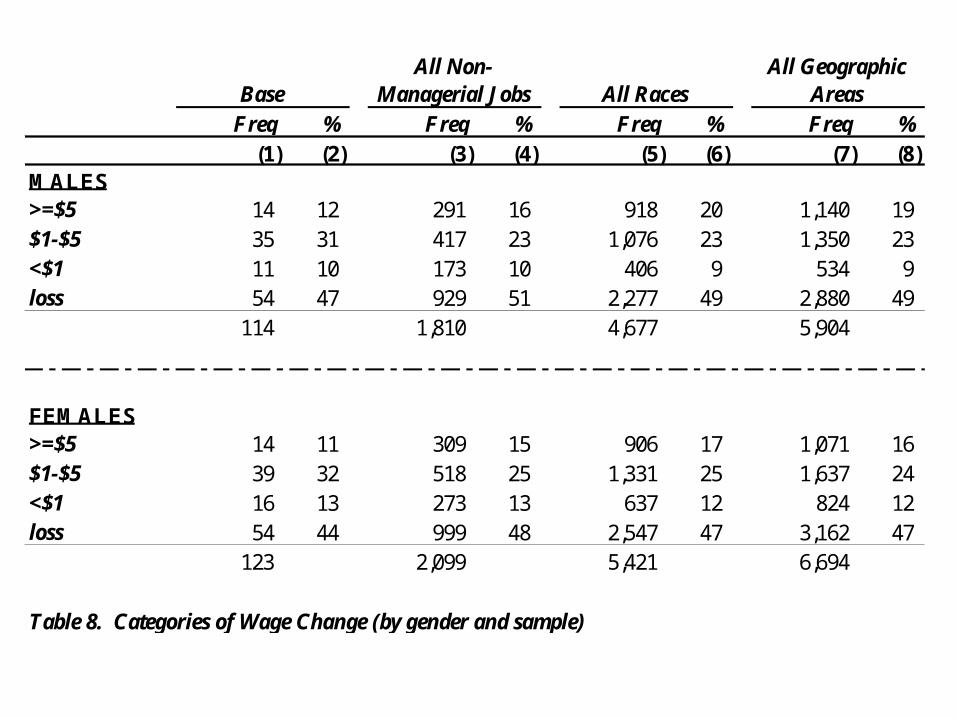
Freq % Freq % Freq % Freq %(1) (2) (3) (4) (5) (6) (7) (8)
MALES>=$5 14 12 291 16 918 20 1,140 19 $1-$5 35 31 417 23 1,076 23 1,350 23 <$1 11 10 173 10 406 9 534 9 loss 54 47 929 51 2,277 49 2,880 49
114 1,810 4,677 5,904
FEMALES>=$5 14 11 309 15 906 17 1,071 16 $1-$5 39 32 518 25 1,331 25 1,637 24 <$1 16 13 273 13 637 12 824 12 loss 54 44 999 48 2,547 47 3,162 47
123 2,099 5,421 6,694
Table 8. Categories of Wage Change (by gender and sample)
BaseAll Non-
Managerial Jobs All RacesAll Geographic
Areas

Presentation
• Suggestion– Show percentiles of distributions– Quantile regressions
Conclusion
• Study addresses important question
• Difficult issues– Well addressed by authors
• Technique is necessary• Cross--tabs won’t do
– Early draft that should lead to good paper


