32
Commercial District Recovery Plan Check-In Meeting RKG Associates

Commercial District Recovery Plan Check-In Meeting
RKG Associates
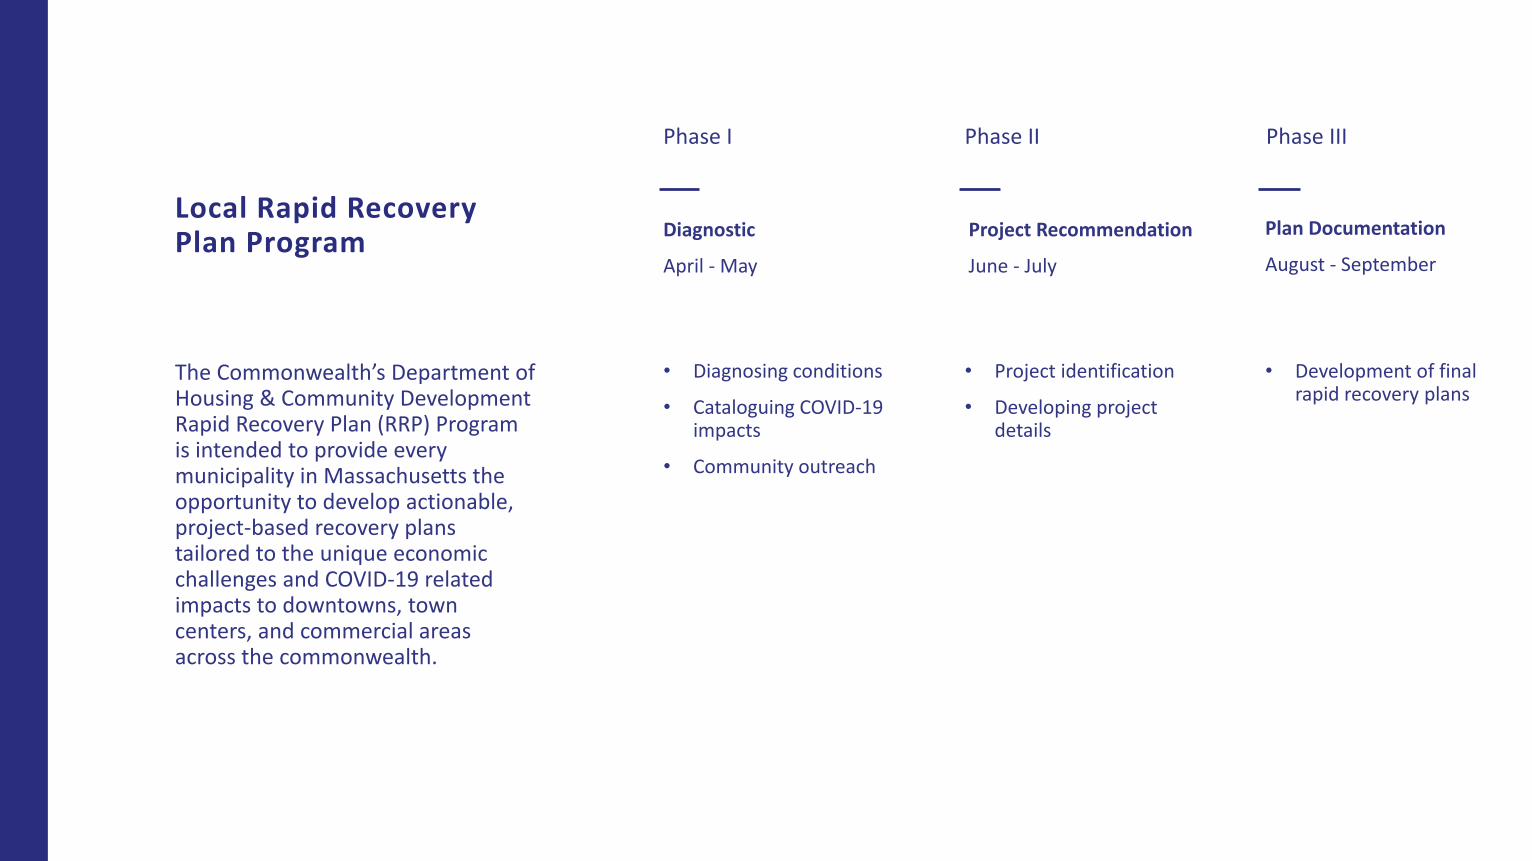
The Commonwealth’s Department of Housing & Community Development Rapid Recovery Plan (RRP) Program is intended to provide every municipality in Massachusetts the opportunity to develop actionable, project-based recovery plans tailored to the unique economic challenges and COVID-19 related impacts to downtowns, town centers, and commercial areas across the commonwealth.
Local Rapid Recovery Plan Program
Phase I Phase II Phase III
Diagnostic
April - May
Project Recommendation
June - July
Plan Documentation
August - September
• Diagnosing conditions
• Cataloguing COVID-19 impacts
• Community outreach
• Project identification
• Developing project details
• Development of final rapid recovery plans

• Summary of Phase I findings• Baseline Data Collection• Business Survey Report Results• Business Association Conversations
• Open Discussion• Next Steps

Data was collected at the city level and by commercial district
Neighborhood Districts
Large Commercial Districts
Developing Districts
Kendall Square/Osborn Triangle
Central Square/Lower Cambridgeport
Harvard Square
Porter Square
Huron Village/Observatory Hill
Lower Mass. Ave.
Inman Square
East Cambridge/Cambridge St.
North Mass. Ave.
Northpoint/Cambridge Crossing
Concord Alewife / Fresh Pond
Baseline Data Collection

Baseline Data Collection

Citywide
Porter Square/ North Mass. Ave.East CambridgeConcord Alewife / Fresh Pond
RESIDENT POPULATION
118,202947 1,876 4,834
MEDIAN HH INCOME
$99,021
Sources: Esri Business Analyst, 2020; Census Bureau OnTheMap, 2018; City of Cambridge, 2020
MEDIAN AGE
32
AVERAGE HH SIZE
2.03
EMPLOYEES 124,243
0 10,000
$109,983
$111,861
$120,378
$75,000 $125,000City
37
37
38
30 40City
2.191.84
1.0 3.0City
2.02
1,391 11,606
0 15,000
7,890
Commercial Districts

EDUCATIONAL ATTAINMENT
Sources: Esri Business Analyst, 2020
CitywidePorter Square/ North Mass. Ave.East CambridgeConcord Alewife / Fresh Pond
3,547
6,409
5,431
1,591
23,505
41,584
0 10,000 20,000 30,000 40,000
Less than High School
High School Graduate (or GED
Some College, No Degree
Associate Degree
Bachelor’s Degree
Masters/Professional School/ Doctorate Degree400
213
17
50
44
18
805
400
27
79
164
59
1710
1344
102
117
350
110
0 500 1,000 1,500 2,000
Commercial Districts

Sources: Esri Business Analyst, 2020
13,506
9,337
13,292
31,236
16,577
10,044
10,208
8,254
4,074
1,674
0 10,000 20,000 30,000
0–17
18–20
21–24
25–34
35–45
45–54
55–64
65–74
75–84
85+
AGE DISTRIBUTION
CitywidePorter Square/ North Mass. Ave.East CambridgeConcord Alewife / Fresh Pond
16
37
89
97
102
193
209
59
25
123
46
112
179
228
179
247
546
156
42
143
149
214
417
527
563
885
980
256
120
725
0 250 500 750 1000 1250
Commercial Districts

Sources: Esri Business Analyst, 2020
RACE/ETHNICITYPorter Square/ North Mass. Ave.East CambridgeConcord Alewife / Fresh PondCitywide
67%
10%
0%
16%
0%
2%
5%
8%
92%
64%
6%
0%
23%
0%
3%
4%
9%
91%
55%
13%
1%
24%
0%
2%
6%
8%
92%
57%
13%
0%
21%
0%
3%
5%
10%
90%
0% 10% 20% 30% 40% 50% 60% 70% 80% 90% 100%
White Alone
Black or African American Alone
American Indian and Alaska Native Alone
Asian Alone
Native Hawaiian and Other Pacific Islander Alone
Some Other Race Alone
Two or More Races
Hispanic or Latino
Not Hispanic or Latino

PHYSICAL ENVIRONMENT
Citywide
AVERAGE ANNUAL DAILY TRAFFIC
Sources: City of Cambridge, 2020* Traffic counts from MassDOT 2019 & Esri 2006 – 2013
OPEN SPACE (ACRES)
STOREFRONTS
888.2
869
Porter Square/ North Mass. Ave.East CambridgeConcord Alewife / Fresh Pond
21,891 34,415 48,054
0 60,000
332 2,114
1,838
PRIMARY STREET
SECONDARY STREET
4.4 134.413.6
0 150
11532 77
0 150
Commercial Districts

PHYSICAL ENVIRONMENT
Sources: City of Cambridge, 2020
GROUND FLOOR RETAIL SPACE
(SQUARE FEET)
GROUND FLOOR OFFICE SPACE
(SQUARE FEET)
GROUND FLOOR MANUFACTURING SPACE
(SQUARE FEET)
2,136,222
2,871,071
358,724
- 1,000,000 2,000,000
Citywide
342,984
47,201
-
425,068
357,872
-
258,941
682,562
133,245
- 200,000 400,000 600,000 800,000
Porter Square/ North Mass. Ave.East CambridgeConcord Alewife / Fresh Pond
Commercial Districts

PHYSICAL ENVIRONMENT
Public Realm Grades
Porter Square East Cambridge Concord Alewife / Fresh Pond
SIDEWALK
LIGHTING
WAYFINDING/ SIGNAGE
ROADBED & CROSSWALKS
A A ASTREET TREES &
BENCHES C B CB A BB B CB A B

PHYSICAL ENVIRONMENT
Porter Square East Cambridge Concord Alewife / Fresh Pond
WINDOW
OUTDOOR DISPLAY/DINING
SIGNAGE
AWNING
FACADE
LIGHTING
Private Realm Grades
A A CC B FA A CC C FA A BC B C

1,015
784
569
562
514
- 200 400 600 800 1,000
Professional & Technical Services
Other Services
Retail Trade
Accommodation & Food Services
Health Care
Citywide
Sources: Esri Business Analyst, 2020
Total # of Businesses(Top 5 Industries)
Porter Square/ North Mass. Ave.East CambridgeConcord Alewife / Fresh Pond
Commercial Districts
21
20
15
15
10
64
37
71
46
22
67
33
39
19
45
- 25 50 75

Business Closures
Sources: City of Cambridge (data as of March 2021)
Porter Square/ N. Mass. Ave
Citywide
East Cambridge
58
Concord Alewife/Fresh Pond
5
4
2
50% in Accommodation & Food Services33% in Retail
40% in Accommodation & Food Services40% in Retail
25% in Accommodation & Food Services
25% in Retail
100% in Accommodation & Food Services

Vacant Storefronts
Sources: City of Cambridge (data as of March 2021)
Porter Square/ N. Mass. Ave
Citywide
East Cambridge
132
Concord Alewife/Fresh Pond
13
14
5

Business Survey
Business Characteristics
A city-wide business survey was conducted during March and April of 2021. The survey received 71 responses from owners or other appropriate representatives of business establishments located in Cambridge.
• 51% of the businesses surveyed have 5 or fewer employees
• 90% rent their space
• 52% reported increases in revenue during the 3 years prior to COVID

Impacts of COVID-19
• 80% of businesses generated less revenue in 2020 than they did in 2019
• 96% of businesses reported being impacted by COVID
• 81% of businesses had less on-site customers in January and February of 2021 than before COVID
• 83% of businesses reported they were operating at reduced hours/capacity or closed at the time of the survey
Business Survey

Business Survey
Business Satisfaction with Commercial District
• Average satisfaction rating among respondents are positive across all categories

Business Survey
Business Input Related to Possible Strategies
Physical Environment, Atmosphere, and Access
Average ratings among respondents regarding importance of various strategies reveals:• There is not much interest in investing in exterior building renovations• The highest level of interest is in changes related to public parking

Business Survey
Business Input Related to Possible Strategies
Attraction/Retention of Customers and Businesses
Average ratings among respondents regarding importance of various strategies reveals:• There is not much interest in zoning or district management changes• The highest level of interest is in an implementation of coordinated district-
specific marketing strategies and continuing to allow outdoor dining

Business Survey
Business Input Related to Possible Strategies
• 62% of businesses indicated that the regulatory environment poses an obstacle to business operation
• 59% of businesses expressed interest in receiving some kind of assistance, with shared marketing receiving the most interest
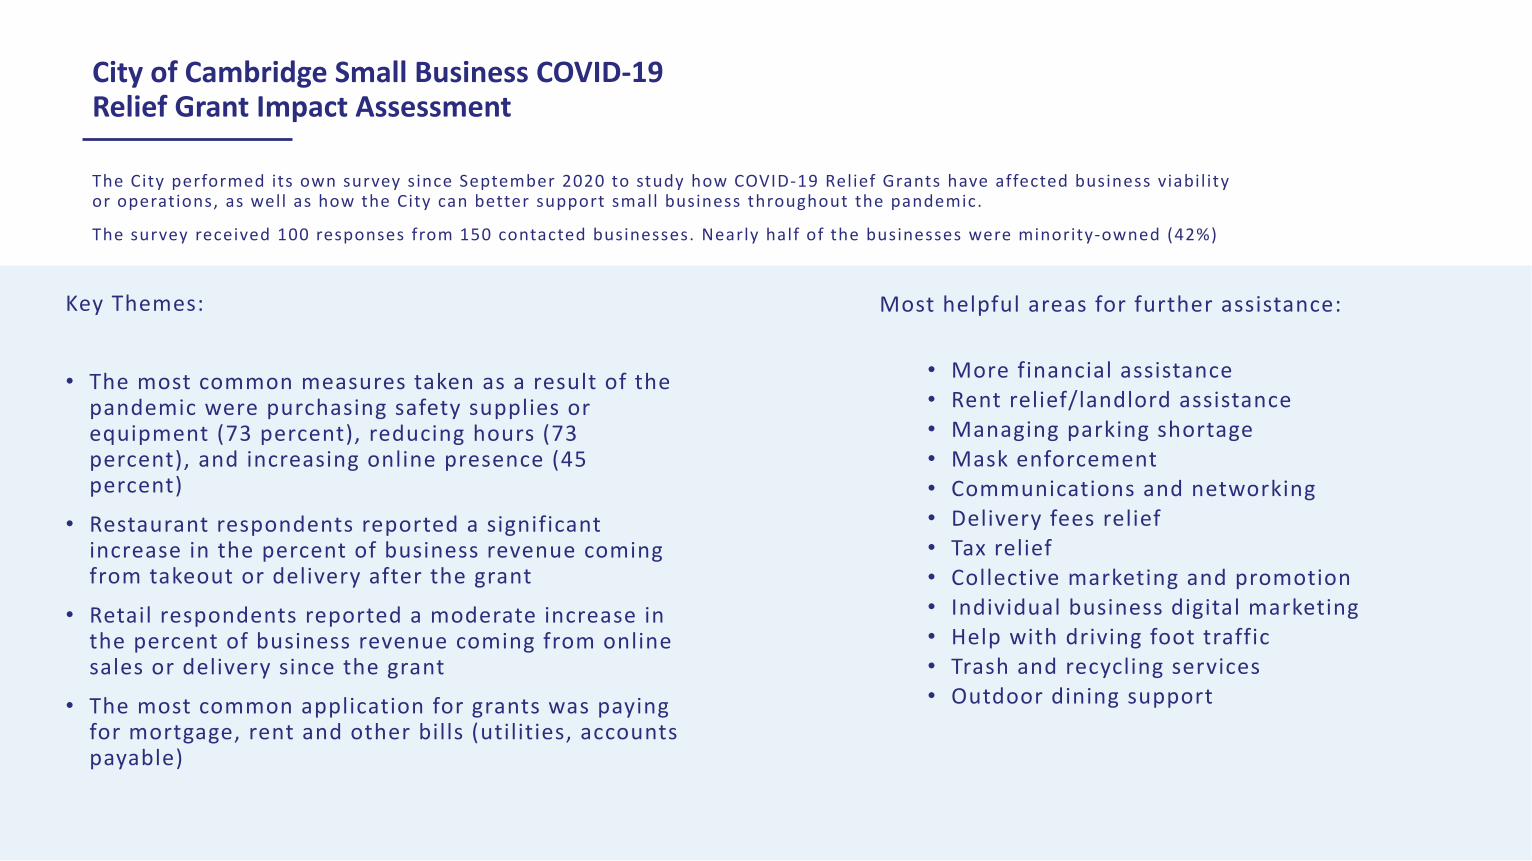
City of Cambridge Small Business COVID-19 Relief Grant Impact Assessment
Key Themes:
• The most common measures taken as a result of the pandemic were purchasing safety supplies or equipment (73 percent), reducing hours (73 percent), and increasing online presence (45 percent)
• Restaurant respondents reported a significant increase in the percent of business revenue coming from takeout or delivery after the grant
• Retail respondents reported a moderate increase in the percent of business revenue coming from online sales or delivery since the grant
• The most common application for grants was paying for mortgage, rent and other bills (utilities, accounts payable)
The City performed its own survey since September 2020 to study how COVID-19 Relief Grants have affected business viabil ity or operations, as well as how the City can better support small business throughout the pandemic.
The survey received 100 responses from 150 contacted businesses. Nearly half of the businesses were minority-owned (42%)
Most helpful areas for further assistance:
• More financial assistance• Rent relief/landlord assistance• Managing parking shortage• Mask enforcement• Communications and networking• Delivery fees relief• Tax relief• Collective marketing and promotion• Individual business digital marketing• Help with driving foot traffic• Trash and recycling services• Outdoor dining support

Business Association Input Related to Possible Strategies
• Increase communication channels between business owners citywide (across districts)
• Streamline permitting/licensing process
• Increase district branding/marketing efforts
• Improve wayfinding systems to promote movement between districts
• Standardize protocols for future outdoor events
• Extend certain temporary regulations (dependent on state laws)• Outdoor dining• To-go alcohol sales• Cap on third-party restaurant delivery fees

Open Discussion
Potential Project Recommendation Areas:
Address vacant storefronts:• Connect artists, entrepreneurs, and makers/crafters
with landlords to set up temporary “pop-up storefronts” in vacant properties (potentially becoming long-term tenants)
• Increase landlord participation of the City ’s Vacant Storefront Design Program, installing local artists work into vacant storefronts
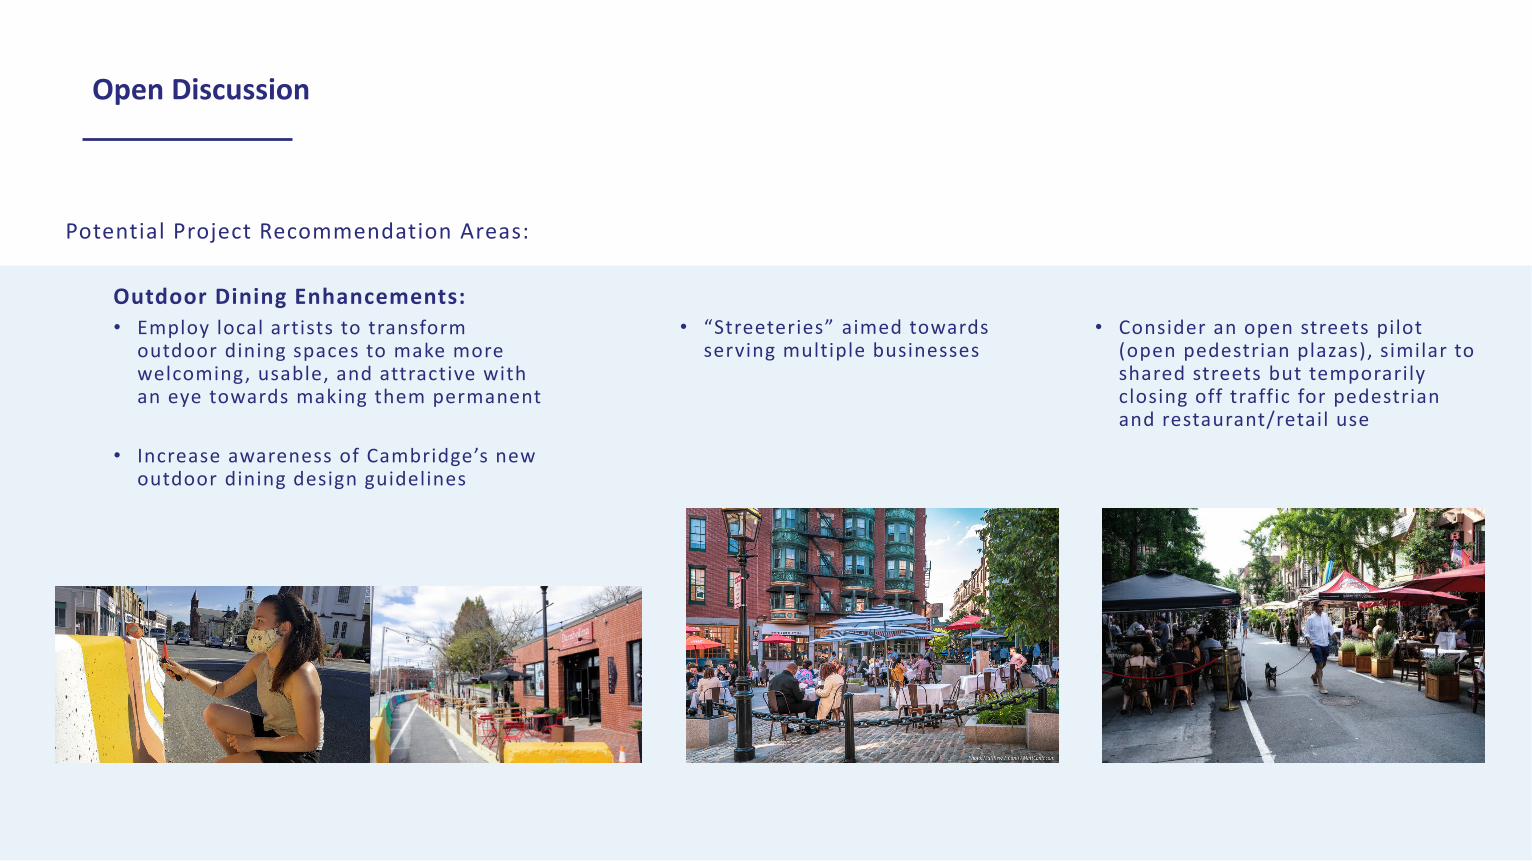
Potential Project Recommendation Areas:
Open Discussion
Outdoor Dining Enhancements:• Employ local artists to transform
outdoor dining spaces to make more welcoming, usable, and attractive with an eye towards making them permanent
• Increase awareness of Cambridge’s new outdoor dining design guidelines
• “Streeteries” aimed towards serving multiple businesses
• Consider an open streets pilot (open pedestrian plazas), similar to shared streets but temporarily closing off traffic for pedestrian and restaurant/retail use

Open Discussion
Potential Project Recommendation Areas:
Additional pop-ups/outdoor events:• Pop-up parks & plazas • “Social Zones” (designated areas
allowing alcohol consumption)• Pop-up retail & community space in city-owned
and privately-owned lots and underutilized spaces (like Starlight Square)
• Activate alleys at specified times
• Pop-up retail in vacant stores (partnering with landlords for short-term leases)

Open Discussion
Potential Project Recommendation Areas:
Enhanced marketing/branding/wayfinding efforts:• Pledge to support local business (through city
construction mitigation programs like “Shop Inman” and “Shop Harvard”)
• District or City-wide multi-platform marketing campaign
• Coordinated social media marketing
• Wayfinding systems to promote movement between squares (with integrated branding/art)

Current City Efforts
• Doing Business with the City• Small Business Portal - f irst-stop website for doing business with the City
(e.g. where to f ind common permits and l icenses, zoning information, and small business resources)
• Interdepartmental col laboration around l icensing and permitt ing
• Financial & Technical Assistance • Individual Business Grant Programs (HUD/CDBG and Tax Funded):
• City : Storefront Improvement, Retai l Interior Accessibi l i ty, and Small Business Enhancement
• Current/future state federal funding programs : American Rescue Plan Act, SBA/Restaurant Revital ization Fund, and Mass Growth Capital Programs
• Commercial Distr ict Grant Program – Small Business Chal lenge• Technical Assistance:
• Free workshops for city entrepreneurs and business owners on such topics as social media and e-commerce
• Small Business Coaching – Offering free one-on-one assistance with experts in f inancial planning, marketing, interior design, and more
• Inspectional Services and CDD Small Business Office Hours• One-on-one meetings with city staff

Open Discussion
Potential Project Recommendation Areas:
• Address vacant storefronts
• Outdoor Dining Enhancements
• Additional pop-ups/outdoor events
• Enhanced marketing/branding/wayfinding efforts
Feedback on current city efforts
Next Steps
• Assess feedback
• Finalize project recommendations
• Public meeting in the fall


