103
Copyright © Carrier Corp. 2005 COMMERCIAL HVAC APPLICATIONS Life Cycle Costing for HVAC Systems PRESENTED BY: Colby Fischer Technical Development Program
Copyright © Carrier Corp. 2005
COMMERCIAL HVAC APPLICATIONS
Life Cycle Costingfor HVAC Systems
PRESENTED BY:
Colby Fischer
Technical Development Program
Copyright © Carrier Corp. 2006
Objectives1. Understand why Life Cycle Cost studies are often required and
valuable2. Gain new perspective on the difference/importance of energy
modeling vs equipment ratings3. Understand the time value of money and its role in life cycle
costing4. Learn about various analysis tools available and the basic
differences between them

Copyright © Carrier Corp. 2006
Section 1 Introduction
Section 3 Energy Modeling & Equipment Ratings
Section 2 Procedure
Menu
Section 4 Summary
Break

Copyright © Carrier Corp. 2006
SECTION 1
Introduction
LIFE CYCLE COSTINGFOR HVAC SYSTEMS
Copyright © Carrier Corp. 2006
Life Cycle Cost Analysis (LCC) -An economic technique used to compare variousdesign alternatives by projecting (discounting orcompounding) all initial and incremental associatedcosts over the economic life of the project, (also calledthe "Life Cycle Period"), to a common period of time.
Life Cycle Costing

Copyright © Carrier Corp. 2006
Life Cycle
Cost
True CostsALL THE COSTS OVER THE LIFE OF THE SYSTEM

Copyright © Carrier Corp. 2006
Time Value of Money
Discounting ò$$$$$$$$$$$
$$$$$$$$$
$$$$$$$$
$$$$$
$$$$
$$$
$$
$$$$$$$
$$$$$$ $
101 2 3 6 7 8 94 5
Copyright © Carrier Corp. 2006
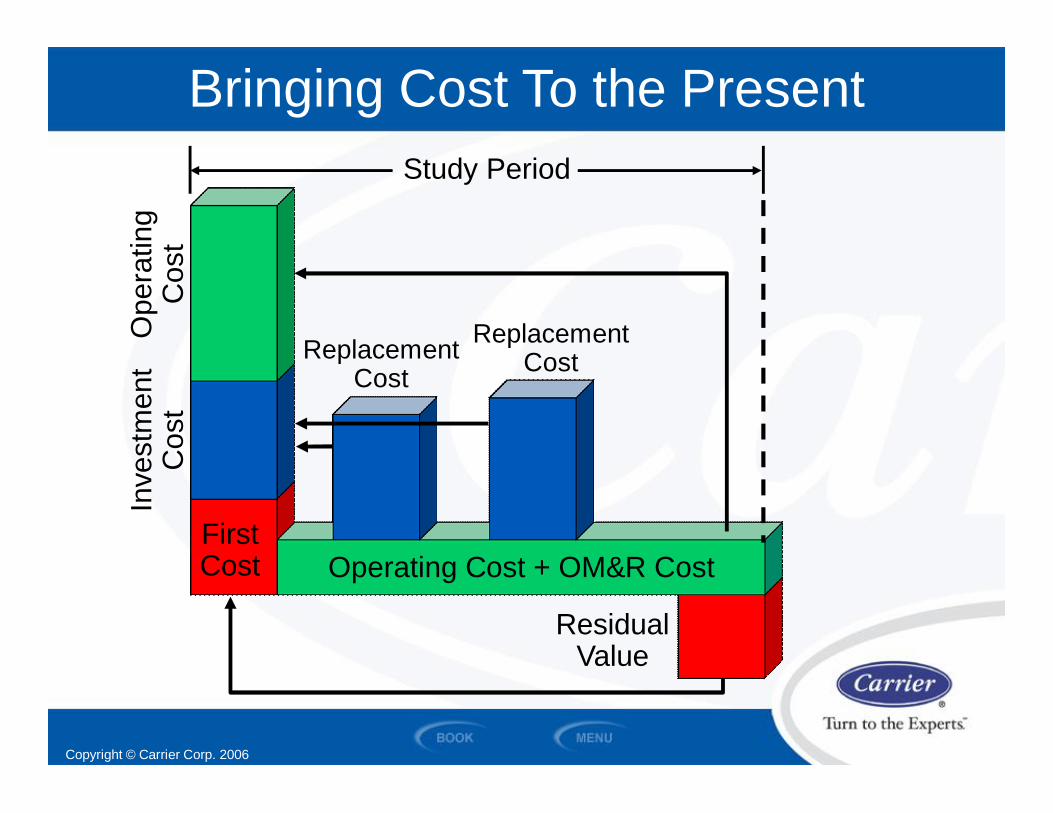
Bringing Cost To the PresentIn
vest
men
tC
ost
Ope
ratin
gC
ost
FirstCost Operating Cost + OM&R Cost
ReplacementCost
ReplacementCost
ResidualValue
Study Period
Copyright © Carrier Corp. 2006
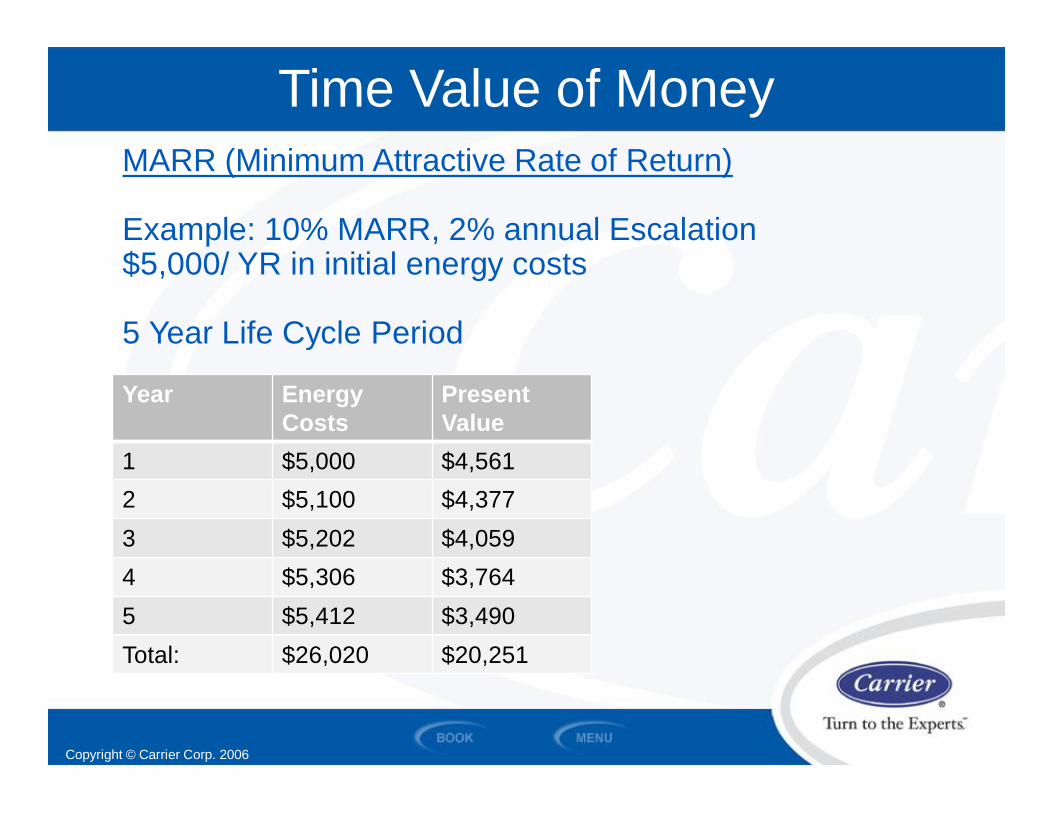
Time Value of MoneyMARR (Minimum Attractive Rate of Return)
Example: 10% MARR, 2% annual Escalation$5,000/ YR in initial energy costs
5 Year Life Cycle Period
Year EnergyCosts
PresentValue
1 $5,000 $4,5612 $5,100 $4,3773 $5,202 $4,0594 $5,306 $3,7645 $5,412 $3,490Total: $26,020 $20,251

Copyright © Carrier Corp. 2006
Life Cycle Cost of SystemsTwo Approaches:
• Compare to the base• Difference from the base
System 1 2 3 4
Energy
Operating,Maintenance& Repair
First Cost
$

Copyright © Carrier Corp. 2006
Life Cycle StudiesKey Points:• Used as comparative
technique
• Does not determineabsolute costs in thefuture
• Not all costs need to beincluded
Copyright © Carrier Corp. 2006
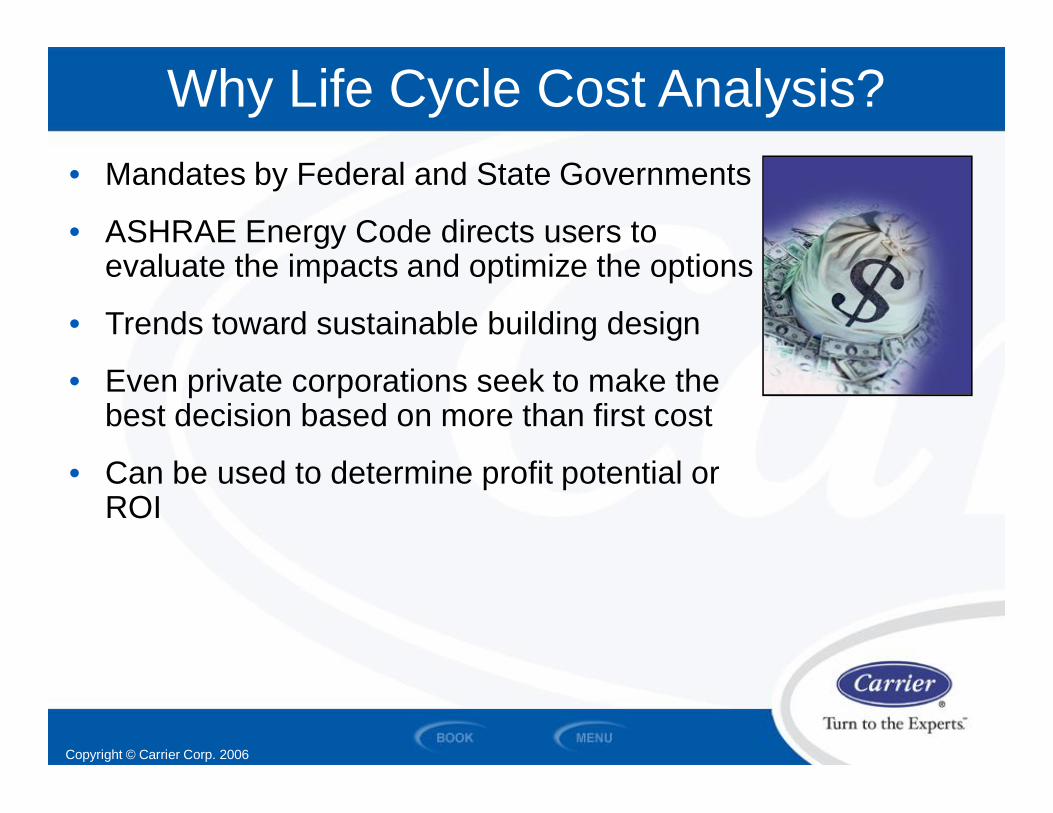
Why Life Cycle Cost Analysis?• Mandates by Federal and State Governments
• ASHRAE Energy Code directs users toevaluate the impacts and optimize the options
• Trends toward sustainable building design
• Even private corporations seek to make thebest decision based on more than first cost
• Can be used to determine profit potential orROI

Copyright © Carrier Corp. 2006
Why Life Cycle Cost Analysis?• The building market today view buildings as
profit potential– NOI - Net Operating Income = Rents – all costs to operate the
building (vacancy, operation, energy, taxes)
– NOI influences building value
• Most of all: A tool to demonstrate value
Copyright © Carrier Corp. 2006
SECTION 2
Procedure
LIFE CYCLE COSTINGFOR HVAC SYSTEMS

Copyright © Carrier Corp. 2006
Life Cycle Cost Analysis Steps
Section 2 – Life Cycle Costing Procedure
• Define the project (goal)• Determine Analysis Method• Determine Life Cycle Period• Collect Data• Analyze• Recommendation

Copyright © Carrier Corp. 2006
Define the Project
• What is the goal?Describe the project– New construction, renovation, repair
Determine the design goals– Comfort, occupancy, energy sources,cost, etc.
• What are the alternatives?Different types of systems?Different types of efficiency tiers?Repair or replace?
List all the feasible alternativesSection 2 – Life Cycle Costing Procedure

Copyright © Carrier Corp. 2006
Determining the Life Cycle
• The first big step =– Not too long– Not too short– Just right
Consider:– How long will the owner keep the asset?– What study periods are required by owners?– What is the life of the investment?– Do alternatives have different life cycles?
Copyright © Carrier Corp. 2006
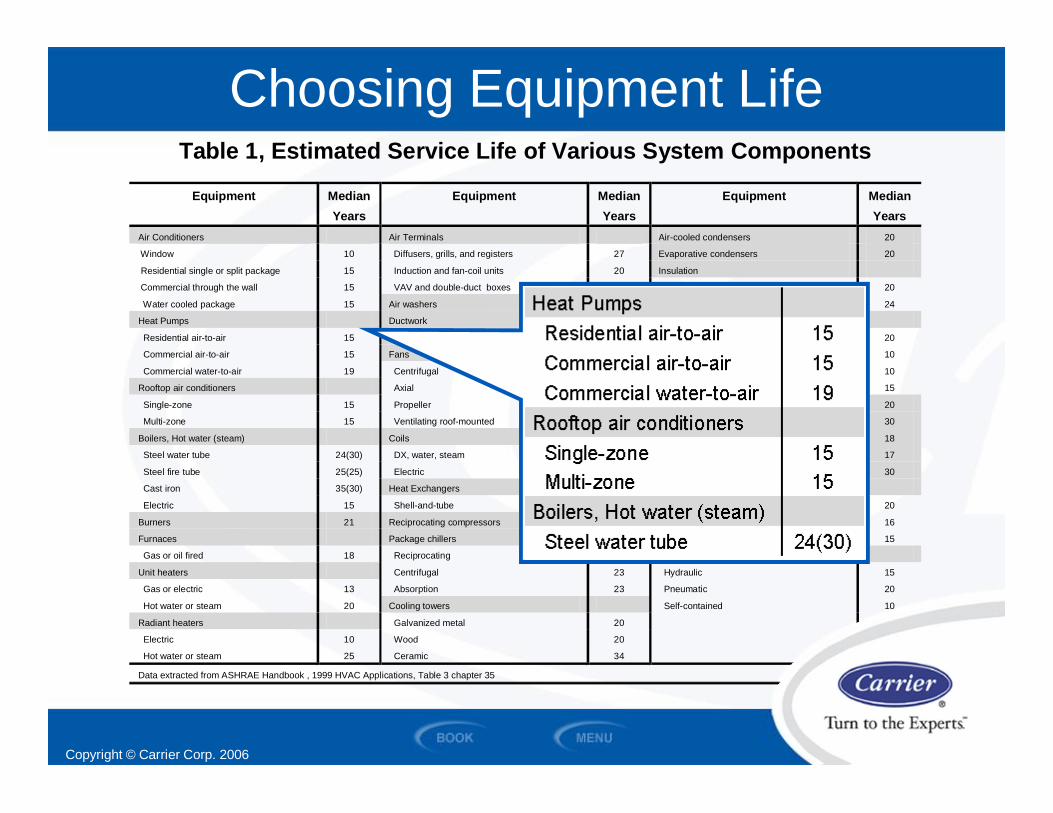
Choosing Equipment LifeTable 1, Estimated Service Life of Various System Components
Equipment MedianYears
Equipment MedianYears
Equipment MedianYears
Air Conditioners Air Terminals Air-cooled condensers 20
Window 10 Diffusers, grills, and registers 27 Evaporative condensers 20
Residential single or split package 15 Induction and fan-coil units 20 Insulation
Commercial through the wall 15 VAV and double-duct boxes 20 Molded 20
Water cooled package 15 Air washers 17 Blanket 24
Heat Pumps Ductwork 30 Pumps
Residential air-to-air 15 Dampers 20 Base-mounded 20
Commercial air-to-air 15 Fans Pipe-mounted 10
Commercial water-to-air 19 Centrifugal 25 Sump and well 10
Rooftop air conditioners Axial 20 Condensate 15
Single-zone 15 Propeller 15 Reciprocating engines 20
Multi-zone 15 Ventilating roof-mounted 20 Steam turbines 30
Boilers, Hot water (steam) Coils Electric motors 18
Steel water tube 24(30) DX, water, steam 20 Motor starters 17
Steel fire tube 25(25) Electric 15 Electric transformers 30
Cast iron 35(30) Heat Exchangers Controls
Electric 15 Shell-and-tube 24 Pneumatic 20
Burners 21 Reciprocating compressors 20 Electric 16
Furnaces Package chillers Electronic 15
Gas or oil fired 18 Reciprocating 20 Valve actuators
Unit heaters Centrifugal 23 Hydraulic 15
Gas or electric 13 Absorption 23 Pneumatic 20
Hot water or steam 20 Cooling towers Self-contained 10
Radiant heaters Galvanized metal 20
Electric 10 Wood 20
Hot water or steam 25 Ceramic 34
Data extracted from ASHRAE Handbook , 1999 HVAC Applications, Table 3 chapter 35

Copyright © Carrier Corp. 2006
Determine Analysis Method
Factors:
• Income Based or Cost Based?
• Private or Public Sector?
• Level of Analysis Needed?
Section 2 – Life Cycle Costing Procedure

Copyright © Carrier Corp. 2006
Income vs. Cost Based Analysis
Income based• How much will the asset grow over time• Best choice is highest present value
– Savings for the future is an example
Cost based• Looking at all the costs associated with a
asset choice, at a common period of time• Lowest overall cost is best choice
– Most HVAC decisions are cost based

Copyright © Carrier Corp. 2006
Public vs. Private Analysis
Public sector analysis• Money raised through taxes or bonds• Tax impacts not included• Government agencies set rates
Private sector Analysis• Money is borrowed and competes
with other alternatives• Tax impacts included if required• Borrowing rates and MARR set rates
Government Building
Office Building
Copyright © Carrier Corp. 2006
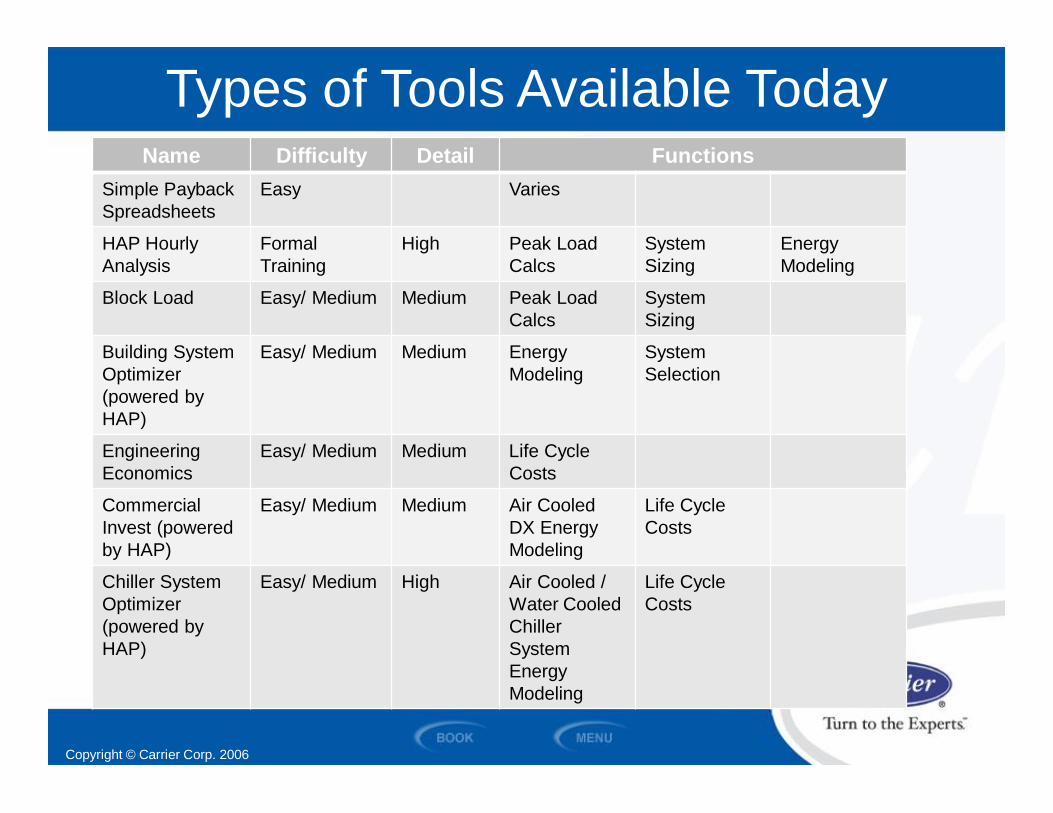
Types of Tools Available TodayName Difficulty Detail Functions
Simple PaybackSpreadsheets
Easy Varies
HAP HourlyAnalysis
FormalTraining
High Peak LoadCalcs
SystemSizing
EnergyModeling
Block Load Easy/ Medium Medium Peak LoadCalcs
SystemSizing
Building SystemOptimizer(powered byHAP)
Easy/ Medium Medium EnergyModeling
SystemSelection
EngineeringEconomics
Easy/ Medium Medium Life CycleCosts
CommercialInvest (poweredby HAP)
Easy/ Medium Medium Air CooledDX EnergyModeling
Life CycleCosts
Chiller SystemOptimizer(powered byHAP)
Easy/ Medium High Air Cooled /Water CooledChillerSystemEnergyModeling
Life CycleCosts

Copyright © Carrier Corp. 2006
Effort
Select the right tools• Pick a level and method that fit the goal
Example: A 10 hp motor for an AHUUse a standard 80% efficiencyor a high efficiency 95% that costs $100.00 moreMotor operates 1800 hr/year at $0.10/ kWWhich should you select?
Operating hours with simple paybackLCC Analysis
How Detailed a Study is required?
• Only include cost items that aresignificant and different
Section 2 – Life Cycle Costing Procedure
Copyright © Carrier Corp. 2006
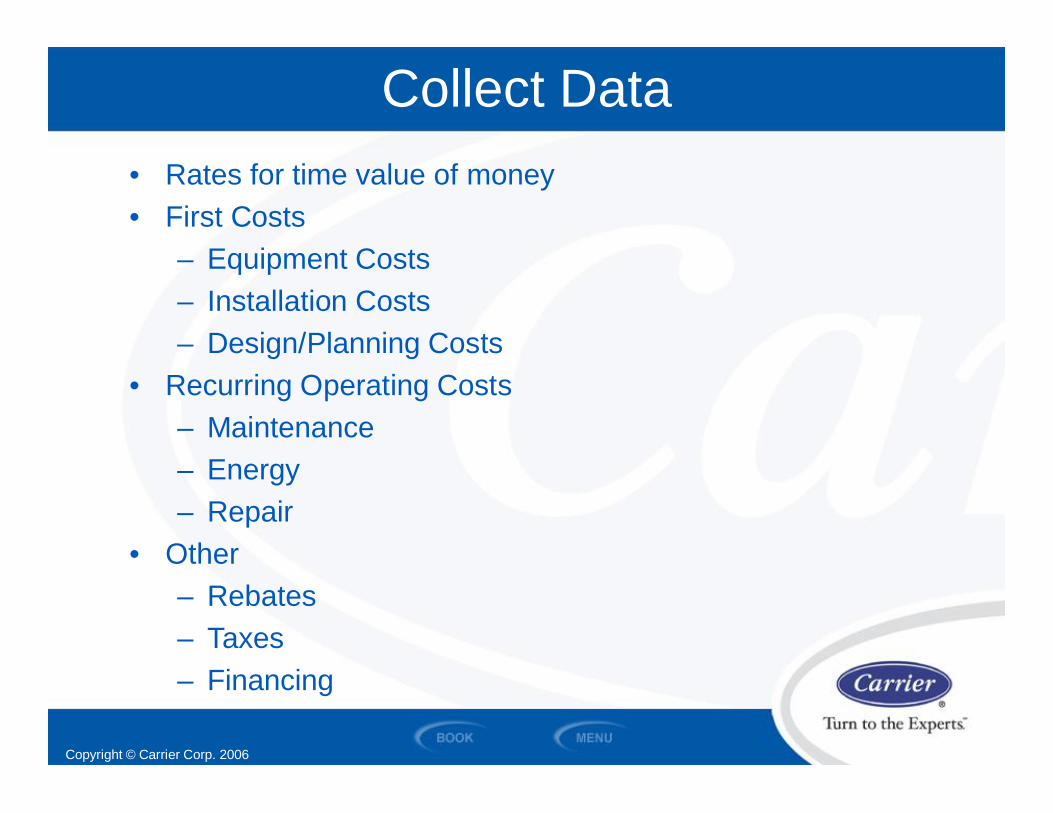
Collect Data• Rates for time value of money• First Costs
– Equipment Costs– Installation Costs– Design/Planning Costs
• Recurring Operating Costs– Maintenance– Energy– Repair
• Other– Rebates– Taxes– Financing

Copyright © Carrier Corp. 2006
Discount Rate
Rate depends on: Public• Set Rates OMB• Bonding Rate• Financing Method
Private• MARR• Profit objectives• Tax Impacts• Risk• Financing Method
• Use a realistic rate If not sure – ASK! A wrong rate will discredit the study
• Account for inflation if it may influence the outcome
• Use the same rate for all alternatives UNLESS there is agood reason to do otherwise
DiscountingCompounding

Copyright © Carrier Corp. 2006
Minimum Attractive Rate of Return (MARR)• Owners typically make capital budgeting decisions
based on a fixed amount of available capital
• This fixed amount of available capital is competedfor by various alternative investments
• The building owner must decide the MARR for anyproposed capital expenditure
• Proposals which meet or exceed this minimumrequired return are deemed acceptable
• Rate may change depending on sensitivity and risk
• Required MARR may be set as is typicalwith government projects
Discount Rate
Copyright © Carrier Corp. 2006
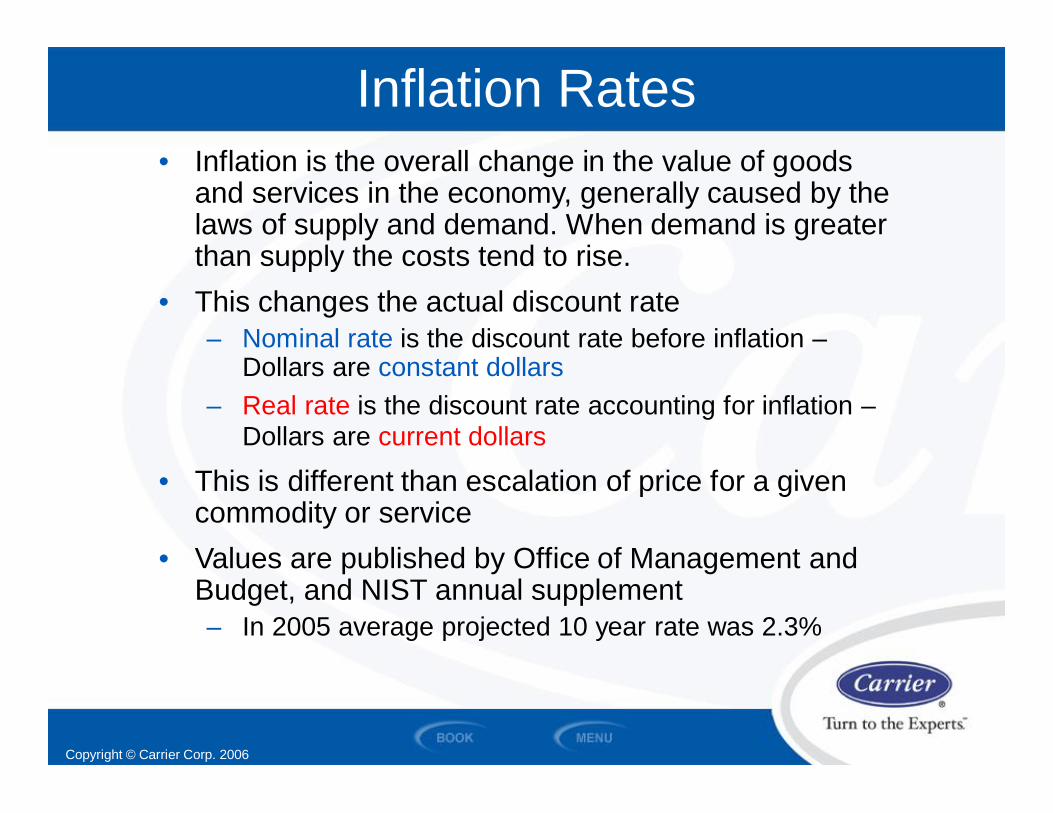
• Inflation is the overall change in the value of goodsand services in the economy, generally caused by thelaws of supply and demand. When demand is greaterthan supply the costs tend to rise.
• This changes the actual discount rate– Nominal rate is the discount rate before inflation –
Dollars are constant dollars– Real rate is the discount rate accounting for inflation –
Dollars are current dollars
• This is different than escalation of price for a givencommodity or service
• Values are published by Office of Management andBudget, and NIST annual supplement– In 2005 average projected 10 year rate was 2.3%
Inflation Rates

Copyright © Carrier Corp. 2006
• Escalation Rate (e)– Increase in the price of goods
and services over time– A difficult decision because
we are predicting the future– Use historical values and government
guideline - if they make sense
• Typical escalation rates– Electricity 1.5 to 2.5 %/ year– Natural gas 3.0 to 4.0 %/ year– Service Labor 1.0 to 2 .0 %/ year
Cost Escalation
Copyright © Carrier Corp. 2006
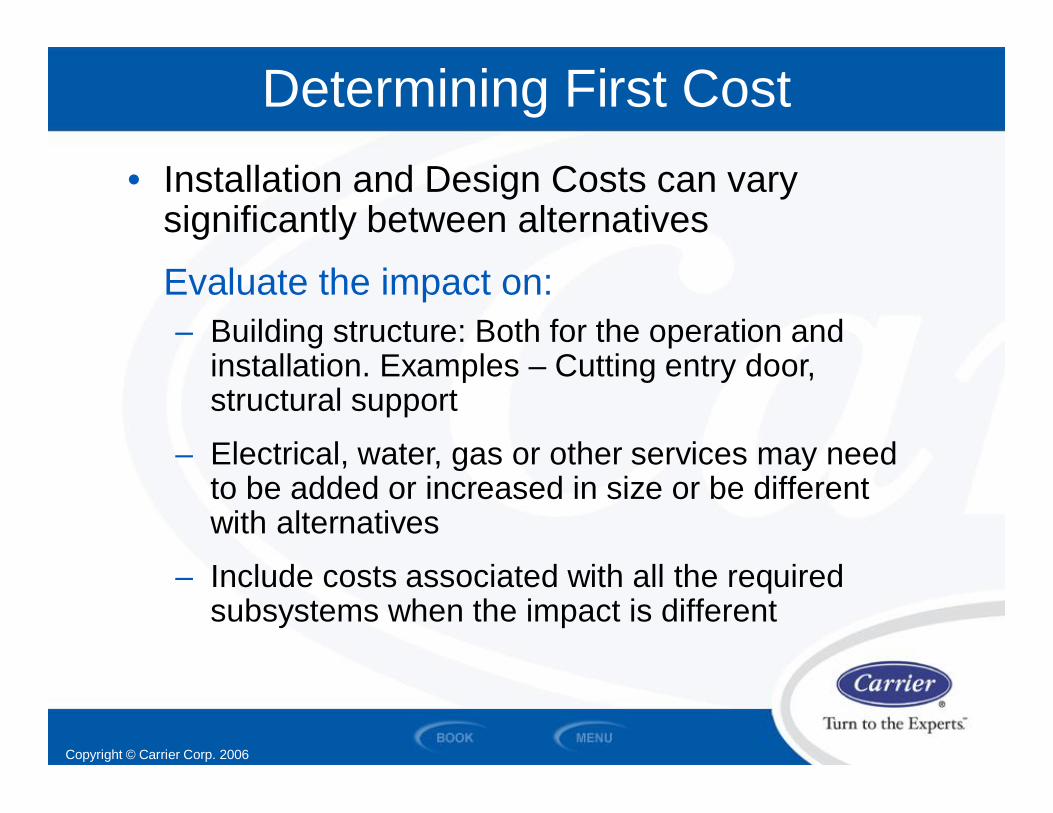
• Installation and Design Costs can varysignificantly between alternatives
Evaluate the impact on:– Building structure: Both for the operation and
installation. Examples – Cutting entry door,structural support
– Electrical, water, gas or other services may needto be added or increased in size or be differentwith alternatives
– Include costs associated with all the requiredsubsystems when the impact is different
Determining First Cost

Copyright © Carrier Corp. 2006
• Differences in types & amount of installation labor
• Include all the miscellaneous supplies to theextent they impact the analysis.Don’t forget:– Pipe– Wire– Structural support– Hardware– Expendable supplies
• Remember if it is significant enough to influencethe decision be sure to include it
…every job situation may be different
Determining First Cost

Copyright © Carrier Corp. 2006
• Energy Rates– Electricity– Gas– Other Utilities
• Oil, steam, water• Type of Rates
– Time of Use– Tiered– Demand Charges– Flat
Determining Operating Costs

Copyright © Carrier Corp. 2006
Building Load & Operating Hours
Climate Index• Annual hours spent at different temperatures and wet-
bulbs for project location
Operating Hours• Of each tenant
Copyright © Carrier Corp. 2006
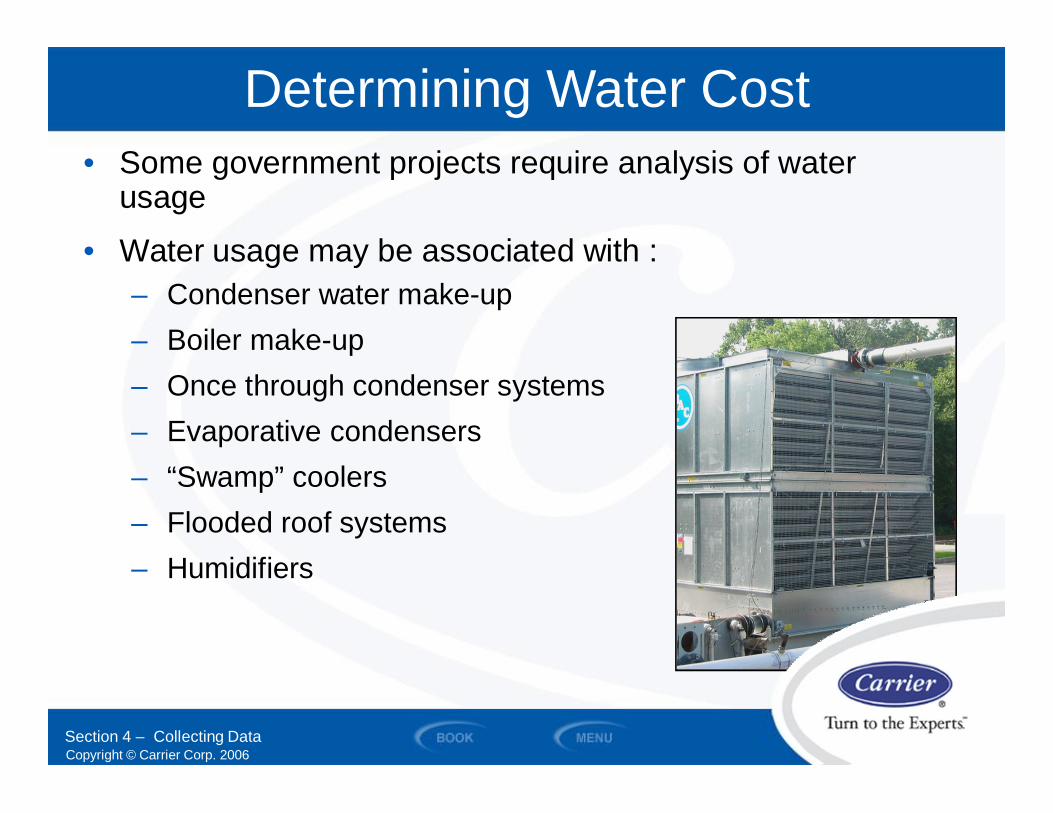
• Some government projects require analysis of waterusage
• Water usage may be associated with :– Condenser water make-up– Boiler make-up– Once through condenser systems– Evaporative condensers– “Swamp” coolers– Flooded roof systems– Humidifiers
Section 4 – Collecting Data
Determining Water Cost
Copyright © Carrier Corp. 2006
• Charges are normally based on gallons or cubic feet used
• Charges for Water may be in several way– Single flat rate– Step scale based on volume– Base rate and a step sale
• When charges are a step scale it is necessary to estimatetotal building usage for other items (bathroom, kitchen orprocess requirements) to determine realistic cost impacts
• Sewer charges may be included as a function of water usage
Determining Water

Copyright © Carrier Corp. 2006
• Operating Expense– Operating labor or services
• Maintenance Expense– Servicing, expendable supplies
• Repair Costs
Determining Operating Costs
Copyright © Carrier Corp. 2006
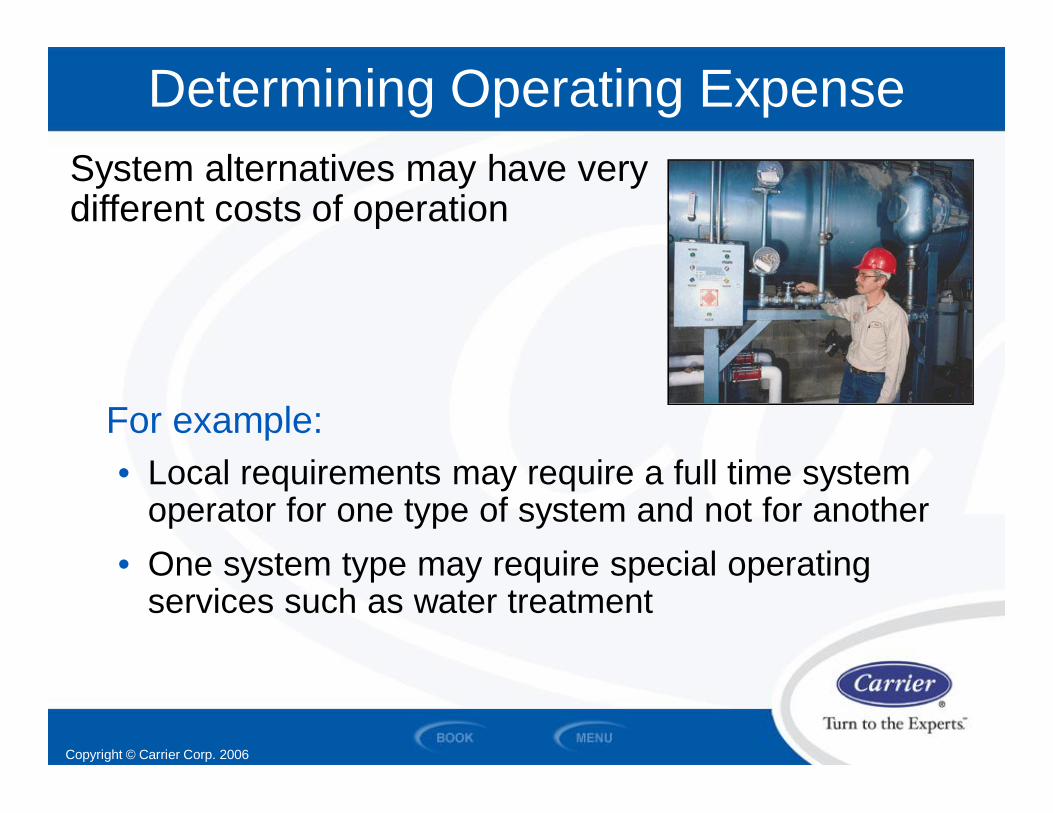
System alternatives may have verydifferent costs of operation
For example:• Local requirements may require a full time system
operator for one type of system and not for another• One system type may require special operating
services such as water treatment
Determining Operating Expense

Copyright © Carrier Corp. 2006
– Filter changing requirements may be differentfor different alternatives and may have bothmaterial and labor implications
• All systems requiresome amount ofregular maintenancewhich should beaccounted for in theanalysis
Maintenance Expense

Copyright © Carrier Corp. 2006
• Repair type service contracts such asextended warranties may be included inthis category
• Alternatives may have different levels ofreliability and different types of repairpossibilities
• Repair vs Replace Analysis
Repair Costs

Copyright © Carrier Corp. 2006
Collecting data
Other Considerations

Copyright © Carrier Corp. 2006
Utility companies sometimes offer an incentivefor systems which help reduce their costs eitherby being more efficient or shifting and levelloading the demand. Incentives are normally afinancial credit provided for:• Installing equipment that is more efficient
• Limiting demand at the utilities option
• Switching to an alternate fuel source
• Using some form of storage to shiftdemand to off-hours times
Utility Rebates

Copyright © Carrier Corp. 2006
• To help promote the use of alternative energy sources andimproved energy efficiency products, government agenciesmay offer a tax incentive or credit to help defray a part of theadditional first cost
• When evaluating high efficiency and alternative energyproducts, which will usually have higher costs, with moreconventional project alternatives including the impact ofthese credits in the analysis may influencethe economic decision
• Both Federal and State governments have energy tax credits
Tax Incentives
Copyright © Carrier Corp. 2006
• Residual or salvage value can be based on:– Value in place at the end of the life cycle– Book value based on the allowed deprecation– Resale value– Scrap value
• It should be adjusted for any costs involved:– For selling expenses– For any required conversion or disposal costs– When refrigerant containing decisions are
made disposal cost may be significant
Finding Residual Value

Copyright © Carrier Corp. 2006
As a rule of thumb:• One quick method of setting a value is to prorate the
initial cost
• For example a $10,000 unit with a 20 year life at theend of 15 years would be:$10,000 ÷ 20 = $500/year$500/year * 5 years left = $2,500 residual value
• Another method is to assume double decliningdepreciation for the IRS allowed years and then use thebook value at the end of the study period
Finding Residual Value
Copyright © Carrier Corp. 2006
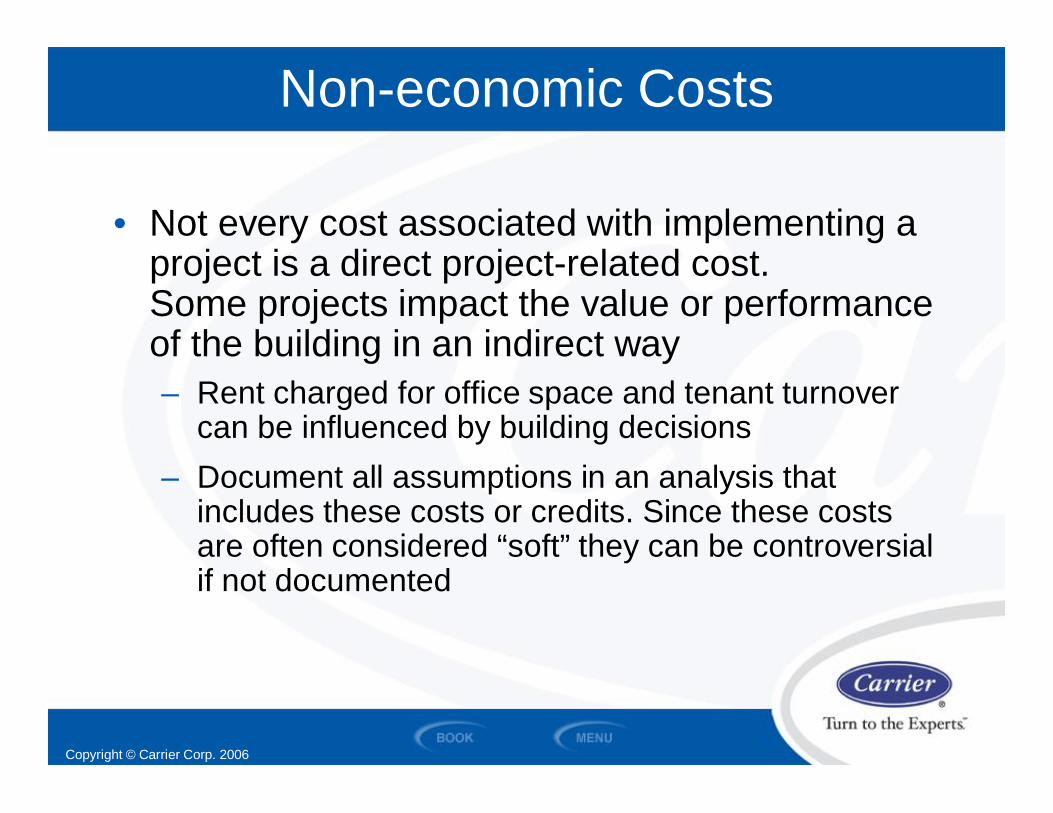
• Not every cost associated with implementing aproject is a direct project-related cost.Some projects impact the value or performanceof the building in an indirect way– Rent charged for office space and tenant turnover
can be influenced by building decisions– Document all assumptions in an analysis that
includes these costs or credits. Since these costsare often considered “soft” they can be controversialif not documented
Non-economic Costs

Copyright © Carrier Corp. 2006
• Typical impacts to consider:– Comfort impacts– Acoustics– Safety– Security– Flexibility– Environmental impacts– Productivity improvements– Ability to demand higher rents– Building having a higher resale value
• This is an area of continuing study - small improvementsin areas like productivity can result in very large savings.More on this at the end of this program.
Non-economic Costs
Copyright © Carrier Corp. 2006
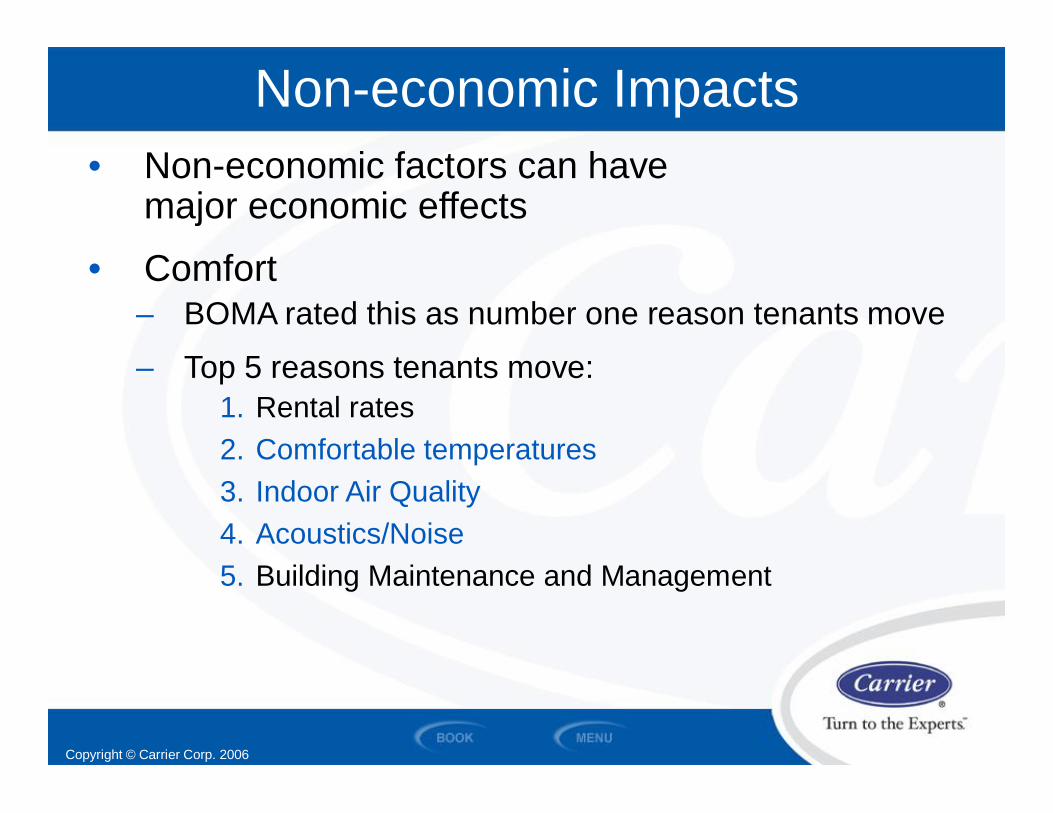
• Non-economic factors can havemajor economic effects
• Comfort– BOMA rated this as number one reason tenants move
– Top 5 reasons tenants move:1. Rental rates2. Comfortable temperatures3. Indoor Air Quality4. Acoustics/Noise5. Building Maintenance and Management
Non-economic Impacts

Copyright © Carrier Corp. 2006
Life Cycle Cost of SystemsTwo Approaches:
• Compare to the base• Difference from the base
System 1 2 3 4
Energy
Operating,Maintenance& Repair
First Cost
$
Copyright © Carrier Corp. 2006
• Acceptance or rejection of one alternative
• Optimize a design, efficiency, componentor system
• Determine the optimum system betweenmultiple alternatives
• Determine the optimum combination ofindependent systems
• Rank the order of independent optionsto maximize funding
Economic Evaluation Criteria

Copyright © Carrier Corp. 2006
SECTION 3
Energy Modeling & Equipment EfficencyRatings
LIFE CYCLE COSTINGFOR HVAC SYSTEMS
Copyright © Carrier Corp. 2006
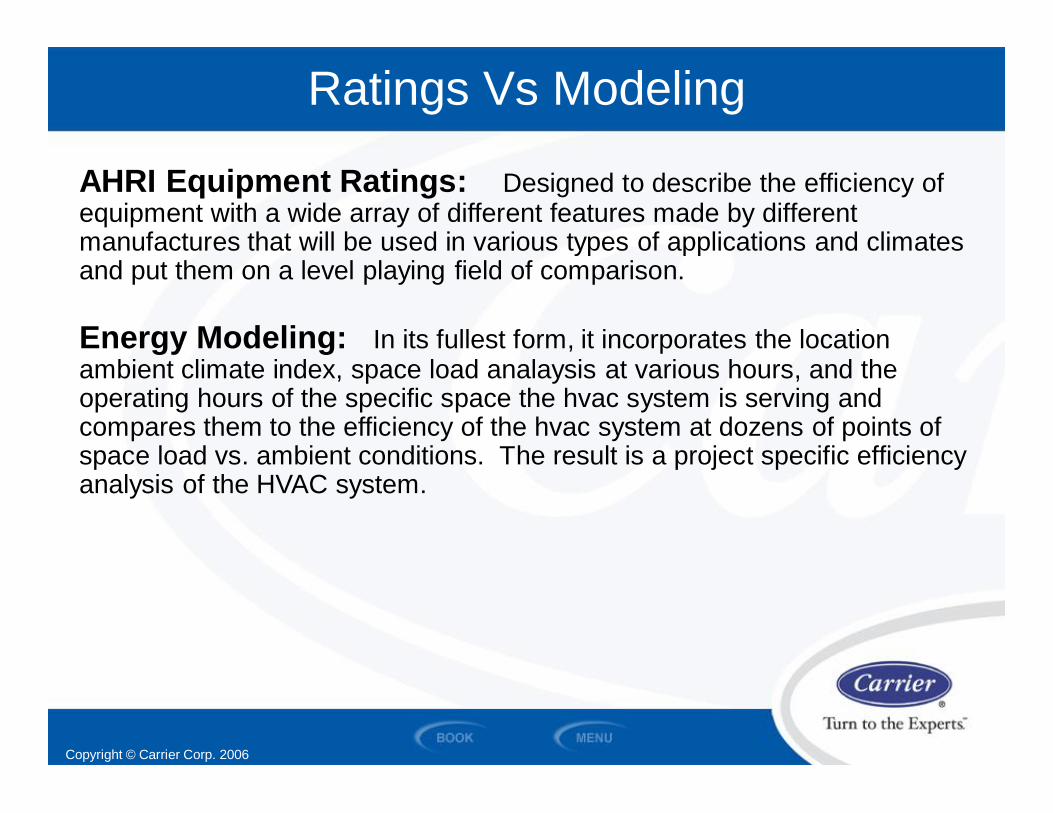
AHRI Equipment Ratings: Designed to describe the efficiency ofequipment with a wide array of different features made by differentmanufactures that will be used in various types of applications and climatesand put them on a level playing field of comparison.
Energy Modeling: In its fullest form, it incorporates the locationambient climate index, space load analaysis at various hours, and theoperating hours of the specific space the hvac system is serving andcompares them to the efficiency of the hvac system at dozens of points ofspace load vs. ambient conditions. The result is a project specific efficiencyanalysis of the HVAC system.
Ratings Vs Modeling
Copyright © Carrier Corp. 2006
Air Cooled DX System RatingsEER – Energy Efficiency Ratio
SEER – Seasonal Energy Efficiency Ratio (5 Tons and Under)IEER – Integrated Energy Efficiency Ratio (6 Tons and Up)
Copyright © Carrier Corp. 2006
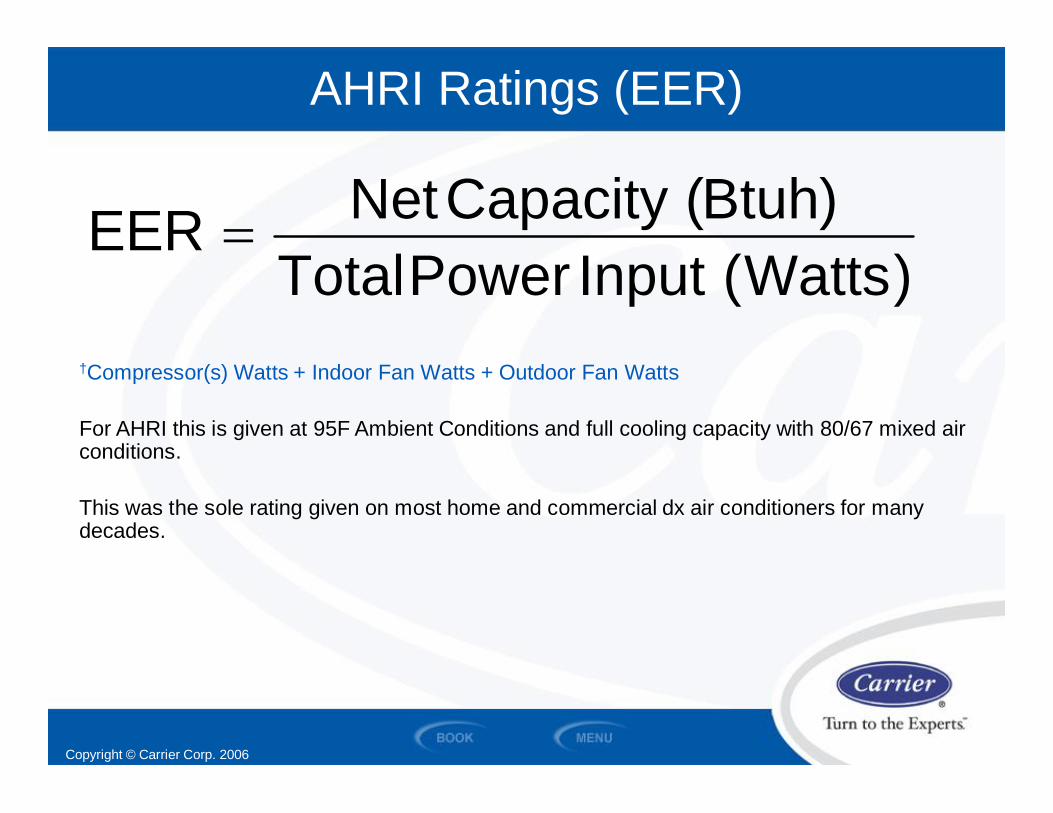
†Compressor(s) Watts + Indoor Fan Watts + Outdoor Fan Watts
For AHRI this is given at 95F Ambient Conditions and full cooling capacity with 80/67 mixed airconditions.
This was the sole rating given on most home and commercial dx air conditioners for manydecades.
AHRI Ratings (EER)
)Watts(InputPowerTotal)Btuh(CapacityNetEER =
Copyright © Carrier Corp. 2006
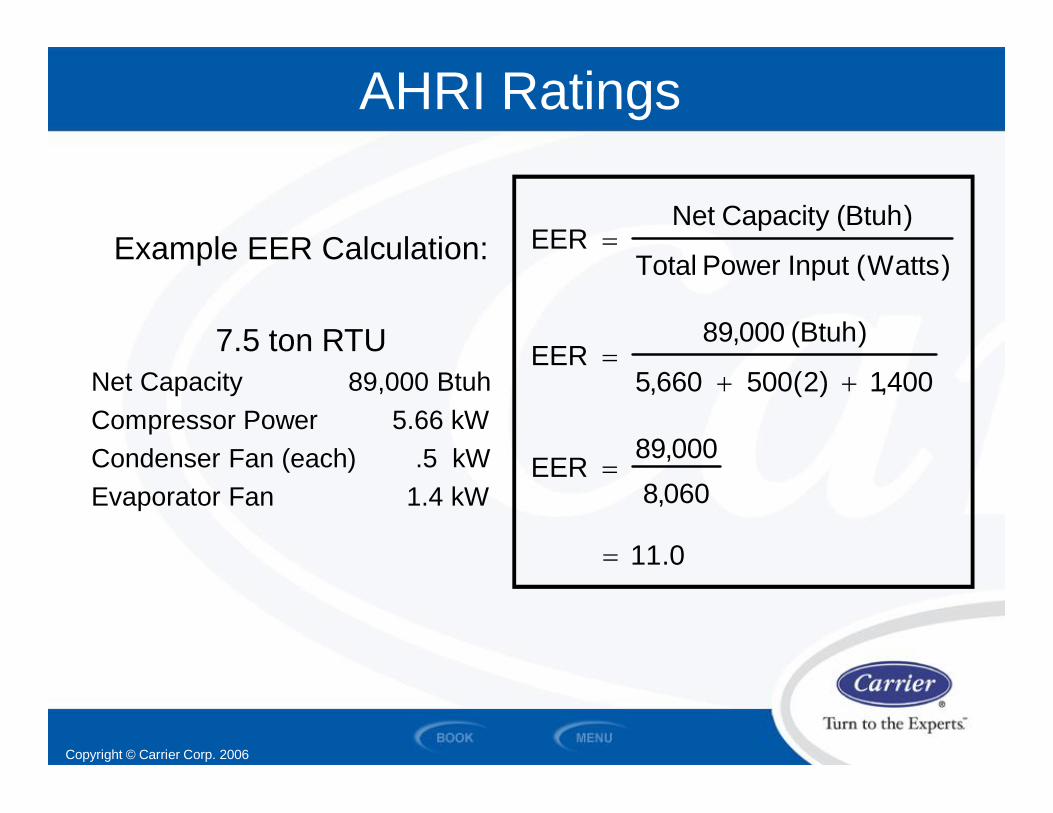
AHRI Ratings
0.11
060,8000,89
EER
400,1)2(500660,5
)Btuh(000,89EER
)Watts(InputPowerTotal
)Btuh(CapacityNetEER
=
=
++=
=Example EER Calculation:
7.5 ton RTUNet Capacity 89,000 BtuhCompressor Power 5.66 kWCondenser Fan (each) .5 kWEvaporator Fan 1.4 kW
Copyright © Carrier Corp. 2006
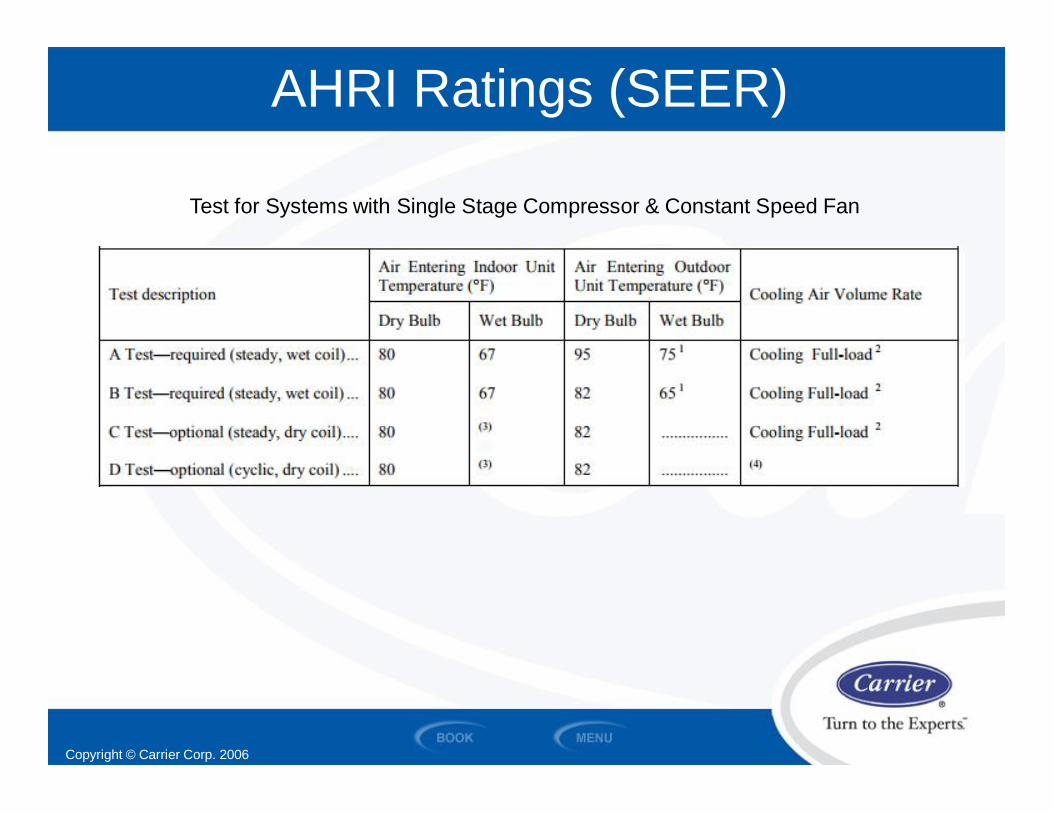
AHRI Ratings (SEER)
Test for Systems with Single Stage Compressor & Constant Speed Fan
Copyright © Carrier Corp. 2006
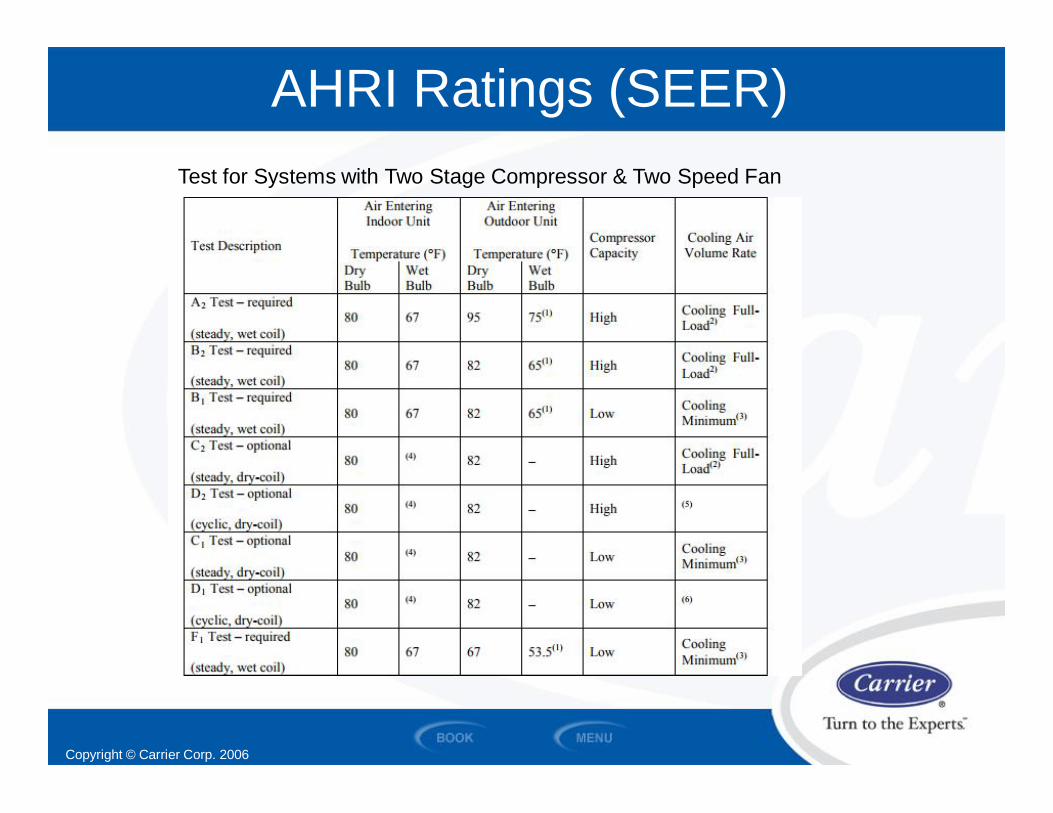
AHRI Ratings (SEER)Test for Systems with Two Stage Compressor & Two Speed Fan

Copyright © Carrier Corp. 2006
AHRI Ratings (SEER)Test for Systems with Variable Speed Compressor & Multi-Speed Fan

Copyright © Carrier Corp. 2006
AHRI Ratings (SEER)Calculated SEER rating:
Based on the laboratory tests required in the previousslides (depending on compressor & fan type)
The 3-6 test points are weighted based on averagehouse hold conditions in the median U.S. Climate.
Copyright © Carrier Corp. 2006
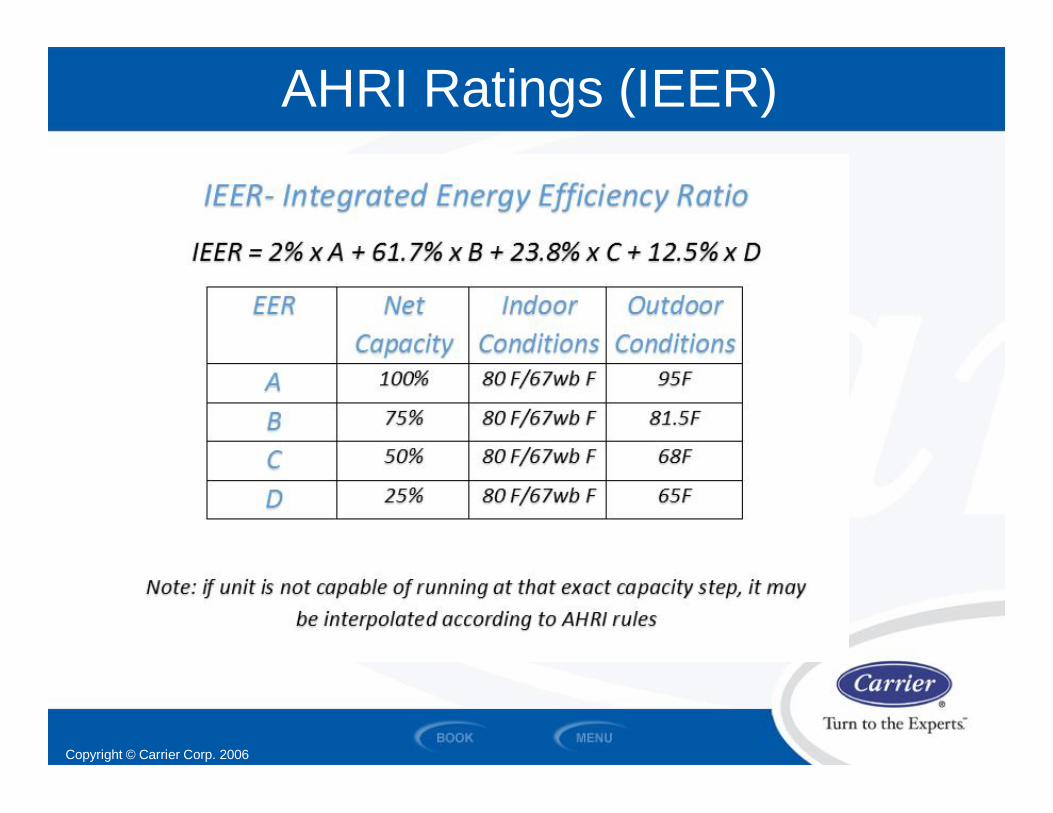
AHRI Ratings (IEER)

Copyright © Carrier Corp. 2006
Air Cooled DX System Energy Modeling

Copyright © Carrier Corp. 2006
Air Cooled Dx Offering Tiers
Section 5 – Rating and Efficiency Terms

Copyright © Carrier Corp. 2006
Payback Factors of Higher Tier Equipment
Section 5 – Rating and Efficiency Terms
• Climate• Building Load Profile & Operating Hours
– Building Design / Direction Facing– Occupancy Type
• Office• School• Church• Warehouse/Storage• Retail• Medical
• Unit Efficiency & Staging Capabilities• Electricity / Gas Rates & Demand Charges

Copyright © Carrier Corp. 2006
Air Cooled Dx Climate Zones
Section 5 – Rating and Efficiency Terms

Copyright © Carrier Corp. 2006
Air Cooled Dx Climate Zones
Section 5 – Rating and Efficiency Terms
Copyright © Carrier Corp. 2006
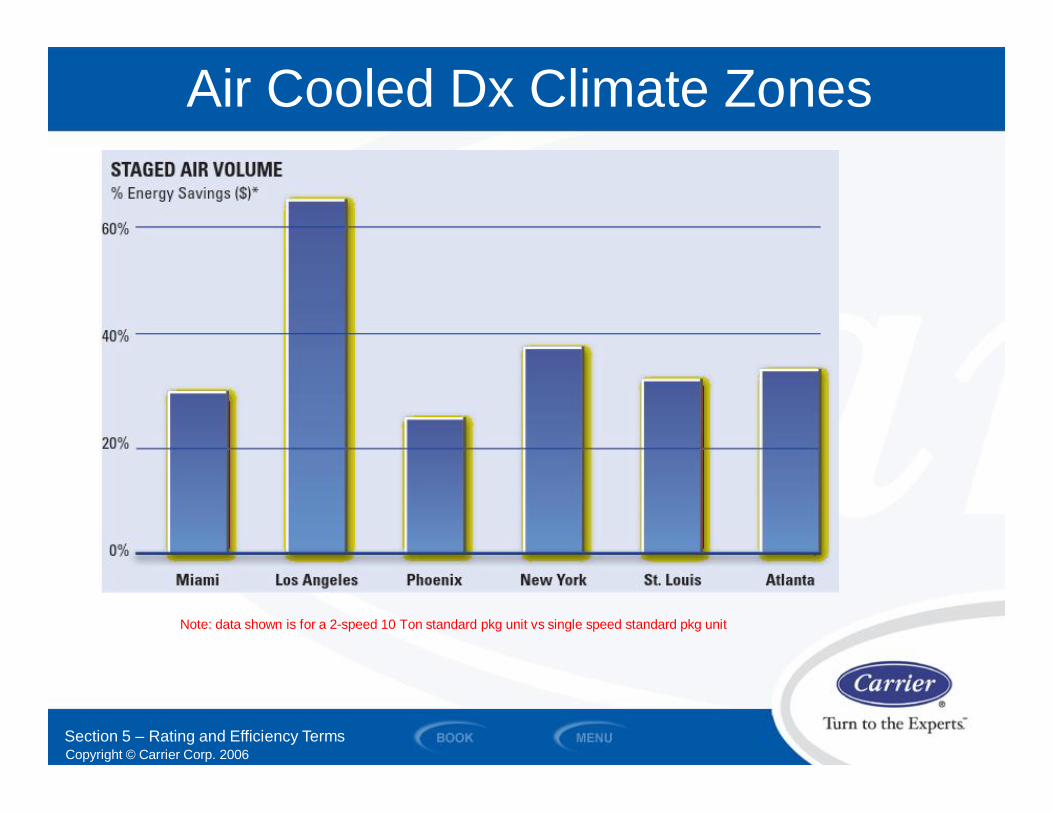
Air Cooled Dx Climate Zones
Section 5 – Rating and Efficiency Terms
Note: data shown is for a 2-speed 10 Ton standard pkg unit vs single speed standard pkg unit
Copyright © Carrier Corp. 2006
Scenarios
Section 5 – Rating and Efficiency Terms
This scenario was generated with Carrier CommercialInvest Software. A software program powered by the HAP(Hourly Analysis Program) that calculates energy use of AirCooled Dx Systems by modeling building & equipmentloads while accounting for equipment fan & stagingcapability.
Copyright © Carrier Corp. 2006
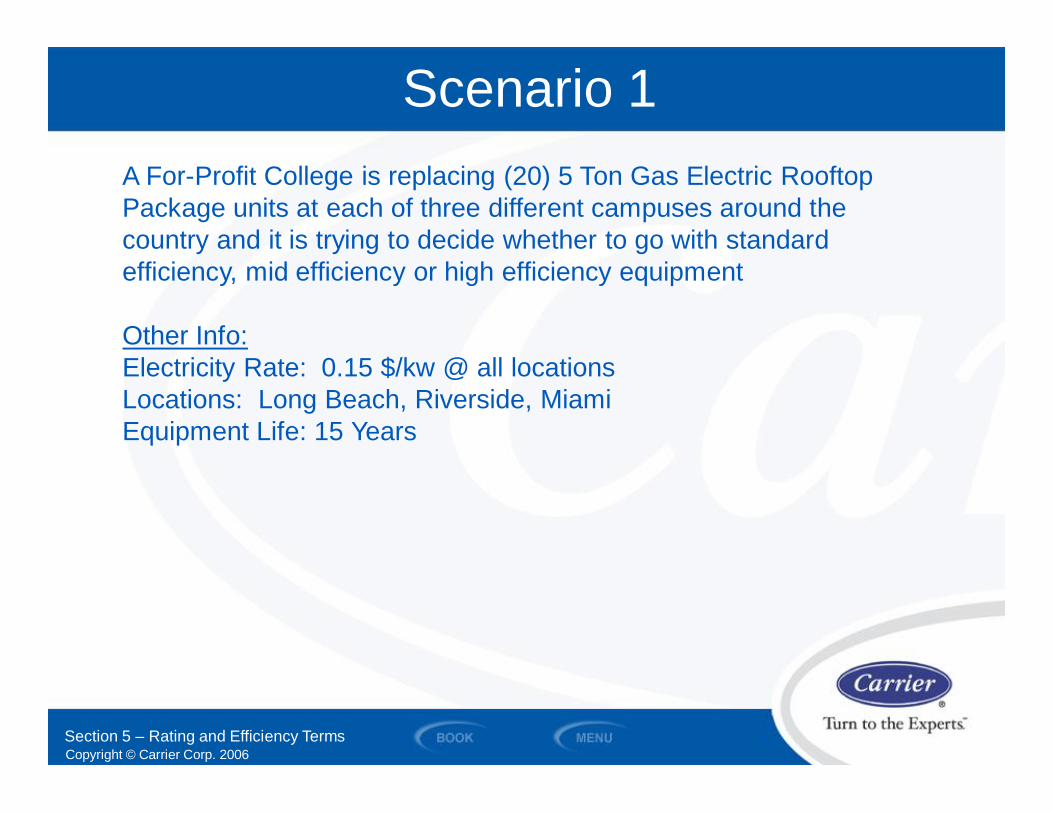
Scenario 1
Section 5 – Rating and Efficiency Terms
A For-Profit College is replacing (20) 5 Ton Gas Electric RooftopPackage units at each of three different campuses around thecountry and it is trying to decide whether to go with standardefficiency, mid efficiency or high efficiency equipment
Other Info:Electricity Rate: 0.15 $/kw @ all locationsLocations: Long Beach, Riverside, MiamiEquipment Life: 15 Years

Copyright © Carrier Corp. 2006
Scenario 1
Section 5 – Rating and Efficiency Terms
Tier Std Mid HighCompressor Stgs 1 1 2
Fan Speeds 1 1 3EER 12 12.5 12.7
SEER 14.1 15.2 17.2Economizer Yes Yes Yes
Installed Cost $180,000 $192,000 $212,000Difference - $12,000 $32,000
Copyright © Carrier Corp. 2006
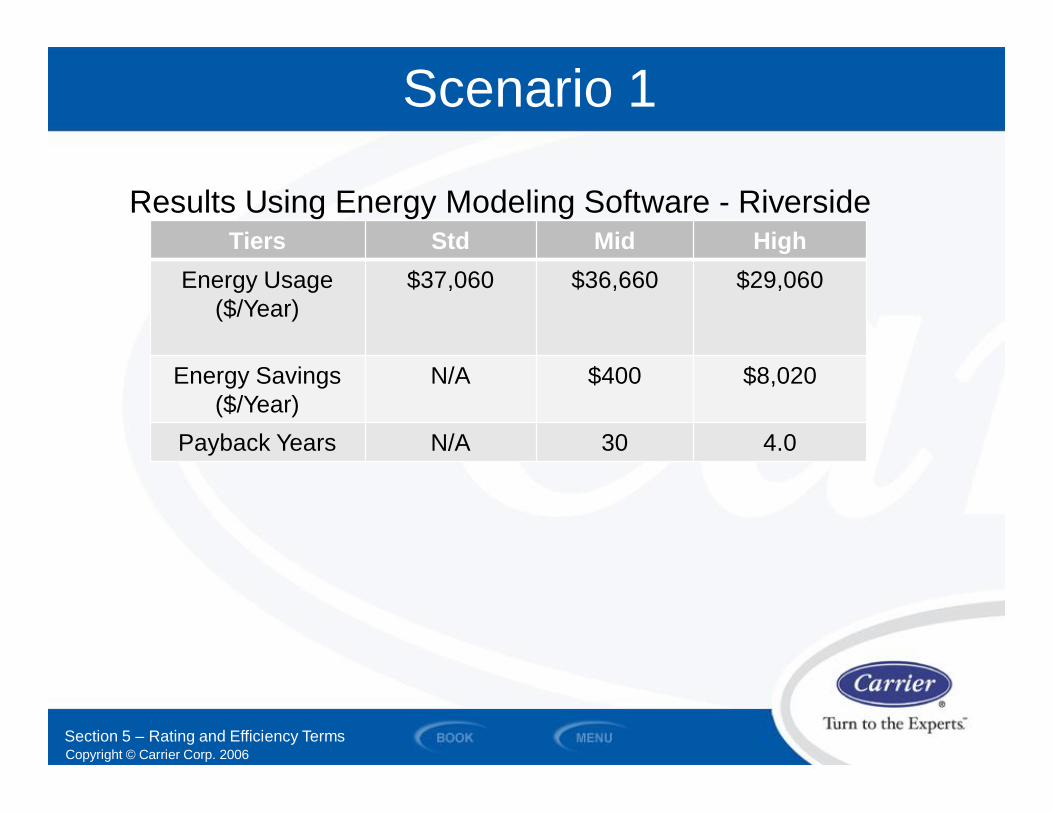
Scenario 1
Section 5 – Rating and Efficiency Terms
Tiers Std Mid HighEnergy Usage
($/Year)$37,060 $36,660 $29,060
Energy Savings($/Year)
N/A $400 $8,020
Payback Years N/A 30 4.0
Results Using Energy Modeling Software - Riverside
Copyright © Carrier Corp. 2006
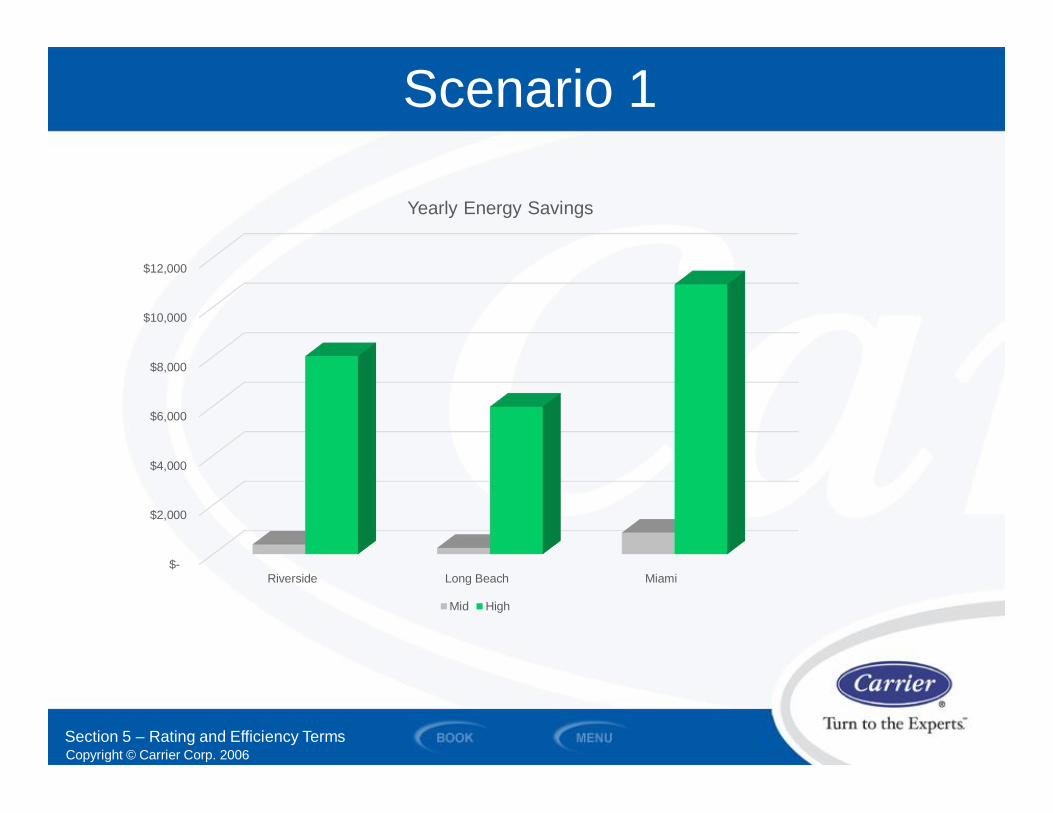
Scenario 1
Section 5 – Rating and Efficiency Terms
$-
$2,000
$4,000
$6,000
$8,000
$10,000
$12,000
Riverside Long Beach Miami
Yearly Energy Savings
Mid High

Copyright © Carrier Corp. 2006
Scenario 1
Section 5 – Rating and Efficiency Terms
0
1
2
3
4
5
6
Riverside Long Beach Miami
Years to Payback High Efficiency Units
Copyright © Carrier Corp. 2006
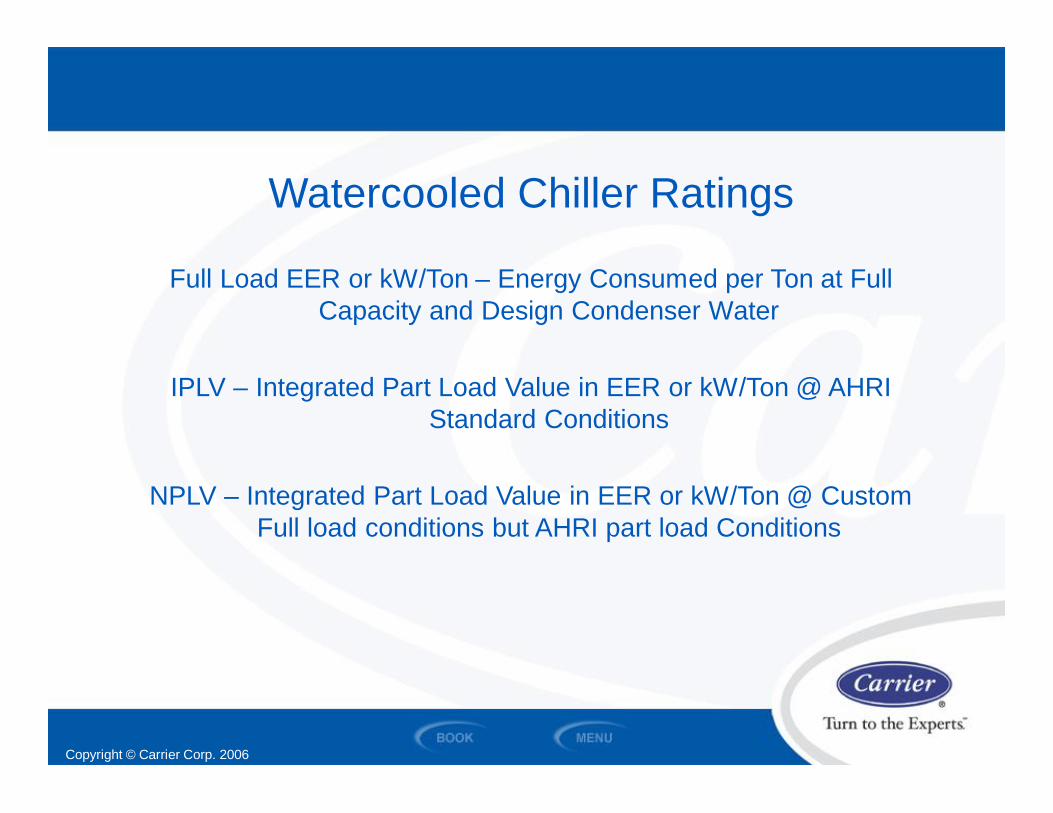
Watercooled Chiller Ratings
Full Load EER or kW/Ton – Energy Consumed per Ton at FullCapacity and Design Condenser Water
IPLV – Integrated Part Load Value in EER or kW/Ton @ AHRIStandard Conditions
NPLV – Integrated Part Load Value in EER or kW/Ton @ CustomFull load conditions but AHRI part load Conditions

Copyright © Carrier Corp. 2006
Chiller Efficiency
Compressor Input (kW) = Mass Flow X LiftCompressor Efficiency
Copyright © Carrier Corp. 2006
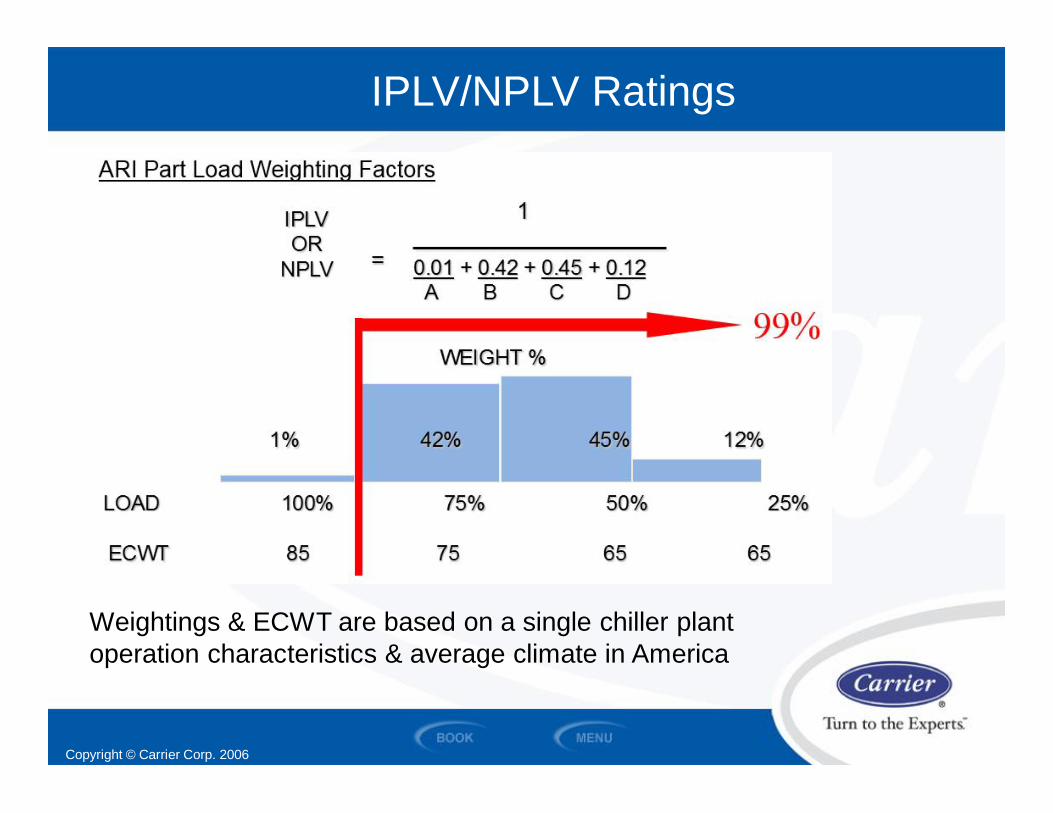
IPLV/NPLV Ratings
Weightings & ECWT are based on a single chiller plantoperation characteristics & average climate in America

Copyright © Carrier Corp. 2006
IPLV/NPLV Ratings
All AHRI chiller factories receive independent random audittests. During the audit they must be within the tolerancesbelow:

Copyright © Carrier Corp. 2006
IPLV
With only these 4 points there is a lot you don’t know
$$$$$ of rebates & project incentives are based on these4 points

Copyright © Carrier Corp. 2006
10 Point Load Line
Copyright © Carrier Corp. 2006
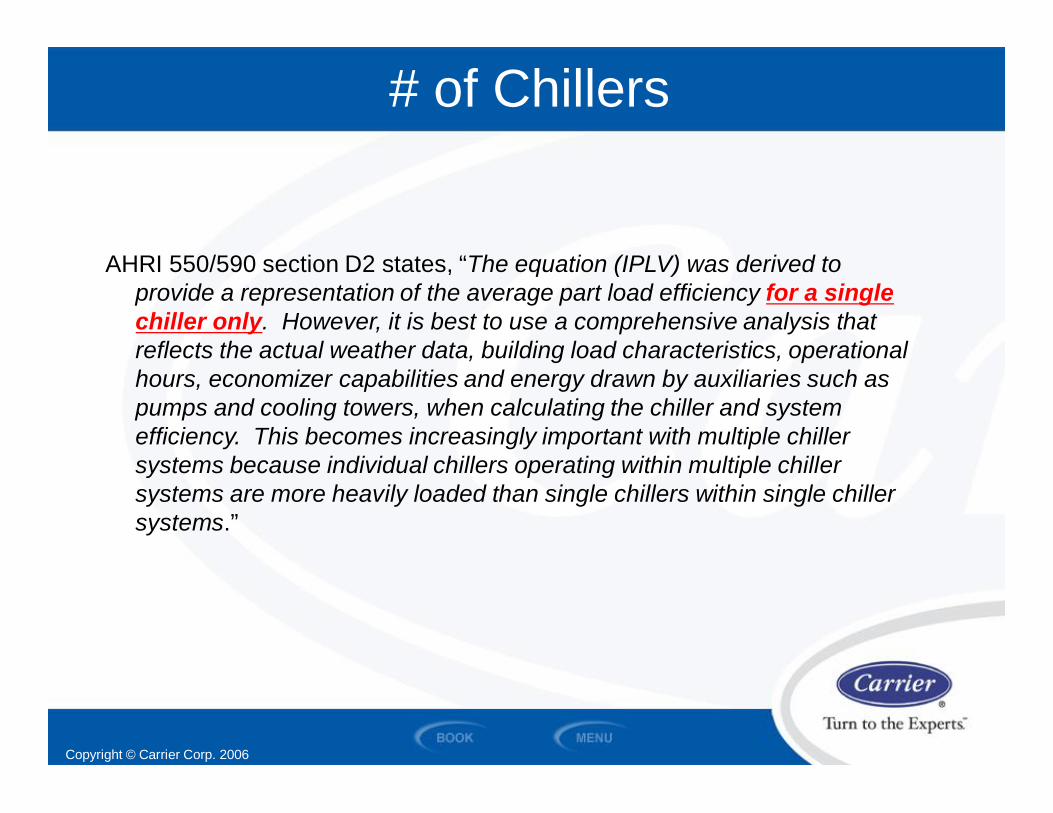
# of Chillers
AHRI 550/590 section D2 states, “The equation (IPLV) was derived toprovide a representation of the average part load efficiency for a singlechiller only. However, it is best to use a comprehensive analysis thatreflects the actual weather data, building load characteristics, operationalhours, economizer capabilities and energy drawn by auxiliaries such aspumps and cooling towers, when calculating the chiller and systemefficiency. This becomes increasingly important with multiple chillersystems because individual chillers operating within multiple chillersystems are more heavily loaded than single chillers within single chillersystems.”

Copyright © Carrier Corp. 2006
# of Chillers
85% Are In Multiples On Jobs
23.7%
43.3%
15.4%
14.3%
4 Chillers
1 Chiller
3 Chillers
1 Chillerinto existingmulti chillerinstallation
2 Chillers
3.3%

Copyright © Carrier Corp. 2006
Multiple Chiller Plants
Buildings with multiple chillers generally do not turn on their chillerstill the building has reached 20-25% load and ambientair/economizer air will no longer meet their needs

Copyright © Carrier Corp. 2006
Multiple Chiller Plants
What about Equal Unloading?

Copyright © Carrier Corp. 2006
Multiple Chiller Plants

Copyright © Carrier Corp. 2006
IPLV/NPLV Summary
Measures just 4 pointsWeights the 4 points to represent single chiller plant
Designed for the “average” U.S. Climate10% average tolerance allowed
Copyright © Carrier Corp. 2006
Water Cooled Chiller Energy Modeling

Copyright © Carrier Corp. 2006
Typical Real World Operating Maps
Office Building w/ Airside Econo

Copyright © Carrier Corp. 2006
Typical Real World Operating Maps
Data Center / Process Load

Copyright © Carrier Corp. 2006
Climate Zones

Copyright © Carrier Corp. 2006
Climate Zones
Copyright © Carrier Corp. 2006
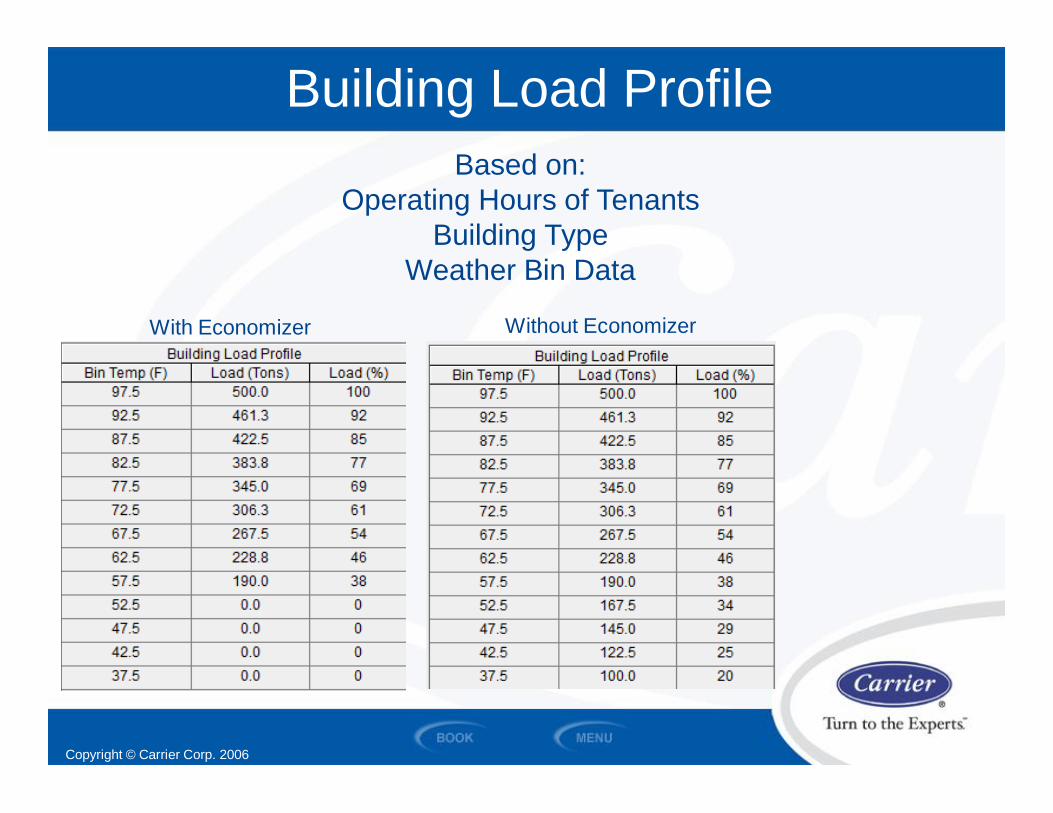
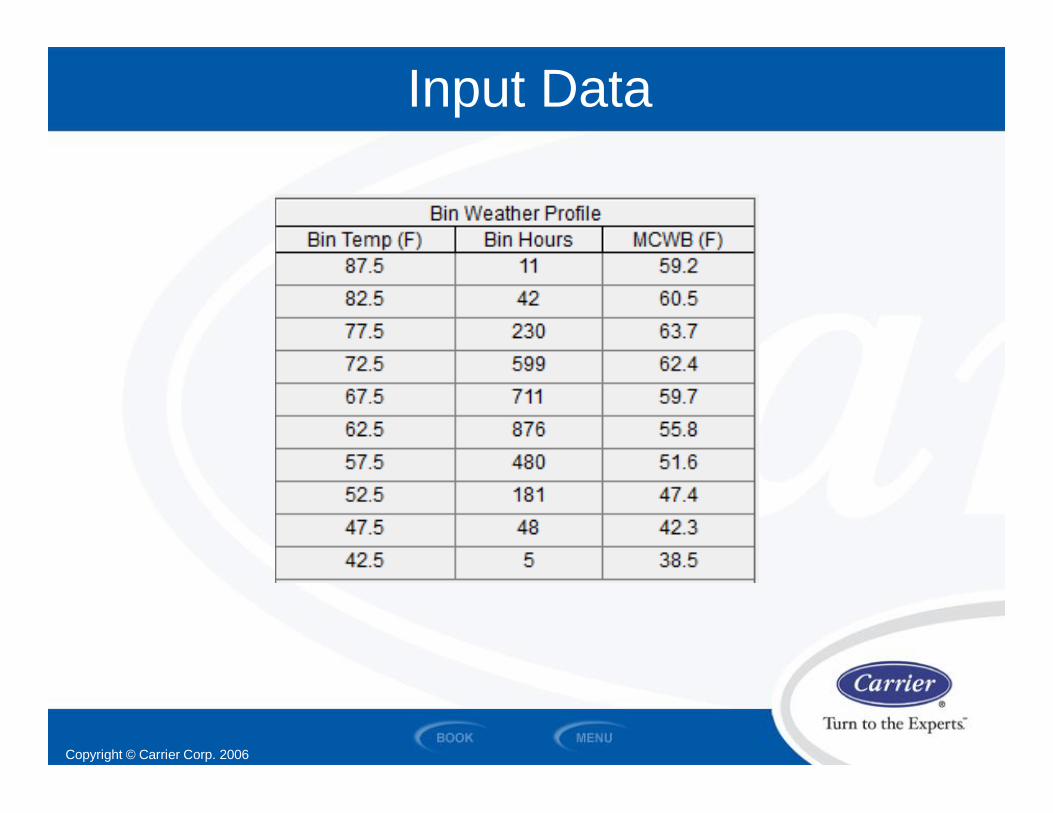
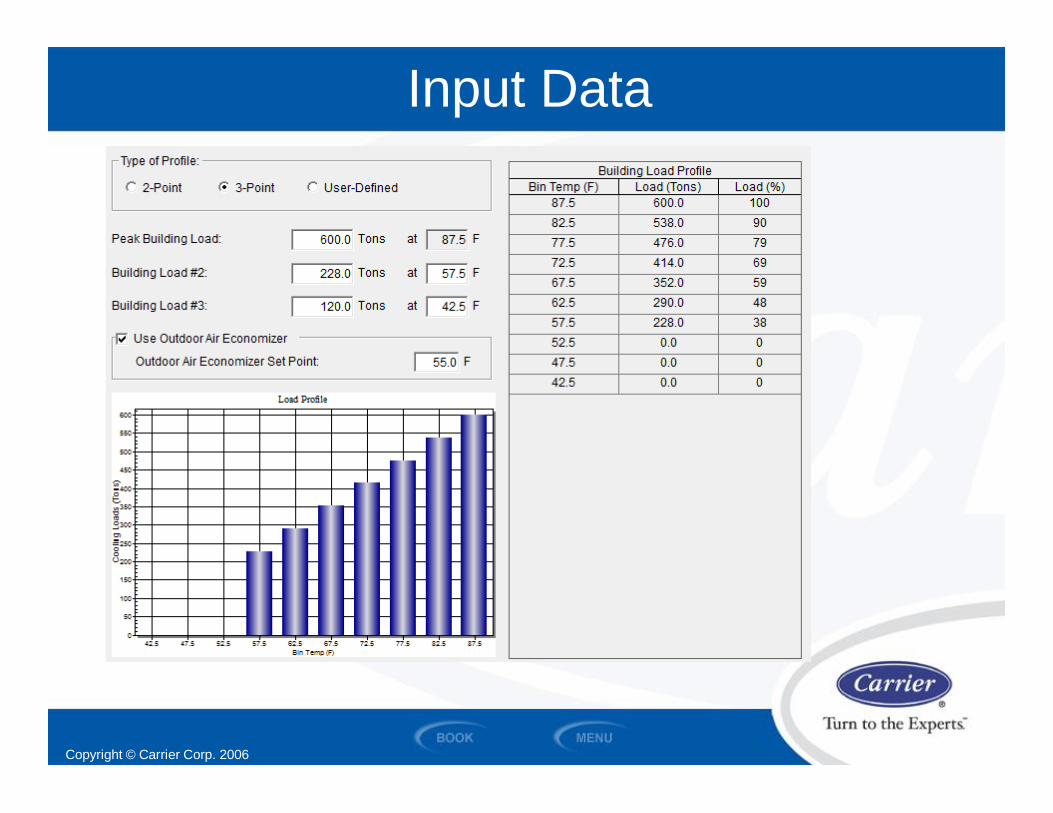
Building Load Profile
With Economizer Without Economizer
Based on:Operating Hours of Tenants
Building TypeWeather Bin Data
Copyright © Carrier Corp. 2006
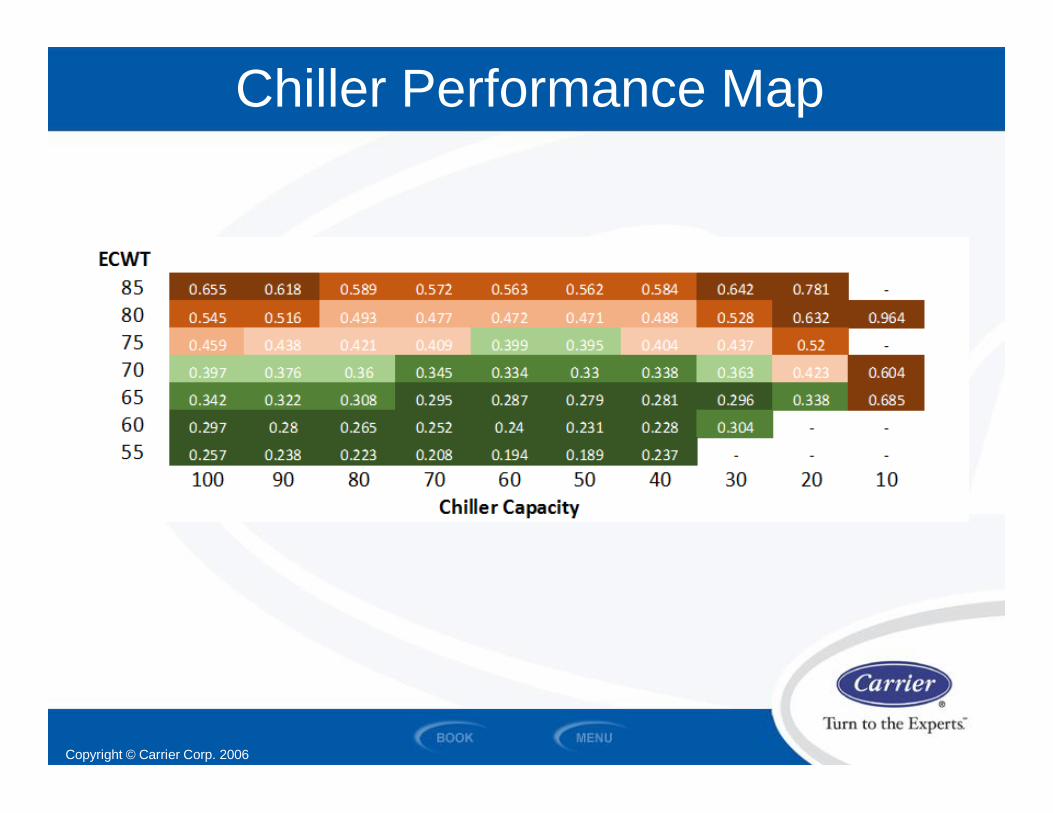
Chiller Performance Map
Copyright © Carrier Corp. 2006
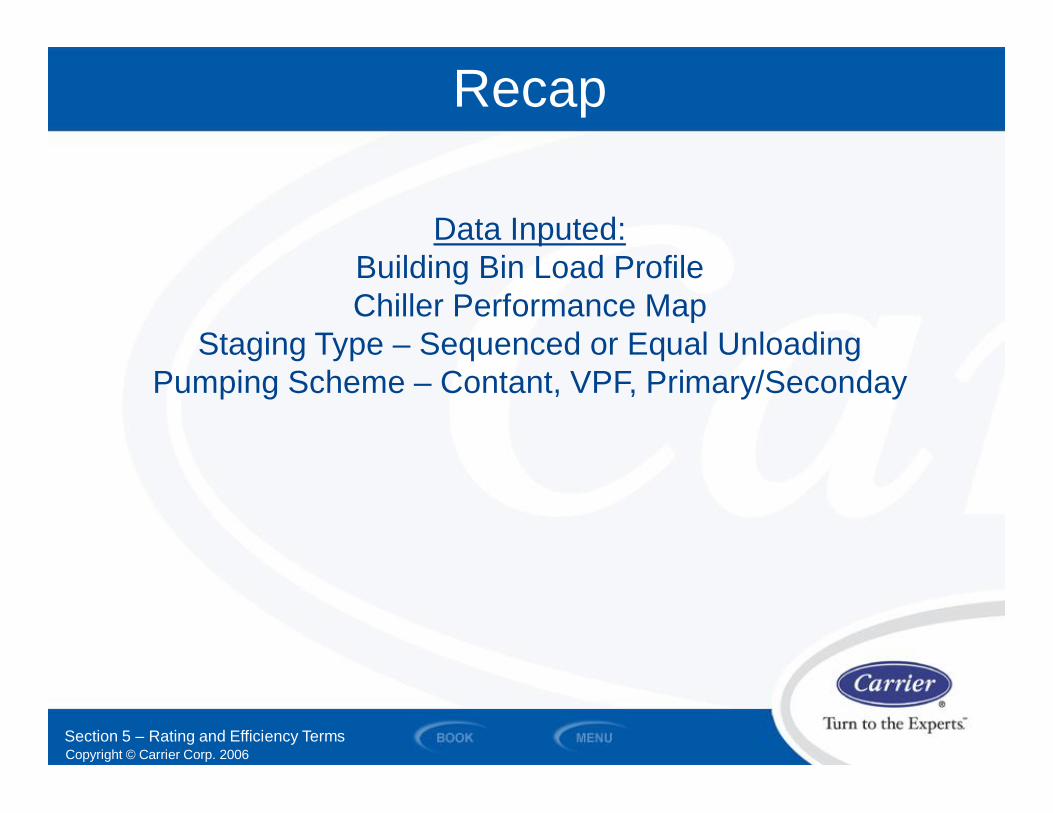
Recap
Section 5 – Rating and Efficiency Terms
Data Inputed:Building Bin Load ProfileChiller Performance Map
Staging Type – Sequenced or Equal UnloadingPumping Scheme – Contant, VPF, Primary/Seconday
Copyright © Carrier Corp. 2006
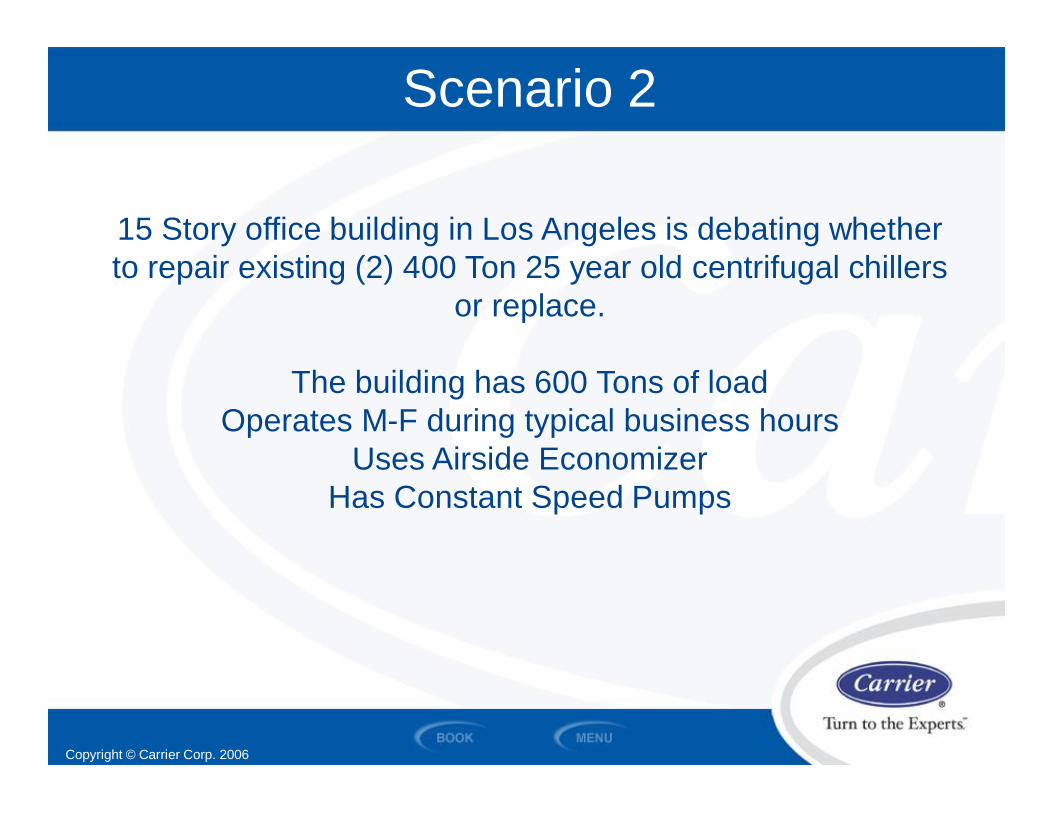
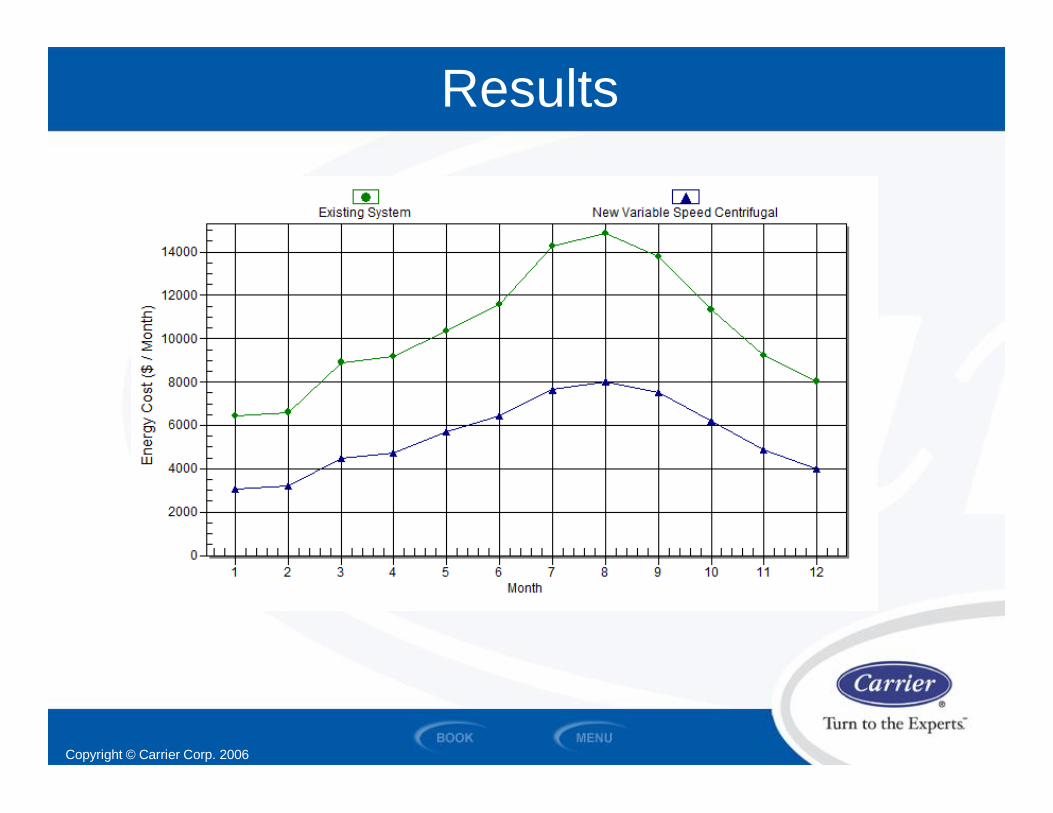
Scenario 2
15 Story office building in Los Angeles is debating whetherto repair existing (2) 400 Ton 25 year old centrifugal chillers
or replace.
The building has 600 Tons of loadOperates M-F during typical business hours
Uses Airside EconomizerHas Constant Speed Pumps
Copyright © Carrier Corp. 2006
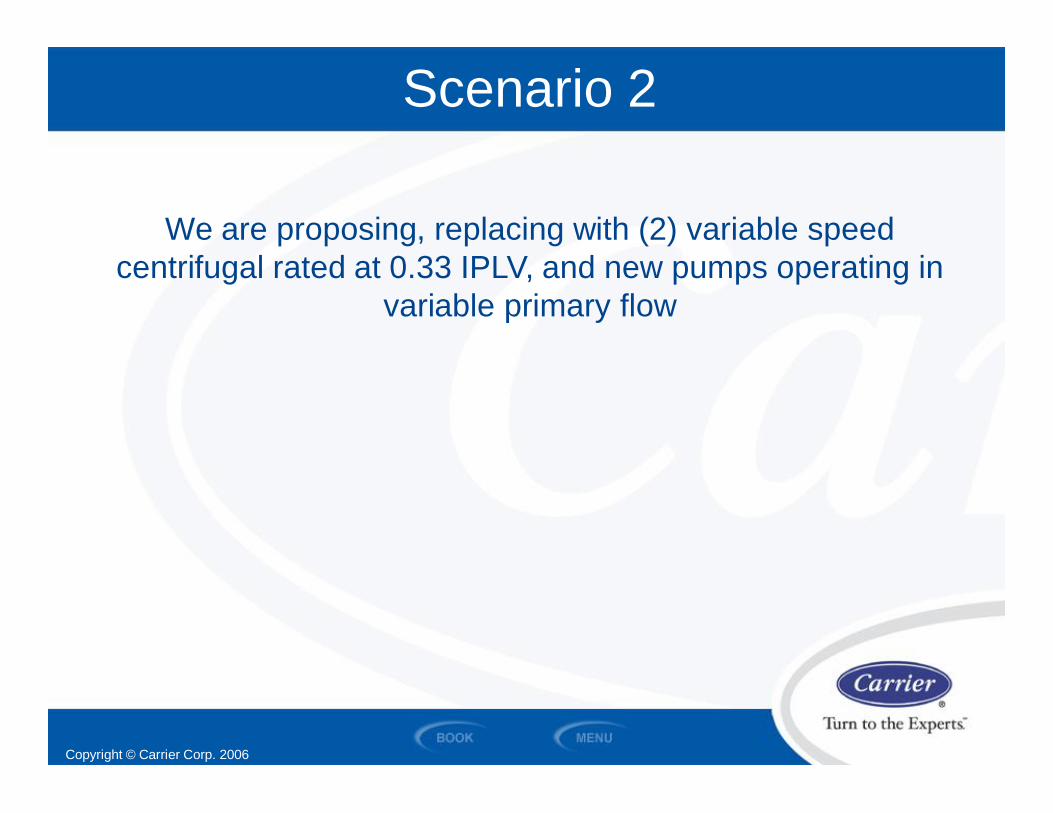
Scenario 2
We are proposing, replacing with (2) variable speedcentrifugal rated at 0.33 IPLV, and new pumps operating in
variable primary flow
Copyright © Carrier Corp. 2006
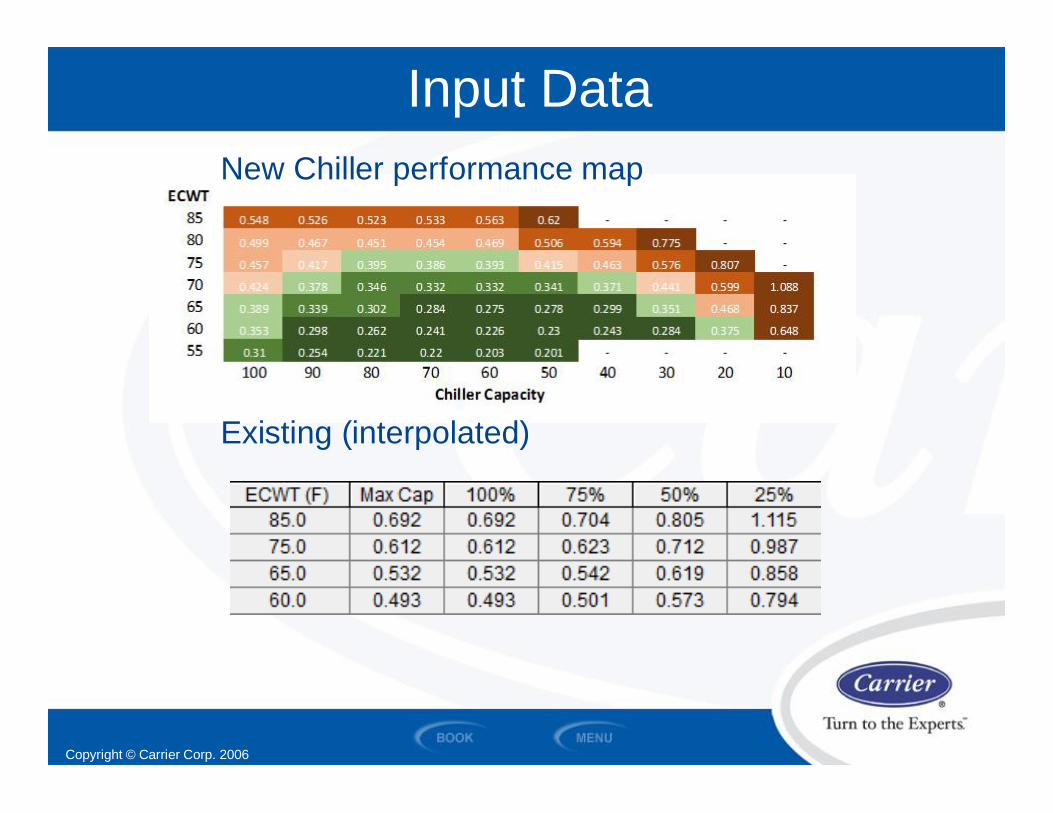
Input Data
Copyright © Carrier Corp. 2006
Input Data
Copyright © Carrier Corp. 2006
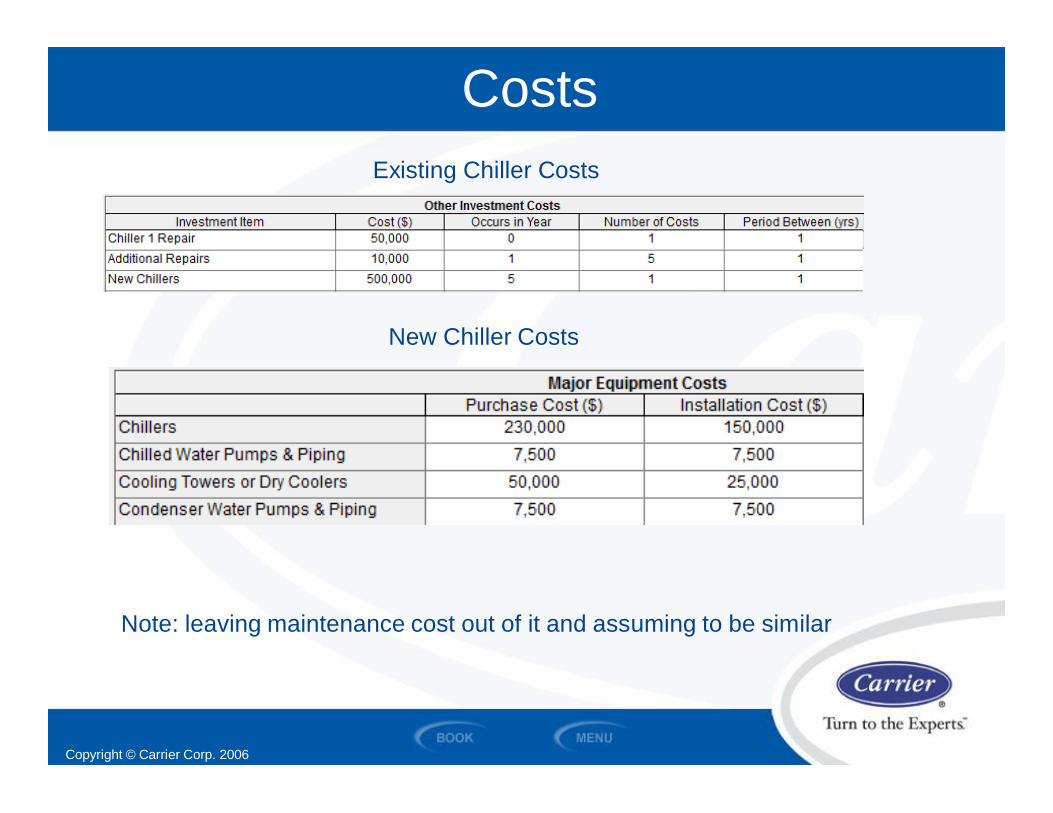
CostsExisting Chiller Costs
New Chiller Costs
Note: leaving maintenance cost out of it and assuming to be similar
Copyright © Carrier Corp. 2006
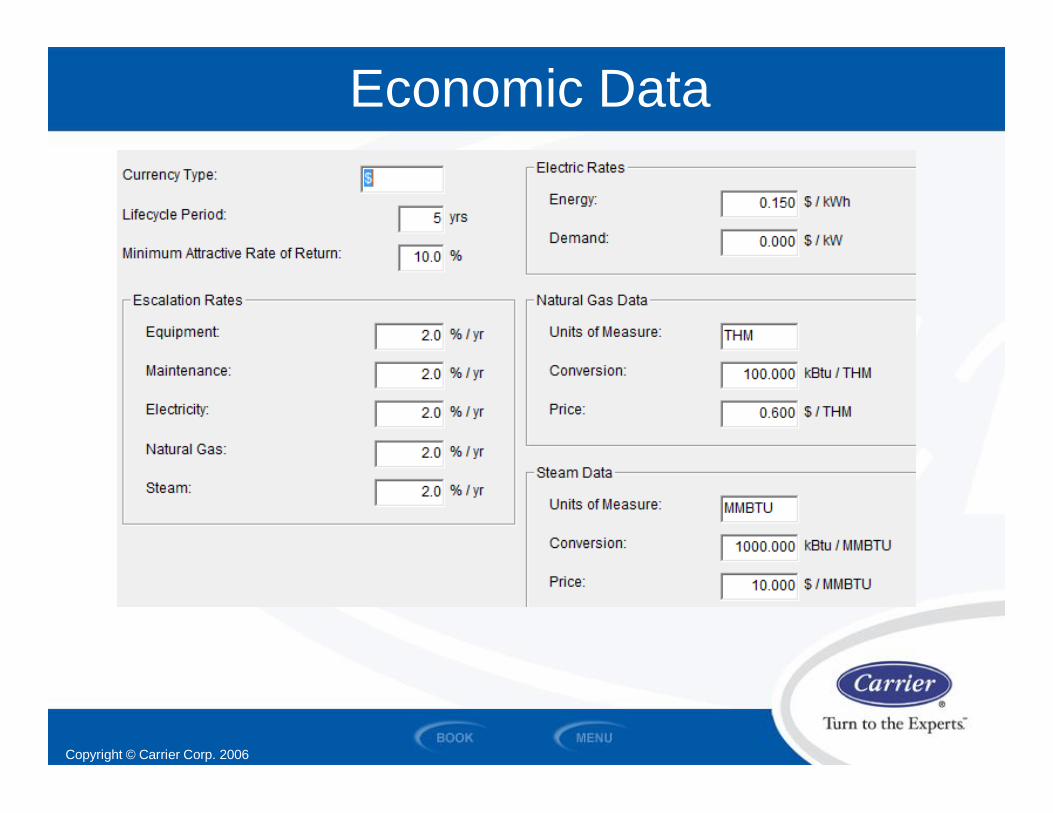
Economic Data
Copyright © Carrier Corp. 2006
Input DataNew Chiller performance map
Existing (interpolated)

Copyright © Carrier Corp. 2006
Results
Copyright © Carrier Corp. 2006
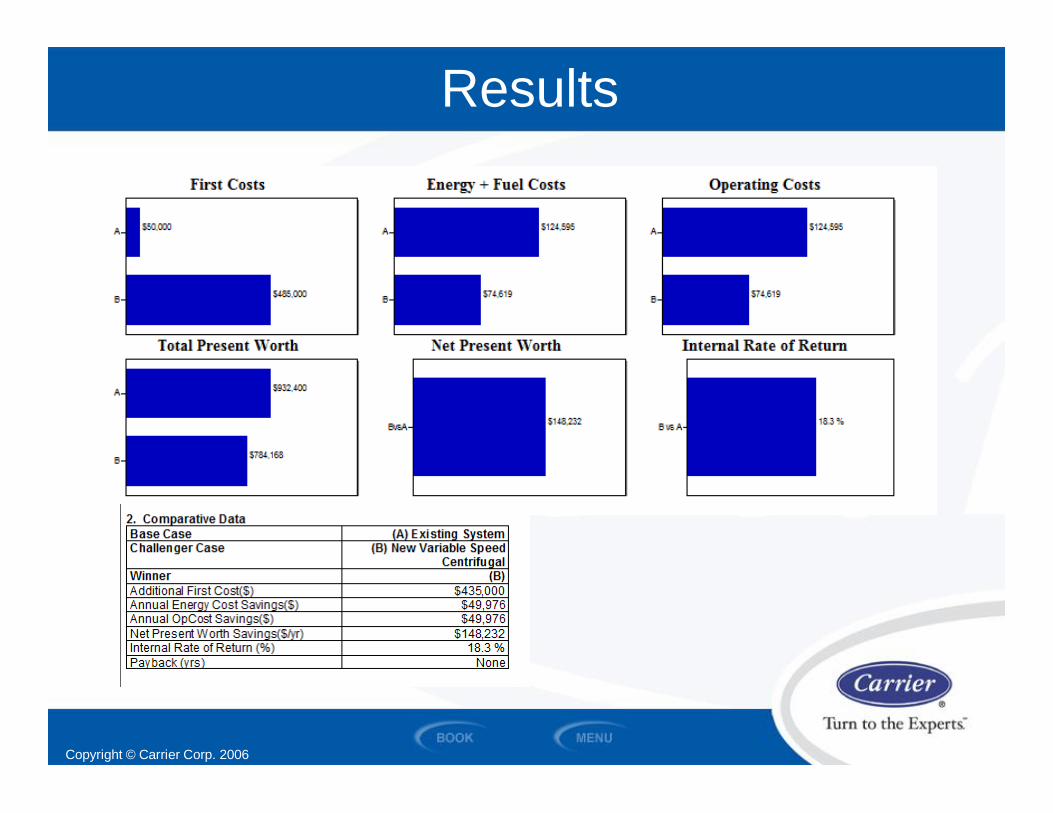
Results
Copyright © Carrier Corp. 2006
Results
Copyright © Carrier Corp. 2006
Summary
Things to Remember!
LIFE CYCLE COSTINGFOR HVAC SYSTEMS

Copyright © Carrier Corp. 2006
Summary
• Life Cycle Costing is used as a decision tool between different options
• With HVAC systems this means taking the first costs of design, materials, installation& any rebates, then incorporating the present value of future incremental costs suchas energy, maintenance and repair. The result is an overall present value for eachoption.
• Generally, the option with the highest annual rate of return is chosen unless a non-economic decision outweighs this
• AHRI ratings provide a limited outlook on the efficiency of the equipment and areoften not in sync with the local climate and application.
• Energy modeling of equipment provides the best outlook of what kind of “real life”efficiency you will experience

Copyright © Carrier Corp. 2006
Technical Development Program
Thank YouThis completes the presentation.
TDP 903 Life Cycle CostingArtwork from Symbol Library used by permission ofSoftware Toolboxwww.softwaretoolbox.com/symbols


