31
Click To Edit Master Title Style Commercial PACE: What Does It Mean for the Market? Tuesday, May 16 11:15 AM – 12:30 PM
Click To Edit Master Title Style
Commercial PACE: What Does It Mean for the Market?
Tuesday, May 16 11:15 AM – 12:30 PM

Speakers and Moderator
Speakers Stacey Lawson, Ygrene Energy Fund Bracken Hendricks, Urban Ingenuity
Moderator Sean Williamson, U.S. Department of Energy
2

Resources
State and Local Solution Center
3
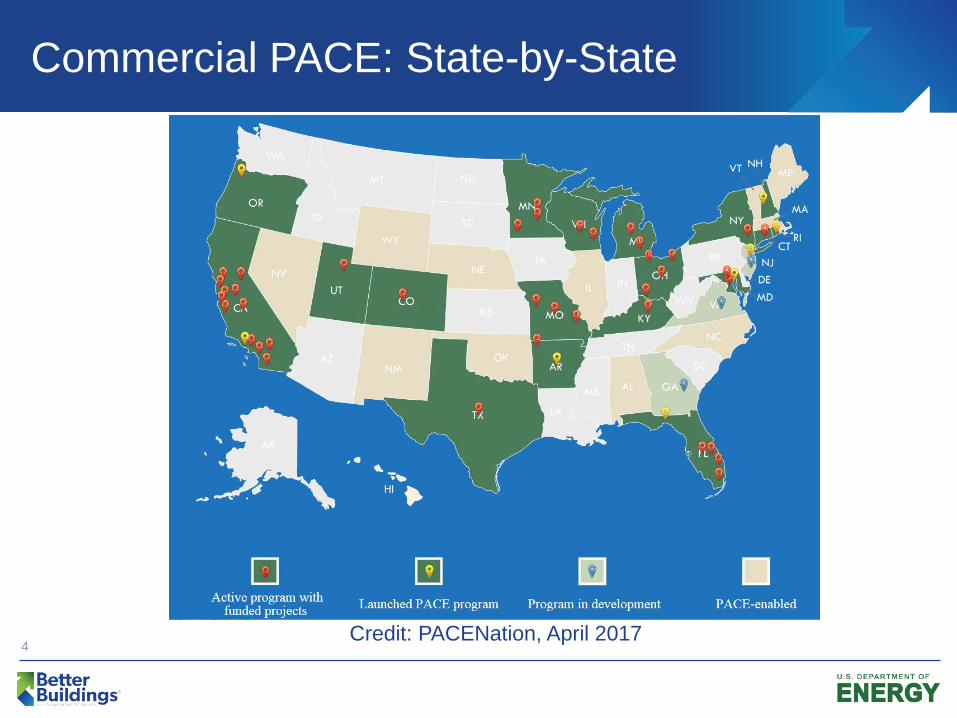
Commercial PACE: State-by-State
4 Credit: PACENation, April 2017

C-PACE A Capital Opportunity
Stacey Lawson Ygrene Energy Fund Better Buildings Summit May 2017
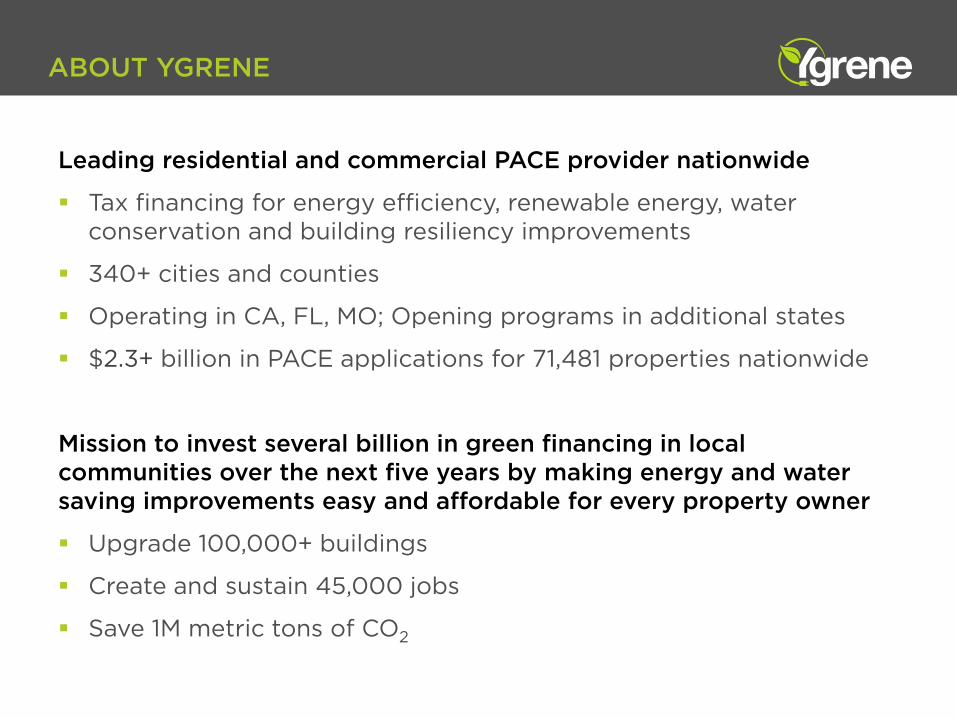
ABOUT YGRENE
Leading residential and commercial PACE provider nationwide
Tax financing for energy efficiency, renewable energy, water conservation and building resiliency improvements
340+ cities and counties
Operating in CA, FL, MO; Opening programs in additional states
$2.3+ billion in PACE applications for 71,481 properties nationwide
Mission to invest several billion in green financing in local communities over the next five years by making energy and water saving improvements easy and affordable for every property owner
Upgrade 100,000+ buildings each
Create and sustain 45,000 jobs
Save 1M metric tons of CO2
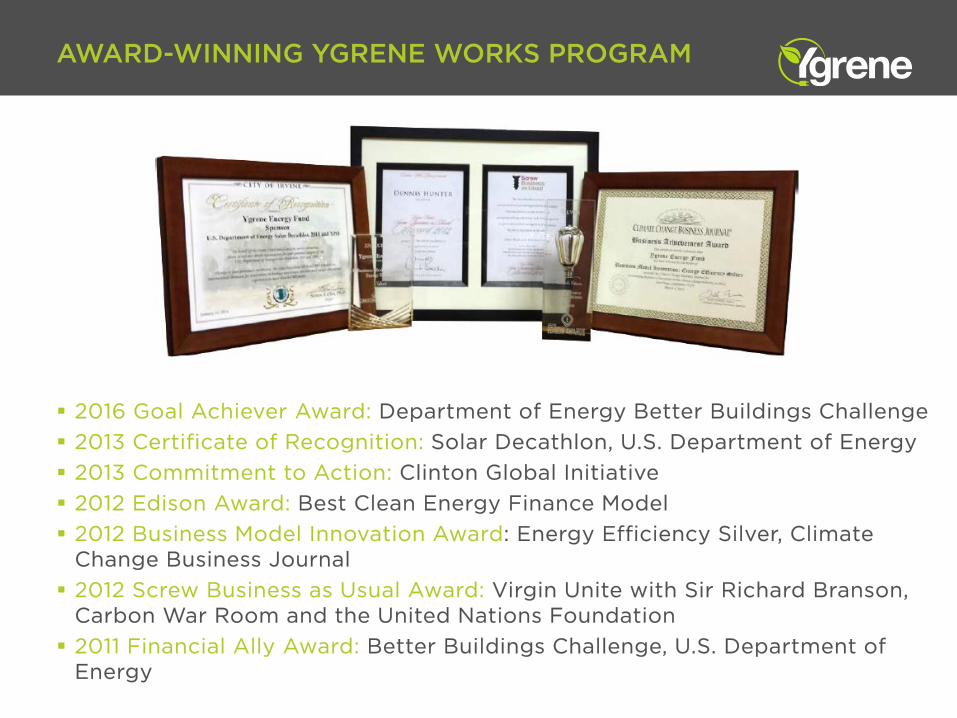
AWARD-WINNING YGRENE WORKS PROGRAM
2016 Goal Achiever Award: Department of Energy Better Buildings Challenge 2013 Certificate of Recognition: Solar Decathlon, U.S. Department of Energy 2013 Commitment to Action: Clinton Global Initiative 2012 Edison Award: Best Clean Energy Finance Model 2012 Business Model Innovation Award: Energy Efficiency Silver, Climate
Change Business Journal 2012 Screw Business as Usual Award: Virgin Unite with Sir Richard Branson,
Carbon War Room and the United Nations Foundation 2011 Financial Ally Award: Better Buildings Challenge, U.S. Department of
Energy
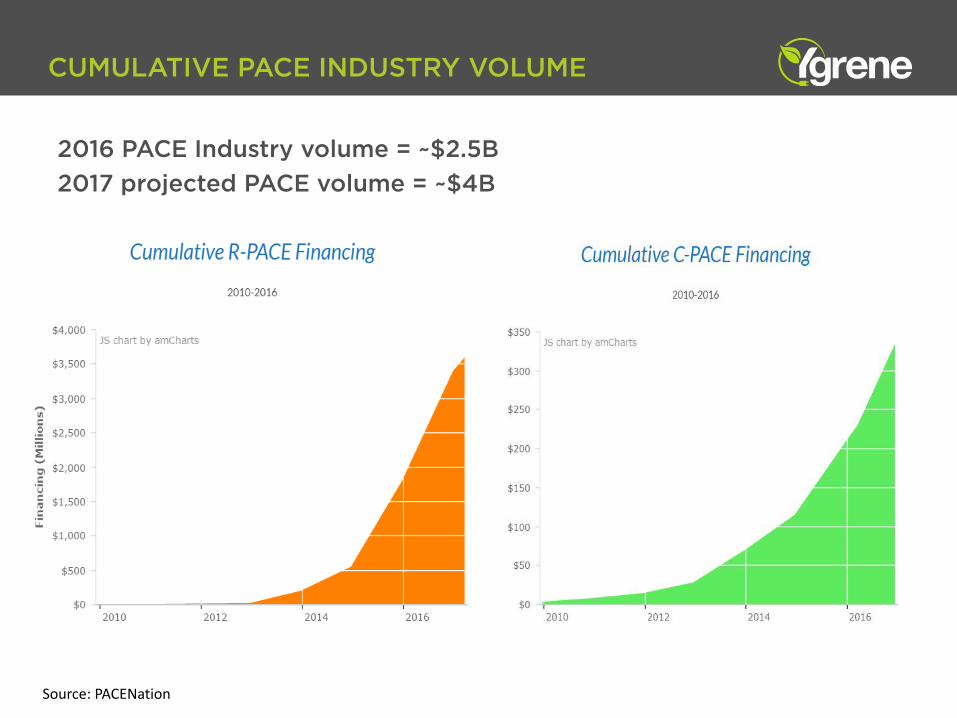
CUMULATIVE PACE INDUSTRY VOLUME
2016 PACE Industry volume = ~$2.5B 2017 projected PACE volume = ~$4B
Source: PACENation

YGRENE IMPACT ON LOCAL COMMUNITIES

Multifamily 20%
Office 20%
Retail 18%
Service 10%
Apartments 7%
Hotel 5%
Religious, Mixed Use, Food Service,
Agricultural 7%
Other 13%
YGRENE C-PACE PORTFOLIO
Building Types Improvement Types
Solar 32%
HVAC 21%
Roofing 15%
Windows & Doors 10%
Lighting 8%
HVAC 5%
Other 4%
Insulation, Water,
Controls & Reflective
Paint 5%
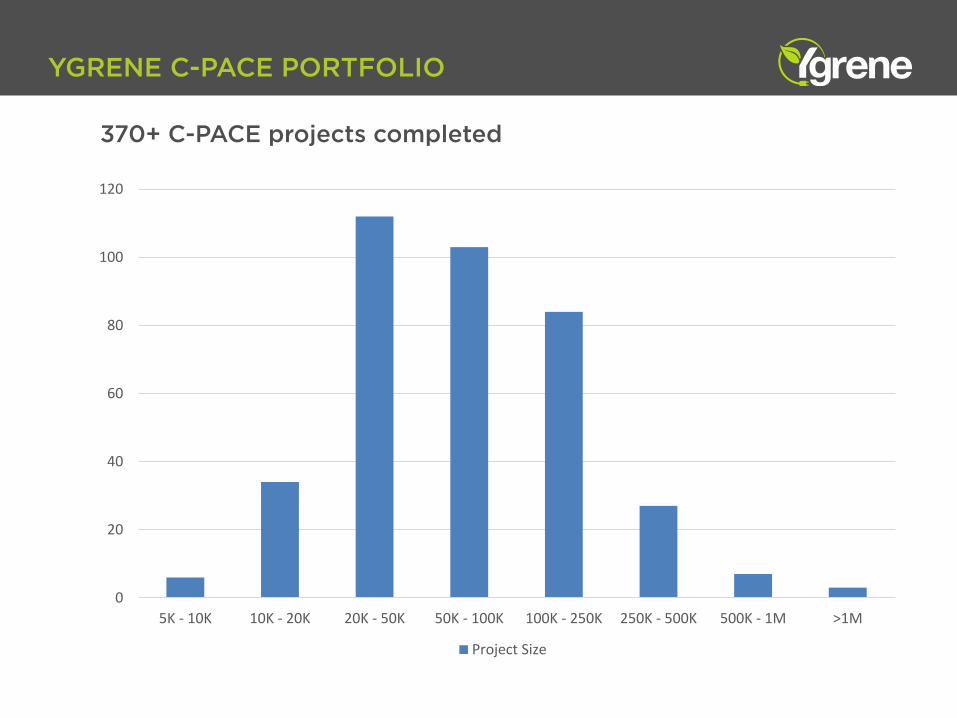
YGRENE C-PACE PORTFOLIO
0
20
40
60
80
100
120
5K - 10K 10K - 20K 20K - 50K 50K - 100K 100K - 250K 250K - 500K 500K - 1M >1M
Project Size
370+ C-PACE projects completed
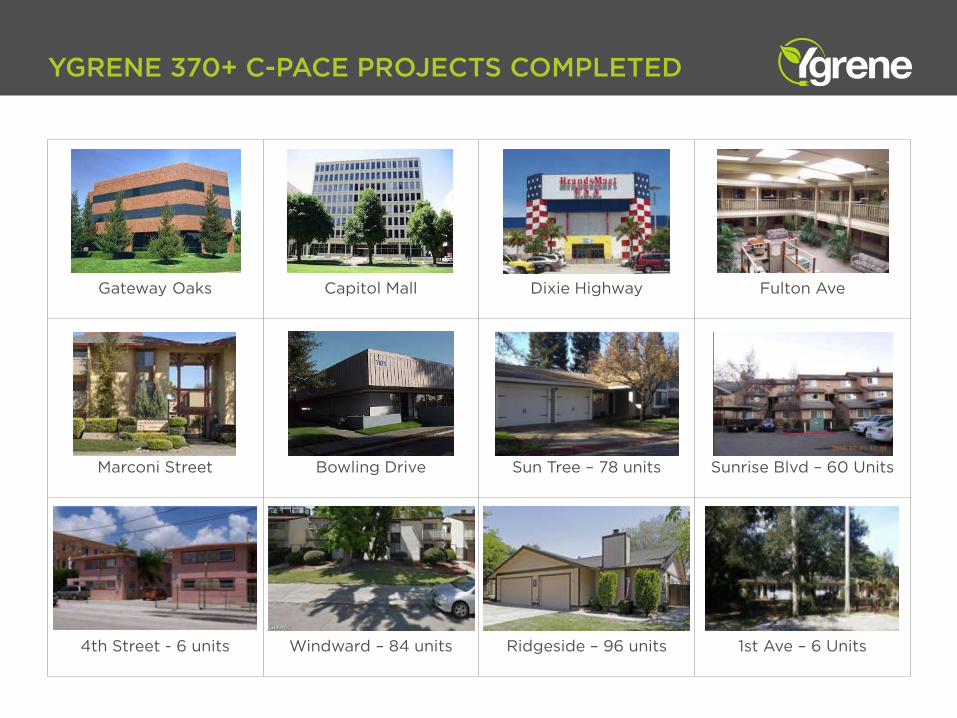
YGRENE 370+ C-PACE PROJECTS COMPLETED
Gateway Oaks
Capitol Mall
Dixie Highway
Fulton Ave
Marconi Street
Bowling Drive
Sun Tree – 78 units
Sunrise Blvd – 60 Units
4th Street - 6 units
Windward – 84 units
Ridgeside – 96 units
1st Ave – 6 Units

C-PACE FINANCING: FASTER, SIMPLER, BETTER
Property Owner Advantages 100% financing Long term, fixed rates (20-year+) Off balance sheet, non-recourse Pass through under most net
leases Increase property value and
retain working capital w/zero capital outlay Lowers overall cost of capital as
equity is replaced with long term debt Enables reallocation of cash to
other capital investments
Transparent Underwriting Finance up to 15% of FMV Minimum 10% available equity Mortgage and property taxes
current at approval Not in bankruptcy No involuntary liens No personal guarantees,
financial statements or rent rolls required
Approval in 5 business days

TRUE COST OF CAPITAL
Most large project financing requires a mix of debt and equity - Debt (bank loans) - Equity (cash)
True cost of capital is the weighted
average cost of debt and equity
Let’s assume a typical project… 60% debt @ 4% 40% equity @ 20% ____________________ Weighted cost of capital = 10.4% PACE is 100% financing PACE cost of capital = 7%
“My company wants to invest in high-return projects to improve our business BUT...I can raise corporate debt at a 4% interest rate. Why should I use PACE at 7% to complete my project?”
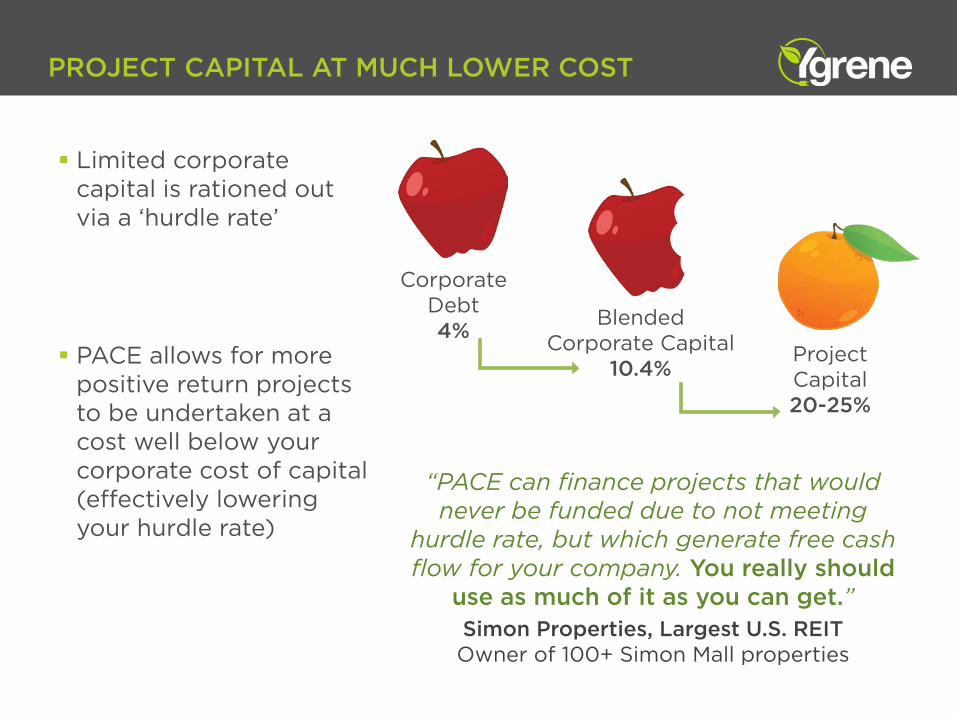
PROJECT CAPITAL AT MUCH LOWER COST
Limited corporate capital is rationed out via a ‘hurdle rate’
PACE allows for more
positive return projects to be undertaken at a cost well below your corporate cost of capital (effectively lowering your hurdle rate)
“PACE can finance projects that would never be funded due to not meeting
hurdle rate, but which generate free cash flow for your company. You really should
use as much of it as you can get.” Simon Properties, Largest U.S. REIT Owner of 100+ Simon Mall properties
Corporate Debt 4% Blended
Corporate Capital 10.4%
Project Capital 20-25%

LARGE COMMERCIAL CASE STUDY
Sacramento Metro Center California Chiller Cooling Tower Water Treatment System Equipment + Lighting
Control System $140,000 annual energy savings Significant annual operating savings Project Goals Attain LEED® certification, reduce energy and operating expenses, improve building comfort
$3.16 million PROJECT VALUE
27%
ENERGY SAVINGS
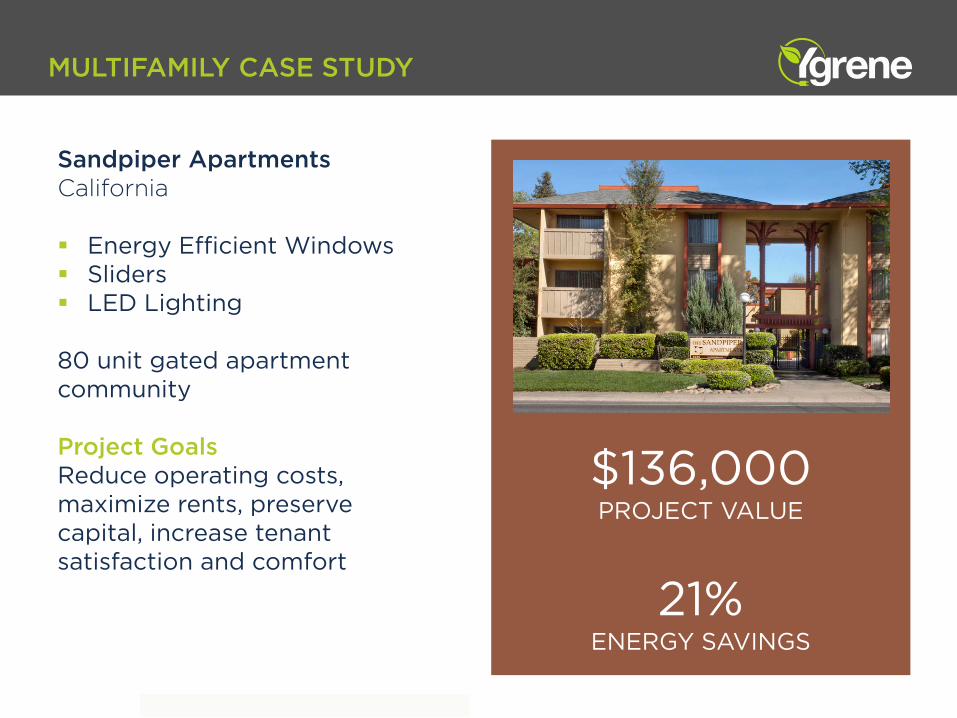
MULTIFAMILY CASE STUDY
$136,000 PROJECT VALUE
21%
ENERGY SAVINGS
Sandpiper Apartments California Energy Efficient Windows Sliders LED Lighting 80 unit gated apartment community Project Goals Reduce operating costs, maximize rents, preserve capital, increase tenant satisfaction and comfort

WHO BENEFITS MOST? KEY LESSONS
Any property with positive cash-flow investment opportunities that fall below hurdle rate
Properties with commercial tenants (passing through the assessment)
Properties with urgent/mandated retrofits who require longer terms and time to pay
Properties who do not qualify for traditional bank loans
Properties with complex debt structures which cannot refinance to accomplish basic EE/RE upgrades
Small to medium sized commercial and multifamily properties with lower, minimum funding amount needs
Imagine what we can do.
Financing energy, water,
and infrastructure upgrades
Better Buildings Summit, May 2017

DC PACE: A Growing Program
DC PACE is the District’s only clean energy financing program for building upgrades.
Urban Ingenuity is the DC PACE program administrator, under contract to DOEE
$0
$5
$10
$15
$20
$25
$30
$35
2015 2016 2017
PAC
E C
losi
ngs
($M
)
Year
ProjectedClosed
Milestones: • $5M+ funded • First PACE for
affordable housing • First tax-exempt
PACE • First HUD approval of
PACE
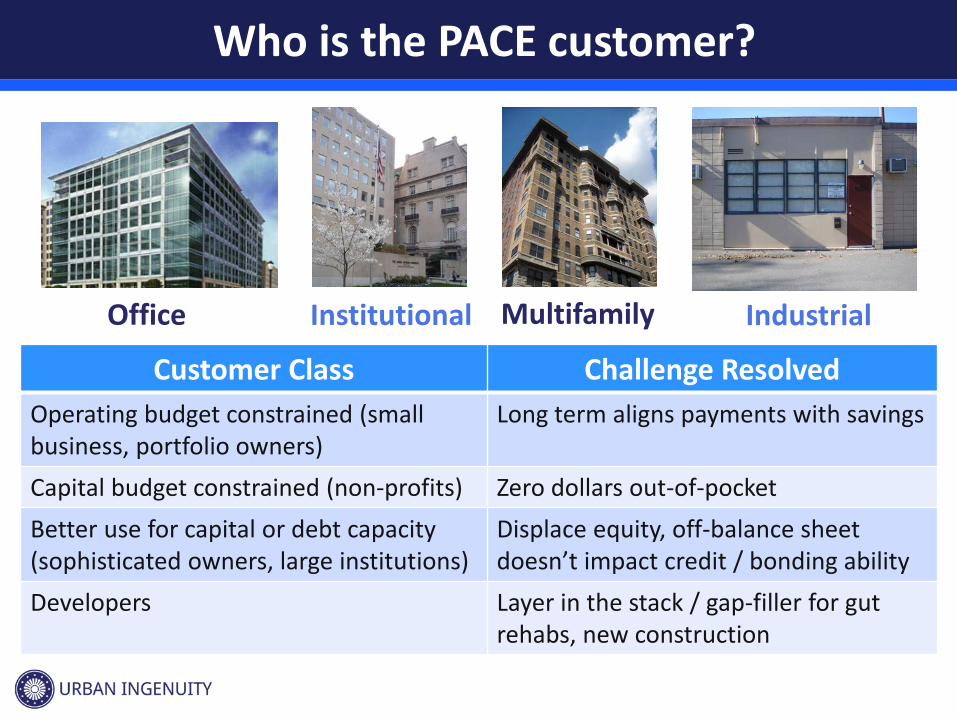
Who is the PACE customer?
Multifamily Industrial Office Institutional
Customer Class Challenge Resolved Operating budget constrained (small business, portfolio owners)
Long term aligns payments with savings
Capital budget constrained (non-profits) Zero dollars out-of-pocket Better use for capital or debt capacity (sophisticated owners, large institutions)
Displace equity, off-balance sheet doesn’t impact credit / bonding ability
Developers Layer in the stack / gap-filler for gut rehabs, new construction

PACE in the Capital Stack: Case Study
Sources Equity $4,000,000 Debt $27,000,000 Total Sources $31,000,000 Gap $2,000,000
Uses Hard Costs $30,000,000 Soft Costs $3,000,000 Total Costs $33,000,000
Options for addressing a $2M gap… 1. Do Nothing: Project stalls or dies 2. Owner’s Equity: High opportunity costs 3. Value Engineering: Lock in high operating costs 4. PACE: Increase NOI & Displace equity
Note: Project financials have been simplified for illustrative purposes.
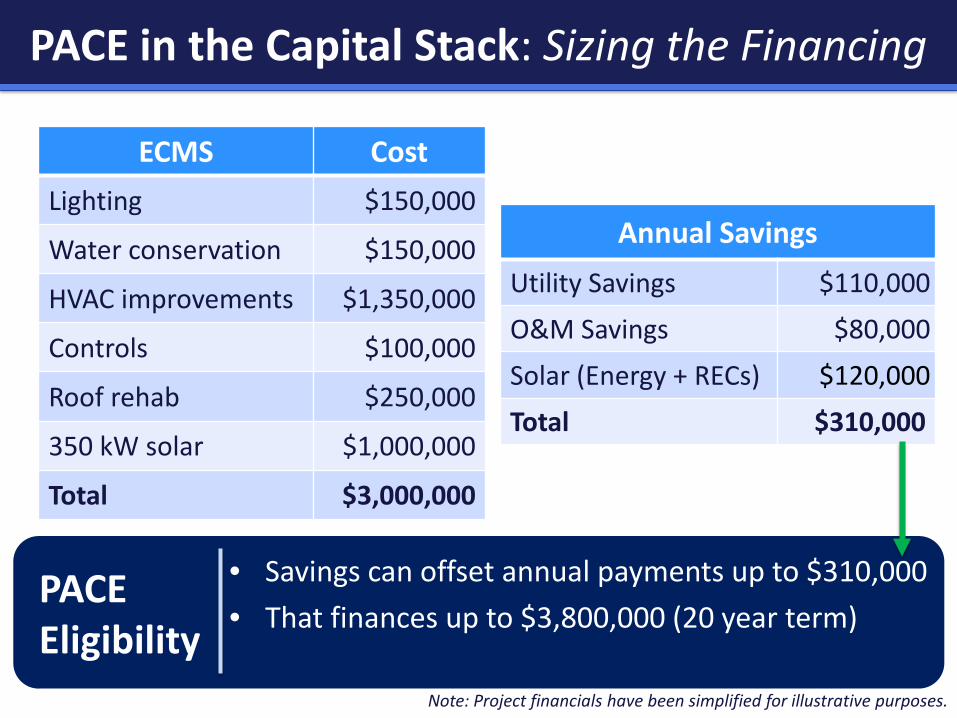
PACE in the Capital Stack: Sizing the Financing
ECMS Cost Lighting $150,000
Water conservation $150,000
HVAC improvements $1,350,000
Controls $100,000
Roof rehab $250,000
350 kW solar $1,000,000
Total $3,000,000
Annual Savings Utility Savings $110,000
O&M Savings $80,000
Solar (Energy + RECs) $120,000
Total $310,000
• Savings can offset annual payments up to $310,000 • That finances up to $3,800,000 (20 year term)
PACE Eligibility
Note: Project financials have been simplified for illustrative purposes.

PACE in the Capital Stack: Filling a Gap
Options for addressing a $2M gap… 1. Do Nothing: Project stalls or dies 2. Owner’s Equity: High opportunity costs 3. Value Engineering: Lock in high operating costs 4. PACE: Increase NOI & Displace equity
Sources Equity $4,000,000 Debt $27,000,000 PACE $3,000,000 Total Sources $34,000,000
Uses Hard Costs $30,00,000 Soft Costs $3,000,000 Solar $1,000,000 Total Costs $34,000,000
Note: Project financials have been simplified for illustrative purposes.

PACE in the Capital Stack: Increasing NOI
Note: Project financials have been simplified for illustrative purposes.
Average Annual Cash Flow
Utility Savings $110,000
O&M Savings $80,000
Solar (Energy + RECs) $120,000
Total Savings $310,000
PACE Payments -$240,000
Net Cash Flow $70,000
• PACE eligibility: $3,800,000 (20 year term) • Actual PACE amount: $3,000,000 • Actual PACE payments: $240,000
• Improved building performance, lower operating costs, and improved NOI for owner
• PACE includes cost of structural improvements, key infrastructure upgrades with no out-of-pocket cost

Self-Funded PACE
Investment by Property Owner $3,000,000 $0.00 Annual Benefits $310,000 $310,000 Annual PACE Payment $0.00 $(240,000)
Net Benefit Year 1 $(2,690,000) $70,000 Annual Net Benefit Years 2-20 $310,000 $70,000 5-year NPV of Cash Flows (@ 6% discount rate) $(1,524,000) $295,000 10-year NPV of Cash Flows (@ 6% discount rate) $(549,000) $515,000 5-year IRR -19% Infinite 10-year IRR 1% Infinite
PACE is a valuable tool for development projects!
Note: Project financials have been simplified for illustrative purposes.
PACE in the Capital Stack: Displacing Equity
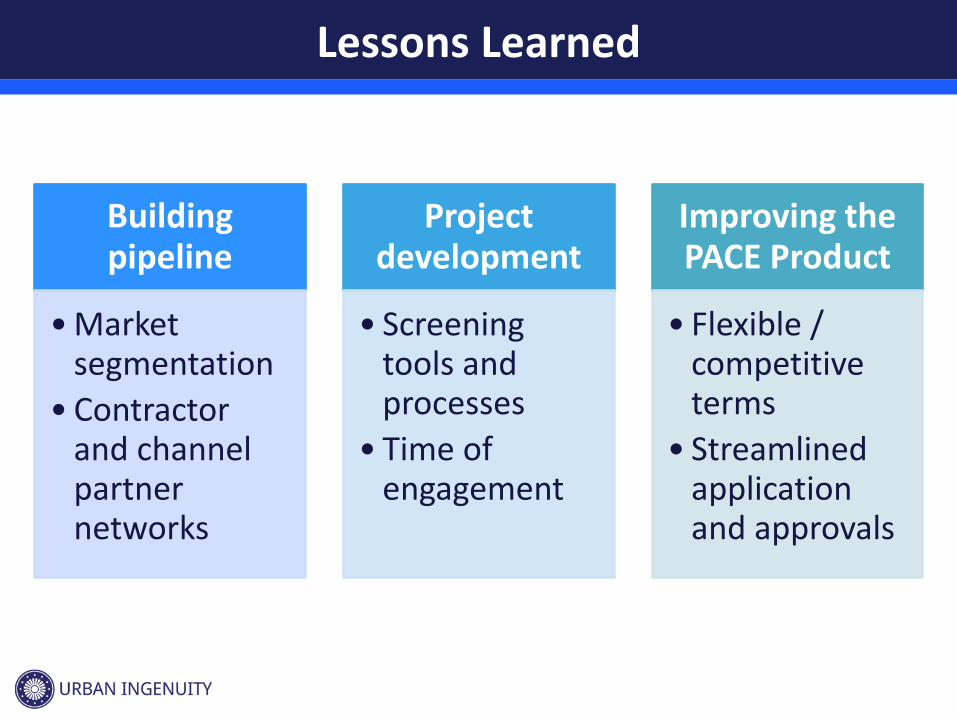
Lessons Learned
Building pipeline
• Market segmentation
• Contractor and channel partner networks
Project development
• Screening tools and processes
• Time of engagement
Improving the PACE Product
• Flexible / competitive terms
• Streamlined application and approvals
Thanks!
Bracken Hendricks President & CEO, Urban Ingenuity
[email protected] www.urbaningenuity.com Twitter: @IngenuityPower

Questions?
Thank You
Provide feedback on this session in the new Summit App! Download the app to your mobile device or go to bbsummit.pathable.com
31


