Valerie Bullard, Agronomist, P.O. Box 68, Lockeford, CA 95237, email: [email protected], ph: 209-727-5319 COMMERCIAL POLLINATOR MIX COMPARISON Valerie Bullard, PMC Agronomist; Margaret Smither-Kopperl, PMC Manager ABSTRACT NRCS Plant Materials Centers (PMC) are conducting evaluations on local commercially available pollinator mixes in order to advise NRCS field offices and the public on the relative value of these mixes in providing pollinator forage, as well as suitability to their location, or within their farming operation. The objective of this study was to evaluate commercially available seed mixtures for adaptation, production of suitable pollinator habitat, and integration into almond orchard operations in California’s Central Valley. A total of eight different commercially available pollinator mixes were evaluated (four almond mixes and four Central Valley mixes). Canopy cover, percent bloom and bloom duration, and bee visitation were observed and recorded in order to evaluate plant species persistence and forage quality for pollinators. The almond pollinator mixes were successful in providing a variety of forage resources for pollinators during the appropriate window for integration into an almond orchard operation. The Central Valley pollinator mixes all provided foraging resources and potential habitat for native pollinators if left undisturbed. These mixes all had high seed costs when compared to the almond pollinator mixes; however, they are meant to be long term investments that provide pollinators with habitat for several years and require little to no maintenance. All of the pollinator mixes evaluated would be appropriate for attracting a variety of pollinators and increasing pollinator habitat if applied in the appropriate setting and considerations of site suitability, seedbed preparation, and competing vegetation are taken into account. INTRODUCTION The commercial seed industry is marketing ready-made seed mixes appropriate to attract pollinators and provide pollinator habitat. However, these mixes may not perform equally in different regions of the country, or even different regions of the state of California. Concerns are that some commercial mixes may contain plant species that can become invasive, the mix may not contain appropriate species to provide pollinator forage throughout the year, or that the mix may not contain plant species that provide forage to the target pollinators. Restoring pollinator habitat and communities is important in California because pollinators play a huge role in agricultural system and native plant reproduction. In large agricultural areas like the California Central Valley, pollinators are at risk due to pesticide use and loss of habitat. Permanent plantings are an important conservation technique to stabilize pollinator populations for the long term (M’Gonigle, 2015). Installing permanent pollinator plantings has been shown to increase species abundance through increasing rates of wild pollinator persistence and colonization (M’Gonigle, 2015). A major roadblock in the adoption of pollinator plantings by farmers is linked to the establishment costs and return on investment (ROI). Pollinator plantings have been shown to have a faster ROI when pollinator benefits by native bees are included in the calculation (Morandin, 2016). Studies in almonds have also shown that fruit set improved on the edges of almond orchards with increased surrounding natural habitat, FINAL STUDY REPORT Lockeford Plant Materials Center, Lockeford, CA
NRCS Plant Materials Centers (PMC) are conducting evaluations on local commercially available pollinator mixes in order to advise NRCS field offices and the public on the relative value of these mixes in providing pollinator forage, as well as suitability to their location, or within their farming operation. The objective of this study was to evaluate commercially available seed mixtures for adaptation, production of suitable pollinator habitat, and integration into almond orchard operations in California’s Central Valley. A total of eight different commercially available pollinator mixes were evaluated (four almond mixes and four Central Valley mixes). Canopy cover, percent bloom and bloom duration, and bee visitation were observed and recorded in order to evaluate plant species persistence and forage quality for pollinators. The almond pollinator mixes were successful in providing a variety of forage resources for pollinators during the appropriate window for integration into an almond orchard operation. The Central Valley pollinator mixes all provided foraging resources and potential habitat for native pollinators if left undisturbed. These mixes all had high seed costs when compared to the almond pollinator mixes; however, they are meant to be long term investments that provide pollinators with habitat for several years and require little to no maintenance. All of the pollinator mixes evaluated would be appropriate for attracting a variety of pollinators and increasing pollinator habitat if applied in the appropriate setting and considerations of site suitability, seedbed preparation, and competing vegetation are taken into account.
INTRODUCTION The commercial seed industry is marketing ready-made seed mixes appropriate to attract pollinators and provide pollinator habitat. However, these mixes may not perform equally in different regions of the country, or even different regions of the state of California. Concerns are that some commercial mixes may contain plant species that can become invasive, the mix may not contain appropriate species to provide pollinator forage throughout the year, or that the mix may not contain plant species that provide forage to the target pollinators. Restoring pollinator habitat and communities is important in California because pollinators play a huge role in agricultural system and native plant reproduction. In large agricultural areas like the California Central Valley, pollinators are at risk due to pesticide use and loss of habitat. Permanent plantings are an important conservation technique to stabilize pollinator populations for the long term (M’Gonigle, 2015). Installing permanent pollinator plantings has been shown to increase species abundance through increasing rates of wild pollinator persistence and colonization (M’Gonigle, 2015). A major roadblock in the adoption of pollinator plantings by farmers is linked to the establishment costs and return on investment (ROI). Pollinator plantings have been shown to have a faster ROI when pollinator benefits by native bees are included in the calculation (Morandin, 2016). Studies in almonds have also shown that fruit set improved on the edges of almond orchards with increased surrounding natural habitat,
FINAL STUDY REPORT Lockeford Plant Materials Center, Lockeford, CA
indicating that wild pollinators can help with pollination services in addition to managed honey bees (Klein, 2012). Pollinator mixes can also be of great benefit when used within agricultural systems as cover crops. Not only do these plantings provide soil health benefits by increasing organic matter, water infiltration, and nutrient availability, they also provide an additional forage source to honey bees and native bees. The results from a sunflower study indicate that allowing wild plants to grow within a crop field ensures floral resources for a diversity of pollinators in areas that are isolated from natural habitat (Carvalheiro, 2011). Also, since pollinators usually require resources for longer periods of time than crop flowering, enhancing farmland heterogeneity provides them with a diversity of floral resources over a longer period of time and a larger area (Garibaldi, 2014). Enhancing practices for wild pollinators will also likely benefit and increase resources for managed honey bees and help to sustain colony health (Garibaldi, 2014). The objective of this study was to evaluate commercially available seed mixtures for adaptation, integration into almond orchard operations, and production of suitable pollinator habitat in California’s Central Valley. Pollinator plantings include a variety of plant species and provide near continuous floral resources for pollinators throughout the growing season. Forage habitat for pollinators either adjacent to, or within a pollinator dependent crop can lead to increased yields due to assistance from wild pollinators, in addition to honey bees. This can affect the ROI on seed and planting establishment, insuring against loss of managed pollinators and positively impacting the surrounding environment (Blaauw, 2014). Many NRCS Plant Materials Centers are conducting evaluations on local commercially available pollinator mixes in order to be able to advise NRCS field offices and the public on the commercial mixes relative value in providing pollinator forage, as well as suitability to their location or within their farming operation.
MATERIALS AND METHODS The commercial pollinator mix trial was conducted at the NRCS Plant Materials Center (CAPMC) in Lockeford, California. The CAPMC is located on the eastern side of the San Joaquin Valley in central California and sits on a historical flood plain on the east bank of the Mokelume River. The soil series is a Columbia fine sandy loam on 0-2 percent slopes. It is a very deep, well-drained soil with pH ranging from moderately acid to slightly alkaline. The average annual maximum temperature in this area is 73.6°F and minimum temperature is 46°F. The average annual precipitation is 17.24 inches, mainly occurring between the months of December and March (NOAA, 2016). 2015 and 2016 were two very different years in terms of weather and precipitation. In this area, in 2015 the total annual precipitation was 10.7 inches (October 1 – June 28, 2015), while in 2016 the total annual precipitation was 16.7 inches (October 1 – June 28, 2016). This increase in precipitation may account for some of the differences in data results from one year to the next within plots. A total of eight different commercially available pollinator mixes were evaluated. Four of the plots were almond pollinator mixes and four were Central Valley pollinator mixes (Table 1). The trial location was set up in Field 2 at the CAPMC, which had previously been a fallow area (Figure 1). The area was disked and cultipacked prior to planting. Weeds controlled over the past year include common annual weeds, such as filaree, Erodium spp.; redmaids, Calandrinia ciliata; hairy fleabane, Conyza bonariensis; and horseweed, C. canadensis. There were no annual grass weeds prior to planting. The plots were planted with a belly grinder on November 25, 2014 and rolled after planting. They were set up as 10 by 100 foot rectangles, running from north-east to south-west with 10 foot buffers between plots (Figures 1 & 2). The buffer areas were planted with a drought tolerant grass mixture (Lolium
3
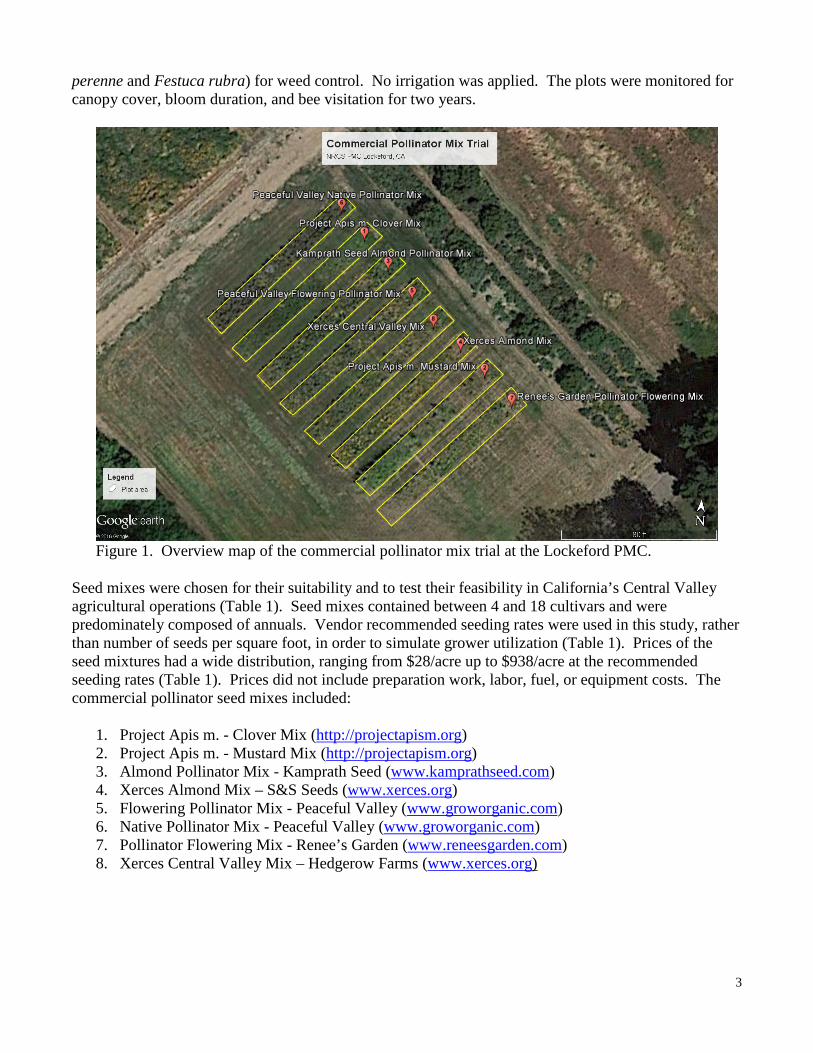
perenne and Festuca rubra) for weed control. No irrigation was applied. The plots were monitored for canopy cover, bloom duration, and bee visitation for two years.
Figure 1. Overview map of the commercial pollinator mix trial at the Lockeford PMC.
Seed mixes were chosen for their suitability and to test their feasibility in California’s Central Valley agricultural operations (Table 1). Seed mixes contained between 4 and 18 cultivars and were predominately composed of annuals. Vendor recommended seeding rates were used in this study, rather than number of seeds per square foot, in order to simulate grower utilization (Table 1). Prices of the seed mixtures had a wide distribution, ranging from $28/acre up to $938/acre at the recommended seeding rates (Table 1). Prices did not include preparation work, labor, fuel, or equipment costs. The commercial pollinator seed mixes included:
Figure 2. Commercial pollinator plot layout. Numbers are in reference to the corresponding seed mix list above.
Maintenance and Monitoring Evaluations were collected monthly during the growing season at each plot in order to assess performance and suitability of the different seed mixes to California’s Central Valley climate and conditions. Canopy cover and plant stand, percent bloom and bloom duration, and bee visitation were recorded in order to evaluate species persistence and forage quality for pollinators. Canopy cover was documented to record frequency of weeds, as well as seed germination. Percent bloom was recorded monthly to collect data on bloom duration and flower diversity for pollinator forage at different times during the season. Canopy cover and plant stand were evaluated by conducting 50 foot point transects across each plot and recording ground cover type at foot intervals. Ground cover evaluations started in February and continued through June during both the 2015 and 2016 seasons. Percent bloom was evaluated in a specified area using percent cover estimates. These observations were averaged over five data points for each species in bloom, within each plot. Photos were also taken of each plot at the time of evaluation. Bloom duration was also recorded in order to document early, middle and late season pollen and nectar availability. Both native and honey bee visitation was recorded using the Streamlined Bee Monitoring Protocol for Assessing Pollinator Habitat. This protocol is designed to assess bee diversity and abundance in pollinator habitat plantings (Ward, 2014). Assessments were conducted twice per year at each commercial pollinator habitat plot. At each site, two 100 foot transects were walked over a period of 7.5 minutes, while observing the number of native and honey bees visiting flowers in a 3 foot wide swath. This data can be coupled with the bloom assessment data to look at flower species attractiveness, by comparing the dominant flowers in bloom to number of native or honey bees visits. The Streamlined Bee Monitoring Protocol for Assessing Pollinator Habitat protocol states that the number of bees counted using this method is positively correlated with the diversity of bees at the site, and differences in bee diversity will likely reflect differences in habitat quality among sites (Ward, 2014).
46 1 3 5 8 2 7
5
Table 1. The commercial pollinator seed mix species composition, their recommended seeding rates, and seed cost.
1 2 3 4 5 6 7 8
Species Common Name
Project Apis m. Clover
Mix
Project Apis m. Mustard
Mix
Kamprath Seed
Almond Pollinator
Mix
Xerces Almond
Mix
Peaceful Valley
Flowering Pollinator
Mix
Peaceful Valley Native
Pollinator Mix
Renee's Garden
Pollinator Flowering
Mix
Xerces Central Valley
Mix
Asclepias fascicularis Narrow leaf mikweed xBrassica juncea Nemfix mustard xBrassica rapa Canola xCalandula sp Calandula x xCallistephus chinensis Chinese aster x
Centaurea cyanusCornflower 'polka dot mix'
x
Chrysanthemum paludosum
Creeping da isy x
Clarkia sp Clarkia sp. xClarkia unguiculata Elegant clarkia xCoreopis tinctoria Pla ins coreops is xCollinsia heterophyllus Chinese houses x x x xCynoglossum amabile Chinese forget-me-not xEschscholzia californica
Cal i fornia poppy x x x x x
Gilia capitata Globe gi l ia x x x x x xGilia tricolor Bird's eyes x xGrindelia camporum Common gumplant x xHelianthus anuus dwarf
Sunflower dwarf x x
Heliathus bolanderi Bolander's sunflower xLasthenia californica Dwarf goldfields xLayia platyglossa Tidy tips x x x xLobularia maritima Sweet a lyssum x x x xLupinus bicolor Miniature lupine xLupinus densiflorus Golden lupine x x xLupinus formosus Summer lupine xLupinus succulentus Arroyo lupine x x x xMalcolmia maritima Virginia s tock xMonardia citriodora Lemon mint xNemophila maculata Fivespot x x x xNemophila menziesii Baby blue eyes x x x x x xOenothera elata Evening primrose x xPapaver rhoeas Shirley poppy xPhacelia californica Cal i fornia phacel ia xPhacelia campanularia Cal i fornia bluebel l x xPhacelia ciliata Great va l ley phacel ia xPhacelia tanacetifolia Lacy phacel ia x x x x xRaphanus sativus Daikon radish xReseda odorata Sweet mignonette xSinapsis alba Braco white mustard xTrifolium hirtum Hykon rose clover x xTrifolium incarnatum Crimson clover x x xTrifolium michelianum Frontier ba lansa clover x xTrifolium resupinatum Pers ian Nitro clover x x
SEED MIXES COMPOSITION Almond Mixes Central Valley Mixes
6
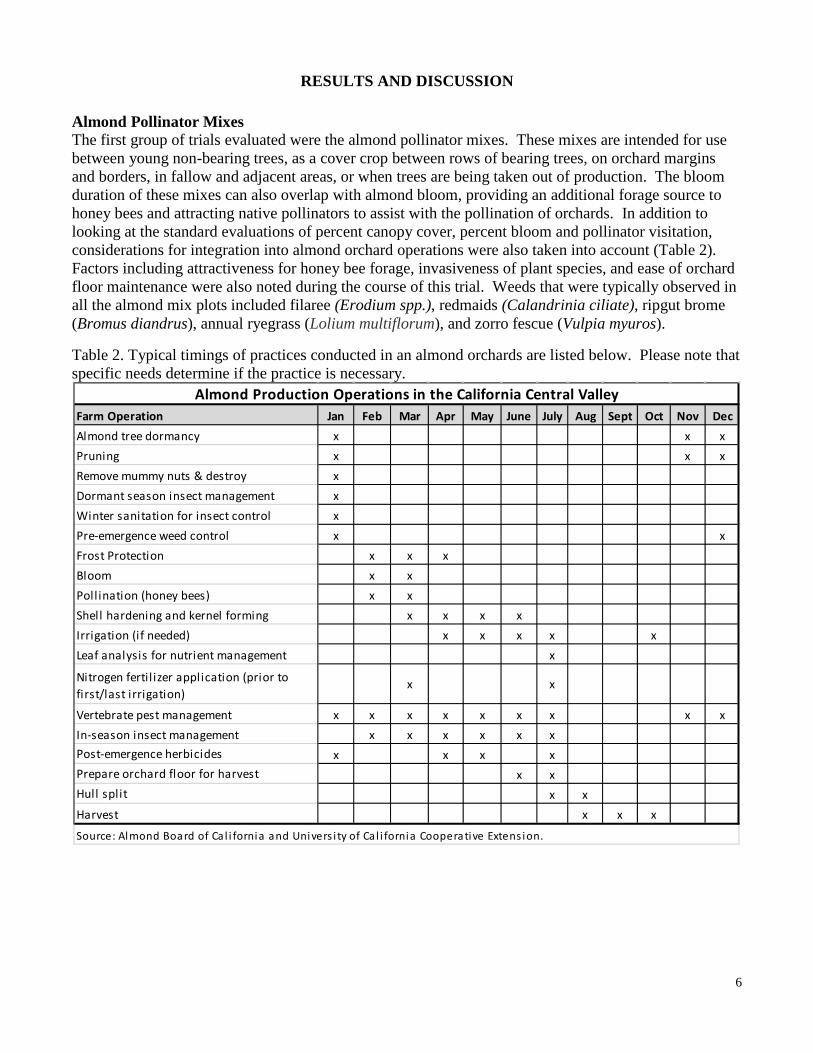
RESULTS AND DISCUSSION Almond Pollinator Mixes The first group of trials evaluated were the almond pollinator mixes. These mixes are intended for use between young non-bearing trees, as a cover crop between rows of bearing trees, on orchard margins and borders, in fallow and adjacent areas, or when trees are being taken out of production. The bloom duration of these mixes can also overlap with almond bloom, providing an additional forage source to honey bees and attracting native pollinators to assist with the pollination of orchards. In addition to looking at the standard evaluations of percent canopy cover, percent bloom and pollinator visitation, considerations for integration into almond orchard operations were also taken into account (Table 2). Factors including attractiveness for honey bee forage, invasiveness of plant species, and ease of orchard floor maintenance were also noted during the course of this trial. Weeds that were typically observed in all the almond mix plots included filaree (Erodium spp.), redmaids (Calandrinia ciliate), ripgut brome (Bromus diandrus), annual ryegrass (Lolium multiflorum), and zorro fescue (Vulpia myuros).
Table 2. Typical timings of practices conducted in an almond orchards are listed below. Please note that specific needs determine if the practice is necessary.
Farm Operation Jan Feb Mar Apr May June July Aug Sept Oct Nov DecAlmond tree dormancy x x xPruning x x xRemove mummy nuts & destroy xDormant season insect management xWinter sanitation for insect control xPre-emergence weed control x xFrost Protection x x xBloom x xPollination (honey bees) x xShell hardening and kernel forming x x x xIrrigation (if needed) x x x x xLeaf analysis for nutrient management x
Nitrogen ferti l izer application (prior to first/last irrigation)
x x
Vertebrate pest management x x x x x x x x xIn-season insect management x x x x x xPost-emergence herbicides x x x xPrepare orchard floor for harvest x xHull split x xHarvest x x x
Almond Production Operations in the California Central Valley
Source: Almond Board of Ca l i fornia and Univers i ty of Ca l i fornia Cooperative Extens ion.
7
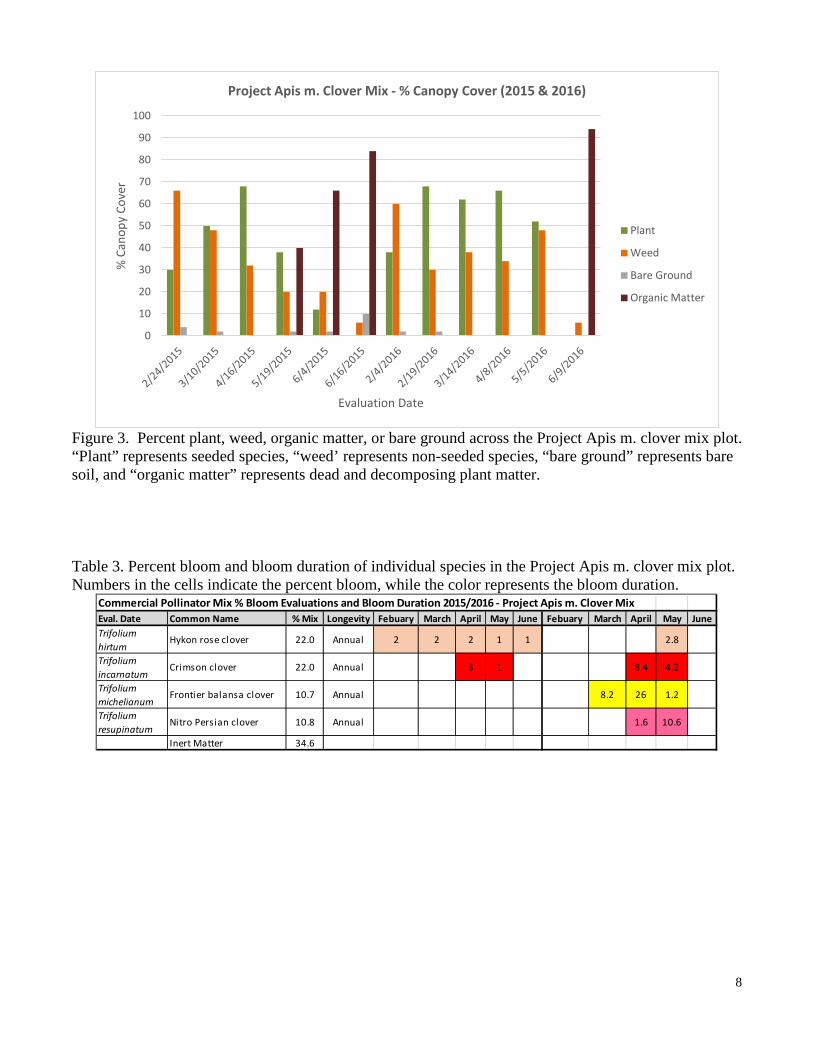
Project Apis m. Clover Mix The first almond pollinator plot evaluated was the Project Apis m. clover mix. This mix is intended to be used as a cover crop between bearing or young non-bearing trees, or on orchard margins and borders. This mix is composed of four clover species, which are listed in Table 3. The seed cost of this mix was $52/acre at the recommended seeding rate (Table 1). In February of 2015 and 2016, the mix was slow to establish and the plot appeared to be dominated by weeds (Figure 3). However, by March the percent plant cover quickly increased and outcompeted the weeds through the remainder of the growing season. During both years, less than 10% bare ground was observed (Figures 3 & 4). A higher plant density was observed during 2016 when compared to 2015, which indicated a good reseeding rate for this mix. Only two species (Hykon rose and Crimson clover) appeared to bloom in 2015, but all four species had bloom observations in 2016 (Table 3). Peak bloom was reached in May and by the beginning of June, only organic matter/dead plant material was recorded in the plot. Native and honey bee visitation and forage attractiveness is shown in Figures 19 and 20. For this mix, the highest bee visitations (both honey and native) were recorded in May 2016, which was also during a period when all four clover species were in bloom (Table 3). Honey bees also had a higher number of visits compared to native bees. The Project Apis m. clover mix had a relatively low seed cost. This mix reseeded well, so once established and if allowed to reseed, this mix would reduce in cost over time. It also provided good ground coverage, successful weed suppression and was attractive to both native and managed pollinators as a forage source during the appropriate time. The plant growth cycle and bloom duration would fit well into the management program of an almond grower. Orchard floors are typically mowed down and cleaned up in June or July (Table 2), at which point the mix would be completely dried up, with only fine material remaining that would decompose rapidly. This would result in a nice clean floor in preparation for harvest later in the season. Clovers are shade tolerant and can also be mowed repeatedly during the growing season to reduce risk of frost. Nitrogen fixation by clover can also be a benefit to the orchard, increasing plant available N for the next year and reducing fertilizer inputs. This mix does appear to require more water than some of the other almond pollinator mixes, so it may struggle if there is not enough rainfall or some irrigation available during dry years.
8
Figure 3. Percent plant, weed, organic matter, or bare ground across the Project Apis m. clover mix plot. “Plant” represents seeded species, “weed’ represents non-seeded species, “bare ground” represents bare soil, and “organic matter” represents dead and decomposing plant matter. Table 3. Percent bloom and bloom duration of individual species in the Project Apis m. clover mix plot. Numbers in the cells indicate the percent bloom, while the color represents the bloom duration.
Commercial Pollinator Mix % Bloom Evaluations and Bloom Duration 2015/2016 - Project Apis m. Clover MixEval. Date Common Name % Mix Longevity Febuary March April May June Febuary March April May JuneTrifolium hirtum
Hykon rose clover 22.0 Annual 2 2 2 1 1 2.8
Trifolium incarnatum
Crimson clover 22.0 Annual 3 1 8.4 4.2
Trifolium michelianum
Frontier balansa clover 10.7 Annual 8.2 26 1.2
Trifolium resupinatum
Nitro Persian clover 10.8 Annual 1.6 10.6
Inert Matter 34.6
9
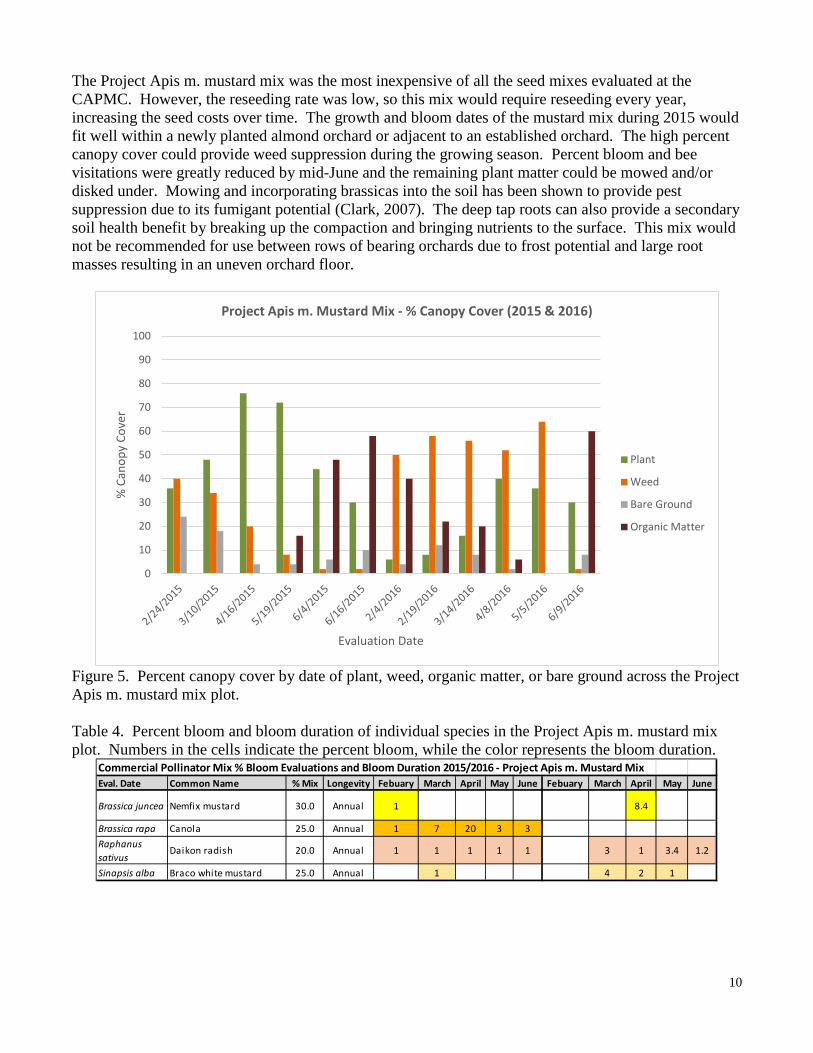
Figure 4. Photos of the Project Apis m. clover mix taken on 4/8/16 (left) and 6/9/16 (right). Project Apis m. Mustard Mix The second almond pollinator trial evaluated was the Project Apis m. mustard mix. This mix is intended for use between young non-bearing trees, on orchard margins and borders, in fallow and adjacent areas, or when trees are being taken out of production. This mix is composed of radish, canola, and two species of mustard as shown in Table 4. This mix was the cheapest in price across the evaluated seed mixes costing $28/acre at the recommended seeding rate (Table 1). During 2015, this mix had a range of 45-75% plant canopy cover throughout the growing season (Figure 5). In February and March of 2015, the percentage of weed cover was 30-40% and bare ground was 17-20%, indicating that the plants took some time to establish (Figure 5). However, once plants were established, the weed pressure was greatly reduced during the first year (Figures 5 & 6). The highest density of seeded plants was recorded during the months of April and May during both years. By June, the plant stand decreased and was replaced with organic matter. During 2016, a low reseeding rate and low plant cover allowed for more weed encroachment, resulting in 50-60% of the canopy cover to be weeds. ‘Lana’ vetch, ‘Blando’ brome, and fiddleneck were present in this plot in addition to the other weeds typically recorded in the almond mixes. Volunteer phacelia was also observed in the plot during the second year. Bloom duration was throughout the spring, starting in February or March and blooming until June in both years (Table 4). Bloom was observed in all four species during the first year. During 2016, canola was not observed. Daikon radish had the best persistence throughout both seasons. Honey bees were more abundant foragers than native bees in the mustard mix (Figures 19 & 20). The visitation counts were high during the months of April 2015 and May 2016, which corresponded to the major bloom timing of canola and radish the first year and radish and mustards the second year (Table 4).
10
The Project Apis m. mustard mix was the most inexpensive of all the seed mixes evaluated at the CAPMC. However, the reseeding rate was low, so this mix would require reseeding every year, increasing the seed costs over time. The growth and bloom dates of the mustard mix during 2015 would fit well within a newly planted almond orchard or adjacent to an established orchard. The high percent canopy cover could provide weed suppression during the growing season. Percent bloom and bee visitations were greatly reduced by mid-June and the remaining plant matter could be mowed and/or disked under. Mowing and incorporating brassicas into the soil has been shown to provide pest suppression due to its fumigant potential (Clark, 2007). The deep tap roots can also provide a secondary soil health benefit by breaking up the compaction and bringing nutrients to the surface. This mix would not be recommended for use between rows of bearing orchards due to frost potential and large root masses resulting in an uneven orchard floor.
Figure 5. Percent canopy cover by date of plant, weed, organic matter, or bare ground across the Project Apis m. mustard mix plot. Table 4. Percent bloom and bloom duration of individual species in the Project Apis m. mustard mix plot. Numbers in the cells indicate the percent bloom, while the color represents the bloom duration.
Commercial Pollinator Mix % Bloom Evaluations and Bloom Duration 2015/2016 - Project Apis m. Mustard MixEval. Date Common Name % Mix Longevity Febuary March April May June Febuary March April May June
Sinapsis alba Braco white mustard 25.0 Annual 1 4 2 1
11
Figure 6. Photos of Project Apis m. mustard mix taken on 4/16/15 (left) and 6/16/15 (right). Kamprath Seed Almond Pollinator Mix The Kamprath Seed almond pollinator mix is intended for use as a cover crop between bearing or young non-bearing trees, or on orchard margins and borders. This mix includes 18 different species and has the largest variety of species of all the mixes evaluated at the CAPMC (Table 5). The majority of the mix is composed of annuals with one biennial species (Evening primrose). The seed cost of this mix was $248/acre at the recommended seeding rate (Table 1). The Kamprath Seed almond pollinator mix had good establishment during the first year (2015), with 50-80% plant coverage throughout the growing season (Figure 7). During the second year, weeds started to encroach and had a higher percentage of ground cover during March, April, and May of 2016 than the seeded plant species (Figures 7 & 8). In June of both years, the majority of the plants had dried down and the largest percent cover was from organic matter. Due to the huge diversity in this mix, the bloom duration typically lasted from February through June with multiple species in bloom (Table 5). This long bloom duration allowed managed and wild pollinators to forage on a wide variety of wildflowers throughout the 2015 and 2016 growing seasons. Some species, like lacy phacelia, had a very long bloom duration that lasted for several months, while other species, like arroyo lupine, only bloomed for one or two months (Table 5). There were also several species that bloomed in 2015, but did not emerge in 2016 (calandula, globe gilia, dwarf sunflower, sweet alyssum, five spot, and evening primrose), or were only observed in 2016 (Chinese houses and three clover cultivars). Golden lupine was not recorded in either growing season. Kamprath Seed pollinator mix had one of the highest honey bee and native bee visitation counts of any pollinator mix evaluated (Figures 19 & 20). Both of these high visitation rates occurred in May of 2016 when seven species of wildflowers were in bloom, including lacy phacelia and birds eyes (Table 5). The high visitation rate during this time indicates that these plant species were very attractive to both wild and managed pollinators and could be a good additional forage source to encourage pollinator diversity.
12
The Kamprath Seed almond mix was the most expensive almond mix seed, but this would reduce in cost over time if allowed to reseed. This mix was attractive to wide range of pollinators and was able to provide a variety of forage resources for extended periods of time during the growing season. This mix would work well in an almond orchard operation, due to bloom duration, forage diversity, and plant desiccation timing. This mix is recommended to be planted on select rows within an orchard or on orchard edges to bring in native pollinators and beneficial insects. This mix had some weed encroachment during the second year, implying potential weed problems in the future. Mowing this mix early could help to knock weeds back and decrease frost potential. Weed monitoring of this mix may be necessary over time to ensure that weeds stay at a manageable level.
Figure 7. Percent canopy cover by date of plant, weed, organic matter, or bare ground across the Kamprath Seed almond pollinator mix plot.
Table 5. Percent bloom and bloom duration of individual species in the Kamprath Seed almond pollinator mix plot. Numbers in the cells indicate the percent bloom, while the color represents the bloom duration.
Commercial Pollinator Mix % Bloom Evaluations and Bloom Duration 2015/2016 - Kamprath Seed Almond Pollinator Mix Eval. Date Common Name % Mix Longevity Febuary March April May June Febuary March April May JuneCalandula sp Calandula 5.4 Annual/Perennial 1Collinsia heterophyllus Chinese houses
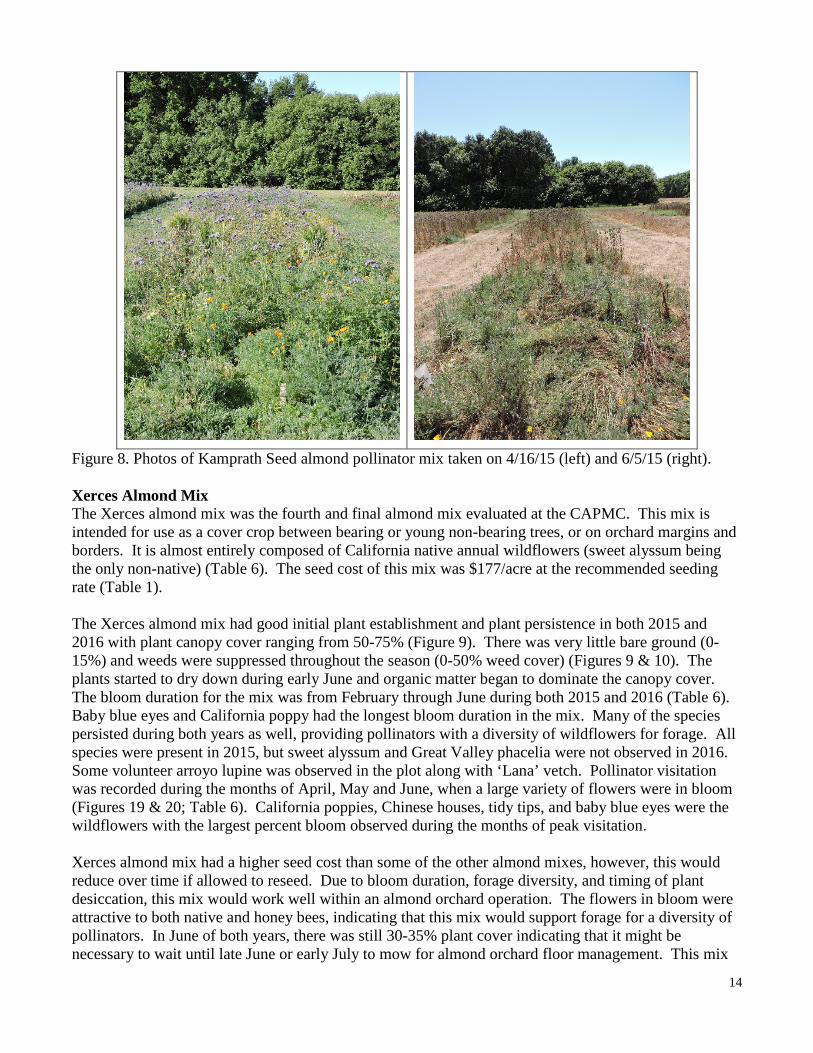
Figure 8. Photos of Kamprath Seed almond pollinator mix taken on 4/16/15 (left) and 6/5/15 (right). Xerces Almond Mix The Xerces almond mix was the fourth and final almond mix evaluated at the CAPMC. This mix is intended for use as a cover crop between bearing or young non-bearing trees, or on orchard margins and borders. It is almost entirely composed of California native annual wildflowers (sweet alyssum being the only non-native) (Table 6). The seed cost of this mix was $177/acre at the recommended seeding rate (Table 1). The Xerces almond mix had good initial plant establishment and plant persistence in both 2015 and 2016 with plant canopy cover ranging from 50-75% (Figure 9). There was very little bare ground (0-15%) and weeds were suppressed throughout the season (0-50% weed cover) (Figures 9 & 10). The plants started to dry down during early June and organic matter began to dominate the canopy cover. The bloom duration for the mix was from February through June during both 2015 and 2016 (Table 6). Baby blue eyes and California poppy had the longest bloom duration in the mix. Many of the species persisted during both years as well, providing pollinators with a diversity of wildflowers for forage. All species were present in 2015, but sweet alyssum and Great Valley phacelia were not observed in 2016. Some volunteer arroyo lupine was observed in the plot along with ‘Lana’ vetch. Pollinator visitation was recorded during the months of April, May and June, when a large variety of flowers were in bloom (Figures 19 & 20; Table 6). California poppies, Chinese houses, tidy tips, and baby blue eyes were the wildflowers with the largest percent bloom observed during the months of peak visitation. Xerces almond mix had a higher seed cost than some of the other almond mixes, however, this would reduce over time if allowed to reseed. Due to bloom duration, forage diversity, and timing of plant desiccation, this mix would work well within an almond orchard operation. The flowers in bloom were attractive to both native and honey bees, indicating that this mix would support forage for a diversity of pollinators. In June of both years, there was still 30-35% plant cover indicating that it might be necessary to wait until late June or early July to mow for almond orchard floor management. This mix
15
also had some weed encroachment during the second year, implying potential weed problems in the future. Monitoring and some maintenance during the season may be necessary in order to preserve the forage quality of this mix.
Figure 9. Percent canopy cover by date of plant, weed, organic matter, or bare ground across the Xerces almond mix plot. Table 6. Percent bloom and bloom duration of individual species in the Xerces almond mix plot. Numbers in the cells indicate the percent bloom, while the color represents the bloom duration.
0
10
20
30
40
50
60
70
80
90
100
% C
anop
y Co
ver
Evaluation Date
Xerces Almond Mix - % Canopy Cover (2015 & 2016)
Plant
Weed
Bare Ground
Organic Matter
Commercial Pollinator Mix % Bloom Evaluations and Bloom Duration 2015/2016 - Xerces Almond MixEval. Date Common Name % Mix Longevity Febuary March April May June Febuary March April May JuneCollinsia heterophyllus Chinese houses 12.0 Annual 1 5 5.6
Figure 10. Photos of Xerces almond mix taken on 4/16/15 (left) and 6/5/15 (right). Central Valley Pollinator Mixes The Central Valley pollinator mixes were the second group of mixes evaluated in this trial. There were four mixes in this group. These mixes are intended to be used as permanent plantings along field borders, areas adjacent to orchards and vineyards, fallow areas, or when land has been taken out of production. These seed mixes are more expensive, but are intended to be permanent plantings that are long term investments. Typical site preparation costs for establishing wildflower pollinator plantings are approximately $31.40 per 1000 sq. ft. (materials and labor), assuming one year of site preparation and six herbicide applications (Jessa Kay Cruz, The Xerces Society for Invertebrate Conservation, personal communication, 8/18/16). Typical pollinator planting maintenance expenses are approximately $210.00/year per 1000 sq. ft. (labor only; tools and equipment cost not included) (Jessa Kay Cruz, The Xerces Society for Invertebrate Conservation, personal communication, 8/18/16).
These four mixes were assessed for forage attractiveness to native bees, as well as suitability as pollinator habitat. They were also evaluated for ease of establishment, drought tolerance, and weed encroachment potential to assess the long term viability of these mixes. Weeds that were typically observed in the Central Valley mix plots included filaree (Erodium spp.), redmaids (Calandrinia ciliate), ripgut brome (Bromus diandrus), and zorro fescue (Vulpia myuros).
Peaceful Valley Flowering Pollinator Mix Peaceful Valley flowering pollinator mix was one of the Central Valley mixes evaluated. This mix is composed of 14 different species, both native and non-native (Table 7). The majority of the species were annuals with one biennial species (Evening primrose). The seed cost of the mix was $654/acre at the recommended seeding rate (Table 1).
17
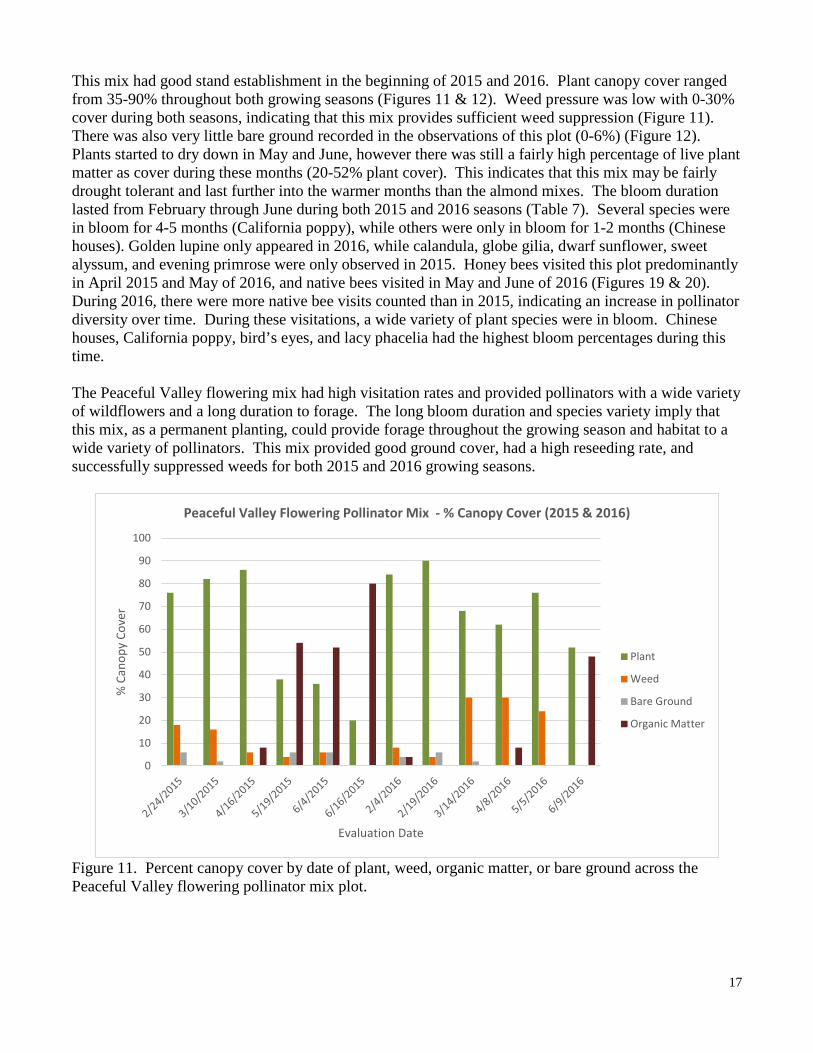
This mix had good stand establishment in the beginning of 2015 and 2016. Plant canopy cover ranged from 35-90% throughout both growing seasons (Figures 11 & 12). Weed pressure was low with 0-30% cover during both seasons, indicating that this mix provides sufficient weed suppression (Figure 11). There was also very little bare ground recorded in the observations of this plot (0-6%) (Figure 12). Plants started to dry down in May and June, however there was still a fairly high percentage of live plant matter as cover during these months (20-52% plant cover). This indicates that this mix may be fairly drought tolerant and last further into the warmer months than the almond mixes. The bloom duration lasted from February through June during both 2015 and 2016 seasons (Table 7). Several species were in bloom for 4-5 months (California poppy), while others were only in bloom for 1-2 months (Chinese houses). Golden lupine only appeared in 2016, while calandula, globe gilia, dwarf sunflower, sweet alyssum, and evening primrose were only observed in 2015. Honey bees visited this plot predominantly in April 2015 and May of 2016, and native bees visited in May and June of 2016 (Figures 19 & 20). During 2016, there were more native bee visits counted than in 2015, indicating an increase in pollinator diversity over time. During these visitations, a wide variety of plant species were in bloom. Chinese houses, California poppy, bird’s eyes, and lacy phacelia had the highest bloom percentages during this time. The Peaceful Valley flowering mix had high visitation rates and provided pollinators with a wide variety of wildflowers and a long duration to forage. The long bloom duration and species variety imply that this mix, as a permanent planting, could provide forage throughout the growing season and habitat to a wide variety of pollinators. This mix provided good ground cover, had a high reseeding rate, and successfully suppressed weeds for both 2015 and 2016 growing seasons.
Figure 11. Percent canopy cover by date of plant, weed, organic matter, or bare ground across the Peaceful Valley flowering pollinator mix plot.
Table 7. Percent bloom and bloom duration of individual species in the Peaceful Valley flowering pollinator mix plot. Numbers in the cells indicate the percent bloom, while the color represents the bloom duration.
Commercial Pollinator Mix % Bloom Evaluations and Bloom Duration 2015/2016 - Peaceful Valley Flowering Pollinator Mix Eval. Date Common Name % Mix Longevity Febuary March April May June Febuary March April May June
Calandula sp Calandula 11.0 Annual/Perennial 1
Collinsia heterophyllus Chinese houses 4.0 Annual 1 0.5 4
Lupinus densiflorus Golden lupine 11.0 Annual 2.6 0.5
Lupinus succulentus
Arroyo lupine 33.0 Annual 1 1 1 0.8 1.6 0.4
Nemophila maculata
Five spot 5.0 Annual 1 1 0.2
Nemophila menziesii
Baby blue eyes 6.0 Annual 1 1 1 7 4.8
Oenothera elata Evening primrose 3.0 Biennial 1
Phacelia tanacetifolia
Lacy phacelia 3.0 Annual 1 3 1 6.6 19 2
19
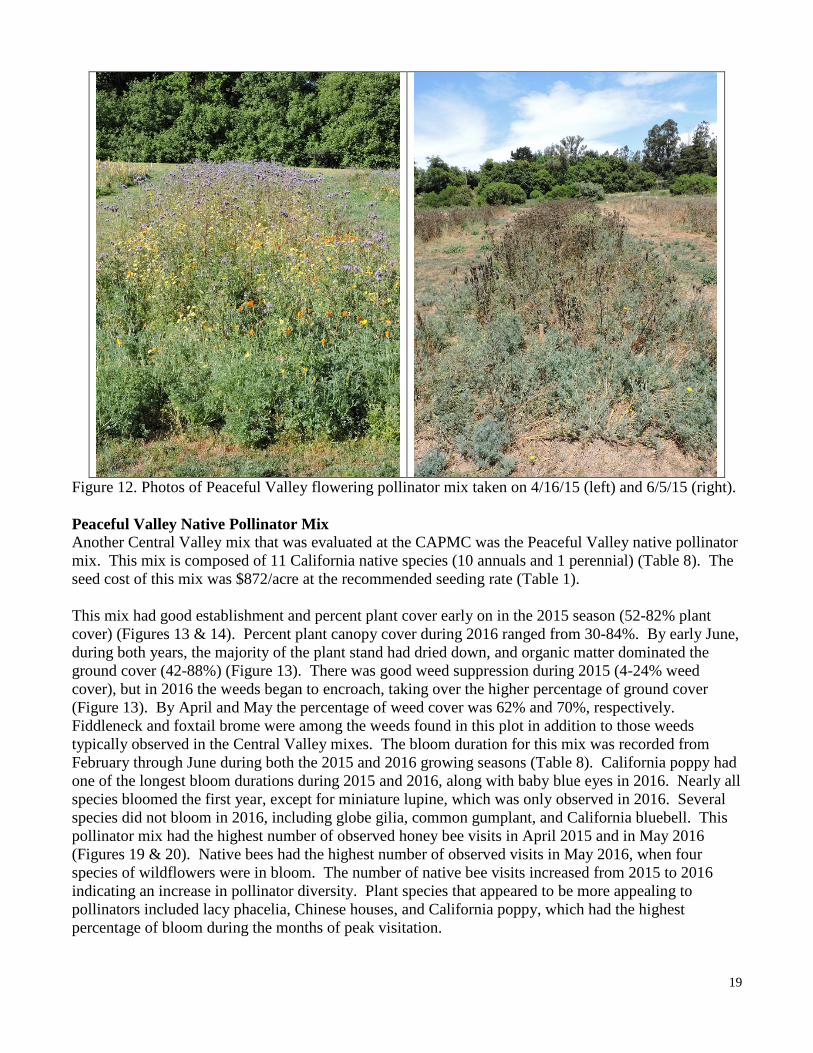
Figure 12. Photos of Peaceful Valley flowering pollinator mix taken on 4/16/15 (left) and 6/5/15 (right). Peaceful Valley Native Pollinator Mix Another Central Valley mix that was evaluated at the CAPMC was the Peaceful Valley native pollinator mix. This mix is composed of 11 California native species (10 annuals and 1 perennial) (Table 8). The seed cost of this mix was $872/acre at the recommended seeding rate (Table 1). This mix had good establishment and percent plant cover early on in the 2015 season (52-82% plant cover) (Figures 13 & 14). Percent plant canopy cover during 2016 ranged from 30-84%. By early June, during both years, the majority of the plant stand had dried down, and organic matter dominated the ground cover (42-88%) (Figure 13). There was good weed suppression during 2015 (4-24% weed cover), but in 2016 the weeds began to encroach, taking over the higher percentage of ground cover (Figure 13). By April and May the percentage of weed cover was 62% and 70%, respectively. Fiddleneck and foxtail brome were among the weeds found in this plot in addition to those weeds typically observed in the Central Valley mixes. The bloom duration for this mix was recorded from February through June during both the 2015 and 2016 growing seasons (Table 8). California poppy had one of the longest bloom durations during 2015 and 2016, along with baby blue eyes in 2016. Nearly all species bloomed the first year, except for miniature lupine, which was only observed in 2016. Several species did not bloom in 2016, including globe gilia, common gumplant, and California bluebell. This pollinator mix had the highest number of observed honey bee visits in April 2015 and in May 2016 (Figures 19 & 20). Native bees had the highest number of observed visits in May 2016, when four species of wildflowers were in bloom. The number of native bee visits increased from 2015 to 2016 indicating an increase in pollinator diversity. Plant species that appeared to be more appealing to pollinators included lacy phacelia, Chinese houses, and California poppy, which had the highest percentage of bloom during the months of peak visitation.
20
The Peaceful Valley native pollinator mix had a long bloom duration and a high visitation rate throughout 2015 and 2016 implying that it could provide forage for a variety of pollinators throughout the growing season. It also has the potential to provide suitable pollinator habitat if left undisturbed. Weed encroachment during the second year could potentially become a problem if this mix were to be used for long term habitat. Selective herbicide use or hand weeding may be necessary in order to maintain a high native species population resulting in a cost increase due to maintenance of this mix.
Figure 13. Percent canopy cover by date of plant, weed, organic matter, or bare ground across the Peaceful Valley native pollinator mix plot.
Table 8. Percent bloom and bloom duration of individual species in the Peaceful Valley native pollinator mix. Numbers in the cells indicate the percent bloom, while the color represents the bloom duration.
Figure 14. Photos of Peaceful Valley native pollinator mix taken on 4/16/15 (left) and 6/5/15 (right).
Commercial Pollinator Mix % Bloom Evaluations and Bloom Duration 2015/2016 - Peaceful Valley Native Pollinator MixEval. Date Common Name % Mix Longevity Febuary March April May June Febuary March April May JuneCollinsia heterophyllus
Renee’s Garden Pollinator Flowering Mix Renee’s Garden pollinator flowering mix is composed of 16 different annual species. The majority of the species are not native to California (Table 9). This was the most expensive mix evaluated in this trial across both the almond and Central Valley pollinator mixes. The seed cost was $938/acre at the recommended seeding rate (Table 1). Renee’s Garden pollinator flowering mix had good plant establishment during both the 2015 and 2016 seasons. Plant canopy cover ranged from 40-68% during the growing season, which was relatively low when compared to other plots in this study (Figure 15). This plot also had the highest percentage of bare ground ranging from 4-24% in both 2015 and 2016 (Figures 15 & 16). Weed suppression was maintained throughout the growing season during both years, but volunteer mustard did appear during 2016. By early June, a high percentage of the ground cover had dried down and converted to organic matter (52-68%) (Figure 15). This mix had a long bloom duration, with continuous bloom ranging from February through June (Table 9). Clarkia sp., baby blue eyes and Great Valley phacelia had the longest bloom of any plant species in this mix. Four of the species in the mix were not observed to bloom in either year. Cornflower ‘polka dot mix’ only bloomed in 2016, while five species only appeared during 2015 (Chinese aster, creeping daisy, sweet alyssum, Virginia stock, and sweet mignonette). The highest number of honey bee visits were recorded in April 2015, while the highest number of native bee visits were recorded in May 2016 (Figures 19 & 20). Native bee visits increased from 2015 to 2016 indicating an increase in pollinator diversity. During the high native bee visitation period, seven different species were in bloom. Tidy tips, clarkia sp., and globe gilia had the highest bloom percentages in May 2016. The Renee’s Garden pollinator flowering mix had the highest seed costs of all the evaluated mixes. The wide variety of wildflowers in this mix and long bloom duration imply that this mix could provide forage resources for a diversity of pollinators throughout the growing season. However, due to the high percentage of bare ground, the low percentage of plant cover, and low reseeding rate observed, this mix may not be suitable for long term pollinator habitat. The high percentage of bare ground may also be problematic in the long run, allowing for weed encroachment. This could require the use of selective herbicides or more intense management and would increase the cost of maintenance. This mix may have a better fit on a smaller scale, such as in a backyard garden, where is can be monitored and managed more easily to keep expenses at a minimum.
23
Figure 15. Percent canopy cover by date of plant, weed, organic matter, or bare ground across the Renee’s Garden pollinator flowering mix plot.
Table 9. Percent bloom and bloom duration of individual species in the Renee’s Garden pollinator flowering mix plot. Numbers in the cells indicate the percent bloom, while the color represents the bloom duration.
Commercial Pollinator Mix % Bloom Evaluations and Bloom Duration 2015/2016 - Renee's Garden Pollinator Flowering MiEval. Date Common Name % Mix Longevity Febuary March April May June Febuary March April May June
Figure 16. Photos of Renee’s Garden pollinator flowering mix taken on 4/16/15 (left) and 6/5/15 (right). Xerces Central Valley Mix Xerces Central Valley mix was the fourth Central Valley mix that was evaluated at the CAPMC. This mix was composed of 12 different California native species, including both annuals and perennials (Table 10). The seed cost of this mix was $696/acre at the recommended seeding rate (Table 1). There was good plant establishment for this mix during both 2015 and 2016. The mix had percent plant cover ranging from 32-74% throughout the growing season and suppressed weeds for the majority of the year (0-50% weed cover) (Figures 17 & 18). Weed encroachment was highest in the months of February and March of 2015, and February and May of 2016. This indicates that the mix is a little slow to emerge during the spring, but once established it can suppress weeds for the majority of the year. By late May of 2015, the plants had started to dry down and by mid-June, the percentage of ground cover was over 85% organic matter (Figure 17). However, in June of 2016, plants were still growing, indicating that this mix can be prolonged with more precipitation. This mix had a long bloom duration ranging from February through June during both 2015 and 2016 (Table 10). Continuous bloom of California poppy was observed throughout the growing season during both years. Summer lupine only appeared in 2016, while globe gilia, narrow leaf milkweed, common gumplant, and Bolander’s sunflowers only appeared in 2015. Some ‘Lana’ vetch was observed in this plot, as well as volunteer tidy tips and crimson clover. The number of honey bee visits to this plot were highest in April of 2015, when four different species were in bloom (Figures 19 & 20). During this window, golden lupine and lacy phacelia had the highest percentages of bloom (Table 10). Native bee visits were the most frequent in June of 2016 when three species were in bloom, of which elegant clarkia had the highest percent bloom during this time (Figure 19 & 20; Table 10). During 2016, there were more native bee visits than in 2015, indicating an increase in pollinator diversity.
26
The long bloom duration and wide variety of species in bloom throughout the year indicate that the Xerces Central Valley mix could provide forge sources for pollinators throughout the growing season. This mix in particular had the highest number of plants still in bloom (Elegant clarkia) late into the dry season, supplying a diversity of pollinators with forage resources when resources in other plots were diminishing (Table 10). This mix also had a high reseeding rate and provided good ground cover during both years. It appeared to suppress weeds for the majority of the year and would provide suitable pollinator habitat if left undisturbed.
Figure 17. Percent canopy cover by date of plant, weed, organic matter, or bare ground across the Xerces Central Valley mix plot.
0
10
20
30
40
50
60
70
80
90
100
% C
anop
y Co
ver
Evaluation Date
Xerces Central Valley Mix - % Canopy Cover (2015 &2016)
Plant
Weed
Bare Ground
Organic Matter
27
Table 10. Percent bloom and bloom duration of individual species in the Xerces Central Valley mix plot. Numbers in the cells indicate the percent bloom, while the color represents the bloom duration.
Figure 18. Photos of Xerces Central Valley mix taken on 4/16/15 (left) and 6/5/15 (right).
Commercial Pollinator Mix % Bloom Evaluations and Bloom Duration 2015/2016 - Xerces Central Valley MixEval. Date Common Name % Mix Longevity Febuary March April May June Febuary March April May June
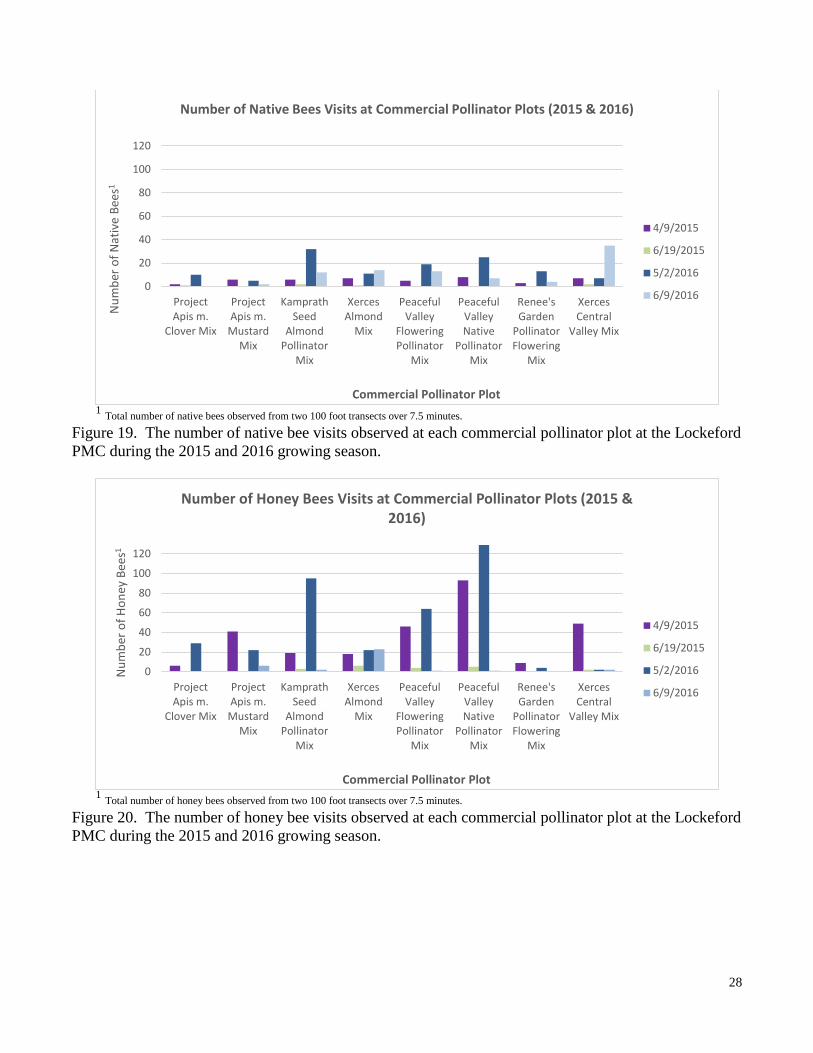
1 Total number of native bees observed from two 100 foot transects over 7.5 minutes.
Figure 19. The number of native bee visits observed at each commercial pollinator plot at the Lockeford PMC during the 2015 and 2016 growing season.
1 Total number of honey bees observed from two 100 foot transects over 7.5 minutes.
Figure 20. The number of honey bee visits observed at each commercial pollinator plot at the Lockeford PMC during the 2015 and 2016 growing season.
0
20
40
60
80
100
120
ProjectApis m.
Clover Mix
ProjectApis m.
MustardMix
KamprathSeed
AlmondPollinator
Mix
XercesAlmond
Mix
PeacefulValley
FloweringPollinator
Mix
PeacefulValleyNative
PollinatorMix
Renee'sGarden
PollinatorFlowering
Mix
XercesCentral
Valley Mix
Num
ber o
f Nat
ive
Bees
1
Commercial Pollinator Plot
Number of Native Bees Visits at Commercial Pollinator Plots (2015 & 2016)
4/9/2015
6/19/2015
5/2/2016
6/9/2016
0
20
40
60
80
100
120
ProjectApis m.
Clover Mix
ProjectApis m.
MustardMix
KamprathSeed
AlmondPollinator
Mix
XercesAlmond
Mix
PeacefulValley
FloweringPollinator
Mix
PeacefulValleyNative
PollinatorMix
Renee'sGarden
PollinatorFlowering
Mix
XercesCentral
Valley Mix
Num
ber o
f Hon
ey B
ees1
Commercial Pollinator Plot
Number of Honey Bees Visits at Commercial Pollinator Plots (2015 & 2016)
4/9/2015
6/19/2015
5/2/2016
6/9/2016
29
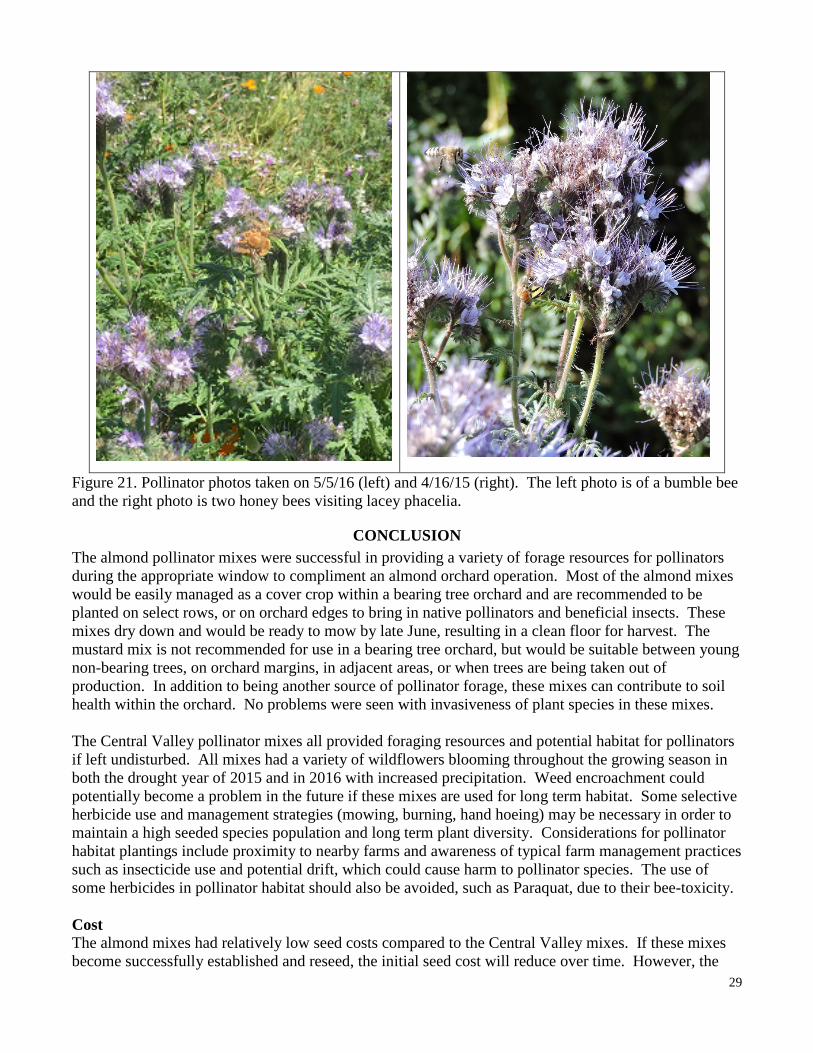
Figure 21. Pollinator photos taken on 5/5/16 (left) and 4/16/15 (right). The left photo is of a bumble bee and the right photo is two honey bees visiting lacey phacelia.
CONCLUSION The almond pollinator mixes were successful in providing a variety of forage resources for pollinators during the appropriate window to compliment an almond orchard operation. Most of the almond mixes would be easily managed as a cover crop within a bearing tree orchard and are recommended to be planted on select rows, or on orchard edges to bring in native pollinators and beneficial insects. These mixes dry down and would be ready to mow by late June, resulting in a clean floor for harvest. The mustard mix is not recommended for use in a bearing tree orchard, but would be suitable between young non-bearing trees, on orchard margins, in adjacent areas, or when trees are being taken out of production. In addition to being another source of pollinator forage, these mixes can contribute to soil health within the orchard. No problems were seen with invasiveness of plant species in these mixes. The Central Valley pollinator mixes all provided foraging resources and potential habitat for pollinators if left undisturbed. All mixes had a variety of wildflowers blooming throughout the growing season in both the drought year of 2015 and in 2016 with increased precipitation. Weed encroachment could potentially become a problem in the future if these mixes are used for long term habitat. Some selective herbicide use and management strategies (mowing, burning, hand hoeing) may be necessary in order to maintain a high seeded species population and long term plant diversity. Considerations for pollinator habitat plantings include proximity to nearby farms and awareness of typical farm management practices such as insecticide use and potential drift, which could cause harm to pollinator species. The use of some herbicides in pollinator habitat should also be avoided, such as Paraquat, due to their bee-toxicity. Cost The almond mixes had relatively low seed costs compared to the Central Valley mixes. If these mixes become successfully established and reseed, the initial seed cost will reduce over time. However, the
30
reseeding rate of the mustard mix was low, so this mix would require reseeding every year. Most of these mixes will need to be reseeded about every 4-5 years in order to bring back diversity. Other costs to take into account include maintenance costs of these plantings within and around almond orchards. These would include replanting (if necessary) and termination costs such as mowing, disking, and herbicide treatments. The Central Valley mixes all had high seed costs when compared to the almond pollinator mixes. However, they are meant to be long term investments that provide pollinators with habitat for several years and require very little maintenance. Several of the mixes had high reseeding rates, which would reduce the initial seed cost over time. Selective herbicide use may be necessary, especially in older plantings, in order to maintain a high seeded species population. This may result in an expense increase due to pesticide use and labor. Renee’s Garden pollinator flowering mix was the most expensive of all the evaluated mixes. Due to the high seed cost, low reseeding rate, and the potential maintenance and selective herbicide use, this mix may have a better fit on a small scale, such as in a backyard garden, where is can be monitored and managed more easily to keep expenses down. Bloom Duration and Bee Visitation The almond mixes were composed of both native and non-native species, which were attractive to both managed and native pollinators. All of the evaluated mixes had a long bloom duration providing forage resources for extended periods of time during the growing season. All mixes started blooming in February, but peaked around the appropriate window (April – June), which would be just after almond bloom. The Central Valley mixes were either, a mixture of native and non-native, or only native species that bloomed from February through late June. Many of the mixes had high visitation rates and a wide variety of floral resources for pollinators throughout the growing season. The Xerces Central Valley mix in particular, had the highest number of native bee visitations late into the season of 2016 due to continuous availability and high percentage of wildflower bloom. Renee’s Garden pollinator flowering mix, on the other hand, had a relatively low honey bee visitation rate when compared to the other Central Valley mixes. Weed Suppression The almond pollinator mixes had good ground cover and were able to provide weed suppression throughout most of the growing season. The Kamprath Seed almond mix and the Xerces almond mix had some weed encroachment during the second year, indicating potential future weed problems. Mowing these mixes early (before budswell or bloom) could help to knock weeds back and decrease frost potential. The Central Valley mixes provided good ground cover and successfully suppressed weeds during the growing season. There was some weed encroachment during the second year in the Peaceful Valley native pollinator mix. This mix may require some weed monitoring and use of selective herbicides to ensure that the native species are not outcompeted by weeds. Renee’s Garden pollinator flowering mix had the highest percentage of bare ground of the Central Valley mixes, which could lead to potential weed encroachment issues in the future. Soil Health Soil health benefits from almond pollinator mixes should also be taken into account when implementing these plantings. These benefits may include increased organic matter, increased water infiltration and water storage, and increased nutrient availability. Specific cover crops may have additional soil health
31
benefits including nitrogen fixation (clover mixes) and even soil pest suppression due to fumigation properties (mustard mixes). As permanent plantings, the Central Valley pollinator mixes would have numerous soil health benefits. These include increased organic matter, increased water infiltration due to improved aggregate stability, and increased water storage. Other potential benefits may include reduced soil erosion, increased soil biological diversity, and increased beneficial pest population. Almond Orchard Operations The plant growth cycle, bloom duration, and forage diversity of the almond mixes would enable them to fit well into an almond orchard operation. Most of the mixes are low growing, and therefore should not be problematic with frost. Orchard floors are typically mowed and cleaned up in June or July at which point the mixes would be completely dried down. This would result in a nice clean floor in preparation for harvest later on in the season. The clover mix can be mowed repeatedly during the growing season to reduce risk of frost, however, it does appear to require more water than some of the other almond pollinator mixes, so it may struggle if there is not enough rainfall or supplemental irrigation available. The mustard mix would not be recommended for use between rows of bearing orchards due to frost potential and large root masses resulting in an uneven orchard floor. Pollinator Habitat The number of native bee visits is positively correlated to the diversity of bees at a site, which can reflect differences in pollinator habitat quality. All of the Central Valley mixes had an increase in native bee visits from 2015 to 2016, indicating that they could be used as quality pollinator habitat. If left undisturbed, the long bloom duration and species variety imply that these mixes could provide forage throughout the growing season and permanent habitat to a wide variety of pollinators. Due to the high percentage of bare ground, the low percentage of plant cover, and low reseeding rate observed, Renee’s Garden mix may not be suitable for long term pollinator habitat. Any of these pollinator mixes would be appropriate for attracting a variety of pollinators and increasing pollinator habitat if applied in the appropriate setting. Considerations that need to be taken into account for successful integration into an orchard operation or conservation planting include geographic location, site suitability, seedbed preparation, and competing vegetation. Additional monitoring and maintenance may be required in order ensure successful implementation and establishment.
LITERATURE CITED 1. Blaauw, B. R., and R. Isaacs, 2014. Flower Plantings Increase Wild Bee Abundance and the
Pollination Services Provided to a Pollination-Dependent Crop. Journal of Applied Ecology, Vol. 51: 890–898.
2. Carvalheiro, L. G., R. Veldtman, A. G. Shenkute, G. B. Tesfay, C.W.W. Pirk, J. S. Donaldson, and S. W. Nicolson, 2011. Natural and Within-Farmland Biodiversity Enhances Crop Productivity. Ecology Letters, Vol. 14: 251–259.
3. Clark, A., 2007. Managing Cover Crops Profitably, Third Edition. Sustainable Agriculture Research and Education (SARE) program handbook series, book 9. College Park, MD.
4. Garibaldi, L. A., L. G. Carvalheiro, S. D. Leonhardt, M. A. Aizen, B. R. Blaauw, R. Isaacs, M. Kuhlmann, D. Kleijn, A. M. Klein, C. Kremen, et al, 2014. From Research to Action: Enhancing Crop Yield through Wild Pollinators. Frontiers in Ecology and the Environment, Vol 12(8): 439–447.
32
5. Klein, A. M., C. Brittain, S. D. Hendrix, R. Thorp, N. M. Williams, and C. Kremen, 2012. Wild Pollination Services to California Almond Rely on Seminatural Habitat. Journal of Applied Ecology, Vol. 49: 723–732.
6. M’Gonigle, L. K., L. C. Ponisio, K. Cutler, and C. Kremen, 2015. Habitat Restoration Promotes Pollinator Persistence and Colonization in Intensively Managed Agriculture. Ecological Applications, Vol. 25(6): 1557-1565.
7. Morandin, L. A., R. F. Long, and C. Kremen, 2016. Pest Control and Pollination Cost–Benefit Analysis of Hedgerow Restoration in a Simplified Agricultural Landscape. Journal of Economic Entomology, Vol. 0 (0): 1-8. doi: 10.1093/jee/tow086.
8. National Oceanic and Atmospheric Administration, California Nevada River Forecast Center. California Climate Station Precipitation Summary (6/28/16): http://www.cnrfc.noaa.gov/awipsProducts/RNOWRKCLI.php
9. Ward, K., D. Cariveau, E. May, M. Roswell, M. Vaughan, N. Williams, R. Winfree, R. Isaacs, and K. Gill, 2014. Streamlined Bee Monitoring Protocol for Assessing Pollinator Habitat. The Xerces Society for invertebrate Conservation. Portland, OR. 12 pp. http://www.xerces.org/streamlined-bee-monitoring-protocol/
10. Western Regional Climate Center. Period of Record Monthly Climate Summary for Lodi, California (01/01/1893 - 01/30/2015): http://www.wrcc.dri.edu/cgi-bin/cliMAIN.pl?ca5032
Helping People Help the Land USDA IS AN EQUAL OPPORTUNITY PROVIDER AND EMPLOYER