80
EN EN EUROPEAN COMMISSION Brussels, 12.12.2016 SWD(2016) 452 final COMMISSION STAFF WORKING DOCUMENT Ex-post evaluation of the 2007-2013 ESF Programmes
EN EN
EUROPEAN COMMISSION
Brussels, 12.12.2016
SWD(2016) 452 final
COMMISSION STAFF WORKING DOCUMENT
Ex-post evaluation of the 2007-2013 ESF Programmes

1
Commission staff working document
Ex post evaluation of the 2007-2013 ESF programmes
Contents
EXECUTIVE SUMMARY ...................................................................................................................................... 3
1. INTRODUCTION ....................................................................................................................................... 5
2. BACKGROUND TO THE ESF 2007-2013 PROGRAMMES .............................................................................. 5
2.1. THE OBJECTIVES OF THE ESF IN 2007-2013 AND OVERALL INTERVENTION LOGIC ..................................................... 5 2.2. MAIN CHANGES IN ESF RULES IN 2007-2013 VERSUS 2000-2006 ...................................................................... 9 2.3. STATE OF PLAY OF IMPLEMENTATION .............................................................................................................. 11
3. EVALUATION CRITERIA AND QUESTIONS................................................................................................ 13
4. METHOD ............................................................................................................................................... 13
4.1. METHODOLOGY ......................................................................................................................................... 13 4.2. DATA USED AND LIMITATIONS ....................................................................................................................... 16
5. ANSWERS TO THE EVALUATION QUESTIONS .......................................................................................... 16
5.1. RELEVANCE ............................................................................................................................................... 16 5.2. EFFECTIVENESS .......................................................................................................................................... 18 5.3. EFFICIENCY ................................................................................................................................................ 26 5.4. GENDER SENSITIVITY ................................................................................................................................... 28 5.5. SUSTAINABILITY .......................................................................................................................................... 29 5.6. COHERENCE .............................................................................................................................................. 29 5.7. EU ADDED VALUE ....................................................................................................................................... 30 5.8. SOCIO-ECONOMIC IMPACT ........................................................................................................................... 32
6. CONCLUSIONS AND LESSONS ................................................................................................................. 37
6.1. CONCLUSIONS ............................................................................................................................................ 37 6.2. LESSONS LEARNED FROM THE 2007-2013 EX POST EVALUATION ......................................................................... 38 6.3. CHANGES IN THE 2014-2020 REGULATORY FRAMEWORK RELEVANT TO LESSONS LEARNED AND POINTS FOR FURTHER
ATTENTION .............................................................................................................................................................. 43
7. DISSEMINATION OF RESULTS ................................................................................................................. 45
ANNEX 1 HEADLINE FIGURES FOR ESF IN CONV REGIONS: PARTICIPATION AND RESULTS ............................. 47
ANNEX 2 HEADLINE FIGURES FOR ESF IN RCE REGIONS: PARTICIPATION AND RESULTS ................................ 48
ANNEX 3 PROCEDURAL INFORMATION ........................................................................................................ 49
ANNEX 4 STAKEHOLDER CONSULTATION ‘ESF 2007-2013 EX POST EVALUATION SYNTHESIS’ ........................ 54
ANNEX 5 METHODS ..................................................................................................................................... 74
ANNEX 6 DATA LIMITATIONS ....................................................................................................................... 77

2
List of acronyms
AIR annual implementation report
A2E access and sustainable inclusion in employment
ALMP active labour market policy
CIE counterfactual impact evaluation
CONV convergence
CRIE Centre of Research for Impact Evaluation
CSR country-specific recommendation
ERDF European Regional Development Fund
ESF European Social Fund
FEI financial engineering instrument
HC human capital
HE higher education
LLL lifelong learning
LTU long-term unemployed
MA managing authority
OP Operational Programme
PAx priority axis
PES public employment service
PP promoting partnerships
RCE regional competitiveness and employment
SCO simplified cost option
SI social inclusion
SIC strengthening institutional capacity
SFC System for Fund Management
VET vocational education and training

3
EXECUTIVE SUMMARY
This staff working document (SWD) presents the main findings of the ex post evaluation of the
European Social Fund (ESF) operational programmes (OPs) for the 2007-2013 programming
period.
Background
During 2007-2013 programming period ESF aimed to contribute to the priorities of the
Community as regards strengthening economic and social cohesion by improving employment
and job opportunities, enhancing human capital and the adaptability of workers and reinforcing
the social inclusion of disadvantaged people in the EU. Compared with the previous
programming period ESF should have closer links to EU employment policies and objectives,
greater flexibility to decide how to achieve common objectives and a wider range of activities
for regions under the convergence objective.
The socio-economic context in which the ESF OPs were programmed (before 2008) was very
different from the period in which they were implemented, dominated by the economic and
financial crisis. In 2008 employment and unemployment rates started to deteriorate and only
showed a recovery path since 2014. However, during the programing period employment
participation rates increased, early school leaving decreased and higher education attainment
rates increased by 7 pp over the same period. There was a significant decrease in the rates of
people at risk of poverty in Central and Eastern European countries, though they increased in
some old Member States.
Resources mobilised by the ESF
The total allocation for the 117 mono fund ESF OPs was EUR 115.6 billion, of which EUR
76.8 billion came from the EU budget, EUR 35.1 billion from national public contributions and
EUR 3.7 billion contributed by private funds. This allocation supported operations that were
carried out between January 2007 and December 2015 and was characterised by the following:
a significant proportion was allocated to support operations in convergence regions
(58 % of the total allocation or 69 % of EU funding alone);
investments in human capital (HC) accounted for the biggest proportion of the funding
(45.5 %), particularly in convergence regions, followed by investments in access to
employment (A2E) activities (34.3 %), 14.3 % on social inclusion (SI), 2.1 % to
strengthen institutional capacity (SIC) and 0.7 % on promoting partnerships (PP); and
by December 2014, managing authorities (MAs) had declared to the Commission
expenditures amounting to 79.3 % of the total allocation (and 90.7 % by 31 May 2016).
There are considerable differences in implementation rates across Member States.
Key quantitative achievements
The ESF registered 98.7 million participations by individuals, evenly spread between
the inactive (36 %), the employed (33 %) and the unemployed (30 %);
Key target groups supported included the low-skilled (40 %), young people (30 %) and
the disadvantaged (at least 21 %);
51.2 million participations by women were recorded, meaning a relatively balanced
participation by gender (52 % women versus 48 % men) at EU level;
At least 31.8 million positive results were achieved:

4
9.4 million participants gained employment, of whom at least 0.3 million
became self-employed;
8.7 million gained a qualification/certificate; and
13.7 million reported another positive result, such as improving skills,
competences, increased chances in the labour market, continued education, etc;
At least 276 000 entities were supported and at least 109 000 products reported;
Based on macroeconomic simulations, the HC investments are estimated to have had a
positive impact on GDP (0.25 % increase) and productivity. These estimated effects are
much stronger in the Central and Eastern European countries (1.5 % increase), but they
are also positive for the EU-15 (0.2 % increase).
Main findings of the evaluation
The interventions reached target groups in need of support, integrating people into the
labour market, helping them gain jobs, improving their skills and generating changes in
systems;
ESF 2007-2013 was an important instrument supporting the implementation of national
and EU priorities under the Lisbon and Europe 2020 strategies and related Country
Specific recommendations;
The flexibility in existing programmes and in reprogramming enabled swift responses to
emerging challenges, in particular those created by the severe economic crisis that hit
the EU in the programming period. As such, ESF helped to mitigate the negative effects
of the crisis, which especially affected the most vulnerable groups in society;
ESF programmes helped EU cohesion and generated EU added value in various ways.
The most significant were volume effects (providing significant financial resources to
address employment and social challenges in a majority of Member States), scope
effects (ESF action broadens existing action by supporting groups or policy areas that
would not otherwise receive support) and role effects (support for local/regional
innovations that are then mainstreamed at national level and for the introduction of new
ways in which various stakeholders can work together); and
The ESF provided significant support for the modernisation, strengthening and
widening of the scope of public services such as public employment services (PESs) and
other institutions responsible for active labour market actions.
Main lessons learned
Many of the lessons learned have already been taken into account in the regulatory framework
for the 2014-2020 programming period since they confirm the ex-ante assessment made by the
Commission in preparation of the current period. These refer notably to the closer alignment
with EU and national priorities, keeping flexibility to adjust to emerging needs, ensuring
coverage of disadvantaged groups, focusing on young and older people, promoting the
customisation of support, strengthening the results orientation and synergies with other EU
instruments. These include also addressing the limitations faced regarding the design of
programmes, aggregation of data on participations and results.
Others areas will be considered in the context of preparations for the ESF post-2020, notably
the continued need to simplify and reduce administrative burden.
5
1. INTRODUCTION
1.1 Purpose of the evaluation
In the 2007-2013 programming period, the ESF was, together with the European Regional
Development Fund (ERDF), one of the structural funds aimed at strengthening economic and
social cohesion in the European Union. Article 49(3) of Council Regulation (EC) No 1083/2006
laying down general provisions on the ERDF, ESF and the Cohesion Fund requires the
Commission to carry out an ex post evaluation by 31 December 20151.
The purpose of the evaluation is to present findings on the achievements of all ESF OPs,
conclusions for economic and social cohesion policy at EU level and lessons learned for future
programmes. The ERDF and Cohesion fund are the subject of their own evaluation and SWD2.
1.2 Scope of the evaluation
The evaluation covers all 117 OPs in all 28 Member States funded under the convergence, and
the regional competitiveness and employment objectives.
The programming period ran from 1 January 2007 to 31 December 2013, but operations could
be supported and carried out until 31 December 2015.3 To allow for a consistent and
quality-checked comparison of data, this staff working document draws on 2014 data in annual
implementation reports that Member States submitted to the Commission, and on Member
States’ evaluations published, by 30 June 2015.
The regulatory framework for 2000-2006 served as baseline for the evaluation. This SWD
presents changes introduced in the regulatory framework during the 2007-2013 programming
period (see section 2.2) and concludes on their effects.
2. BACKGROUND TO THE ESF4 2007-2013 PROGRAMMES
2.1. The objectives of the ESF in 2007-2013 and overall intervention logic
The ESF is established by Articles 162-164 (Title XI) TFEU in order to improve employment
opportunities for workers in the internal market and thereby to contribute to raising the standard
of living. Under Article 175 TFEU, the ESF should also contribute to the strengthening of
economic, social and territorial cohesion.
In the 2007-2013 programming period, the ESF was governed by the following regulations:
Council Regulation (EC) No 1083/2006 laying down general provisions on the ERDF,
ESF and the Cohesion Fund (the General Regulation);
Regulation (EC) No 1081/2006 on the European Social Fund (the ESF Regulation); and
Commission Regulation (EC) No 1828/2006 setting out rules for the implementation of
the General Regulation (the Implementing Regulation).
1 See more in Annex 5 2 See SWD(2016) 318 final of 19.9.2016, Ex-post evaluation of the ERDF and Cohesion Fund 2007-2013 3 According to Article 56 of the General Regulation, financial instruments can be supported beyond this date. 4 More information on ESF may be found at: http://ec.europa.eu/esf/home.jsp

6
Article 2 of the ESF Regulation provides that ‘the ESF shall contribute to the priorities of the
Community as regards strengthening economic and social cohesion by improving employment
and job opportunities, encouraging a high level of employment and more and better jobs. It
shall do so by supporting Member States’ policies aiming to achieve full employment and
quality and productivity at work, promote social inclusion, including the access of
disadvantaged people to employment, and reduce national, regional and local employment
disparities. In particular, the ESF shall support actions in line with measures taken by Member
States on the basis of the guidelines adopted under the European Employment Strategy, as
incorporated into the Integrated Guidelines for Growth and Jobs, and the accompanying
recommendations’. Employment Guidelines 17-24 for 2005-20085 and 2008-2010
6 highlighted
three priorities for action under Member States’ policies:
attract and retain more people in employment, increase labour supply and modernise
social protection systems;
improve the adaptability of workers and enterprises; and
increase HC investment through better education and skills.
These priorities were taken up in the 2007-2013 Community strategic guidelines for cohesion
policy7 as the reference for HC activities. The guidelines also stated that appropriate attention
should be given to investments to improve efficiency in public administrations and build
administrative capacity at national, regional and local levels.
ESF programmes had to take into account the country-specific challenges and priorities as
highlighted in country specific recommendations and national reform programmes. The
programmes, whether managed at national or regional level, had to address territorial disparities
effectively and be geared to needs in different areas.
Article 2(2) of the ESF Regulation provides that ‘in carrying out the tasks referred to in
paragraph 1, the ESF shall support the priorities of the Community as regards the need to
reinforce social cohesion, strengthen productivity and competitiveness, and promote economic
growth and sustainable development. In so doing, the ESF shall take into account the relevant
priorities and objectives of the Community in the fields of education and training, increasing
the participation of economically inactive people in the labour market, combating social
exclusion — especially that of disadvantaged groups such as people with disabilities — and
promoting equality between women and men and non-discrimination’.
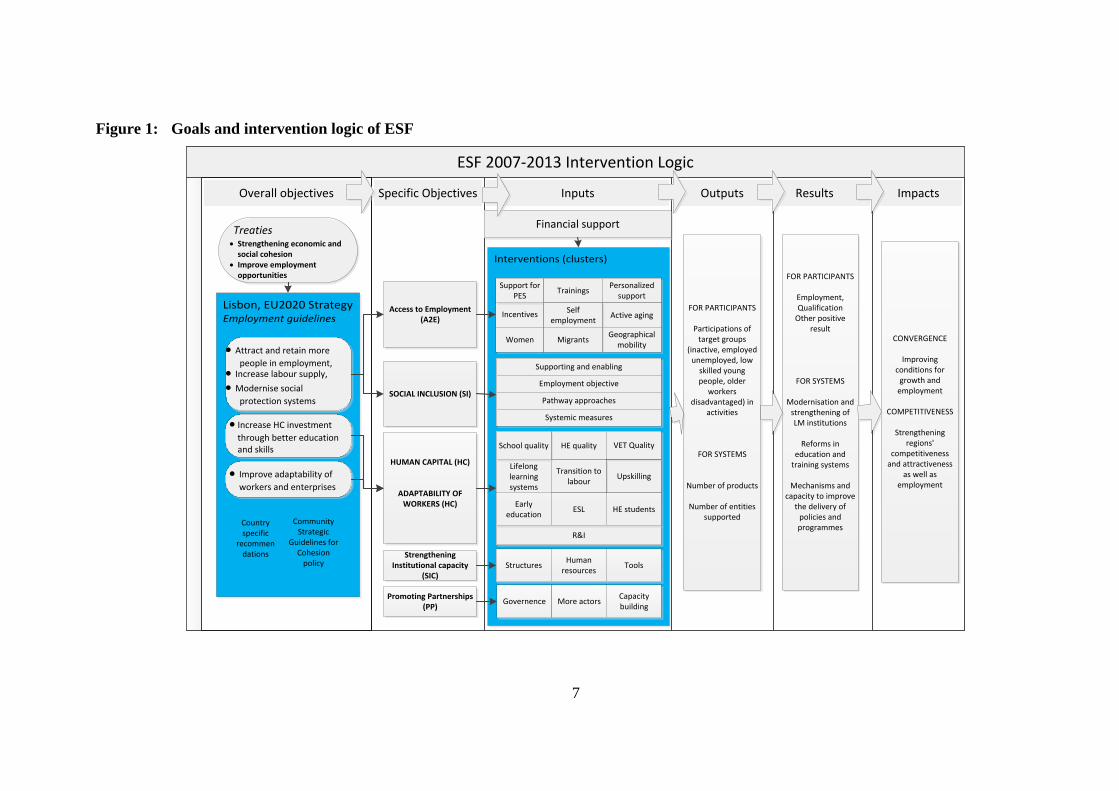
The overall intervention logic of the ESF during the programming period that was used in the
framework of this evaluation can thus be summarised as follows8:
5 Council Decision of 12 July 2005 on guidelines for the employment policies of the Member States (2005/600/EC);
http://eur-lex.europa.eu/legal-content/EN/TXT/PDF/?uri=CELEX:32008D0618&from=EN 6 Council decision of 15 July 2008 on guidelines for the employment policies of the Member States
(2008/618/EC) http://ec.europa.eu/regional_policy/sources/docoffic/2007/osc/l_29120061021en00110032.pdf 7 Council Decision of 6 October 2006 on Community strategic guidelines on cohesion (2006/702/EC);
http://eur-lex.europa.eu/legal-content/EN/TXT/PDF/?uri=CELEX:32005D0600&from=EN 8 Clusters of interventions are presented in more detail in Table 4 (page 15), outputs and results in effectiveness
section 5.2
7
Figure 1: Goals and intervention logic of ESF
ESF 2007-2013 Intervention Logic
ResultsOutputsInputsSpecific ObjectivesOverall objectives Impacts
Lisbon, EU2020 StrategyEmployment guidelines
Interventions (clusters)
Treaties Strengthening economic and
social cohesion Improve employment
opportunities
Attract and retain more
people in employment, Increase labour supply,
Modernise social
protection systems
Increase HC investment
through better education and skills
Improve adaptability of
workers and enterprises
Access to Employment(A2E)
SOCIAL INCLUSION (SI)
HUMAN CAPITAL (HC)
ADAPTABILITY OF WORKERS (HC)
Strengthening Institutional capacity
(SIC)
Promoting Partnerships (PP)
Supporting and enabling
Employment objective
Pathway approaches
Systemic measures
FOR PARTICIPANTS
Participations of target groups
(inactive, employed unemployed, low
skilled young people, older
workers disadvantaged) in
activities
FOR SYSTEMS
Number of products
Number of entities supported
FOR PARTICIPANTS
Employment,Qualification
Other positive result
FOR SYSTEMS
Modernisation and strengthening of LM institutions
Reforms in education and
training systems
Mechanisms and capacity to improve
the delivery of policies and programmes
Incentives
Women
Support for PES
TrainingsPersonalized
support
Active aging
Geographical mobility
Self employment
Migrants
R&I
HE quality
Upskilling
VET Quality
Lifelong learning systems
Transition to labour
School quality
Early education
ESL HE students
StructuresHuman
resourcesTools
Governence More actorsCapacity building
Financial support
Country specific
recommendations
Community Strategic
Guidelines for Cohesion
policy
CONVERGENCE
Improving conditions for
growth and employment
COMPETITIVENESS
Strengthening regions'
competitiveness and attractiveness
as well as employment

8
In 2010, the Union replaced the Lisbon strategy with the Europe 2020 strategy to promote
smart, sustainable and inclusive growth. A new set of guidelines was adopted for Member
States’ employment policies,9 including a set of quantified EU headline targets to be achieved
by 2020:
raise the employment rate for women and men aged 20-64 to 75 %;
reduce early school leaving rates to less than 10 % and increase the proportion of 30-34
year-olds having completed tertiary or equivalent education to at least 40 %; and
reduce poverty by aiming to lift at least 20 million people out of the risk of poverty and
exclusion.
The ESF programmes were mobilised to support the implementation of the new guidelines and
the achievement of the objectives.
Within the Cohesion policy framework ESF contributed to two objectives: the Convergence
objective (CONV) and the Regional competitiveness and employment (RCE) objective. The
range of eligible actions and financial resources were wider for the former. For the latter,
Community resources needed to be much more focused to achieve a significant impact. For
each area, Article 3 of the ESF Regulation defined the actions and priorities to be supported by
the ESF in the framework of the CONV and RCE objectives:
enhancing human capital (referred to under as HC), with some actions that were
eligible only under the CONV objective (e.g. the implementation of reforms in
education and training systems or the development of human potential in research and
innovation);
increasing the adaptability of workers, enterprises and entrepreneurs with a view to
improving the anticipation and positive management of economic change (presented
together with other HC activities in this document);
enhancing access to employment (A2E) and the sustainable inclusion in the labour
market of job seekers and inactive people, preventing unemployment, in particular
long-term and youth unemployment, encouraging active ageing and longer working
lives, and increasing participation in the labour market;
improving the social inclusion (SI) of disadvantaged people with a view to their
sustainable integration in employment, and combating all forms of discrimination in the
labour market;
promoting partnerships (PP), pacts and initiatives through networking among relevant
stakeholders, such as the social partners and non-governmental organisations (NGOs) at
9 Council Decision of 21 October 2010 on guidelines for the employment policies of the Member States
(2010/707/EU); see:
Guideline 7: Increasing labour market participation of women and men, reducing structural unemployment and
promoting job quality;
Guideline 8: Developing a skilled workforce responding to labour market needs and promoting LLL;
Guideline 9: Improving the quality and performance; of education and training systems at all levels and
increasing participation in tertiary or equivalent education; and
Guideline 10: Promoting social inclusion and combating poverty.
http://eur-lex.europa.eu/legal-content/EN/TXT/PDF/?uri=CELEX:32010D0707&from=EN
9
transnational, national, regional and local levels, in order to mobilise for reforms in the
field of employment and labour market inclusiveness; and
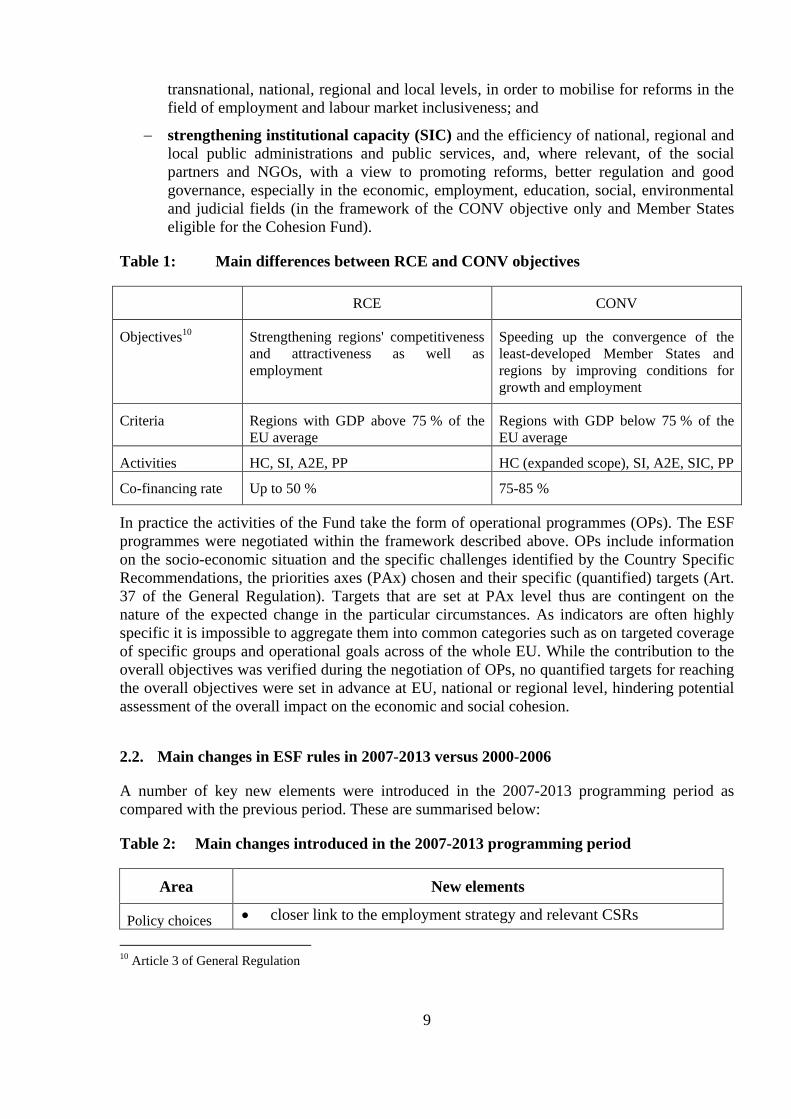
strengthening institutional capacity (SIC) and the efficiency of national, regional and
local public administrations and public services, and, where relevant, of the social
partners and NGOs, with a view to promoting reforms, better regulation and good
governance, especially in the economic, employment, education, social, environmental
and judicial fields (in the framework of the CONV objective only and Member States
eligible for the Cohesion Fund).
Table 1: Main differences between RCE and CONV objectives
RCE CONV
Objectives10 Strengthening regions' competitiveness
and attractiveness as well as
employment
Speeding up the convergence of the
least-developed Member States and
regions by improving conditions for
growth and employment
Criteria Regions with GDP above 75 % of the
EU average
Regions with GDP below 75 % of the
EU average
Activities HC, SI, A2E, PP HC (expanded scope), SI, A2E, SIC, PP
Co-financing rate Up to 50 % 75-85 %
In practice the activities of the Fund take the form of operational programmes (OPs). The ESF
programmes were negotiated within the framework described above. OPs include information
on the socio-economic situation and the specific challenges identified by the Country Specific
Recommendations, the priorities axes (PAx) chosen and their specific (quantified) targets (Art.
37 of the General Regulation). Targets that are set at PAx level thus are contingent on the
nature of the expected change in the particular circumstances. As indicators are often highly
specific it is impossible to aggregate them into common categories such as on targeted coverage
of specific groups and operational goals across of the whole EU. While the contribution to the
overall objectives was verified during the negotiation of OPs, no quantified targets for reaching
the overall objectives were set in advance at EU, national or regional level, hindering potential
assessment of the overall impact on the economic and social cohesion.
2.2. Main changes in ESF rules in 2007-2013 versus 2000-2006
A number of key new elements were introduced in the 2007-2013 programming period as
compared with the previous period. These are summarised below:
Table 2: Main changes introduced in the 2007-2013 programming period
Area New elements
Policy choices closer link to the employment strategy and relevant CSRs
10 Article 3 of General Regulation

10
concentration of support
Programming greater flexibility to choose how to achieve common objectives
wider scope of activities under the CONV objective (expanded HC
and introduction of SIC)
Programme
implementation
introduction of flat rates and SCOs
expanded scope and use of FEIs
single audit approach
Monitoring
system
reporting of characteristics of ESF participations (outputs) by PAx
(Annex XXIII to the General Regulation)
Evaluations discontinuation of mid-term evaluations by Member States, new
requirement to support significant change or revision with an
evaluation
The closer link to the Lisbon agenda for growth and jobs (and subsequently the Europe 2020
strategy) and the relevant country-specific recommendations (CSRs) was discussed in
section 2.1.
ESF 2007-2013 also aimed to concentrate resources on the areas where it could have the most
impact in achieving its objectives. This principle was spelled out in Article 4(2) of the ESF
Regulation: ‘Within operational programmes, resources shall be directed towards the most
important needs and focus on those policy areas where ESF support can have a significant
effect in attaining the objectives of the programme’.
Member States were given greater flexibility in selecting priorities11
than was the case for the
2000-2006 period.
OPs eligible under the CONV objective, to facilitate convergence by regions/countries lagging
behind, were allowed to fund activities to build institutional capacity (unlike OPs under the
RCE objective) and to fund a wider range of HC activities (see above) than under the RCE
objective.
To simplify ESF management, Member States were allowed to declare indirect costs
(overheads) on a flat-rate basis up to 20 % of direct costs of an operation. In 2009, in the
context of the European Economic Recovery Plan, the ESF Regulation was amended to expand
the possibility of applying flat rates for indirect costs, standard scales of unit costs and lump
sums.
Although the use of financial engineering instruments (FEIs) was already eligible in the
previous programming period, the General Regulation expanded their scope and their use was
consistently promoted to attract private-sector capital and make more efficient use of resources.
Responsibility for controlling ESF spending is shared by the Commission and the Member
States. The single-audit approach (allowing the Commission to rely where possible on
information provided by national audit bodies) was introduced in 2007-2013 on the basis of
provisions in the General Regulation (Article 73), ‘in order to make best possible use of
resources and to avoid unjustified duplication of work’. In 2000-2006, it had only been possible
11 See in particular Article 37 of the General Regulation.

11
to cooperate on the basis of bilateral administrative arrangements (Article 38 of Council
Regulation (EC) No 1260/1999).
The ESF Regulation introduced a new system of MAs reporting on the basis of common
indicators (see Annex XXIII to the General Regulation) on certain characteristics of participants
in a funded intervention: their status on the labour market, gender, age category, education level
and possible disadvantage markers such as being a migrant or belonging to a minority.
In 2000-2006, Member States were required to carry out mid-term evaluations. This
requirement was discontinued in 2007-2013 and a new requirement introduced for Member
States to carry out evaluations linked to the monitoring of OPs, in particular when it detects a
significant departure from the original goals or where proposals are made for the revision of
OPs (Article 48 of the General Regulation).
The largely positive effect of these changes is analysed throughout this document and
conclusions are drawn in chapter 6.
2.3. State of play of implementation
The ESF is implemented through shared management between the Member States and the
Commission, with the exception of technical assistance at the Commission’s initiative, which
the Commission manages directly. Member States’ administrations (at national, regional or
local level) select operations to be financed and take responsibility for their day-to-day
management. Working together with the Member States, the Commission ensures overall
supervision of the programme, making sure that the money is well spent and the expected
results are achieved.
For each OP, the Member State designates a number of authorities, including an MA
responsible for managing and implementing the OP in accordance with the principles of sound
financial management. This includes ensuring that operations selected for funding meet the
criteria applicable to the OP (Article 60(a) of the General Regulation), that implementation data
are collected as required for financial management, monitoring verifications, audits and
evaluations, and that OPs are evaluated in line with Article 48(3) of the General Regulation.
ESF 2007-2013 was implemented in all 28 Member States,12
through 117 mono-fund OPs (59
in RCE regions, 42 in CONV regions and 16 multi-objective programmes covering both types
of regions), with a total allocation of EUR 115.6 billion by the end of 2014, including
EUR 76.8 billion from the EU budget. This contribution represented 7.9 % of the total EU
budget for the period, as compared with 8.5 % in 2000-2006. National public contributions
amounted to EUR 35.1 billion, complemented by an additional EUR 3.7 billion from private
funds, mobilised at national level:
a significant proportion of the ESF (58 % of the total allocation or 69 % of EU funding
alone) was allocated to operations in CONV regions. 42 % of the total allocation (31 %
of EU funding alone) was dedicated to RCE regions. The relative proportions of total
12 Croatia was covered by the Instrument for Pre-Accession Assistance (IPA) from 2007 until June 2013 and an
ESF programme for July-December 2013 which incorporated the previous IPA programming.

12
allocation and EU funding alone differ because the rate of EU co-financing is higher in
CONV regions (generally up to 85 %) than in RCE regions (generally up to 50 %);
taking both types of region together, HC investments are the largest (45.5 % of the
budget), followed by investments in A2E (including adaptability with 34.3 %). SI
interventions were allocated 14.3 % of the budget, leaving 2.1 % for SIC, 0.7 % for PP
and 3.1 % for technical assistance.
Table 3: ESF financial allocation and implementation
HC A2E SI SIC PP Total
Total OP (EUR billion) 52.6 39.7 16.5 2.4 0.8 115.6
of which EU funding (EUR billion) 35.9 25.7 10.2 2.0 0.5 76.7
Allocation by policy field as % of total
allocation 45.5 % 34.3 % 14.3 % 2.1 % 0.7 % 100 %
Declared expenditure as % of total
allocation 78.1 % 81.1 % 83.7 % 69 % 64.2 % 79.3 %
CONV regions (EUR billion) 34.1 20.4 7.5 2.3 0.3 66.9
of which EU funding (EUR billion) 26.8 16.2 5.9 1.9 0.2 52.7
Allocation by policy field as % of total
allocation 51.0 % 30.5 % 11.3 % 3.5 % 0.5 % 100 %
Declared expenditure as % of total
allocation 76.4 % 82.7 % 83.4 % 68.3 % 67.0 % 78.5 %
RCE regions (EUR billion) 18.5 19.2 9 0.1 0.5 48.7
of which EU funding (EUR billion) 9.1 9.6 4.2 0.1 0.2 24.0
Allocation by policy field as % of total
allocation 38.0 % 39.5 % 18.3 % 0.2 % 1.0 % 100 %
Declared expenditure as % of total
allocation 81.1 % 79.3 % 84.0 % 92.0 % 62.3 % 80.4 %
By December 2014, expenditure amounting to 79.3 % of the overall ESF 2007-2013 budget had
been declared to the Commission. Certain conclusions can be drawn as regards the
implementation rates:
there are considerable differences across Member States. While some (LT, EE, LV, FI,
PT) reached the 95 % transfer limit, for others (particularly RO, but also SK, MT and
HR) implementation rates remained comparatively low;
overall differences between CONV and RCE regions are relatively limited, with rates of
78.5 % and 80.4 % respectively;
implementation rates for SI, A2E and HC (ranging from 83.7 % to 78.1 %) are
significantly higher than for SIC (69 %) and PP (64.2 %). This can be explained by the
fact that many projects focus on the longer term and run through the entire programming
period; and
13
technical assistance budgets had not been fully used, with an average implementation
rate across the EU of 67.9 %. This may be explained by the fact that activities aimed at
system-level changes were slower, scheduled towards the end of the period and/or more
challenging to implement due to their complexity.
While the programming period ended in 2013, operations could continue until
31 December 2015. MAs do not have to submit applications for payment of the final balance
until 31 March 201713
(see General Regulation), so implementation rates will increase further.14
3. EVALUATION CRITERIA AND QUESTIONS
Under Article 49(3) of the General Regulation, the ex post evaluation should:
cover all OPs under each objective;
examine the extent to which resources were used, the effectiveness and efficiency of
programming and the socio-economic impact, in order to draw conclusions for policies
on economic and social cohesion; and
identify factors contributing to the success or failure of the implementation of OPs and
identify good practices.
The following additional specific evaluation criteria were used during this ex post evaluation:
EU added value,15
gender sensitivity,16
sustainability and lessons learned (in terms of policy
choices, target groups, programming, implementation, monitoring and evaluation of future
programmes).
The evaluation questions and criteria were used in all studies supporting this evaluation. It is
important to note that the evaluation was designed well before the Commission adopted the
Better Regulation Guidelines17
, but to the extent possible the responses to the evaluation
questions (see chapter 5) have been organised according to the criteria in the Guidelines.
Socio-economic impact and gender sensitivity were presented as separate evaluation criteria to
comply with the General Regulation.
4. METHOD
4.1. Methodology
For the 2007-2013 programming period, the Commission was responsible for carrying out ex
post evaluation in close cooperation with Member States and MAs.
Based on a preparatory study18
three thematic studies have been carried out, focusing on:
13 2018 for Croatia. 14 As of 31 May 2016, the overall implementation rate was 90.72 % (based on SFC figures). 15 Community/EU added value is defined in the Better Regulation Guidelines as value resulting from EU
interventions that is additional to the value that would have resulted from public and private sector
interventions at regional or national levels. 16 In line with the principle of equality between men and women set out in Article 16 of the General Regulation. 17 Better Regulation Guidelines COM (2015) 215, 19.5.2015 18 Preparatory study for the ex post evaluation of ESF 2007-2013; Panteia in association with LSE enterprise.

14
supporting the integration of disadvantaged groups into the labour market and society
(SI);19
investing in human capital, which includes adaptability of workers (HC);20
and
access and sustainable integration into employment (A2E).21
A separate synthesis study22
was produced to:
integrate the main findings of the thematic evaluations;
update data on the basis of the 2014 annual implementation report (AIR);
do additional work on Croatia and the priorities with lower resource allocations (SIC
and PP); and
present country reports.
Figure below presents overview of main deliverables used for the SWD.
Figure 2: Deliverables of the ESF 2007-2013 ex post evaluation
This SWD is based also on the results of the open 12-week internet-based public
consultation. Results of the consultation are presented thought the section 5 and more detailed
in the Annex 4. The open public consultation (OPC) was carried out after the start of the
external evaluation and as such it could not contribute to the findings of that evaluation. The
results of the OPC are presented throughout the SWD in order to provide additional evidence to
corroborate or not the findings of the evaluation. For more comprehensive presentation of the
methodology and other data sources used please refer to the Annex 5 of this document.
19 European Social Fund (ESF) 2007-2013 ex post evaluation: supporting the integration of disadvantaged
groups into the labour market and society, ICF international (2016). 20 European Social Fund (ESF) 2007-2013 ex post evaluation: investment in human capital, ICF international
(2016). 21 ESF 2007-2013 ex post evaluation: access and sustainable integration into employment, Metis GmbH in
association with Panteia (2016). 22 ESF 2007-2013 ex post evaluation: synthesis, Metis GmbH in consortium with Fondazione Giacomo Brodolini
and Panteia.

15
Interventions (or operations) within OPs under the thematic studies on A2E, HC and SI were
divided for the purpose of the evaluation into clusters or groupings by similar type of objective,
target group and/or activities supported. The clusters (see Table 4) provide a comprehensive
overview of the various types of ESF activities in 2007-2013 and a basis for an in-depth
analysis (based on a sample of 234 interventions) of the effectiveness, efficiency, sustainability,
gender sensitivity and Community added value of similar interventions across the EU. The
financial coverage of the interventions assessed ranged from 10 % (SI) to 66 % (HC) of
allocations, which allows us to draw valid and robust conclusions at EU level. More
information on the development of the clusters is presented in Annex 5.
Table 4: Most common types of intervention (clusters)
A2E HC SI SIC PP
Support for PES and
other labour market
institutions
Lifelong learning
(LLL) systems and
frameworks
Supporting and
enabling actions (debt
counselling, language
training for migrants,
etc.)
Introducing
changes to
structures and
processes
Improve policy
coordination,
design and
governance
Personalised support
for individuals
Quality of HE Actions with an
employment objective
Upskilling and
managing
human
resources
Expanding
Multi-actor
projects
Training Early childhood
education and care
Pathway approaches Developing
tools (e-
governance,
etc)
Support for the
capacity building
of partnership
(members)
Employment incentives Quality of school
education
Systematic measures
influencing systems,
institutional or cultural
contexts
Self-employment and
entrepreneurship
Quality and
labour-market
relevance of VET
Active ageing and
prolonging longer
working life
Reduction of early
school leaving and
inclusive education
Women in employment
and reducing
gender-based
segregation
Transition to the labour
market for young
people
Increase migrant
participation
Research and
innovation
Geographical and
occupational mobility
of workers
Professional
up-skilling of
employed people
Upskilling and
requalification of
adults
Participation and
mobility of HE
students

16
4.2. Data used and limitations
The implementation of the programmes was not completed at the time of the ex-post evaluation.
Therefore, the evaluation could not use the final implementation reports of the programmes and
could only use the 2014 AIR data and national evaluations from the Member States. The ex-
post evaluation is thus not presenting the full picture of the ESF during that programming
period. Despite efforts to mobilise all available information, the ex post evaluation faced a
number of limitations, regarding the design of programmes, the aggregation of data on
participations, and results, the lack in some instances of predefined targets, essential data at
intervention level, and robust impact evaluations from Member States. Annex 6 provides a
more comprehensive presentation of data limitations and how they were dealt with in this
evaluation.
As outlined in chapter 6, many of the limitations have been overcome in the new 2014-2020
regulatory framework, notably those regarding the design of programmes, aggregation of data
on participations, lack of robust objectives and indicators associated to baselines, milestones
and targets as well as the setting of common output and results indicators including those
establishing a common approach for monitoring/reporting on the sustainability of the effects of
ESF through longer term results.
5. ANSWERS TO THE EVALUATION QUESTIONS
5.1. Relevance
The ESF demonstrated its relevance by close alignment of the programmes with national
policies addressing country-specific challenges and priorities formulated in the employment
recommendations, national reform programmes and EU policies.
In 2008 the EU-28 employment rate for age group 20-64 was 70 %, the unemployment rate was
7%, the share of 30 to 34 year olds who have attained tertiary education was 31 % and early
school leave at 17%, while 117 million Europeans were at risk of poverty. As discussed in
Chapter 2.1, the ESF OPs responded to the analysis of the socio-economic situation and the
specific challenges identified by National Strategic Reference Frameworks at national level and
at EU level by explicitly addressing relevant challenges identified by the Country Specific
Recommendations. As such ESF activities were highly relevant for achieving Europe 2020
headline targets in the employment, education and social fields.
The socio-economic context in which the ESF OPs were programmed was very different from
that in which they were implemented – the latter being dominated by the economic and
financial crisis. In 2008 the EU-28 employment rate had fallen to 68.6 % by 2010, while
unemployment rose to 9.6 % in the same period, with the deterioration of labour markets and
the social situation being particularly significant in some Member States and for some groups of
the population, such as young people. The ESF played an important role in mitigating the
negative effects of the crisis and responding effectively to the associated emerging challenges.
The alignment with EU policies and priorities was much stronger in 2007-2013 than in 2000-
2006 and meant that resources were concentrated on relevant priorities.

17
ESF alignment with national and EU policies and priorities
The ESF Regulation was aimed at establishing a close connection between ESF programmes
and EU policies and priorities. The programmes supported the implementation of national
reforms responding to EU priorities under the Lisbon and the Europe 2020 strategies23
(also in
the context of the first cycles of the European Semester) and contributed to the Social inclusion
Open Method of Coordination and the 2020 Education and Training 2020 strategy:
the ESF was highly relevant in addressing the main policy challenges in order to achieve
the EU 2020 headline targets and contributing to the EU guidelines on labour market
policies, social policies and education, and to the development of institutional capacity
to deliver policies and reforms;24
and
the specific challenges identified by the CSRs were well reflected in the OPs. All
intervention clusters identified by the thematic evaluations can be linked to at least one
of the CSR key challenges.25
There are considerable differences between Member States regarding priorities chosen
(e.g. some chose to invest relatively little in A2E intervention, while others invested less in
HC), reflecting the variety of challenges faced. Overall, RCE regions invested more in
employment-related intervention, while CONV regions concentrated more on investment in HC
systems (see table 3).
In the open public consultation, more respondents agreed than disagreed with the statement that
the ESF programmes were designed to address key issues in the HC, A2E and SI thematic
areas, while the other themes (SIC and PP) were recognised somewhat less:
HC: 78 % agreed, 5 % disagreed;
A2E: 79 % agreed, 5 % disagreed; and
SI: 81 % agreed, 4 % disagreed.
Flexibility in programming and response to the crisis
The Commission took several measures in response to the financial and economic crisis. In the
2008 European Economic Recovery Plan, the ESF (as the EU’s main financial instrument for
investing in people) was a key part of the ‘recovery toolbox’. As a result of the Plan, the
Commission was able to simplify criteria for support and step up advance payments. To ensure
further the use of ESF (and other structural funds) during the crisis, Member States receiving
financial assistance were granted additional 10 percentage points of European co-financing. The
Commission also made it possible to amend ESF expenditure programming to focus on more
relevant and immediate crisis-driven needs such as short-term or public works schemes.
Member State26
and Commission evaluations27
show that the ESF was a key tool to address
23 http://ec.europa.eu/europe2020/index_en.ht 24 This alignment was recognised by the European Court of Auditors in its special report on education, conclusion
83.(EU education objectives: programmes aligned but shortcomings in performance measurement (special
report no 16/2016) 25 See Tables 1 and 2 in the ESF 2007-2013 ex post evaluation synthesis report. 26 For example the Evaluation of quality and efficiency of trainings and employment promotion measures financed
by ESF, Final Report, 16 May 2011 (Lithuania).

18
emerging employment and social inclusion challenges. As a result, the Community’s financial
contribution to the ESF OPs increased by EUR 512 million, while Member States’ budgetary
consolidation measures reduced the initial total allocation by EUR 3.40 billion, from
EUR 119.0 billion to EUR 115.6 billion.
The flexibility in existing programmes and the possibility of reprogramming, as enshrined in
the General Regulation and further strengthened though the European Economic Recovery
Plan, meant that ESF programmes were able to respond swiftly and effectively to emerging
challenges, in particular those created by the crisis. In all, 72 % of the programmes were
adapted in response to the crisis, with financial resources being shifted to support the groups
most affected and target values being revised. Shifts within PAx did not always require formal
approval by the Commission and OPs with relatively broad PAx were able to shift financial
allocations more easily. Overall, OPs increased their focus on fighting unemployment, shifting
resources to A2E (job search, job creation, enhancing employability) and SI activities. Overall,
this resulted in an increase of EUR 3.1 billion in the Community contribution to A2E and SI28
.
At the informal European Council in January 2012, the Commission launched an initiative to
help the eight Member States with the highest levels of youth unemployment. Youth action
teams composed of national and Commission officials were set up in February 2012 with
Greece, Ireland, Italy, Latvia, Lithuania, Portugal, Slovakia and Spain. As a result over 4 billion
eur were reallocated to youth employment themed interventions. The European Court of
auditors has noted that the difficulties to conclude on the actual effects of these efforts29
.
A majority (67 %) of respondents to the open public consultation agreed with the statement that
the ESF helped to mitigate the effects of the crisis, while 14 % disagreed.
5.2. Effectiveness
The effectiveness of the ESF has been assessed according to various criteria, in particular
whether the programmes achieved their targets, the extent to which they reached the relevant
target groups of the population and whether this support produced measurable results in terms
of improving the situation in the labour market and developing HC.
Overall, the respondents to the public consultation agreed that the ESF was effective in all
policy areas, although less so in SIC and PP:
HC: 72 % agreed, 6 % disagreed;
A2E: 68 % agreed, 8 % disagreed;
SI: 69 % agreed, 8 % disagreed;
SIC: 35 % agreed, 11 % disagreed; and
PP: 44 % agreed, 9 % disagreed.
27 Evaluation of the reaction of the ESF to the economic and financial crisis. Final Report, Metis GmbH 28 ESF Ex-Post evaluation Synthesis 2007-2013: EU Synthesis report, figure 4 29 European court of auditors special report 17/2015 "Commission’s support of youth action teams: redirection of
ESF funding achieved, but insufficient focus on results"

19
Reaching target groups
The ESF reached significant numbers of EU citizens; 98.7 million participations30
were
recorded, in a population of 498 million in 2007. Most participants (63 %) were in CONV
regions, almost twice as many as in RCE regions (37 %). In terms of policy themes, the
proportions of participants were highest in HC (61 %), A2E (29 %) and SI (8 %).
The ESF has had a balanced focus on the inactive (36 % of participants), the employed (33 %)
and the unemployed (30 %).
The most relevant target groups as identified in the various sets of Employment Guidelines
were reached: low-skilled people (close to 40 % of participations), the inactive (31 %), young
people (30 %) and the disadvantaged in general31
(under-reported, but at least 21 %). However,
despite the policy priority given to these groups, the relative proportions of the unemployed and
migrants, minorities and the disabled actually decreased over the years while that of the inactive
increased.
The ESF targeted other groups to a lesser extent (ranging from 9 % to 2 %): the highly skilled,
the long-term unemployed (LTU), those aged over 54 (at least 9 %) and the self-employed. The
proportion of older participants seems particularly low in view of the attention given to active
ageing over the period.
Overall, slightly more women participated in ESF interventions than men (51.2 million, as
against 47.5 million), showing relatively balanced participation by gender (52 % versus 48 %)
at EU level. However, in a number of Member States and in some policy themes, there are
considerable differences in the gender balance. These generally stem from the focus of the
interventions. Most typical are male-dominated HC adaptability interventions (due to higher
levels of male employment in traditional industries) and female-dominated HC or SIC
interventions that targeted education and social services. The in-depth analysis within the
thematic studies identified some specific clusters where the gender balance could be improved
(e.g. in HC, women are over-represented as regards the upskilling and qualification of adults,
and the participation and mobility of HE students; men are over-represented in research and
innovation, and the professional upskilling of employed people).
This assessment is in line with the responses to the open public consultation on ESF support for
target groups whose needs would have otherwise been addressed insufficiently.
The ESF played an important role in the implementation of policy initiatives addressing the
needs of young people (under 25), who account for 30.5 % of all participations (30.1 million
participations). Young people made up 32 % of total participants in HC, 29 % in A2E and 28 %
in SI. However, the increased EU-level policy attention on youth unemployment and the
introduction of various specific youth-employment policies (such as the Youth Action Teams)
between 2010 and 2013 did not always translate into greater youth participation in the second
half of the programming period. Indeed, some Member States actually saw a reduction after the
onset of the crisis.
30 One individual may participate in several ESF funded activities, number of participations may include also
indirect participations (see Annex 6) 31 Including minorities, migrants and the disabled.

20
Results of activities supporting individuals
ESF 2007-2013 achieved a significant number of positive outcomes that helped participants
integrate in the labour market by getting a job or improving their employability by acquiring
new skills:
it contributed to at least 31.8 million positive results measured at individual level
across all themes. Except in the case of employment results, the highest number of
results for individuals (60 %) was reported in CONV regions, in line with the high
level of participation in those regions;
9.4 million participants are reported as being in employment immediately or some
time32
after the intervention (of these, at least 0.3 million became self-employed).
8.7 million participants received a qualification/certificate. 13.7 million reported other
positive results, such as improving skills and competences, increased chances in the
labour market, continued in education33
, or a combination of employment,
qualification and other positive result (aggregating combined indicators);
unsurprisingly, employment gains were more prominent among participants in A2E
interventions (72 % of all results in this field) than those in other types of intervention.
Qualification gains were more prominent in HC interventions (35 %). Other positive
results were frequently reported, especially by participants in HC (55 %) and SI
interventions (57 %); and
with final results to be reported by 31 March 2017, these figures are expected to rise
further towards the end of implementation, especially in the HC area (due to cohort
effects).
A comparison of positive results achieved and total number of participations (where it was
possible to aggregate results) shows a success rate of 44 %.34
This does not significantly vary
by policy theme or objective, except in the case of SI.35
Member States’ evaluations36
show that the ESF was instrumental in providing support to
groups that otherwise would not have been supported, or not to the same extent, by regular
interventions, such as migrants, the disabled and members of marginalised communities
(e.g. Roma). The SI thematic evaluation study37
shows that, while many measured effectiveness
in terms of employment, which was heavily affected by the crisis and thus saw only moderate
results, the main benefits of the interventions were ‘soft’ outcomes, such as behavioural and
attitudinal changes (increased motivation, self-esteem, etc.), which were rarely measured by
32 As each MA defined its own result indicators, the time horizon varies, generally between 3 and 24 months. 33 Result indicators are set to measure intended change, for the most challenging groups such as drug addicts the
mere continued participation in activities can be seen as success. 34 These results could be linked to approximately 69 million participations across the various themes (or 70 % of
participations, which equates to 73 % of the total allocation). 35 In SI, RCE regions report a considerably higher success rate (66 %) than CONV regions (39%), but this is to a
large extent attributed to Germany, where the increase in childcare positions was reported as a result. 36 For example: Průběžná (longitudinální) evaluace dopadů OP LZZ na cílové skupiny ((longitudinal) evaluation of
impacts of the OPHRE on the programme target groups);'Navreme Boheme, s.r.o, 2013.
Did Latvia's Public Works Program Mitigate the Impact of the 2008-2010 Crisis? World Bank, 2014 37 European Social Fund (ESF) 2007 – 2013 ex post evaluation: Supporting the integration of disadvantaged
groups into the labour market and society’
21
Member States. The evaluations clearly stated that ESF support in the field of SI provided an
opportunity to implement interventions for disadvantaged groups that were not part of regular
interventions.
In the open public consultation, more respondents agreed than disagreed that ESF support for
individuals was successful in achieving the following results:
gaining a qualification: 77 % agreed, 4 % disagreed;
gaining employment: 62 % agreed, 10 % disagreed;
enhancing the skills of teachers: 55 % agreed, 9 % disagreed; and
improving working conditions: 45 % agreed, 17 % disagreed.
Performance in achieving targets set
About 55 % of the programme result and output indicators were monitored according to a
specific target based on specific changes that ESF interventions were expected to achieve. By
this measure, the interventions performed well: by the end of 2014, targets for about 64 % of
these indicators had been met or almost met, within a 10 % margin:
the targets were met or exceeded for 59 % of the 1 924 output indicators for which
they had been set and were monitored, while another 6 % showed a 90-100 % success
rate. An achievement rate of less than 50 % was reported for 16 %; and
the targets were met or exceeded for 55 % of the 1 992 result indicators for which they
had been set and were monitored, while another 8 % showed a 90-100 % success rate.
These figures are expected to have improved substantially towards the end of 2015. The
in-depth analysis of interventions in the thematic evaluations shows generally higher rates of
target achievement than the aggregate rates above, e.g. the HC thematic report shows that an
average of 105 %output targets were met, while the average rate for result targets was 99 %38
.
Overall, the coverage of the targets varied depending on the robustness of the target-setting, the
type of activity, the characteristics of the target groups and the nature of the objectives set.
Unfortunately, the thematic studies could not assess systematically the plausibility of the
targets, but in some cases there was evidence that they were not realistic, leading to strong over-
or under-performance, or that they had not been adjusted to reflect changes in the budget
allocation. The crisis provoked higher-than-expected initial demand for some types of activity
(leading to higher outputs) and made the integration of the most disadvantaged into the labour
market more challenging, leading to under-performance in some cases.
In most cases, the evaluation shows that result indicators and targets were not, or only rarely,
broken down by gender or age group. Despite the emphasis on young people in many OPs,
relatively few Member States defined OP-specific indicators focusing on outputs and results for
young people, so the results of interventions as regards this group could not be assessed
38 The in depth interventions analysis carried out under the thematic evaluation studies indicates that across all
fields, as a result of the crisis, the demand for ESF activities increased and more participants were
supported than initially planned. However the crisis also made achieving of results such as employment
more challenging.

22
specifically. An assessment of interventions with a specific focus on gender issues was not
possible for the same reason.
Results of support for systems and organisations
The wide diversity of activities funded by the ESF in support of systems and organisations
makes it difficult to undertake meaningful analysis at EU level, but the evaluation did establish
some quantitative and qualitative findings.
Results of activities supporting systems or organisations typically relate to the number of
entities (e.g. enterprises, administrations, NGOs) established or benefiting from a positive
result, and to products, education programmes or tools developed. Overall, at least 276 000
entities were supported and at least 109 000 products reported.
In the open public consultation, more respondents agreed than disagreed that ESF support for
organisations was successful in achieving the following results:
developing new qualifications, courses, training programmes, standards or systems:
74 % agreed, 6 % disagreed;
improving the competitiveness and adaptability of enterprises: 50 % agreed, 10 %
disagreed;
supporting start-ups: 47 % agreed, 8 % disagreed; and
improving public administration effectiveness and/or efficiency: 43 % agreed, 18 %
disagreed.
In HC, there is evidence in some Member States of impacts in terms of reducing early school
leaving rates, overcoming skills mismatches, improved teaching and learning methods, the
creation of centres of excellence, researcher mobility, the introduction of dual VET systems,
improved governance structures in VET systems (including cooperation between enterprises,
PESs, chambers of commerce and schools/other training providers) and improving the image of
the VET system39
.
In A2E, the cluster on support to PESs and other labour market institutions proved very
successful, thanks to the special emphasis on flexibility, IT development, cooperation with
social partners and multi-level governance. ESF interventions aimed at systems were often the
starting point for the development of new and existing services which were then integrated into
the everyday running of the PESs. In some cases, e.g. in Italy (Calabria) and Spain (Cataluña),
systems developed in one region were later mainstreamed in other regions.
39 •For a more detailed presentation please refer to the respective thematic report e.g. "European Social Fund (ESF)
2007-2013 ex post evaluation: investment in human capital"

23
Table 5: Headline figures for ESF: participation and results
HC A2E SI SIC PP Total
Participations (in million
persons) 60.3 28.9 7.8 1.4 0.1 98.7
Employed 25.6 4.6 1.4 1.4 0.1 33
of which self-employed 1.9 0.4 0.1 0 0 2.4
Unemployed 6.4 19.9 3.7 0 0 30
of which LTU 1.6 5.4 1.9 0 0 9
Inactive 28.3 4.4 2.8 0 0 35.6
Women 31.3 14.7 4.2 0.9 51.2
Young people (16-24) 19.4 8.4 2.2 0.1 0 30.1
Older people (55-64) 3.1 2.3 0.5 0.2 0 6.1
Disadvantaged 7.6 9.3 4.2 0.1 0 21.2
Low-skilled (ISCED 1-2) 24 11.2 3.6 0 0 38.9
Aggregated results
Participants gaining employment,
including self-employed
(millions)
1.9 6.6 0.9 0 0 9.4
Participants gaining a
qualification (millions) 6.4 1.2 0.6 0.5 0 8.7
Participants benefiting from other
positive results (millions) 10.2 1.4 2 0.1 0 13.7
Total results for participants 18.5 9.2 3.5 0.6 0 31.8
Entities supported (thousands) 254 19 1 2 0 276
Products (thousands) 53 54 0 2 0 109
Minimum success rates for
participants (73 % of allocation;
70 % of all participations)
46 % 38 % 52 %
44 %
Gaining employment 10 % 72 % 26 %
Gaining a qualification 35 % 13 % 17 %
Other positive results 55 % 15 % 57 %
Activities aimed at modernising institutions to support activation were analysed under cluster
no 4 of the SI thematic evaluation. These interventions helped to identify intermediate labour
market institutions, encourage better local cooperation and establish services to assess the
ability of disabled individuals to work and advise them on their labour market re-integration.

24
The thematic evaluation on SIC indicates that the ESF was successful in helping to reduce
administrative burdens and costs for citizens and businesses (e.g. by shortening the processing
time for documents, obtaining the necessary paperwork for starting a business. (e.g. ESF helped
to reduce the time to set-up business to 3 days, from 61 in SI and 26 in LT) and reducing the
length of judicial procedures (in SI the average duration for judicial procedures was reduced
from 9.5 to 3.9 months, while in the CZ the length of judicial proceedings was down to 497
days from an initial baseline of 1,057), making services more accessible (through the
introduction of online service delivery at various administrative levels: BG, PL, SI, CZ) or
contributing to better-quality policies and legislation (e.g. in PL and HU). In other cases results
were mixed, for example in Poland, although the share of cases handled by the courts for longer
than 12 months decreased to 14% (target 13.30%, baseline 16.7%), the indicators related to the
average duration of proceedings in commercial cases did not show a progress towards the set
target.
The thematic evaluation on PP shows various successful partnerships that proved to be
beneficial for stakeholders by tackling direct challenges (improving the labour-market
relevance of curricula or the alignment of employment, education and social policies, or
supporting sustained networks or new structures of cooperation and communication),
contributing to putting issues on the policy agenda and improving mutual learning and the
exchange of good practices.
Factors leading to success or failure
The evaluation assessed which types of intervention were more, or less, successful on the basis
of outputs, financial implementation, number of participations and implementation. Overall,
HC, SI and A2E interventions targeting individuals were more successful than those supporting
systems, which take longer to bear fruit. Fewer data and evaluations were available for systems
support than for support to individuals (at both OP and intervention level).
The in-depth analysis of interventions identified a series of factors specific to each policy theme
that enhanced the success of operations. Some are also cross-cutting in nature, such as:
designing and implementing individualised/customised/tailored approaches to the
needs of individuals, target groups or organisations;
taking account of the broader political context and alignment with national and EU
strategies;
ensuring ESF delivery bodies’ implementation capacity; and
the need to showcase successful interventions.
It was difficult to identify good practices in successful programme and project implementation,
due to the limited information collected by MAs on interventions and the factors that made for
success across all evaluation criteria. Evidence was scarce in the interventions analysed in
depth, especially in terms of follow-up to the activities after funding ended. Sometimes, too
little was done to communicate what worked well or less well and to build on earlier
experience, and more could have been done to showcase successful interventions. Good
practices stemming from the in-depth analysis are identified and reported in detail in the three
thematic studies.

25
Table 6 presents the more successful interventions and their success factors based on the
analysis of clusters (see table 4) of the 234 interventions analysed in-depth under the thematic
evaluations studies.
Table 6: Successful interventions and success factors
More successful interventions Success factors
HC
reducing early school leaving
transition to the labour market for
young people
participation in higher education
upskilling of adults
attractive learning offer (including a vocational training component
and e-learning for young learners and training clearly linked to the
labour-market needs for adults)
support integrated and holistic but flexible support measures
(including career advice and counselling) and meet a real identified
need of the target groups
A2
E
support for PESs and other
labour market institutions
personalised support
(counselling, guidance)
training (especially in working
environments)
migrant participation
(particularly through personalised
support and addressing
prejudices and social barriers)
include tailored approaches focusing the intervention on the specific
needs of the target group
identify personal situations and needs at the outset and then create
individually adjusted actions
using the experience and knowledge of institutions working closely
with the target group, as their cumulated knowledge about the target
groups helps better target the actions
including work-based learning
combining wage incentives with other measures
SI
pathway approaches40
direct employment
system interventions
supporting tailored and individualised approaches
aligning interventions with the needs identified by local and national
institutions and other stakeholders
ensuring follow-up support after ESF and ensuring the mainstreaming
of successful intervention in regular policies
ensuring synergies with other activities (e.g. supporting services;
multifaceted interventions)
supporting disadvantaged individuals who are not yet, or no longer,
eligible for unemployment benefit
SIC
projects aimed at reducing
administrative burdens for
citizens and business
projects aimed at enhancing
accessibility of services
projects aimed at ensuring better
quality policies and legislation
ensuring political backing and support for SIC interventions
strengthening mutual learning between actors
actively promoting and supporting networking
exchange of experience and good practices between stakeholders
PP
development of capacities
creation of networks and new
services, tools, methodologies
and products
connecting and harmonising PP better with national strategies
improving competences of MAs/implementing bodies in managing the
PP
improving Member State capacities to develop concepts on
partnerships
better take into account the different needs at different stages of the
organisations’ development
Table 7 presents the less successful interventions and the bottlenecks faced. It is important to
acknowledge that many types of less successful interventions usually require more time to
produce results and that many such interventions were not completed at the time of the
evaluation. Overall, the capacity of organisations implementing the ESF was the key success
factor41
as well as the continued relevance and continued political support. For more detailed
information, please refer to the Volume III of the relevant thematic report.
40 Pathway approaches represent gradual "pathway" effort to move ever closer and finally into employment of
groups that are at a distance to the labour market. 41 e.g. European Social Fund (ESF) 2007-2013 ex post evaluation: investment in human capital

26
Table 7: Less successful interventions
Less successful interventions Bottlenecks
HC
LLL system activities
VET quality
more systemic interventions require long lead-time for implementing
change
extensive coordination is required among stakeholders on the design
and delivery of effective training programmes
A2
E self-employment and
entrepreneurship
employment incentives
self-employment and start-up support are among the more expensive
interventions and generate little additional employment
employment incentives risk substitution and displacement effects42
SI
supporting and enabling actions
(targeting more disadvantaged
categories with short term
interventions such as language
courses for migrants)
reallocation of resources to other groups and/or interventions, as a
reaction to the crisis
increased distance from the labour market for the most disadvantaged
as a result of the crisis
SIC
all types lack of support for change from project implementers or political
hierarchy
insufficient capacity of beneficiaries may result in low absorption or
non-eligibility leading to ‘capacity traps’
in turn, high proportion of abandoned projects and low absorption of
funds across all intervention types
PP
partnership not embedded in the
context of decision-making or
based on top-down approaches
support provided on very small
scale
insufficient (administrative, policy and financial) capacity for
contribution by all partners
long time for ‘take-off’
Despite the data limitations faced, the ex-post evaluation has allowed to produce much stronger
evidence on target groups reached, results achieved, success factors and bottlenecks by type of
intervention of the ESF compared with what could be produced by the 2000-2006 ex-post
evaluation. Overall, thanks to the triangulation of sources, it is possible to conclude that the
interventions were generally effective in reaching the right target groups, integrating people
into the labour market, improving their skills and generating changes in systems
5.3. Efficiency
The efficiency of ESF interventions is influenced by local conditions, the type of intervention
and how ESF is used in Member States. It is therefore difficult to make any general assessment.
However, the evidence points to a need to simplify procedures further and continue to reduce
administrative burdens in management and control systems.
The average cost per participant for all interventions across the EU (obtained by dividing
expenditure by number of participations43
) was EUR 897. Such calculations should be treated
with caution, as they do not take account of other outputs stemming from support for systems
and organisations. HC interventions cost less than the average (EUR 681 per participant), A2E
interventions cost on average EUR 1 113 per participant and SI actions EUR 1 763. For the
purposes of comparison, national active labour market policy (ALMP) data indicate a much
higher cost per person (EUR 5 600 for 2007-2013).44
Costs per participant are higher for groups
42 Supported (subsidised) employees may be used to replace employees in the regular labour market 43 See section 4.2 on limitations regarding data on number of participations 44 Calculation based on 2007-2013 Eurostat data on the costs per participant of ALMP type 2-7.
27
that have specific needs (such as the self-employed and entrepreneurs) or who are particularly
disadvantaged (e.g. SI clusters for supporting and enabling actions: EUR 3 092; systemic
measures: EUR 5 771).
The costs of obtaining a positive result were also calculated for a number of individual PAx.
They are highest for ‘system-type’ interventions, such as upskilling adults or enhancing VET
quality.
Beyond the obvious differences in purchasing parity, there is insufficient evidence to attribute
the considerable differences in cost per participant across Member States (or result where
available) to different levels of efficiency in implementation. One reason underlying the
variation is the different role of ESF investments in the Member States. Some Member States
use the ESF to fund national policies or to supplement national schemes with additional
features, while in others it is used almost exclusively to develop innovative approaches, which
tend to be more expensive per participant.
In the open public consultation, many respondents agreed with the statement that the ESF was
cost-effective in the five policy areas of intervention, although less so for SIC and PP:
HC: 59 % agreed, 11 % disagreed;
A2E: 51 % agreed, 13 % disagreed;
SI: 59 % agreed, 9 % disagreed;
SIC: 33 % agreed, 15 % disagreed; and
PP: 39 % agreed, 10 % disagreed.
The respondents judged that most administrative requirements (as regards communication,
implementation of projects, the designation of authorities, OP design, project selection and
evaluation) were appropriate. The administrative requirements most often deemed ‘excessive’
were audits (38 % of respondents), the set-up of management and control systems (37 %) and
reporting (36 %).
The Delivery Systems work package of the ex-post evaluation of the Cohesion policy45
found
that the administrative burden in project selection and implementation was high. In particular,
this was because of complex internal administrative rules causing delays in project selection,
and public procurement procedures. The proportionality of the requirements and controls was
questioned more in non-cohesion countries, where programmes tend to be smaller. This
evaluation identifies two main drivers of high administrative workload:
strict documentation requirements
While ensuring the correct handling of timesheets, the retention of documentation for
each payment for a long period of time, regardless of the amount, causes considerable
expense and stress during project implementation. Such procedures affect the capacity
of those concerned (especially NGOs with limited capacity) to manage the process and
may impact activities by diverting resources from activities that are necessary to those
45 This work package, conducted in the framework of the ERDF and Cohesion Fund ex-post evaluation organised
by DG Regional and Urban Policy, also covered ESF
http://ec.europa.eu/regional_policy/sources/docgener/evaluation/pdf/expost2013/wp12_final_report.pdf
28
that are easier to carry out. The evaluation recommends more widespread application of
the simplified cost options (SCOs), greater use of electronic storage and the exchange of
documents to remedy these issues; and
high number of controls and audits
Although still perceived as excessive, the implementation of the single-audit principle
and the resultant increased role of national audit authorities were credited with the
significant reduction of error rates as compared with the previous programming period.
However, the evaluation found that much of the administrative burden was a result of
implementation problems stemming from incomplete application of the principle,
leading to multiple controls at various levels, but also contradictory interpretations of
the regulations and a lack of capacity at management level. It also points to the potential
of more widespread risk-based approaches to management verification and audits to
reduce costs further and to minimise administrative burden.
It is worth noting that the simplified cost Options (SCOs) introduced in 2007-2013 (flat-rate
financing, standard scales of unit costs and lump sums) actually covered only 7 % of total
expenditure. Such a rate of take-up may be considered insufficient. The main obstacles
identified in the survey of MAs46
were legal uncertainty and a fear of potentially large financial
impacts of financial corrections in the event of systematic errors.
By 31 December 2014, a total of 53 Financial Engineering Instruments (FEIs)47
under ESF OPs
had been set up in seven Member States (DE, DK, EE, IT, LT, LV and PL). The OPs
contributed a total of EUR 829.2 million to several financial instruments in support of the self-
employed, long-term unemployed and women, including EUR 461.7 million (0.6 % of the total
ESF budget) from the ESF itself. Although strengthened during the programming period,
reporting arrangements for FEI implementation remained fragmented, without giving full
information on the use of the funds and supporting administrative arrangements. After a slow
start, the disbursement of funds to end recipients increased over the last years of
implementation, even if in some cases the risk of non-absorption of FEI resources remains.
5.4. Gender sensitivity
In ESF 2007-2013 programming, Member States applied the principles of gender equality in a
cross-cutting way in their OPs. However, this approach sometimes replaced more specific
actions on gender sensitivity. Most interventions, across various policy themes, claimed to be
gender-neutral, but did not include specific actions directly addressing gender sensitivity as
such. Few interventions were identified that focused on improving the overall position of
women in the labour market. Despite the increased emphasis on mainstreaming gender
considerations in this programming period, there is insufficient evidence to assess the inclusion
of gender equality in intervention design, objectives and target groups or concrete programme
contribution to gender equality issues.
46 http://www.cc.cec/Ares/ext/documentInfoDetails.do?documentId=080166e5a40d1421 47 Summary of data on the progress made in financing and implementing FEIs reported by the MAs in
accordance with Article 67(2)(j) of the General Regulation, DG EMPL, DG REGIO (September 2015).

29
5.5. Sustainability
In 2007-2013, there was no common approach to assessing the sustainability of ESF
interventions for individuals.48
There was considerable variation in observed sustainability, with
results ranging from 20 % to 91 % in SI and HC, depending on the nature of the intervention
and the target group. Available data from the in-depth analysis and Member States’ evaluations,
mainly for A2E interventions, show the ESF’s potential to contribute to sustainable results for
individuals. Systematic follow-up of individual results in other thematic areas, such as lasting
improvements of skills and competences, is rare and does not provide sufficient evidence to
draw conclusions.
Mixed results were found for the sustainability of results for interventions targeting systems.49
One-off efforts to increase the quality of education are often limited in terms of sustainability,
as their success is highly dependent on specific follow-up. However, interventions focusing on
LLL systems or staff training achieved more sustainable results. Factors that were found to
contribute to the sustainability of the interventions themselves across the Member States are:
the conversion of new working relations into lasting networks;
the sharing of lessons learned;
the adoption of common approaches; and
the mainstreaming of approaches.
5.6. Coherence
The General Regulation (Article 9) required ESF assistance to be consistent with the
Community’s activities, policies and priorities and to complement its other financial
instruments. Accordingly, an effort was made at the programming stage to align OP objectives
with national priorities through common national reference frameworks based on common
Community strategic guidelines. The ESF’s consistency with EU policies and priorities was
discussed extensively in section 2.1. The evaluation has found a particularly strong alignment
of ESF with the priorities identified under the country specific recommendations.
The ESF coherence and complementarity with other EU financial instruments, notably in the
areas of education, research and support for the integration of non-EU immigrants, were
examined during the programming phase and OPs showed how they were achieved. However,
they were not considered explicitly in the design of the ex post evaluation50
.
Overall, respondents in the public consultation agreed that the ESF complemented (and was
therefore coherent with) other EU funds:
HC: 45 % agreed, 13 % disagreed;
A2E: 40 % agreed, 13 % disagreed;
48 ‘Sustainability of results for individuals’ measures whether the effects of the ESF on individuals lasted a period
of time (e.g. six months, a year) after the support ends. 49 ‘Sustainability of results for systems and organisations’ measures whether the changes supported were still in
operation or implemented sometime after the end of the support. 50 The coherence criteria was introduced by the Better Regulation guidelines while the evaluation studies were
already commissioned and ongoing

30
SI: 39 % agreed, 13 % disagreed;
SIC: 27 % agreed, 11 % disagreed; and
PP: 33 % agreed, 10 % disagreed.
However, the question as to complementarity with other funds was not answered by up to a
third of the respondents by policy field, indicating that many appeared not to have experience of
other funds. This complementarity was perceived most often in HC and A2E, but also in SI,
SIC and PP.
Despite alignment at programming level, the thematic evaluations found few examples of actual
inter-programme coordination at operational level between interventions under the ESF and
other structural funds or EU programmes. In some Member States, there was no link at all. The
exceptions found were in the field of entrepreneurship and in HC, where there was some
coordination with ERDF programmes. Some cases of complementarity with ERDF/CF were
noted, in particular in the HC thematic evaluation:51
the ERDF/CF contribution to Latvia’s VET
infrastructure was accompanied by ESF-financed interventions designed to increase the
attractiveness of vocational education. Similarly, in Italy, ERDF/CF investment in new
education technologies was accompanied by ESF investment in new teaching methods.
Such evidence of a lack of coordination on the ground is consistent with the findings of the
2000-2006 ESF ex post evaluation.
5.7. EU added value
To analyse EU added value, the evaluation used a wider framework extending beyond what
could be achieved by Member States at national and/or regional levels. This framework helps to
establish better the extent to which the ESF was additional to national funding and programmes,
and the ways in which the support helped reform and improve national systems. While it was
not always possible to quantify the effects (see Annex 6 on limitations), their significance was
established using a systematic set of criteria in each case. The results of the assessment are in
line with the public consultation, where on average 50 % agreed that the ESF brought EU added
value and 13 % disagreed.
EU value of the ESF:
a) volume effects: ESF action adds to existing action, either by supporting national action in
general (‘mirroring’) or in specific areas of national policy (‘boosting’);
b) scope effects: ESF action broadens existing action by supporting groups or policy areas that
would not otherwise receive support;
c) role effects: ESF action supports local/regional innovations that are taken up at national
level or national innovative actions that are then mainstreamed; and
d) process effects: ESF action influences Member-State administrations and organisations
involved in the programmes.
51 European Social Fund (ESF) 2007-2013 ex post evaluation: investment in human capital, ICF international
(2016).

31
The evaluation concluded that ESF programmes generated all four forms of EU added value.
The most visible are the volume and scope effects, but the role and process effects are also
visible and significant.
Table 8: Overview of EU added value by effects52
HC A2E SI
Mem
ber
Stat
e
Vo
lum
e
Sco
pe
Ro
le
Pro
cess
Vo
lum
e
Sco
pe
Ro
le
Pro
cess
Vo
lum
e
Sco
pe
Ro
le
Pro
cess
AT + + + + + ++ + + + ++
BE + + + + + ++ ++ + +
BG ++ ++ ++ + ++ + ++ + ++ +
CY + + ++ + +
CZ ++ + + + + + ++ + +
DE + + + + ++ + ++ + + + +
DK + + + + + + +
EE + + + ++ ++ + + + +
EL + + + ++ + + ++ +
ES + + + + + + + + + +
FI + + + + + + + + +
FR ++ + + + + + + + +
HU ++ + + + ++ + + + + +
IE + + + + +
IT + + + + ++ + + + + +
LU + + + +
LV ++ ++ ++ + ++ + + + + +
LT ++ ++ + + ++ ++ + + + ++ + +
MT ++ + + + + + ++ + +
NL ++ + + + + + + +
PL ++ ++ + + ++ + + + ++ + + ++
PT ++ + + + + + + +
RO ++ + ++ ++ + + + ++ ++
SE + + ++ + + + + + +
SI ++ ++ + + + + + +
SK ++ + + ++ + + + ++ + +
UK + + + + + + +
Volume effects were the largest effects across all policy themes, as the ESF provided a
significant financial contribution to implement national policies addressing employment and
social challenges in a majority of Member States. The significance of ESF investments in
relation to national funding varies substantially across countries, particularly between more and
less developed Member States, where the ESF is most relevant:
high significance: BG, CZ, EE, EL, HR, LT, LV, MT, PL, PT, RO, SI, and SK;
some significance: BE, CY, DE, ES, FR, HU, IT and UK;
52 ESF Ex-Post evaluation Synthesis 2007-2013: EU Synthesis report, National synthesis reports.

32
low significance: AT, DK, FI, IE, LU, NL and SE.
Overall, the significance of the ESF was highest in the area of ALMPs. A2E expenditure
compared to national ALMP expenditure was above 70% for 8 Member States (BG, EE, EL,
LV, LT, MT, RO, SK) while it was less than 10% for 11 Member States (AT, BE, CY, DE, DK,
FI, FR, IE, LU, NL, SE) in remaining 9 Member States ESF had medium significance.
Similarly, SI expenditure also may be compared to national ALMP expenditure, as it often
funds activities of the same nature. ESF investment in SI was above 70% compared to national
ALMP financing for 7 Member States (BG, CY, CZ, EL, HR, RO, SK) while below 4% for 13
Member States (AT, DK, EE, ES, FI, IE,IT, LT, LU, MT, NL, SE, UK).
In the area of HC, the relative importance of ESF contribution was highest for PT, CZ, where it
made up more than 5% of all national education and training expenditure (excluding primary
education). For 10 Member States ESF investment in HC reached 2-5 % (BG, EE, HU, LT, LV,
MT, PL, RO, SI, SK), while for 16 Member States ESF SI investment contributed less than 2%
of the national expenditure on E&T expenditure53
. Even in countries where the ESF’s
contribution in a given policy field was less significant, the evaluation identified sub-areas,
particularly in HC, where there were important volume effects, e.g. in school education, early
school leaving and transition to the labour market. For example, while the Italian country
report54
indicates that HC investment in Italy constituted 1.3 % of the national funding for
education, the ESF provided up to 80 % of the financing for public training activities.
In the context of the crisis, national resources allocated to the interventions would have been
lower in the absence of the ESF, especially in those Member States with severe national budget
restrictions following the crisis, as explained in chapter 5.1.
ESF 2007-2013 also provided added value by broadening the scope of existing national
interventions. By making use of ESF interventions, Member States were able to offer more
tailored and intensive services to specific target groups, such as people with disabilities, young
people at risk of early school leaving and unemployed people with low qualifications. These
groups would otherwise have had no access to such services or access to mainstream services
only. Further, some successful interventions were taken up in mainstream policy, e.g. in
Belgium, France, Italy and Sweden. In SI, the ESF investment helped to reach new target
groups not covered by existing provisions (EE, EL, ES, MT, PL, PT). Further, in many other
countries, it contributed to strengthening or expanding the existing service offer for specific
groups (for instance in CY, IT, DE, FR).
Value added of ESF in the HC policy field:
In the field of education, Member States used the ESF to address a wide number of the CSRs
supporting reforms, to increase participation in education and training, to improve the quality of
education and training systems and change some education delivery mechanisms, to address the
particular HC needs of certain target groups and to respond to the challenges posed by the
economic crisis.
53 Annex IV of the ESF 2007-2013 synthesis report 54 ESF Ex-post Evaluation Synthesis 2007-2013 Contract VC/2015/0098, Country Report – Italy

33
The thematic evaluations provide many instances where ESF activities were used as a model to
test new and innovative provision that were subsequently mainstreamed nationally55
. ESF 2007-
2013 contributed to changing the role of public services, such as PES and educational
institutions, and more generally improving delivery systems, particularly in the areas of HC and
PP. In HC, ESF was used to test and implement new and innovative activities at local, regional
or national level and provided EU added value through the introduction of new ways for
education stakeholders to work together or pedagogical innovations in the curriculum and
delivery of learning in 25 Member States (except IE, NL and SI). These effects were
particularly prominent in CONV regions where administrative reforms were supported by the
ESF under SIC interventions. In the open public consultation, many respondents agreed that the
ESF facilitated the testing and implementation of innovative activities in these policy areas:
• HC: 60 % agreed, 9 % disagreed;
• A2E: 57 % agreed, 11 % disagreed;
• SI: 59 % agreed, 11 % disagreed;
• SIC: 36 % agreed, 12 % disagreed; and
• PP: 37 % agreed, 10 % disagreed.
Examples quoted included skills pipelines, e-services, new channels for communicating with
participants, and mobile social workers.
The evaluation shows that ESF interventions added value in terms of process effects. Most
interventions in the field of PP and SIC were dedicated specifically to changing ways of
working. Interventions in A2E contributed to the adoption of systemic reforms and
administrative capacity-building in public services, such as PES and educational institutions,
mainly in CONV regions. The ESF contributed to establishment of successful partnerships
facilitating co-operation between and raising the capacity of various public sector actors, as
well as between the public sector, the private sector and NGOs. These measures mainly
focussed around the upgrading of the operation of labour market institutions (e.g. CY, DE, EL,
FR, HU, MT); addressing discrimination and awareness raising on equal opportunities (e.g. ES,
EL, FI, LT) or the social economy (e.g. LT, PL).56
. In the field of HC, the ESF was used to fund
a range of reforms, ranging from improvements in the quality of lifelong learning (BG, FR),
measures to improve teacher training (BG, CZ), the introduction of new management and
evaluation methods in initial education (BG, IT), changes to the management, quality assurance
and definition of study programmes in HE (BG, DE, CZ, IT, MT) and introduction of measures
to improve the quality and structures of VET (CZ, IT, MT, PL)57
.
In the open public consultation, many respondents agreed that the ESF was instrumental in
supporting structural reforms in the five policy areas, in particular in schools, local authority
educational structures and healthcare.
55 European Social Fund (ESF) 2007 – 2013 ex post evaluation: Supporting the integration of disadvantaged
groups into the labour market and society’ Volume 1 56 European Social Fund (ESF) 2007 – 2013 ex post evaluation: Supporting the integration of disadvantaged
groups into the labour market and society’, Volume 1 57 European Social Fund (ESF) 2007-2013 ex post evaluation: investment in human capital, Volume 1

34
5.8. Socio-economic impact
The ESF had socio-economic impacts, to varying degrees, at three levels: micro (effects on
individuals and organisations), meso (effects on systems) and macro (effects on macroeconomic
aggregates).
Section 5.2 showed the extent of the microeconomic effects through the large number of
people participating in the ESF and the results achieved, but also that the ESF invests in policy
fields where there are development needs (see also section 2.1). HC activities received a larger
budget share in CONV regions than in RCE regions (51 % vs 38 %) and more participations
(43 million vs 17 million), resulting in over 6 million qualifications, as against 2.6 million in
RCE regions. A2E activities were more important for RCE regions, with more participations
(16 million vs 13 million in CONV regions) and recorded 5.9 million employment results, as
against 3.5 million in CONV regions. A further illustration is provided by the coverage of
participants by educational level: the ESF reached 21 % of students at ISCED level 4, 8 % at
level 3, 6 % at levels 1 and 2, and 6 % at levels 5 and 6.
Member States have made limited use of CIEs58
to ascertain the impact of the ESF on
individual participants. Where CIEs have been carried out, they have found that ESF
interventions were more effective than national interventions or the absence of any services
(e.g. the results of ESF activities in Finland were found to be generally comparable to national
results, despite the fact that more disadvantaged target groups were targeted).59
To promote
impact evaluations, the Commission granted financial support for eight pilot projects
conducting CIEs of a wide range of ESF interventions in the areas of ALMP and vocational
training. Some of the evaluations were able to establish robust conclusions:60
the evaluation of the causal effect of the Portugal’s Convocatorias activation scheme
found that the probability of transition into employment doubled from 4 % to 8 % for
the unemployed participants, as compared with similar non-participants. It also
estimated that the programme had a positive financial impact of EUR 240 million over
the first year of operation;
the evaluations of some Italian, Spanish and Portuguese support schemes for young
unemployed people concluded that training for the young generally increased their
employability and the number of weeks worked per year;
the evaluation of hiring incentives schemes in Italy and Lithuania concluded that these
policies increased the duration of employment, but at high costs;
the evaluation of a reform in Portugal that introduced vocational training into the upper
secondary school curriculum increased educational attainment and reduced school
dropout rates, but lowered the chances of students going on to university; and
58 Counterfactual Impact Evaluation compares the outcomes of those having benefitted from a programme with
those similar in all respects to the treatment group not benefiting. 59 Työvoimapoliittisilta toimenpiteiltä sijoittuminen vuonna 2010, TEM-analyysejä 42/2012 [Placements from
ALMP in 2010, Ministry of Employment and the Economy analysis 42/2012], Sihto M, Tuomaala M, Sardar P. 60 Synthesis report on pilot projects to carry out ESF-related counterfactual impact evaluations, Leandro Elia,
Giulia Santangelo, Sylke V. Schnepf, JRC-DDG1 (2015);
http://ec.europa.eu/esf/main.jsp?catId=67&langId=en&newsId=2571.

35
the general training policies evaluated in the Estonian and Lithuanian pilots did not have
significant causal effects on labour market chances.
As regards effects at meso level, section 5.7 provided extensive examples of support for the
modernisation, strengthening and widening of the scope of public services such as PESs and
other ALMP institutions and support for health and safety measures at work61
. Thematic reports
point also to more horizontal support for reforms in healthcare, where, for example, ESF
supported reforms in the disability assessment system (CY), education of the healthcare
professionals (LV, IT) as well as deinstitutionalization of care (BG), helping integration of
people with disabilities (CY, LT, RO, SK, UK) and addictions (LT, UK) into society and labour
force62
. As noted in the 6th
Cohesion Report,63
strengthening administrative capacity is critical,
since high growth rates and regional economic convergence cannot be achieved without good
governance. The SIC thematic evaluation found concrete examples of the ESF’s contribution to
administrative capacity-building in some specific areas:
it helped to reduce the length of judicial proceedings, as observed in SI and CZ (cf.
chapter 5.2).
it supported expansion of the number of services offered via e-government in SI, BG,
PL and CZ, and reduction of the administrative burden for companies in SI, PL and LT;
and
in Poland, it helped fund simplifications to 92 legal acts and the creation of one-stop
shops for start-ups, raised the quality of tax administration services and equipped the
judiciary with skills for dealing with economic cases.
At macroeconomic level, simulations using the Quest III and RHOMOLO models,64
on the
impact of the HC investments show positive effects in terms of GDP (+0.25 %) and
productivity. These effects are much stronger in the EU-12 (+1.5 %), but they are also positive
for the EUR-15 (+0.2 %). The gains in GDP are apparent in the medium term, but they are
significant and highly persistent in the long term, since they interact positively with the
accumulation of physical capital and technology. It should be borne in mind that such broad
macro-level developments take time to materialise and are influenced by many other
macro-level developments.
There were few national evaluations attempting to establish macro-level impacts. Bulgaria’s
evaluation linked the ESF contribution to a 1.6 % increase in employment, a 1.1 % decrease in
unemployment and a 0.8 % boost to GDP.65
The Lithuanian authorities attempted to estimate
the impact on the basis of constructed socio-economic indicators encompassing employment,
health, education and other factors. However the evaluation66
found it difficult to isolate the
contribution of the structural funds in preventing the deterioration of these indicators as a result
of the crisis.
61 •European Social Fund (ESF) 2007-2013 ex post evaluation: investment in human capital 62 •ESF 2007-2013 Ex post Evaluation: Access and sustainable integration into employment 63 6th report on economic, social and territorial cohesion, European Commission (2014). 64 WP14a: The impact of cohesion policy 2007-2013: model simulations with Quest III – final report;
WP14b: The impact of cohesion policy 2007-2013: model simulations with RHOMOLO, European
Commission, Directorate-General for Regional and Urban Policy (April 2016). 65 National strategic report for Bulgaria, 2012. 66 Counterfactual impact evaluation of ESF-funded active labour market measures in Lithuania, PPMI 2014.

36
The deterioration of the unemployment levels initiated in 2008 continued until the year 2014,
when both the number unemployed and the unemployment rate (at 10%) started to decrease and
the employment rate to increase (at 69.2%). However, employment participation rates of
population aged 15-64 increased continuously throughout the programming period from 70.7%
to 72.3% in 2014. Despite the difficulty of establishing any statistically significant correlation
between changes in the employment rate, education indicators and the proportion of ESF
investments, the thematic evaluations conducted at European level confirm that the ESF played
a positive role in helping to improve Member States’ performance in achieving the Europe 2020
targets for smart and sustainable growth. Considerable improvements were seen over the period
in the area of education at EU28 level: in 2014, the rates of early school leaving decreased by
3 percentage points compared to 2008, HE attainment rates increased by 7 percentage points
over the same period and gender gaps in the key education and training indicators narrowed. In
addition, expenditure on R&D increased, albeit minimally (by 0.2 percentage points). In the
field of SI, there was a significant decrease in the rates of people at risk of poverty in EU-12
countries (though an increase in some old Member States due to the economic crisis). This is
the only area in which a significant correlation was found between change in the rates of
poverty and social exclusion and the proportion of ESF investments in SI.
Overall, the role of ESF was more prominent in the regions eligible under the Convergence
objective. For example, in Bulgaria, the ESF was used to target a broad set of EU 2020
objectives and CSRs. Almost all pupils in schools participated in activities designed to reduce
early school leaving and most of the VET sector received ESF assistance thus contributing to
reduction in ESL from 15 % in 2008 to 13 % in 2014 in Bulgaria. A large number of
university-level students were supported by the ESF, contributing to the increase in the level of
tertiary educational attainment from 27% in 2008 to 31% in 2014. The ESF enabled reforms in
PES, allowing more targeted support for Roma and other disadvantaged groups contributing to
social inclusion. Over the programming period, there was marked decrease of number people at
risk of poverty in BG, with half a million people improving their relative prosperity. ESF
supported the majority of participants in ALMP measures (however labour market participation
in BG decreased in 2014 compared to 2008 by 6%), provided assistance to R&D activities
(R&D expenditure rose from 0.4% of GDP in 2008 to 0.8%in 2014) and supported state
capacity building (including in the judiciary). The case of Bulgaria is an example of the
important role played by ESF in the convergence of Member States and regions whose
development was lagging behind by improving conditions for growth and employment.
Finally, more respondents agreed than disagreed with the statement that the ESF interventions
contributed to strengthening economic and social cohesion in the five policy areas.
HC: 72 % agreed, 6 % disagreed;
A2E: 68 % agreed, 8 % disagreed;
SI: 69 % agreed, 8 % disagreed;
SIC: 35 % agreed, 11 % disagreed; and
PP: 44 % agreed, 9 % disagreed.
The ESF played a significant role in maintaining levels of public expenditure in labour market,
education and training (see section 5.7), and social policies in times of budgetary consolidation
(see section 5.1), thus facilitating contra-cyclical policy reaction. Though financially limited at
EU level, the ESF has great significance for a sizeable number of (especially CONV) Member

37
States, and the availability of the funding and the flexibility of the programming helped provide
financial stability and address the challenges raised by the crisis. As a result, the ESF helped
mitigate and address the negative effects of the crisis
Member States used the built-in ESF flexibility to reallocate and maintain expenditure to the
groups most vulnerable during the crisis (men, young people, the low-skilled). Additional
resources were dedicated to short-term work arrangements (e.g. in Italy and the Czech
Republic) and instituting general placement services (Finland).
Finally, some Member States receiving assistance under the various multilateral financial
support mechanisms made significant use of the ESF to finance the delivery and reforms of
ALMPs (CY, PT, LV, ES, EL), youth employment (EL, PT, CY, ES), the modernisation of
VET systems, education systems and the strengthening of apprenticeship systems (LV, PT), and
welfare system, judiciary and administrative reforms (LV, EL). The monitoring of the Greek
memorandum of understanding made a priority of ensuring the availability of funding for
national contributions and human resources for the adequate absorption and implementation of
the programmes, with Commission support via technical assistance and increased co-financing.
In the open public consultation, two thirds of the respondents agreed with the statement that the
ESF OPs helped to mitigate the effects of the economic and financial crisis (see section 5.1).
6. CONCLUSIONS AND LESSONS
6.1. Conclusions
During 2007-2013 ESF aimed at improving employment and job opportunities, enhancing
human capital and the adaptability of workers and reinforcing the social inclusion of
disadvantaged people in the EU. These aims proved to be fully relevant in the economic context
in which the programmes were designed and even more so during their implementation, due to
the deterioration of the socio-economic started in 2008. The alignment with EU policies and
priorities under the Lisbon Strategy and Europe 2020 (employment guidelines and country
specific recommendations) was much stronger in 2007-2013 than in 2000-2006 and meant that
resources were concentrated on relevant policy priorities. The ESF also played a significant role
in mitigating the negative effects of the crisis (notably in CONV regions) and responding
effectively to associated emerging challenges.
The evaluation, despite the limitations of the data sets available, presents evidence that ESF in
2007-2013 reached a significant number of EU citizens and that the interventions were
generally effective in reaching the target groups more in need of support (such as the low-
skilled and unemployed), integrating people into the labour market, gaining jobs, improving
their skills and social inclusion. ESF was instrumental in providing support to groups that
otherwise would not have been supported, or not to the same extent, by other interventions at
EU or national level, such as migrants, the disabled and members of marginalised communities
(e.g. Roma).
On the efficiency of ESF, the evaluation provides estimates of the average cost per participant in
all interventions, but due to the influence of local conditions, the type of interventions and how
ESF is used in Member States, it proved difficult to conclude substantially on the efficiency of
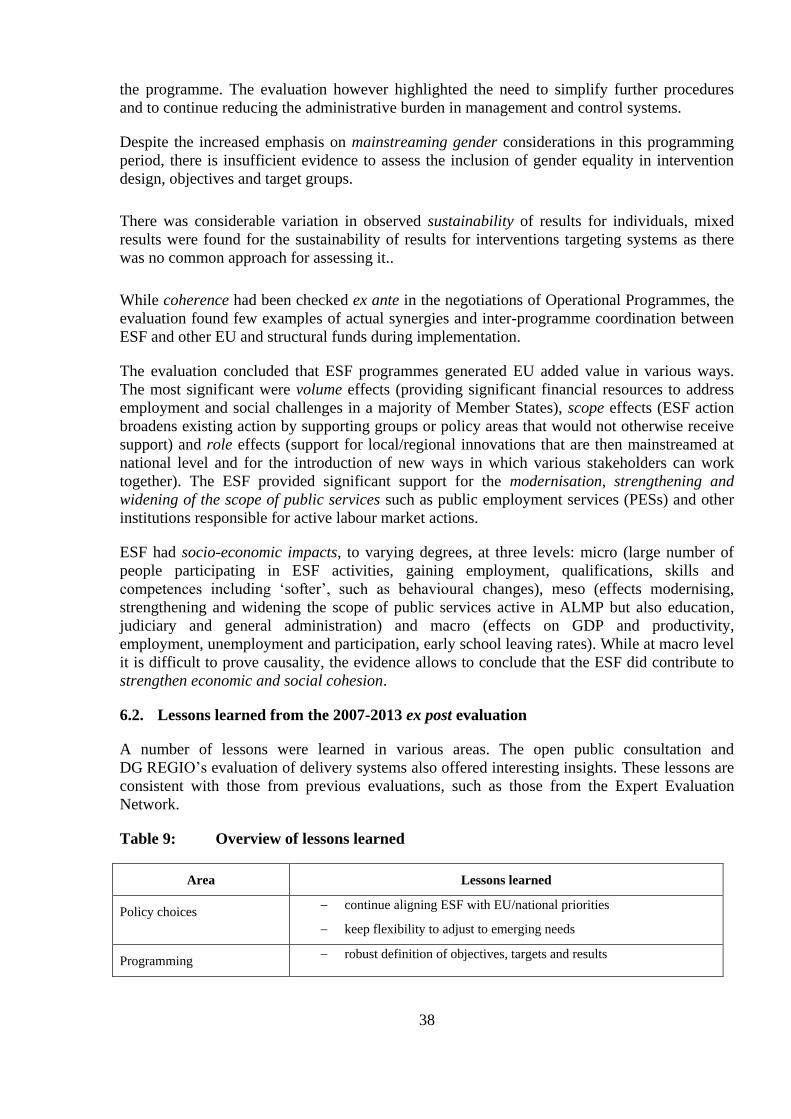
38
the programme. The evaluation however highlighted the need to simplify further procedures
and to continue reducing the administrative burden in management and control systems.
Despite the increased emphasis on mainstreaming gender considerations in this programming
period, there is insufficient evidence to assess the inclusion of gender equality in intervention
design, objectives and target groups.
There was considerable variation in observed sustainability of results for individuals, mixed
results were found for the sustainability of results for interventions targeting systems as there
was no common approach for assessing it..
While coherence had been checked ex ante in the negotiations of Operational Programmes, the
evaluation found few examples of actual synergies and inter-programme coordination between
ESF and other EU and structural funds during implementation.
The evaluation concluded that ESF programmes generated EU added value in various ways.
The most significant were volume effects (providing significant financial resources to address
employment and social challenges in a majority of Member States), scope effects (ESF action
broadens existing action by supporting groups or policy areas that would not otherwise receive
support) and role effects (support for local/regional innovations that are then mainstreamed at
national level and for the introduction of new ways in which various stakeholders can work
together). The ESF provided significant support for the modernisation, strengthening and
widening of the scope of public services such as public employment services (PESs) and other
institutions responsible for active labour market actions.
ESF had socio-economic impacts, to varying degrees, at three levels: micro (large number of
people participating in ESF activities, gaining employment, qualifications, skills and
competences including ‘softer’, such as behavioural changes), meso (effects modernising,
strengthening and widening the scope of public services active in ALMP but also education,
judiciary and general administration) and macro (effects on GDP and productivity,
employment, unemployment and participation, early school leaving rates). While at macro level
it is difficult to prove causality, the evidence allows to conclude that the ESF did contribute to
strengthen economic and social cohesion.
6.2. Lessons learned from the 2007-2013 ex post evaluation
A number of lessons were learned in various areas. The open public consultation and
DG REGIO’s evaluation of delivery systems also offered interesting insights. These lessons are
consistent with those from previous evaluations, such as those from the Expert Evaluation
Network.
Table 9: Overview of lessons learned
Area Lessons learned
Policy choices continue aligning ESF with EU/national priorities
keep flexibility to adjust to emerging needs
Programming robust definition of objectives, targets and results
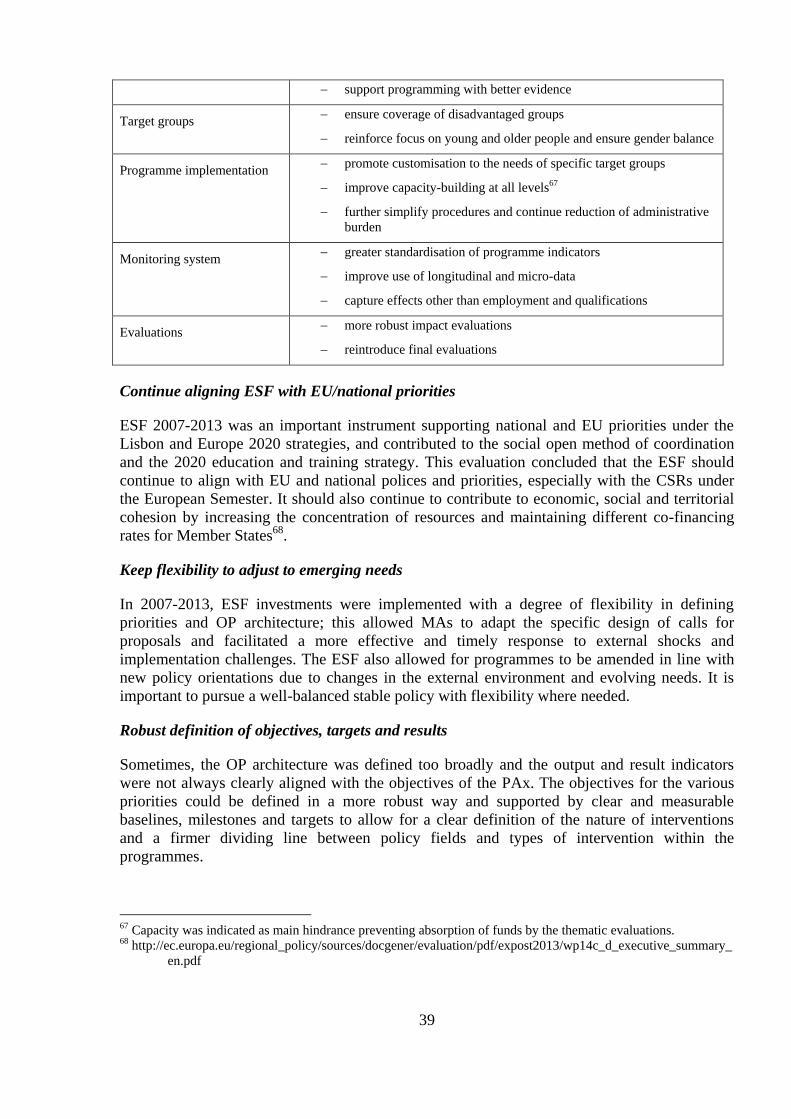
39
support programming with better evidence
Target groups ensure coverage of disadvantaged groups
reinforce focus on young and older people and ensure gender balance
Programme implementation promote customisation to the needs of specific target groups
improve capacity-building at all levels67
further simplify procedures and continue reduction of administrative
burden
Monitoring system greater standardisation of programme indicators
improve use of longitudinal and micro-data
capture effects other than employment and qualifications
Evaluations more robust impact evaluations
reintroduce final evaluations
Continue aligning ESF with EU/national priorities
ESF 2007-2013 was an important instrument supporting national and EU priorities under the
Lisbon and Europe 2020 strategies, and contributed to the social open method of coordination
and the 2020 education and training strategy. This evaluation concluded that the ESF should
continue to align with EU and national polices and priorities, especially with the CSRs under
the European Semester. It should also continue to contribute to economic, social and territorial
cohesion by increasing the concentration of resources and maintaining different co-financing
rates for Member States68
.
Keep flexibility to adjust to emerging needs
In 2007-2013, ESF investments were implemented with a degree of flexibility in defining
priorities and OP architecture; this allowed MAs to adapt the specific design of calls for
proposals and facilitated a more effective and timely response to external shocks and
implementation challenges. The ESF also allowed for programmes to be amended in line with
new policy orientations due to changes in the external environment and evolving needs. It is
important to pursue a well-balanced stable policy with flexibility where needed.
Robust definition of objectives, targets and results
Sometimes, the OP architecture was defined too broadly and the output and result indicators
were not always clearly aligned with the objectives of the PAx. The objectives for the various
priorities could be defined in a more robust way and supported by clear and measurable
baselines, milestones and targets to allow for a clear definition of the nature of interventions
and a firmer dividing line between policy fields and types of intervention within the
programmes.
67 Capacity was indicated as main hindrance preventing absorption of funds by the thematic evaluations. 68 http://ec.europa.eu/regional_policy/sources/docgener/evaluation/pdf/expost2013/wp14c_d_executive_summary_
en.pdf

40
A number of ESF interventions did not have output and/or result targets. Often, targets were not
realistic or measured what was easily measurable (i.e.: outputs) rather than the progress
achieved in addressing the problem (results). A common target-setting methodology at EU
level, including coherent and consistent terminology and definitions, procedures and preferable
types of target, would improve the monitoring of achievements and the implementation of
mechanisms to adjust targets.
Support programming with better evidence
The thematic evaluations showed that some interventions were funded without prior appraisal
of their anticipated effectiveness or consideration of similar experiences in the past. The
assessment of efficiency was hindered by a lack of data on individual project activity costs.
There is scope for more evidence-based programming, with activities being chosen on the basis
of evidence of their past (cost-) effectiveness or ex ante assessment of potential impacts.
Information was lacking to assess the sustainability of ESF interventions to help guide future
policy-making. Factoring in sustainability from the outset means that planning for sustaining
activities (including contingency planning for follow-up and/or appropriate exit strategies)
should begin alongside the programming.
Ensure coverage of disadvantaged groups
The in-depth thematic evaluations pointed to the difficulty of reaching out to the most
disadvantaged (such as addicts and ex-offenders) and communities such as Roma. Nevertheless,
the ESF funded effective approaches to reaching out to and engaging with these groups in some
Member States, combined with the provision of intensive support throughout the intervention
(and subsequent follow-up). The reduced proportion of participation by disadvantaged groups
(see section 5.2) in 2007-2013 signals that the ESF support worked less well than intended and
that stronger support is needed for a stable integration of disadvantaged groups in the labour
force.
Reinforce focus on young and older people and balanced representation by gender
The increased EU-level policy attention to youth unemployment and the introduction of various
specific youth employment policies in 2010-2013 did not translate directly into increased
participation by young people (under 25) in the second half of the programming period.
The proportion of participants aged 55-64 has been stable over the years, but seems
comparatively small in view of the growing attention to active ageing in the context of rising
pensionable ages and reduced incentives for early retirement. The HC thematic evaluation
concludes that the needs of older workers were not met well, while that on A2E indicates that
interventions specifically dealing with active ageing are quite limited. The Court of Auditors
special report no 25/2012 (Are tools in place to monitor the effectiveness of European Social
Fund spending on older workers?) also pointed out that this target group did not necessarily
have its own indicators or targets. Consequently, it was not possible to assess the effectiveness
of the actions addressing their needs.
Insufficient attention was paid to gender sensitivity during project development and this
remains an area for attention in future programming.

41
Promote customisation to the needs of specific target groups
The thematic evaluations69
report more positive effects for interventions that target a clearly
defined target group than those with a wider scope (especially for interventions addressing
disadvantaged groups and those facing multiple challenges such as addictions or health issues).
Moreover, in line with the findings of the HC thematic evaluation, it is needed that
interventions meet real demands or needs (especially for those who are already motivated to
improve their qualifications or to search for work) and address clear gaps in the labour market.
Improve capacity-building at all levels
The main reasons for delayed implementation of the ESF, apart from the economic and
financial crisis, were delayed start of interventions, a lack of management skills and the
administrative capacity of delivery partners, especially at the beginning of the programming
period70
. This underlines the need to continuously to improve ESF management and
coordination practices by further capacity-building, training and mentoring (particularly among
stakeholders new to the ESF) and avoiding pitfalls of 'capacity traps'.
Further simplify procedures and continue reduction of administrative burden
The issues concerning administrative burden appeared to be the result of implementation
problems related to inertia and lack of legal certainty, rather than inherent to the design of the
system. There is a need to increase the uptake of simplification measures. Application
procedures and supporting documentation should be clear and easy to follow (see section 5.3).
Detailed and clear methodological guidelines on financial and performance-reporting
requirements are essential to facilitate sound financial management and reporting by
beneficiaries. The use of technologies and e-tools for declaring costs and keeping records
electronically together with increased use of standardised costs in ESF delivery may improve
transparency, access and, in the case of several interventions, generated sustainable practices.
Greater standardisation of programme indicators
The obligation to provide the Commission with standardised Annex XXIII data on ESF
participants was a crucial improvement for monitoring data on participations in 2007-2013 as
compared with 2000-2006. However, important shortcomings remained (different
interpretations of common definitions, lack of common result indicators)71
, limiting the
possibilities of monitoring progress on outputs and results after the interventions, evaluating
their effectiveness and sustainability (long-term results/impact) and aggregating data at EU
level.
Improve use of longitudinal and micro-data
Where micro-data on participants are available, they improve opportunities for evaluation: the
evaluator can analyse the data and conduct surveys. It is even better to have both longitudinal
and micro-data on participants, as this makes it possible to carry out counterfactual analysis,
69 Especially: European Social Fund (ESF) 2007 – 2013 ex post evaluation: Supporting the integration of
disadvantaged groups into the labour market and society’ 70 •ESF Ex-Post evaluation Synthesis 2007-2013: EU Synthesis report 71 See Annex 6

42
providing information on the net effectiveness of interventions72
. However, only few Member
States made use of micro-data to carry out (counterfactual) evaluations during the 2007-2013
programming period, showing the need to increase the impact evaluation effort in the
forthcoming period.
Capture effects other than employment and qualifications
There is increasing evidence that active measures in the field of employment, SI and HC have
other effects (e.g. on health and criminality) and benefits (e.g. increased confidence), even if the
interventions do not result in a regular (not subsidised) job. However, usually such other
benefits are not taken into account. Particularly for disadvantaged groups with multiple
problems, an evaluation framework is required that is broader than the usual approach of
looking only at the effect of active measures on job-entry chances and savings on
unemployment benefits. The traditional approach probably underestimates the total benefits to
society resulting from the measures. There is a need for consistent approaches to assessing
trends in the achievement of such ‘soft’ results.
The impacts of ESF support in the fields of PP and SIC are difficult to measure (in terms of
improved public services). A solution could be to focus the evaluation on measuring the
empowerment (improving the knowledge, understanding and ownership to take action) of the
public services, stakeholders and professionals involved.
More robust impact evaluations
This ex post evaluation concluded that the quality, methodology and scope of evaluations varied
substantially between Member States and that these consisted mostly of process evaluations
rather than impact evaluations. Only a small number of Member States carried out CIEs, partly
due to the limited availability of micro-data in 2007-2013.
The Commission took the initiative of creating for the first time a database of all evaluations
carried out by Member States during the programming period (1 163 evaluations) and issued a
number of thematic reports based on this evidence. However, as these evaluations were mainly
process-related and included very few impact evaluations and even fewer CIEs, in 2013 it
started working with the Joint Research Centre to promote CIEs in Member States73
through the
creation of the Centre for Research on Impact Evaluation (CRIE) to undertake
awareness-raising, training and guidance on the carrying-out of such evaluations through CIE
‘community of practice’, a biannual conference (COMPIE) bringing together CIE evaluators
and ESF programme managers. It also subsidised a number of pilot projects in Member States
(see section 5.8), which established that the level of CIE expertise varied across countries and
that capacity-building is critical for the success of CIE. The report on the projects74
stressed that
evaluation needs should be built into the design of interventions, so as to ensure the availability
of the data necessary for any subsequent evaluations.
72 Synthesis report on pilot projects to carry out ESF related counterfactual impact evaluations, Leandro Elia,
Giulia Santangelo, Sylke V. Schnepf, JRC-DDG1 (2015); 73 https://crie.jrc.ec.europa.eu/ 74 Synthesis report on pilot projects to carry out ESF related counterfactual impact evaluations, Leandro Elia,
Giulia Santangelo, Sylke V. Schnepf, JRC-DDG1 (2015);
http://ec.europa.eu/esf/main.jsp?catId=67&langId=en&newsId=2571.

43
Though the evidence presented in this evaluation points to positive results linked to the action
of the ESF in 2007-2013, the absence of robust impact evaluations makes difficult to establish
causality as results may not be solely attributed to the ESF. The capacity to quantify the ESF
effects at micro and macro levels should be further improved.
Reintroduce final evaluations
As in previous programming periods, ESF interventions continued to operate at the time of this
ex post evaluation and, as a result, it is not possible to provide final, cumulative data for
expenditure, outputs, results and impacts. Hence, the timing of ex post evaluations needs to be
reviewed either to ensure that they take place after the full closure of the OPs or earlier to
provide lessons learned to inform the subsequent programme period.
6.3. Changes in the 2014-2020 regulatory framework relevant to lessons learned and
points for further attention
These lessons are consistent with previous evidence, in particular the evaluations by the Expert
Evaluation Network75
and the ESF evaluation partnership. As such they have already been
taken into account, to a significant extent, in the regulatory framework for the 2014-2020
programming period.
The alignment of the ESF with EU policy priorities has been sought by establishing
thematic objectives and investment priorities closely aligned to Europe 2020 objectives.
The new programmes are designed to be consistent with the European Semester
priorities, taking into account the national reform programmes, the most recent CSRs
(and where relevant the economic adjustment programmes) and the use of thematic
ex ante conditionalities. The Common Provisions Regulation for the 2014-2020
programming period provides for flexibility to adjust programmes in the light of
changing needs and new political priorities (such as new CSRs or for instance the need
to further increase the focus on how to prepare for the transition to a low carbon,
resource efficient economy76
). A review of the 2014-2020 framework would need to
evaluate whether sufficient alignment with the EU policy priorities has been achieved;
The requirement to focus on a limited number of investment priorities, including specific
objectives for which result indicators are defined in advance, should reduce the scope
for overlaps;
Coordination between the ESF and other structural and investment funds has been
improved by the introduction of partnership agreements and the possibility of
implementing the ESF through multi-fund OPs;
The specific objectives are more clearly linked to output and result indicators capturing
the anticipated change (intervention logic). Results targets and milestones in the OPs
are to be defined in relation to baseline values which must be based on evidence from
the ex ante evaluation of the OP. The Commission has provided methodological
guidance on target-setting;
75 Final Synthesis Report: Main ESF achievements, 2007-2013 – ESF Expert Evaluation Network 76Contribution to climate change, ECA special report
http://www.eca.europa.eu/Lists/ECADocuments/SR16_31/SR_CLIMATE_EN.pdf
44
The use of SCOs has been expanded by increasing legal certainty and mandatory uptake
of SCOs for projects up to EUR 50 000 (Article 14 of the ESF Regulation);
Reporting requirements for 2014-2020 will involve a gender breakdown of common
result indicators;
The Youth Employment Initiative has been integrated into the ESF programmes to
address the problem of youth unemployment and ensure the visibility of the results;
The requirement to invest at least 20 % of overall ESF funding in SI should ensure
better coverage of disadvantaged groups and underpin the implementation of ‘social’
CSRs;
The ESF Regulation provides for a set of common output and result indicators
(including those establishing a common approach for monitoring/reporting on the
sustainability of results through systematic measurement of longer term results for
participants) and the Commission has issued detailed definitions, provided guidance
and support for data collection. The Member States and the Commission will use this
framework to report progress, notably on support for disadvantaged, young and older
people;
MAs are required to store data on inputs, outputs and results (and set targets where
relevant) also at operation level;
The introduction of evaluation plans by Managing Authorities in the new programming
period77
is a further important step forward, ensuring that sufficient evaluations are
performed covering all priority themes over the whole programming period;
Evaluations should assess impacts and (at least once in the programming period) how
ESF support has contributed to the objectives of each priority 78. The requirement to
collect individual data for each ESF participant (micro-data) will facilitate the conduct
of CIEs, although proportionality of new administrative requirements needs to be
assessed;
In their AIRs for 2019 and final implementation reports, Member States should assess
progress towards achieving the objectives of the programme and its contribution to
implementing the Union strategy for smart, sustainable and inclusive growth;79
As their final evaluations would by definition arrive too late, Member States are
required to present by December 2022 (two years before the completion date of the ex
post evaluation of the 2014-2020 programming period) a report summarising the
findings of all evaluations (Article 114(2)), which the Commission will use to support its
own ex post evaluation, due by end of 2024. 80
Other lessons require attention during the 2014-2020 implementation period and post-2020:
‘Soft’ results were not considered in the common monitoring framework for 2014-2020,
but the Commission should encourage Member States to use them, in particular for the
purpose of impact evaluations;
77 Article 56(1) Common Provisions Regulation (EU) No 1303/2013 78 Article 56(3) Common Provisions Regulation (EU) No 1303/2013 79 Article 50(5) Common Provisions Regulation (EU) No 1303/2013 80 Article 57 Common Provisions Regulation (EU) No 1303/2013
45
The Commission supports Member States’ evaluation capacity on an ongoing basis
through its regular meetings with evaluations partners and the ‘community of practice’ by
CRIE as well as evaluation helpdesk. In these forums, the Commission fosters the
combined use of micro-data and administrative registers to carry out longitudinal
studies. It will also seek to address issues such as capturing the effects other than
employment and qualifications fostering the use of macro-economic models to estimate
impacts;
The Commission will also explore possibilities to better capture the results of capacity
building activities, for example by fostering the measurement of empowerment;
The Commission will continue its efforts to persuade Member States to increase the
uptake of simplification procedures and reduce administrative burden for beneficiaries,
MAs and implementing bodies, such as the recently proposed Delegated Act on SCOs
and the simplification of reporting on households in the framework of the ‘Omnibus
Regulation’81
;
FEI implementation was disappointing and hampered by a slow disbursement of funds
and by reporting arrangement deficiencies. Some issues were addressed in 2007-2013
(e.g. through more detailed reporting arrangements) and 2014-2020 periods, but there
is a continued need for support and promotion in the use of FEIs for future
programming periods;
Although progressive simplification measures were introduced in 2007-2013, the
overall level of uptake remained low. The mandatory use of SCOs for small projects in
2014-2020 should be seen as a step in the right direction. Further ways in which the
authorities can improve legal certainty should be sought, so as to address the concerns
on the part of MAs that prevent the widespread adoption of SCOs;
Although the strengthened audit framework resulted in a reduction of reported error
rates as compared with previous programming periods, audit remained one of the areas
identified in the open public consultation and the DG REGIO evaluation on delivery
systems as excessively burdensome. Means of streamlining the application of the
single-audit principle should be considered in forthcoming programming periods; and
The Commission will consider the recommendations of the high-level group of
independent experts on monitoring simplification for beneficiaries of the European
structural and investment funds.
This evaluation will feed into discussions on post-2020 and any impact assessment for future
programming periods.
7. DISSEMINATION OF RESULTS
All interim and final deliverables have been published on DG EMPL’s website
(http://ec.europa.eu/social/main.jsp?catId=701&langId=en&moreDocuments=yes) and the
CIRCA website (https://circabc.europa.eu/).
81 Mid-term review/revision of the multiannual financial framework 2014-2020

46
The draft reports of the thematic and synthesis evaluations were presented to the ESF Technical
Working Group in 2015 and 2016. The results were also presented at the 7th European
Conference on Evaluation of Cohesion Policy on 9-10 June 2016, allowing discussion with a
broader range of stakeholders on the findings and lessons of the ex post evaluations82
. Further
dissemination activities are foreseen, notably during the discharge procedure, the March
conference in Malta, and the events linked to the celebration of the 60th year of the ESF.
The evaluation will be uploaded to the EU institutions’ studies database.
-------------------------------------------
Annex 1: Headline figures for ESF in CONV regions: participation and results
Annex 2: Headline figures for ESF in RCE regions: participation and results
Annex 3: Procedural information
Annex 4: Synopsis of stakeholder consultations
Annex 5: Methods
Annex 6: Data limitations
82 7th European Evaluation Conference ‘The result orientation: Cohesion Policy at work’ organised by the
Directorates-General for Regional and Urban Policy and Employment, Social Affairs and Inclusion of the
European Commission. Cf.:
http://ec.europa.eu/regional_policy/en/policy/evaluations/conferences/evaluating-effects/

47
Annex 1 Headline figures for ESF in CONV regions: participation and results
ESF in Convergence
Regions HC A2E SI SIC PP Total
Participations (in million
persons) 43.3 12.9 4 1.4 0.1 61.8
Employed 15.5 2.3 1 1.3 0.1 20.3
Of which self-employed 1 0.2 0.1 0 0 1.4
Unemployed 3.8 9.1 1.4 0 0 14.4
Of which LTU 1 2.5 0.7 0 0 4.2
Inactive 23.9 1.5 1.6 0 0 27.1
Women 23.3 7.1 2.3 0.9 0.1 33.8
Youth (16-24) 14 3.2 0.9 0.1 0 18.1
Older (55-64) 1.9 1.4 0.3 0.1 0 3.8
Disadvantaged 4.9 3209 1916 79 18
3.2 1.9 0.1 0 10.1
low skilled (ISCED 1-2) 18 4.8 1.4 0 0 24.2
Aggregated Results
Participants gaining an
employment including self-
employed (millions)
1 2.1 0.4 0 0 3.5
Participants gaining a
qualification (millions) 4.4 0.9 0.3 0.5 0 6.1
Participants gaining other positive
results (millions) 8 0.6 0.6 0.1 0 9.3
Total results for participants 13.4 3.6 1.3 0.6 0 18.9
Entities supported (thousands) 135.7 12.4 0.5 2.1 0 150.7
Products (thousands) 12.6 54.5 0 1.6 0 68.7
Success Rates for participants
(37 % of allocation, 41 % of all
participations)
46 % 39 % 39 %
44 %
Gaining an employment 7 % 58 % 31 %
Gaining a qualification 33 % 25 % 23 %
Other positive results 60 % 17 % 46 %

48
Annex 2 Headline figures for ESF in RCE regions: participation and results
HC A2E SI SIC PP Total
Participations (in million
persons) 17.1 15.9 3.8 0.1 0 36.9
Employed 10.1 2.3 0.3 0.1 0 12.7
Of which self-employed 0.8 0.2 0 0 0 1
Unemployed 2.6 10.8 2.3 0 0 15.7
Of which LTU 0.6 2.9 1.2 0 0 4.7
Inactive 4.4 2.9 1.2 0 0 8.5
Women 8 7.6 1.8 0 0 17.4
Youth (16-24) 5.4 5.2 1.3 0 0 11.9
Older (55-64) 1.2 1 0.2 0 0 2.4
Disadvantaged 2.7 6.1 2.3 0 0 11.1
low skilled (ISCED 1-2) 6 6.4 2.2 0 0 14.6
Aggregated Results
Participants gaining an
employment including self-
employed (millions)
0.8 4.6 0.5 0 0 5.9
Participants gaining a
qualification (millions) 2.0 0.3 0.3 0 0 2.6
Participants gaining other positive
results (millions) 2.2 0.8 1.3 0 0 4.4
Total results for participants 5.1 5.7 2.1 0 0 12.9
Entities supported (thousands) 117.9 7 0.4 0 0 125.3
Products (thousands) 40.4 0.1 0 0 0 40.5
Success Rates for participants
(32 % of allocation, 29 % of all
participations)
48 % 37 % 66 %
44 %
Gaining an employment 16 % 81 % 24 %
Gaining a qualification 41 % 5 % 14 %
Other positive results 43 % 14 % 62 %
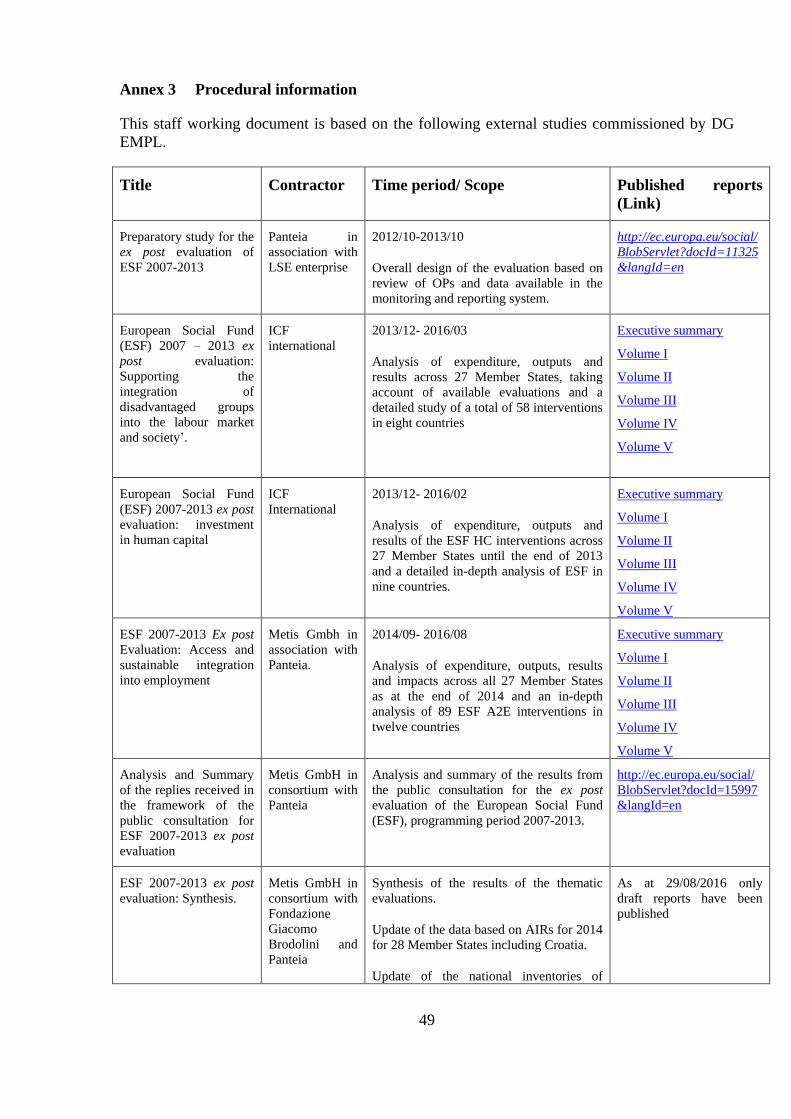
49
Annex 3 Procedural information
This staff working document is based on the following external studies commissioned by DG
EMPL.
Title Contractor Time period/ Scope Published reports
(Link)
Preparatory study for the
ex post evaluation of
ESF 2007-2013
Panteia in
association with
LSE enterprise
2012/10-2013/10
Overall design of the evaluation based on
review of OPs and data available in the
monitoring and reporting system.
http://ec.europa.eu/social/
BlobServlet?docId=11325
&langId=en
European Social Fund
(ESF) 2007 – 2013 ex
post evaluation:
Supporting the
integration of
disadvantaged groups
into the labour market
and society’.
ICF
international
2013/12- 2016/03
Analysis of expenditure, outputs and
results across 27 Member States, taking
account of available evaluations and a
detailed study of a total of 58 interventions
in eight countries
Executive summary
Volume I
Volume II
Volume III
Volume IV
Volume V
European Social Fund
(ESF) 2007-2013 ex post
evaluation: investment
in human capital
ICF
International
2013/12- 2016/02
Analysis of expenditure, outputs and
results of the ESF HC interventions across
27 Member States until the end of 2013
and a detailed in-depth analysis of ESF in
nine countries.
Executive summary
Volume I
Volume II
Volume III
Volume IV
Volume V
ESF 2007-2013 Ex post
Evaluation: Access and
sustainable integration
into employment
Metis Gmbh in
association with
Panteia.
2014/09- 2016/08
Analysis of expenditure, outputs, results
and impacts across all 27 Member States
as at the end of 2014 and an in-depth
analysis of 89 ESF A2E interventions in
twelve countries
Executive summary
Volume I
Volume II
Volume III
Volume IV
Volume V
Analysis and Summary
of the replies received in
the framework of the
public consultation for
ESF 2007-2013 ex post
evaluation
Metis GmbH in
consortium with
Panteia
Analysis and summary of the results from
the public consultation for the ex post
evaluation of the European Social Fund
(ESF), programming period 2007-2013.
http://ec.europa.eu/social/
BlobServlet?docId=15997
&langId=en
ESF 2007-2013 ex post
evaluation: Synthesis.
Metis GmbH in
consortium with
Fondazione
Giacomo
Brodolini and
Panteia
Synthesis of the results of the thematic
evaluations.
Update of the data based on AIRs for 2014
for 28 Member States including Croatia.
Update of the national inventories of
As at 29/08/2016 only
draft reports have been
published

50
evaluations.
28 National synthesis reports (including
Croatia)
Thematic reports on SIC and PP.
Each evaluation was supported by separate steering groups, that met regularly to discuss
planning, various deliverables as well as to problem solve issues emerging during the
evaluation process.
While steering groups of thematic evaluations consisted primarily of staff of the Directorate
General (DG) for employment, Social affairs and Inclusion (DG EMPL), the steering group of
Synthesis evaluation included also number of active contributing staff of other DGs as well as
the Secretariat General of the Commission. The Steering group met 4 times. In their work
Commission services were supported by a qualified external expert: Professor Alan McGregor
(University of Glasgow). Prof McGregor participated in the meetings of the steering groups,
commented on the various reports produced as well as prepared periodic reports analysing
stages of the ex post evaluation delivery.
As foreseen by the Better Regulation Guidelines83
the regulatory scrutiny board (RBS) checked
the quality of this major programme evaluation. The meeting was held on 28 September 2016.
The recommendations for improvements and responses are summarised below.
RSB comment (28/9/2016) DG EMPL response
(1) Objectives. The evaluation report should set out
more specific objectives (quantified, if possible)
for the period under consideration so that their
achievement can be assessed in subsequent
chapters. It should explain how these objectives
can be measured in the context of shared
management of the ESF. For instance, it should
explain the practical translation of the objectives
concerning convergence, regional competitiveness
and employment. The report should better explain
the link between the ESF and the Employment
Guidelines, present the (quantified) targets of the
employment guidelines and describe the expected
contribution of the ESF to these targets. The report
should also explain whether, for the period under
consideration, there were targets in terms of
regional cohesion to which the ESF is supposed to
contribute.
The SWD was amended to present more clearly the general
and operational objectives and the overall intervention logic
as well as alignment with Employment strategy.
It should be noted that no overall quantified targets were
set at regional, national nor at EU level at the level of
overall objectives beforehand for this period.
The contribution of ESF interventions alone towards
(EU2020) targets is impossible to disentangle due to the
multifaceted nature of the contributing factors. Even where
ESF was used extensively for a given priority, it would be
improper to attribute any increase in the achievements to
ESF solely.
Quantified targets were set for specific expected results
within the OPs. The SWD was strengthened outline
principles of shared management and that targets were set at
PAx and not at EU level.
Differences between convergence and competitiveness
objectives have been highlighted in the SWD on a more
systematic basis.
It should clarify whether gender sensitivity and
economic impact are part of the objectives, as they
are considered as separate criteria.
SWD chapter 3 is amended to clarify that evaluation
packages were launched before the BR guidelines were
adopted. They deal separately with gender sensitivity and
socio economic impacts as those are evaluation criteria
83 Better Regulation Guidelines COM (2015) 215
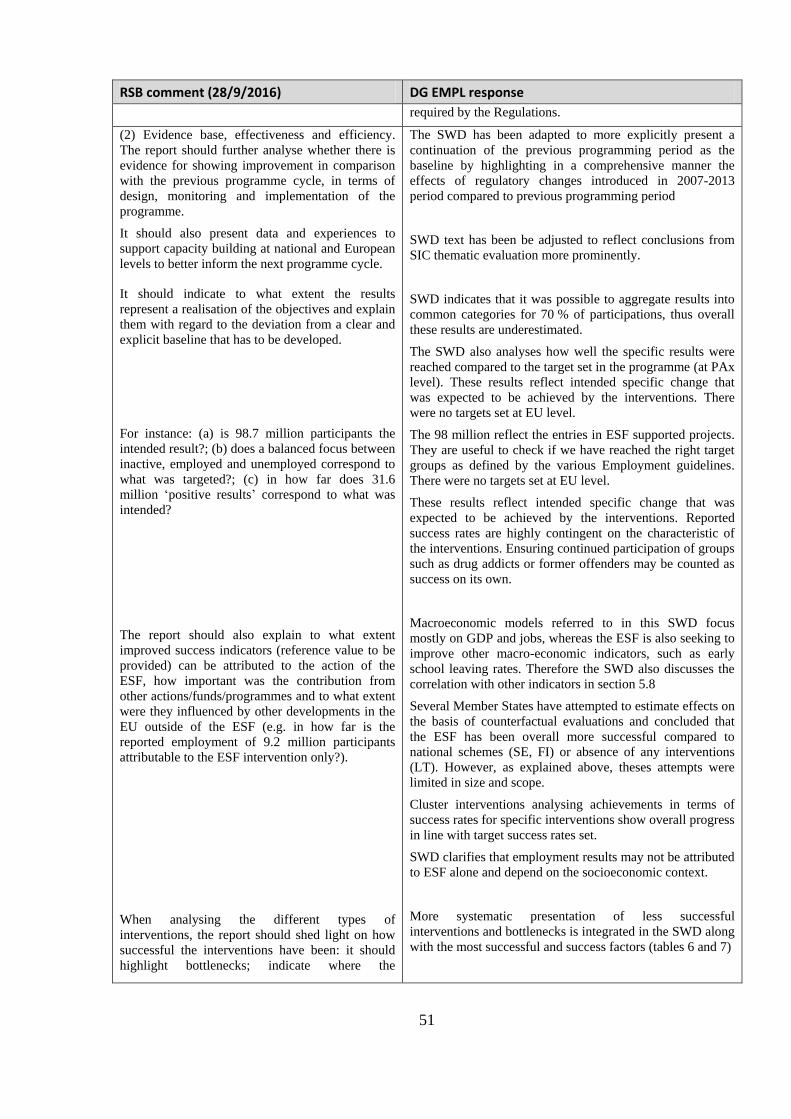
51
RSB comment (28/9/2016) DG EMPL response
required by the Regulations.
(2) Evidence base, effectiveness and efficiency.
The report should further analyse whether there is
evidence for showing improvement in comparison
with the previous programme cycle, in terms of
design, monitoring and implementation of the
programme.
It should also present data and experiences to
support capacity building at national and European
levels to better inform the next programme cycle.
It should indicate to what extent the results
represent a realisation of the objectives and explain
them with regard to the deviation from a clear and
explicit baseline that has to be developed.
For instance: (a) is 98.7 million participants the
intended result?; (b) does a balanced focus between
inactive, employed and unemployed correspond to
what was targeted?; (c) in how far does 31.6
million ‘positive results’ correspond to what was
intended?
The report should also explain to what extent
improved success indicators (reference value to be
provided) can be attributed to the action of the
ESF, how important was the contribution from
other actions/funds/programmes and to what extent
were they influenced by other developments in the
EU outside of the ESF (e.g. in how far is the
reported employment of 9.2 million participants
attributable to the ESF intervention only?).
When analysing the different types of
interventions, the report should shed light on how
successful the interventions have been: it should
highlight bottlenecks; indicate where the
The SWD has been adapted to more explicitly present a
continuation of the previous programming period as the
baseline by highlighting in a comprehensive manner the
effects of regulatory changes introduced in 2007-2013
period compared to previous programming period
SWD text has been be adjusted to reflect conclusions from
SIC thematic evaluation more prominently.
SWD indicates that it was possible to aggregate results into
common categories for 70 % of participations, thus overall
these results are underestimated.
The SWD also analyses how well the specific results were
reached compared to the target set in the programme (at PAx
level). These results reflect intended specific change that
was expected to be achieved by the interventions. There
were no targets set at EU level.
The 98 million reflect the entries in ESF supported projects.
They are useful to check if we have reached the right target
groups as defined by the various Employment guidelines.
There were no targets set at EU level.
These results reflect intended specific change that was
expected to be achieved by the interventions. Reported
success rates are highly contingent on the characteristic of
the interventions. Ensuring continued participation of groups
such as drug addicts or former offenders may be counted as
success on its own.
Macroeconomic models referred to in this SWD focus
mostly on GDP and jobs, whereas the ESF is also seeking to
improve other macro-economic indicators, such as early
school leaving rates. Therefore the SWD also discusses the
correlation with other indicators in section 5.8
Several Member States have attempted to estimate effects on
the basis of counterfactual evaluations and concluded that
the ESF has been overall more successful compared to
national schemes (SE, FI) or absence of any interventions
(LT). However, as explained above, theses attempts were
limited in size and scope.
Cluster interventions analysing achievements in terms of
success rates for specific interventions show overall progress
in line with target success rates set.
SWD clarifies that employment results may not be attributed
to ESF alone and depend on the socioeconomic context.
More systematic presentation of less successful
interventions and bottlenecks is integrated in the SWD along
with the most successful and success factors (tables 6 and 7)
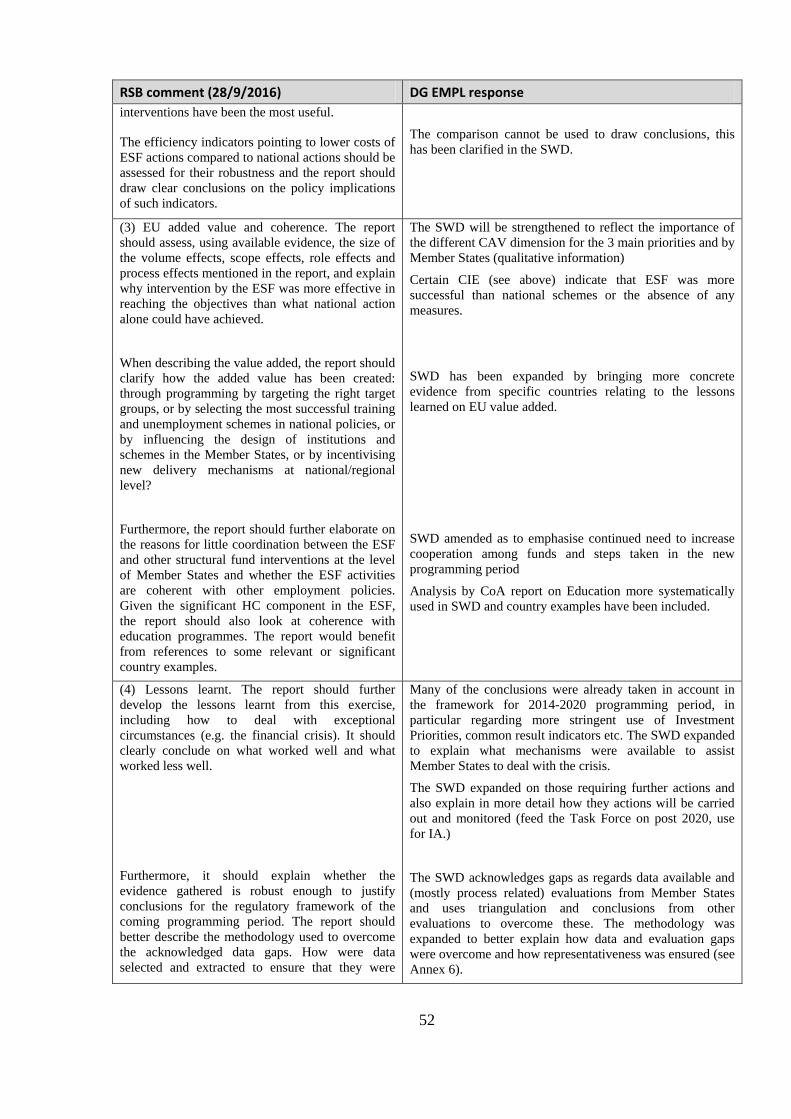
52
RSB comment (28/9/2016) DG EMPL response
interventions have been the most useful.
The efficiency indicators pointing to lower costs of
ESF actions compared to national actions should be
assessed for their robustness and the report should
draw clear conclusions on the policy implications
of such indicators.
The comparison cannot be used to draw conclusions, this
has been clarified in the SWD.
(3) EU added value and coherence. The report
should assess, using available evidence, the size of
the volume effects, scope effects, role effects and
process effects mentioned in the report, and explain
why intervention by the ESF was more effective in
reaching the objectives than what national action
alone could have achieved.
When describing the value added, the report should
clarify how the added value has been created:
through programming by targeting the right target
groups, or by selecting the most successful training
and unemployment schemes in national policies, or
by influencing the design of institutions and
schemes in the Member States, or by incentivising
new delivery mechanisms at national/regional
level?
Furthermore, the report should further elaborate on
the reasons for little coordination between the ESF
and other structural fund interventions at the level
of Member States and whether the ESF activities
are coherent with other employment policies.
Given the significant HC component in the ESF,
the report should also look at coherence with
education programmes. The report would benefit
from references to some relevant or significant
country examples.
The SWD will be strengthened to reflect the importance of
the different CAV dimension for the 3 main priorities and by
Member States (qualitative information)
Certain CIE (see above) indicate that ESF was more
successful than national schemes or the absence of any
measures.
SWD has been expanded by bringing more concrete
evidence from specific countries relating to the lessons
learned on EU value added.
SWD amended as to emphasise continued need to increase
cooperation among funds and steps taken in the new
programming period
Analysis by CoA report on Education more systematically
used in SWD and country examples have been included.
(4) Lessons learnt. The report should further
develop the lessons learnt from this exercise,
including how to deal with exceptional
circumstances (e.g. the financial crisis). It should
clearly conclude on what worked well and what
worked less well.
Furthermore, it should explain whether the
evidence gathered is robust enough to justify
conclusions for the regulatory framework of the
coming programming period. The report should
better describe the methodology used to overcome
the acknowledged data gaps. How were data
selected and extracted to ensure that they were
Many of the conclusions were already taken in account in
the framework for 2014-2020 programming period, in
particular regarding more stringent use of Investment
Priorities, common result indicators etc. The SWD expanded
to explain what mechanisms were available to assist
Member States to deal with the crisis.
The SWD expanded on those requiring further actions and
also explain in more detail how they actions will be carried
out and monitored (feed the Task Force on post 2020, use
for IA.)
The SWD acknowledges gaps as regards data available and
(mostly process related) evaluations from Member States
and uses triangulation and conclusions from other
evaluations to overcome these. The methodology was
expanded to better explain how data and evaluation gaps
were overcome and how representativeness was ensured (see
Annex 6).
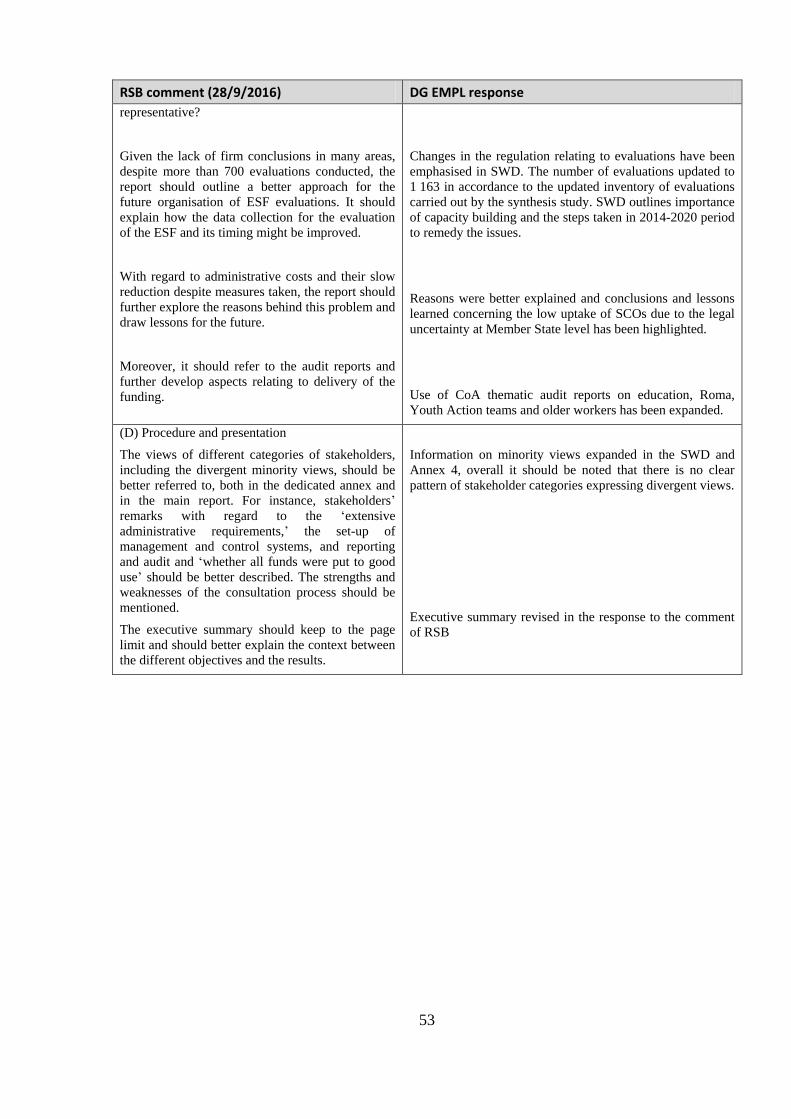
53
RSB comment (28/9/2016) DG EMPL response
representative?
Given the lack of firm conclusions in many areas,
despite more than 700 evaluations conducted, the
report should outline a better approach for the
future organisation of ESF evaluations. It should
explain how the data collection for the evaluation
of the ESF and its timing might be improved.
With regard to administrative costs and their slow
reduction despite measures taken, the report should
further explore the reasons behind this problem and
draw lessons for the future.
Moreover, it should refer to the audit reports and
further develop aspects relating to delivery of the
funding.
Changes in the regulation relating to evaluations have been
emphasised in SWD. The number of evaluations updated to
1 163 in accordance to the updated inventory of evaluations
carried out by the synthesis study. SWD outlines importance
of capacity building and the steps taken in 2014-2020 period
to remedy the issues.
Reasons were better explained and conclusions and lessons
learned concerning the low uptake of SCOs due to the legal
uncertainty at Member State level has been highlighted.
Use of CoA thematic audit reports on education, Roma,
Youth Action teams and older workers has been expanded.
(D) Procedure and presentation
The views of different categories of stakeholders,
including the divergent minority views, should be
better referred to, both in the dedicated annex and
in the main report. For instance, stakeholders’
remarks with regard to the ‘extensive
administrative requirements,’ the set-up of
management and control systems, and reporting
and audit and ‘whether all funds were put to good
use’ should be better described. The strengths and
weaknesses of the consultation process should be
mentioned.
The executive summary should keep to the page
limit and should better explain the context between
the different objectives and the results.
Information on minority views expanded in the SWD and
Annex 4, overall it should be noted that there is no clear
pattern of stakeholder categories expressing divergent views.
Executive summary revised in the response to the comment
of RSB

54
Annex 4 Stakeholder consultation ‘ESF 2007-2013 ex post Evaluation Synthesis’
Background
Evaluation has followed standards and methods set by the Better Regulation guidelines
regarding the transparency and involvement of stakeholders.
The evaluation roadmap has been prepared and after launch of the evaluation in accordance
with transition rules of the Better Regulation guidlines.84
On the published evaluation roadmap
itself, one feedback comment had been received.85
Roadmap outlined key stakeholder groups
and key consulting activities. In particular stakeholders in the ESF implementation during
2007-2013 period were grouped in 4 categories;
1. stakeholders involved in the management of OPs such as Member states MAs,
Implementing bodies at all levels, social and other partners represented in the
monitoring committees,
2. stakeholders involved in the delivery of ESF operations such as training
organisations, Public Employment services, NGOs, municipalities, chambers of
commerce and other individual citizens,
3. Participants in the ESF support measures such as: participating individuals, firms,
NGOs, public administrations.
4. General public: Individuals and organisations wishing to contribute to the ESF
evaluation by voicing their opinions as citizens.
The consultation steps outlined below during the ESF ex post evaluation of 2007-2013 have
followed the evaluation roadmap.
Specific target group consulted
All thematic studies relied on interviews with MAs and Implementing Bodies on the
programming and implementation of ESF activities, as well with project promoters of the 234
interventions subject to in-depth analysis (in order to obtain information on project
implementation, performance and possible good-practices).
In addition, the thematic evaluation dedicated to A2E included an e-survey with project
promoters in 12 countries selected for in depth review, generating around 1600 responses
(response rate 30 %).
84 Published on 03 February 2016 on the Better regulation website: http://ec.europa.eu/smart-
regulation/roadmaps/docs/2016_empl_013_esf_2007_2013_ex-post_evaluation_en.pdf . 85 This feedback related to joint farming ventures and CAP reforms and not to the ESF
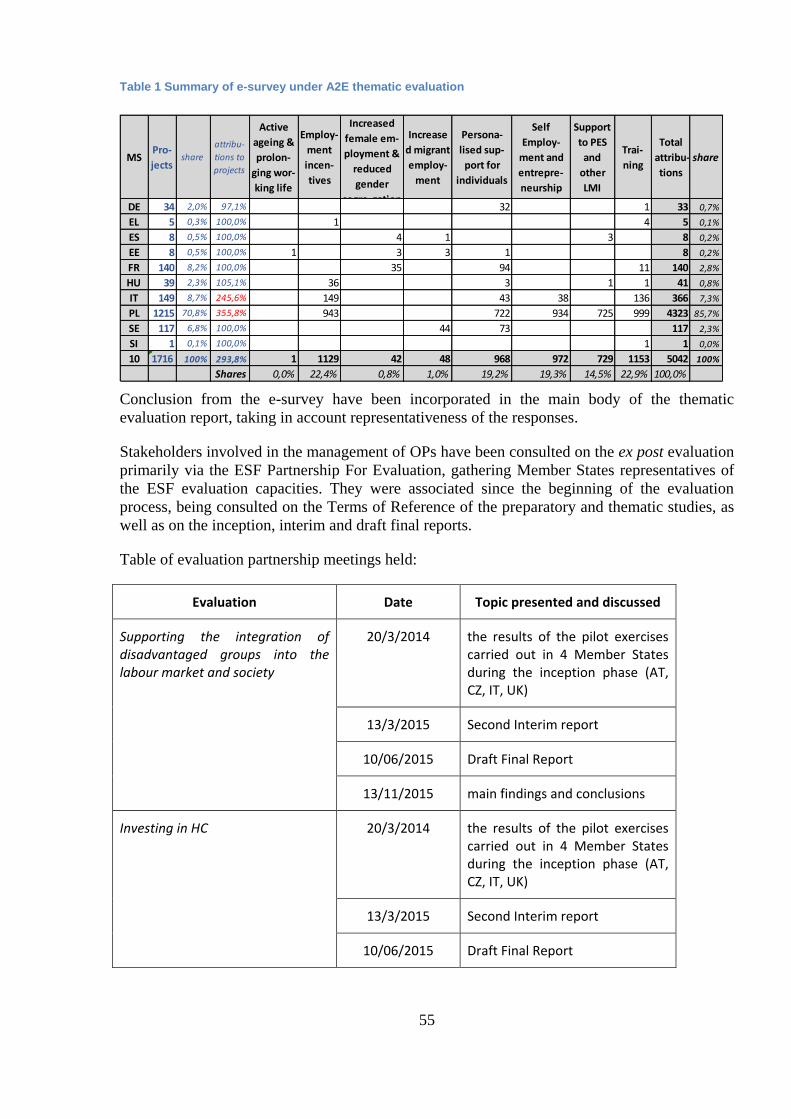
55
Table 1 Summary of e-survey under A2E thematic evaluation
MSPro-
jectsshare
attribu-
tions to
projects
Active
ageing &
prolon-
ging wor-
king life
Employ-
ment
incen-
tives
Increased
female em-
ployment &
reduced
gender
segre-gation
Increase
d migrant
employ-
ment
Persona-
lised sup-
port for
individuals
Self
Employ-
ment and
entrepre-
neurship
Support
to PES
and
other
LMI
Trai-
ning
Total
attribu-
tions
share
DE 34 2,0% 97,1% 32 1 33 0,7%
EL 5 0,3% 100,0% 1 4 5 0,1%
ES 8 0,5% 100,0% 4 1 3 8 0,2%
EE 8 0,5% 100,0% 1 3 3 1 8 0,2%
FR 140 8,2% 100,0% 35 94 11 140 2,8%
HU 39 2,3% 105,1% 36 3 1 1 41 0,8%
IT 149 8,7% 245,6% 149 43 38 136 366 7,3%
PL 1215 70,8% 355,8% 943 722 934 725 999 4323 85,7%
SE 117 6,8% 100,0% 44 73 117 2,3%
SI 1 0,1% 100,0% 1 1 0,0%
10 1716 100% 293,8% 1 1129 42 48 968 972 729 1153 5042 100%
Shares 0,0% 22,4% 0,8% 1,0% 19,2% 19,3% 14,5% 22,9% 100,0%
Conclusion from the e-survey have been incorporated in the main body of the thematic
evaluation report, taking in account representativeness of the responses.
Stakeholders involved in the management of OPs have been consulted on the ex post evaluation
primarily via the ESF Partnership For Evaluation, gathering Member States representatives of
the ESF evaluation capacities. They were associated since the beginning of the evaluation
process, being consulted on the Terms of Reference of the preparatory and thematic studies, as
well as on the inception, interim and draft final reports.
Table of evaluation partnership meetings held:
Evaluation Date Topic presented and discussed
Supporting the integration of disadvantaged groups into the labour market and society
20/3/2014 the results of the pilot exercises carried out in 4 Member States during the inception phase (AT, CZ, IT, UK)
13/3/2015 Second Interim report
10/06/2015 Draft Final Report
13/11/2015 main findings and conclusions
Investing in HC 20/3/2014 the results of the pilot exercises carried out in 4 Member States during the inception phase (AT, CZ, IT, UK)
13/3/2015 Second Interim report
10/06/2015 Draft Final Report
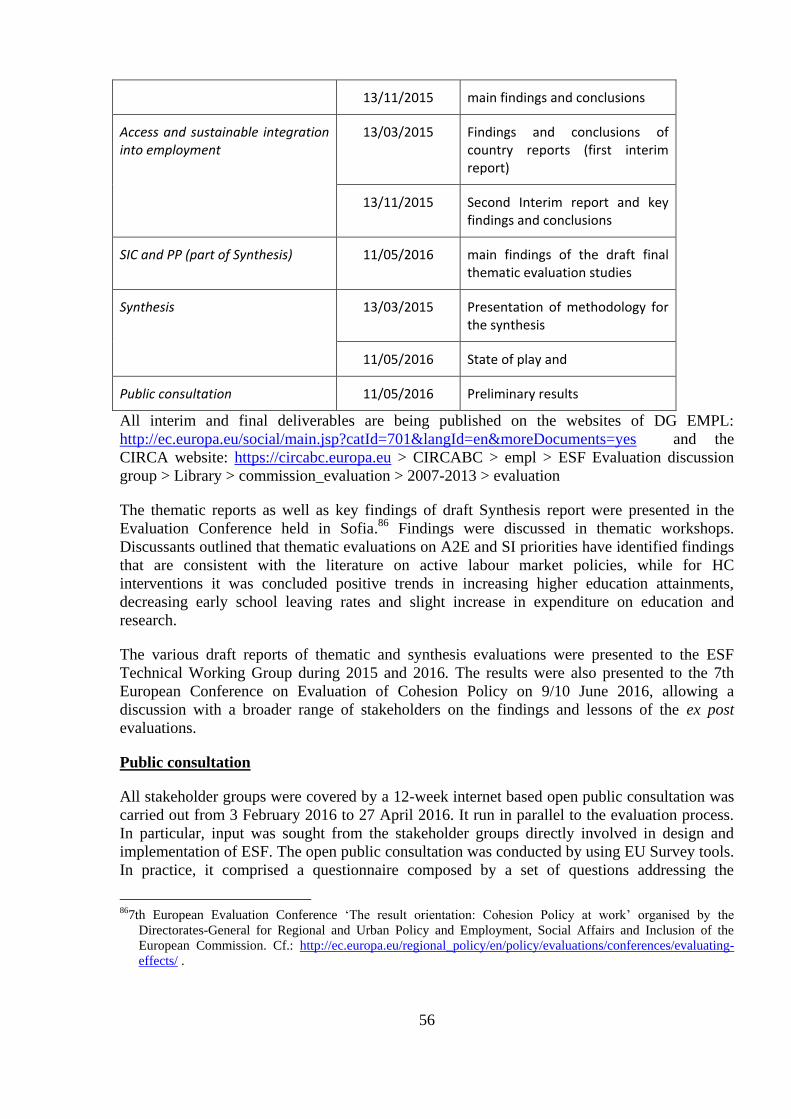
56
13/11/2015 main findings and conclusions
Access and sustainable integration into employment
13/03/2015 Findings and conclusions of country reports (first interim report)
13/11/2015 Second Interim report and key findings and conclusions
SIC and PP (part of Synthesis) 11/05/2016 main findings of the draft final thematic evaluation studies
Synthesis 13/03/2015 Presentation of methodology for the synthesis
11/05/2016 State of play and
Public consultation 11/05/2016 Preliminary results
All interim and final deliverables are being published on the websites of DG EMPL:
http://ec.europa.eu/social/main.jsp?catId=701&langId=en&moreDocuments=yes and the
CIRCA website: https://circabc.europa.eu > CIRCABC > empl > ESF Evaluation discussion
group > Library > commission_evaluation > 2007-2013 > evaluation
The thematic reports as well as key findings of draft Synthesis report were presented in the
Evaluation Conference held in Sofia.86
Findings were discussed in thematic workshops.
Discussants outlined that thematic evaluations on A2E and SI priorities have identified findings
that are consistent with the literature on active labour market policies, while for HC
interventions it was concluded positive trends in increasing higher education attainments,
decreasing early school leaving rates and slight increase in expenditure on education and
research.
The various draft reports of thematic and synthesis evaluations were presented to the ESF
Technical Working Group during 2015 and 2016. The results were also presented to the 7th
European Conference on Evaluation of Cohesion Policy on 9/10 June 2016, allowing a
discussion with a broader range of stakeholders on the findings and lessons of the ex post
evaluations.
Public consultation
All stakeholder groups were covered by a 12-week internet based open public consultation was
carried out from 3 February 2016 to 27 April 2016. It run in parallel to the evaluation process.
In particular, input was sought from the stakeholder groups directly involved in design and
implementation of ESF. The open public consultation was conducted by using EU Survey tools.
In practice, it comprised a questionnaire composed by a set of questions addressing the
867th European Evaluation Conference ‘The result orientation: Cohesion Policy at work’ organised by the
Directorates-General for Regional and Urban Policy and Employment, Social Affairs and Inclusion of the
European Commission. Cf.: http://ec.europa.eu/regional_policy/en/policy/evaluations/conferences/evaluating-
effects/ .

57
evaluation criteria set out in the Commission’s Better Regulation guidelines: relevance,
effectiveness, efficiency, coherence, and EU added value.
The public consultation consisted of at most, 20 questions, depending on the route followed
through the questionnaire and the number of follow-ups or sub-questions. Most of these were
closed questions. Four questions were open questions, in which respondents could elaborate on
the results achieved with the support of the ESF. The questionnaire was available in three
languages: English, French and German. Respondents could answer the open questions in their
own language.
EC undertook steps to promote consultation on the websites and social media managed by it:
Your voice in Europe website
Website of the DG EMPL
Website of ESF fund
Twitter (repeated messages at the launch and continued reminders by various accounts
including Commissioner of DG EMPL)
And Yammer (RegioNetwork)
Further, the consultation was advertised during the meetings of the Employment Committee
(EMCO), the Social Protection Committees (SPC), the ESF evaluation partnership, and the
Informal Network of ESF Information Officers (INIO). All were invited to disseminate
information on the consultation. In addition, MAs were contacted by the Geographical units of
the DG EMPL and encouraged to publicise this consultation on their Websites and Social
Media networks.
Responses
In total 285 respondents submitted a questionnaire. Out of these 285 submissions, 29 were not
analysed because the respondent indicated his or her answers could not be used for analysis and
publication, the respondent answered less than 75 % of the questions or respondents filled out
the questionnaire twice. Responses excluded from the analysis did not differ from other
responses and as such do not affect any conclusions drawn.
Therefore the response used for the analysis was 256.
The respondents answered questions for a total of 23 Member States and 3 responded for the
entire EU.
Respondents: country of residence and country/countries to which answers refer
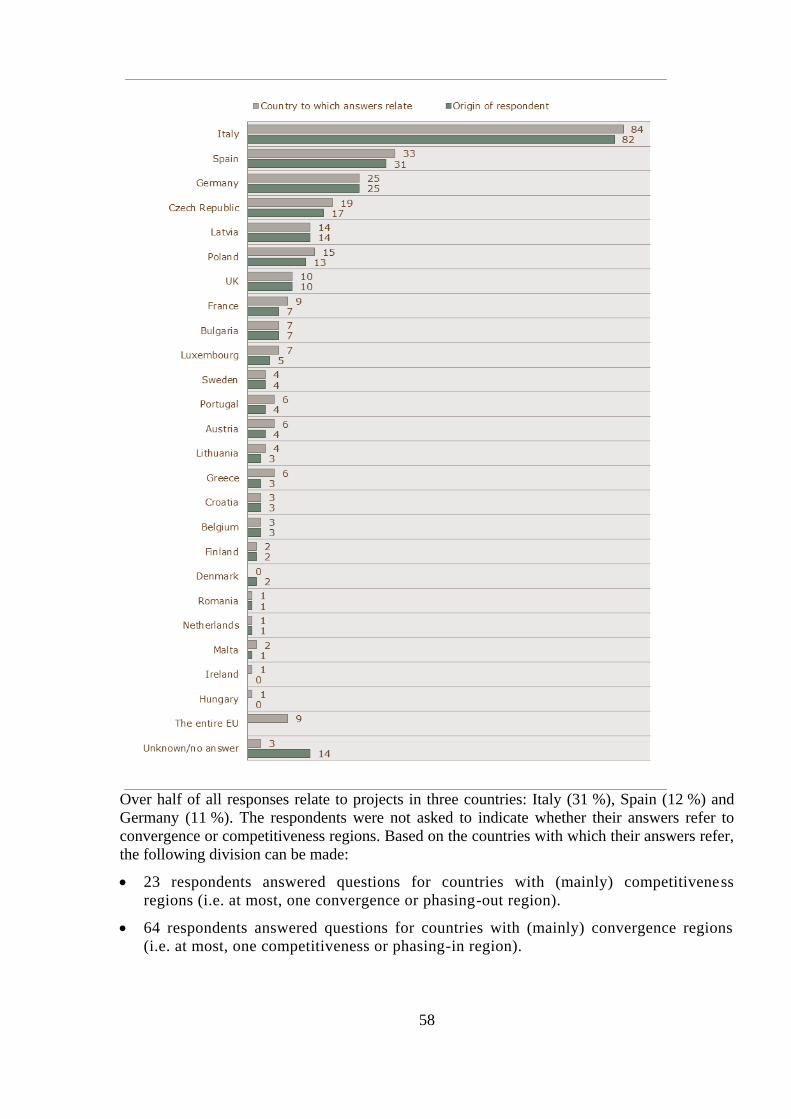
58
Over half of all responses relate to projects in three countries: Italy (31 %), Spain (12 %) and
Germany (11 %). The respondents were not asked to indicate whether their answers refer to
convergence or competitiveness regions. Based on the countries with which their answers refer,
the following division can be made:
23 respondents answered questions for countries with (mainly) competitiveness
regions (i.e. at most, one convergence or phasing-out region).
64 respondents answered questions for countries with (mainly) convergence regions
(i.e. at most, one competitiveness or phasing-in region).

59
166 respondents answered questions for countries with both competitiveness and
convergence regions. Among them are the respondents from the three countries with
most responses: Italy, Spain and Germany. These responses were combined in a group
labelled ‘multi-objective’.
Of the 256 respondents, 87 responded as individual citizens (34 %) and 168 on behalf of an
organisation (66 %).87
A large part of the respondents who answered as individual citizens
were, in fact, part of an organisation, but chose not to answer on behalf of their organisation.
Furthermore, 45 % of the respondents had received ESF-support, 36 % had
delivered/coordinated/managed ESF support or was a social partner, and 10 % were in both
categories (the roles of the remaining 9 % were unknown).
Respondent: individual citizens versus organisations
Respondent is Abs. %
An individual citizen 87 34 %
Acting on behalf of an organisation 168 66 %
State institution (such as Ministry, Agency, Regional /Local administration) 56 22 %
NGO 28 11 %
Other public organisation (such as research institute) 25 10 %
Commercial Organisation/ company 23 9 %
Trade union, Business association or federation thereof 23 9 %
Other organisations (not specified) 13 5 %
No answer 1
Total 256
87 One respondent did not indicate whether he/she was responding as an individual citizen or on behalf of an
organisation.

60
Respondents: Role in ESF 2007-2013 programming period (multiple answers possible)
In the public consultation, respondents were asked to respond to a set of statements which were
formulated in a positive way. Therefore, agreement with the statement meant positive feedback
for ESF. Most of the comments from survey were mostly positive on each question in the
survey.
The questions distinguished the following five policy areas:
Enhancing HC/expanding and improving HC investment. This includes increasing the
adaptability of workers, enterprises, and entrepreneurs with a view towards improving
the anticipation and positive management of economic change.
Enhancing A2E and the sustainable inclusion in the labour market of job seekers and
inactive people, preventing unemployment, in particular long-term and youth
unemployment, encouraging active ageing and longer working lives, and increasing
participation in the labour market.
Reinforcing the SI of disadvantaged people with a view towards their sustainable
integration in employment and combating all forms of discrimination in the labour
market.
SIC and the efficiency of public administrations and public services with a view
towards reforms, better regulation and good governance, in particular, in the
economic, employment, educational, social, environmental and judicial fields.
PP: Pacts and initiatives through networking of relevant stakeholders to mobilise for
reforms in the field of employment and labour market inclusiveness.
Relevance
Most aspects concerning the relevance of the ESF were favourably judged by the respondents
of the public consultation. More respondents agreed, rather than disagreed with the statement
that the ESF programmes were designed to address key issues in the five policy areas. This was
especially the case for:
HC: 37% strongly agreed, 41 % agreed, 11% have neutral position, 3% disagreed, 2 %
strongly disagreed and 6% provide no answer.

61
A2E: 35% strongly agreed, 44 % agreed, 8% have neutral position, 2% disagreed, 3 %
strongly disagreed and 8% provide no answer.
SI: 29% strongly agreed, 52 % agreed, 10% have neutral position, 2% disagreed, 2 %
strongly disagreed and 5% provide no answer.
Furthermore, the majority of the respondents agreed with the statement that the ESF helped to
mitigate the effects of the economic and financial crisis. A total of 67 % of the respondents
agreed with this statement, whereas 14 % disagreed.
In comparison to the total results, there were only minor differences when differentiating
between respondents who replied on behalf of an organisation versus those who replied as an
individual citizen.
Compared to the overall results for the question whether ESF programmes were designed to
address key issues in the five policy areas, there were mostly minor, insignificant differences
between the respondents who had received ESF support and those who had delivered, managed
or coordinated ESF support or had acted as a social partner. The only significant difference was
in the area of A2E. The respondents who had received ESF support were less inclined to agree
with the statement: 75 % of this group agreed, versus 87 % of the respondents involved in
delivering and managing ESF support. This difference is mostly due to the fact that the group
receiving ESF support answered ‘neutral’ more often (11 % versus 3 %) or did not answer the
question at all (10 % versus 4 %).
The percentages of respondents who disagreed with the statement that the ESF programmes
were designed to address key challenges in the area of A2E were comparable between the two
groups: 5 % of the respondents who had received ESF support disagreed versus 6 % of those
involved in delivering/coordinating/managing ESF support and social partners.
Statistically, there were no significant differences between the three groups of Member States88
.
When zooming in on the two homogenous groups of competitiveness versus convergence, there
was a noticeable difference in the area of SIC that was significant at the p≤0.10 threshold. Over
70 % of the respondents from competitiveness regions could not agree or disagree with the
statement that the ESF programmes were designed to address key challenges in the area of SIC.
43 % answered neutral and 26 % could not provide an answer at all. Of the remaining 29 %,
21 % agreed and 8 % disagreed. The opinions of the respondents from convergence regions
regarding the statement about SIC were as follows: 54 % agreed, 20 % was neutral and 11 %
disagreed.
Effectiveness
Overall, the effectiveness of the ESF was favourably judged by the respondents of the public
consultation. More respondents agreed, rather than disagreed, with the statement that the ESF
interventions contributed to strengthening economic and social cohesion in the five policy
areas. Respondents were particularly positive in the following areas:
HC: 20% strongly agreed, 52 % agreed, 18% have neutral position, 4% disagreed, 2 %
strongly disagreed and 6% provide no answer;
88 Convergence, competiveness and multi-objective

62
A2E: 12% strongly agreed, 56 % agreed, 18% have neutral position, 5% disagreed,
3 % strongly disagreed and 6% provide no answer;
SI: 16% strongly agreed, 53 % agreed, 18% have neutral position, 5% disagreed, 3 % strongly
disagreed and 4% provide no answer.Furthermore, more respondents agreed, rather than
disagreed, that ESF support was successful in achieving results for individuals and
organisations. The most successful results for individuals were:
Gaining a qualification: 77 % of the respondents agreed that this was the case.
Finding employment (including self-employment): 62 % of the respondents indicated
this.
Improving the skills and competences of teachers and educators: indicated by 55 % of
the respondents.
For organisations, the ESF was particularly successful in achieving results in developing new
qualifications, courses, training programmes, standards or systems by organisations. 74 %
agreed that this was the case.
Economic and social cohesion
Based on the answers to the statement on the contribution of ESF to economic and social
cohesion, effectiveness was most frequently reported in the policy areas of HC, A2E and SI:
HC: 20% strongly agreed, 52 % agreed, 18% have neutral position, 4% disagreed, 2 % strongly disagreed and
6% provide no answer;
A2E: 12% strongly agreed, 56 % agreed, 18% have neutral position, 5% disagreed, 3 % strongly disagreed
and 6% provide no answer;
SI: 16% strongly agreed, 53 % agreed, 18% have neutral position, 5% disagreed, 3 %
strongly disagreed and 4% provide no answer;
SIC: 6% strongly agreed, 29 % agreed, 37% have neutral position, 8% disagreed, 3 %
strongly disagreed and 18% provide no answer;
PP: 6% strongly agreed, 38 % agreed, 34% have neutral position, 7% disagreed, 2 % strongly
disagreed and 14% provide no answer. A fairly large number of respondents, answered
‘neutral’ to the statement that the ESF contributed to strengthening the economic and social
cohesion in the areas of SIC and PP. The ‘neutral’ category was selected by 37 % and 34 %.
With regard to HC, A2E and SI, organisations were significantly more positive about the
contribution of the ESF to the economic and social cohesion than the individual citizens. Of the
organisations, 73 % (for A2E and Social Cohesion) to 75 % (for HC) agreed with the statement
that the ESF contributed to strengthening economic and social cohesion, versus 58 % (for A2E)
to 63 % (for HC) of individual citizens. Not only were individual citizens less positive, they
disagreed more with the statement that the ESF contributed to strengthening economic and
social cohesion. Of the organisations 1 %, 4 % and 6 % disagreed that ESF contributed to
strengthening economic and social cohesion in the areas of HC, A2E and SI. Of the individual
citizens, however, 15 %, 16 % and 14 % disagreed.
Compared to the overall results, there were only minor differences between individuals and
organisations receiving support versus the respondents involved in delivering, managing and
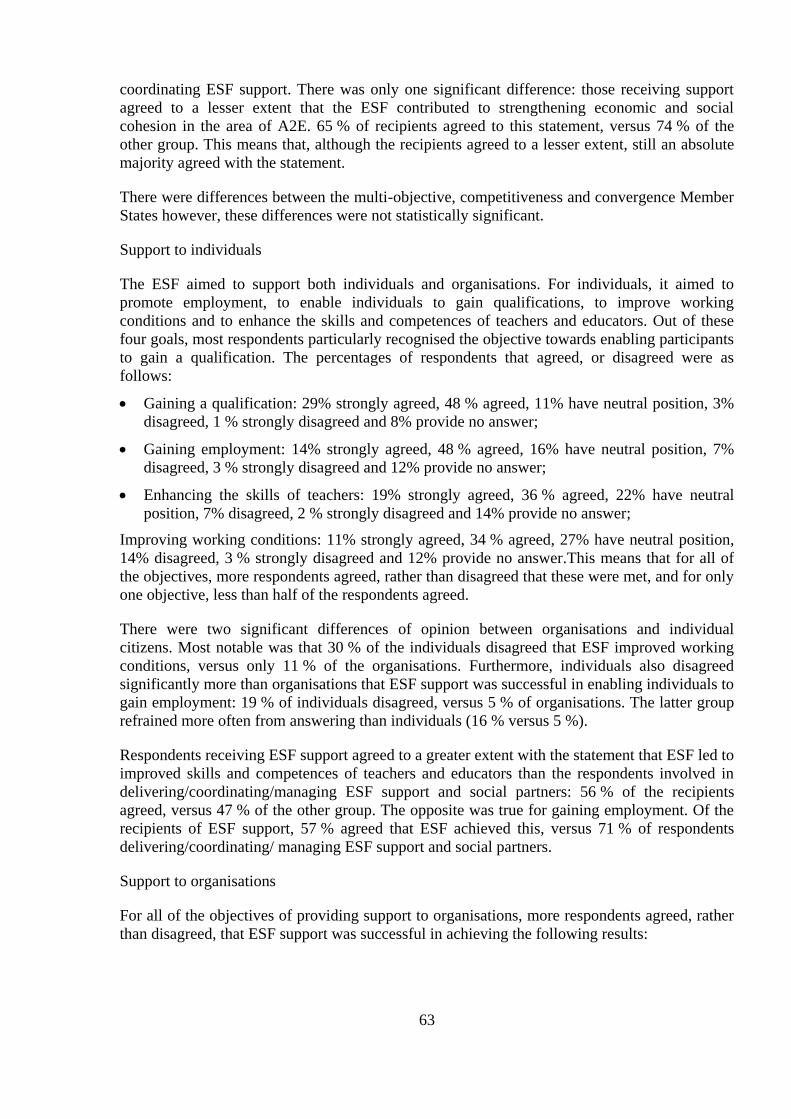
63
coordinating ESF support. There was only one significant difference: those receiving support
agreed to a lesser extent that the ESF contributed to strengthening economic and social
cohesion in the area of A2E. 65 % of recipients agreed to this statement, versus 74 % of the
other group. This means that, although the recipients agreed to a lesser extent, still an absolute
majority agreed with the statement.
There were differences between the multi-objective, competitiveness and convergence Member
States however, these differences were not statistically significant.
Support to individuals
The ESF aimed to support both individuals and organisations. For individuals, it aimed to
promote employment, to enable individuals to gain qualifications, to improve working
conditions and to enhance the skills and competences of teachers and educators. Out of these
four goals, most respondents particularly recognised the objective towards enabling participants
to gain a qualification. The percentages of respondents that agreed, or disagreed were as
follows:
Gaining a qualification: 29% strongly agreed, 48 % agreed, 11% have neutral position, 3%
disagreed, 1 % strongly disagreed and 8% provide no answer;
Gaining employment: 14% strongly agreed, 48 % agreed, 16% have neutral position, 7%
disagreed, 3 % strongly disagreed and 12% provide no answer;
Enhancing the skills of teachers: 19% strongly agreed, 36 % agreed, 22% have neutral
position, 7% disagreed, 2 % strongly disagreed and 14% provide no answer;
Improving working conditions: 11% strongly agreed, 34 % agreed, 27% have neutral position,
14% disagreed, 3 % strongly disagreed and 12% provide no answer.This means that for all of
the objectives, more respondents agreed, rather than disagreed that these were met, and for only
one objective, less than half of the respondents agreed.
There were two significant differences of opinion between organisations and individual
citizens. Most notable was that 30 % of the individuals disagreed that ESF improved working
conditions, versus only 11 % of the organisations. Furthermore, individuals also disagreed
significantly more than organisations that ESF support was successful in enabling individuals to
gain employment: 19 % of individuals disagreed, versus 5 % of organisations. The latter group
refrained more often from answering than individuals (16 % versus 5 %).
Respondents receiving ESF support agreed to a greater extent with the statement that ESF led to
improved skills and competences of teachers and educators than the respondents involved in
delivering/coordinating/managing ESF support and social partners: 56 % of the recipients
agreed, versus 47 % of the other group. The opposite was true for gaining employment. Of the
recipients of ESF support, 57 % agreed that ESF achieved this, versus 71 % of respondents
delivering/coordinating/ managing ESF support and social partners.
Support to organisations
For all of the objectives of providing support to organisations, more respondents agreed, rather
than disagreed, that ESF support was successful in achieving the following results:

64
Developing new qualifications, courses, training programmes, standards or systems: 23%
strongly agreed, 51% agreed, 13% have neutral position, 4% disagreed, 2% strongly
disagreed and 7% provide no answer.
Rising competitiveness and adaptability of enterprises: 11% strongly agreed, 39% agreed,
26% have neutral position, 7% disagreed, 3% strongly disagreed and 14% provide no
answer.
Supporting start-ups: 9% strongly agreed, 38% agreed, 25% have neutral position, 5%
disagreed, 3% strongly disagreed and 18% provide no answer.
Improving public administration, effectiveness and/or efficiency: 11% strongly agreed, 32%
agreed, 25% have neutral position, 13% disagreed, 5% strongly disagreed and 14% provide
no answer.
There were only minor differences between the perceptions of organisations and individual
citizens. The only statistically significant differences concerned the support of start-ups and the
rising competitiveness and adaptability of enterprises. Most notably of these was the rising
competitiveness: organisations were more likely to report this effect: 53 % agreed and 5 %
disagreed, whereas 45 % of individuals agreed and 20 % disagreed.
The only significant difference in opinion between recipients of ESF-support, and those
involved in delivering or coordinating support or social partners, was on the matter of
Improving public administration effectiveness and/or efficiency. Of the recipients of ESF
support 48 % agreed that this had happened, and 17 % disagreed. Among the respondents who
had delivered/managed/coordinated ESF support or had acted as a social partner, only 35 %
agreed and 21 % disagreed. This is interesting as the latter group often consists of organisations
involved in public administration. They perceived to a lesser extent that their effectiveness
and/or efficiency had improved, whereas the recipients of ESF support reported this
improvement more often with public administration.
There were a significant differences of opinion between the three types of Member States about
the success of the effort to support start-ups. Significantly more respondents from multi-
objective regions indicated that the support of start-ups had indeed been successful: 52 %
indicated this, versus 44 % of respondents in convergence regions and 22 % of respondents in
competitiveness regions. In all regions, the respondents who indicated that the support of start-
ups was successful outnumbered the respondents who disagreed with this. In multi-objective
regions 6 % disagreed, in competitiveness regions 13 %, and in convergence regions 12 %.
Efficiency
Most aspects of the efficiency of the ESF were judged favourably by the respondents. Firstly,
more respondents agreed, rather than disagreed, with the statement that the ESF was cost-
effective in all of the five policy areas.
Furthermore, the respondents judged most administrative requirements for managing the ESF
projects and programmes to be appropriate, rather than too light or excessive. The five most
appropriate administrative requirements were:
communication (as stated by 70 % of the respondents),
implementation of projects (63 %),

65
the designation of authorities (61 %),
the design of OPs (60 %),
the selection of projects (60 %).
The three administrative requirements that are deemed ‘excessive’ most often are:
audits (as stated by 38 % of the respondents),
set-up of management and control systems (37 %),
reporting (36 %).
However, the number of respondents judging these three requirements as ‘appropriate’ is
comparable in size to, or greater than, the number judging them as ‘excessive’.
Cost effectiveness
Regarding the cost-effectiveness, a majority of the respondents agreed that the ESF was cost–
effective in three of the five areas. In all areas more people agreed, rather than disagreed that
the ESF was cost-effective. The amounts of respondents that agreed or disagreed with the
statement that ESF as cost effective were as follows:
For HC 16% strongly agreed, 43% agreed, 21% have neutral position, 7% disagreed, 4%
strongly disagreed and 9% provide no answer;
For A2E 11% strongly agreed, 40% agreed, 28% have neutral position, 9% disagreed, 4%
strongly disagreed and 8% provide no answer;
For SI 13% strongly agreed, 46% agreed, 25% have neutral position, 5% disagreed, 4%
strongly disagreed and 6% provide no answer;
For SIC 5% strongly agreed, 28% agreed, 33% have neutral position, 10% disagreed, 5%
strongly disagreed and 18% provide no answer;
For PP, 4% strongly agreed, 35% agreed, 33% have neutral position, 8% disagreed, 2%
strongly disagreed and 18% provide no answer.
About a third of the respondents were neutral in their reply to the latter two statements and in
both cases 18 % did not know what to answer. Again, this is in line with previous observations
that more respondents were involved in the areas of HC, A2E and SI. Therefore, they have less
knowledge about the areas SIC and PP.
The responses of organisations and individual citizens differed significantly in three of the five
areas. In all cases, the respondents who replied on behalf of an organisation were significantly
more positive about the cost-effectiveness of ESF than the individual citizens:
HC: 64 % of organisations agreed (5 % disagreed), versus 51 % of individuals (21 %
disagreed).89
A2E: 57 % of organisations agreed (13 % disagreed), versus 38 % of individuals (25 %
disagreed).90
89 Significant at the p≤0.10 threshold.
66
SI: 59 % of organisations agreed (9 % disagreed), versus 47 % of individuals (16 %
disagreed).91
Although organisations were significantly more positive about the cost effectiveness in these
areas, more individuals agreed to the cost effectiveness, rather than disagreed that the ESF had
been cost effective.
Respondents who had received ESF support, either as an organisation or as an individual were
significantly more positive about the cost effectiveness in the area of HC. Of the recipients
64 % judged the ESF to be cost effective in the area of HC (11 % disagreed), versus 56 % of
those involved in delivering/managing/coordinating and social partners (9 % disagreed).
Administrative requirements
In order to participate in or manage the ESF programme, certain administrative requirements
need to be met. With the exception of the set-up of management and control systems and the
audits, 50 % or more of the respondents deemed these requirements ‘appropriate’. For these two
aspects, 37 % and 38 % of all respondents thought the administrative requirements were
excessive. The respondents are also at odds with each other about the requirement on reporting.
Both the number of respondents indicating this requirement as ‘excessive’ (36 %) and the
number of respondents indicating it is ‘appropriate’ (50 %) are quite large. This does mean,
however, that none of the requirements were judged ‘excessive’ rather than ‘appropriate’.
Only smaller minorities of the respondents judged the administrative requirements as ‘too
light’. Three of the requirements were viewed as ‘too light’ by 10 % of the respondents or
more: ‘evaluation’ (14 %), ‘communication’ (12 %), and ‘selection of projects’ (12 %).there
were little differences between respondents answering on behalf of organisations and individual
citizens. The only significant difference was with regard to the selection of projects.
Organisations judged these requirements to be ‘appropriate’ more often (68 % versus 45 % of
individuals). The individual citizens were less satisfied with the requirements in the selection of
projects. They either judged them to be ‘too light’ (21 % versus 7 % of organisations) or
‘excessive’ (23 % versus 17 % of organisations).
Both respondents receiving ESF supports and those involved in delivering, coordinating and
managing ESF support and social partners are very much in agreement about the administrative
requirements (and therefore with the overall results). The only requirement they significantly
differ about is the evaluation. The respondents who had a role in
delivering/managing/coordinating ESF support or were a social partner indicated that they
thought the evaluation was ‘too light’ more often than those receiving ESF support: 22 %
versus 12 % of respondents indicated this. In turn, slightly more recipients of ESF support
thought the evaluation was ‘appropriate’ (57 % versus 52 %).
There were a couple of significant differences between the Member States with convergence,
competitiveness or multi-objective regions. The requirements for communication were judged
significantly more favourably by respondents from multi-objective (75 % ‘appropriate’) and
competitiveness regions (78 % ‘appropriate’) than by respondents from convergence regions
90 Significant at the p≤0.05 threshold. 91 Significant at the p≤0.10 threshold.

67
(56 % ‘appropriate’). Also concerning the audit, the respondents from multi-objective countries
and competitiveness regions judged the requirements to be appropriate more often than
respondents from convergence regions (45 % and 43 % versus 38 %).
Although the administrative requirements of the ESF were already part of the questionnaire in a
closed question, six respondents wanted to elaborate further upon their opinion about these
requirements. One German respondent called them ‘immense and ever-changing’, while a
French respondent called them ‘too complicated’. According to two respondents from Spain
and the UK, the drawbacks of the administrative requirements are decreased efficiency and
effectiveness. A respondent who answered for projects in the entire EU claimed there is a
tendency not to use ESF support anymore, due to the bureaucracy and delay in payments. One
German respondent said that the administrative requirements during the 2007-2013
programming period were actually less than before, but also indicated that additional efforts
should be made.
Coherence
More respondents agreed, rather than disagreed, with the statement that the ESF programmes
were complementary with other EU funds in all of the five policy areas. However, it should be
noted that a relatively large number of respondents did not provide an answer to this question.
This was probably due to the fact that they had insufficient experience with other EU funds.
The percentage of respondents that did not provide an answer to the statements ranged from
22 % (for HC and A2E) to 32 % (for SIC. This is most likely due to the fact that not all
respondents had experience with other EU funds.
Of those who did answer, the majority of the respondents agreed with the statements that the
ESF was indeed complementary to other funds:
For the area of HC, 11% strongly agreed, 34% agreed, 21% have neutral position, 9%
disagreed, 4% strongly disagreed and 22% provide no answer;
For A2E 8% strongly agreed, 32% agreed, 25% have neutral position, 9% disagreed, 4%
strongly disagreed and 22% provide no answer;
For SI 9% strongly agreed, 30% agreed, 25% have neutral position, 9% disagreed, 4%
strongly disagreed and 23% provide no answer;
For SIC 7% strongly agreed, 20% agreed, 30% have neutral position, 7% disagreed, 4%
strongly disagreed and 32% provide no answer;
For PP 7% strongly agreed, 26% agreed, 28% have neutral position, 7% disagreed, 3%
strongly disagreed and 29% provide no answer.
Therefore, although for none of the policy areas a majority of the respondents agreed with the
statement that the ESF programmes were compatible to other EU funds, the responses were
predominantly positive, rather than negative. For every policy area, there was only a limited
number of respondents (ranging from 10 % to 13 %) who expressed the opinion that the ESF
was not compatible with other EU funds.
Individual citizens provided answers to the question whether the ESF was complementary to
other EU-funds more often than organisations. However, the only significant difference
68
(p≤0.10) was in the area of HC. In this area individual citizens both agreed and disagreed more
than organisations that the ESF had been complementary to other EU funds. Of the Individual
citizens, 49 % agreed, 21 % disagreed and 18 % was neutral. Of the organisations, 43 % agreed,
8 % disagreed and 13 % was neutral.
When asked whether the ESF was complementary to other EU-funds, there were few
differences of opinion between respondents who had received ESF support and the group of
delivering/coordinating/managing ESF and social partners. Therefore their answers are in line
with the overall results. The only significant difference was the fact that the recipients of ESF
support indicated more often that for the policy area of HC: 47 % of recipients agreed (11 %
disagreed) versus 35 % of organisations delivering/managing/coordinating and social partners
(17 % disagreed).
There were no significant differences between respondents from countries consisting of
competitiveness regions, countries consisting of conversion regions and multi-objective
countries.
EU added value
Target groups
Most aspects of the EU added value of the ESF were favourably judged by the respondents. In
the questionnaire, three aspects of the added value were addressed: support to target groups,
innovative activities and structural reforms.
More respondents agreed, rather than disagreed, with the statement that the ESF has provided
support to target groups whose needs would have otherwise been insufficiently addressed. The
most supported groups whose needs would otherwise have been insufficiently fulfilled were:
the unemployed (as stated by 68 % of the respondents),
young people (66 %),
women (58 %), and
long term unemployed (57 %)
The respondents indicated, to a lesser extent, that the following three groups had been
supported whose needs would have otherwise been insufficiently addressed:
older workers (19 % disagreed with the statement),
migrants (18 %), and
minorities such as Roma (16 %).
Such responses indicate potential gaps in relation to coverage of these groups.
In general, individuals tended to indicate to a lesser extent that ESF provided support to meet
the needs of the target groups that would have otherwise been insufficiently. Most noticeably:
they also disagreed more with this statement. Especially their opinion about the support to older
workers is noteworthy: equal amounts of individuals agreed and disagreed (28 %) that the older
workers were supported in their needs that would otherwise not have been addressed.

69
For ten target groups, the differences in opinion between individuals and organisations were
statistically significant. These were the following:
Organisations
(n=168)
Individual citizens
(n=87)
Agree Disagree Agree Disagree
Unemployed 74 % 6 % 59 % 18 %
Young people 69 % 7 % 64 % 16 %
Women 61 % 8 % 54 % 21 %
Long term unemployed 60 % 8 % 50 % 20 %
Disabled 53 % 6 % 51 % 11 %
NEETs 50 % 8 % 52 % 22 %
Inactive 50 % 8 % 42 % 17 %
Educational attainment below secondary level 46 % 10 % 44 % 16 %
Secondary or higher educational attainment 41 % 12 % 47 % 15 %
Older workers 43 % 15 % 28 % 28 %
When it comes to the question whether ESF supported certain target groups, whose needs
would have otherwise been insufficiently addressed, there are a number of differences of
opinion between respondents who have received ESF support and those who were involved in
delivering/managing/coordinating and social partners.
Receiving
(n=140)
delivering/managing/
coordinating
& social partners (n=87)
Agree Disagree Agree Disagree
Unemployed 65 % 9 % 74 % 11 %
NEETs 54 % 15 % 50 % 9 %
Inactive 43 % 13 % 57 % 11 %
Secondary or higher educational attainment 44 % 12 % 41 % 13 %
Migrants 37 % 16 % 42 % 20 %
Older workers 38 % 21 % 40 % 20 %
Minorities 29 % 14 % 27 % 18 %
There were a number of minor differences between the answers of respondents answering on
behalf of countries consisting of competitiveness regions, respondents answering on behalf of
countries consisting of convergence regions and multi-objective countries
Multi-objective
(n=166)
Competitiveness
(n=23)
Convergence
(n=87)
Agree Disagree Agree Disagree Agree Disagree
NEETs 57 11 60 4 29 17
Other disadvantaged92 58 10 75 8 52 7
Migrants 44 16 44 30 19 19
Innovation
More respondents agreed, rather than disagreed, that the ESF allowed the testing and
implementation of innovative activities in the five policy areas. The most support for this
statement was for the policy areas:
92 Significant at the p≤0.10 threshold,.

70
HC 17% strongly agreed, 43% agreed, 19% have neutral position, 7% disagreed, 2%
strongly disagreed and 13% provide no answer,
SI 19% strongly agreed, 40% agreed, 18% have neutral position, 8% disagreed, 3%
strongly disagreed and 11% provide no answer;
A2E (17% strongly agreed, 40% agreed, 19% have neutral position, 9% disagreed, 2%
strongly disagreed and 12% provide no answer.
There were mostly minor statistically insignificant differences between respondents replying on
behalf of their organisation and individual citizens. The only significant (at p≤0.10) difference
was in the area of HC: individuals disagreed significantly more than organisations that ESF
allowed to test and implement innovative activities in this policy area: 19 % of individuals
indicated that these innovations had not taken place, versus 6 % of organisations. On the other
hand, there was also a majority of the individuals (59 %) that indicated that, in their opinion, the
testing and implementation of innovative activities had taken place.
There was only one significant difference between all three groups of Member States.
Concerning A2E, respondents from competitiveness regions answered significantly more often
that the ESF allowed to test and implement innovative activities: 86 % of the respondents
indicated this, versus 61 % of respondents from convergence regions and 52 % of countries
with multiple objectives.
Furthermore, there was also a significant difference between conversion regions and
competitiveness regions to be noted. Respondents from competitiveness regions agreed
significantly more often than those representing conversion regions that innovation had taken
place in the area of SI: 78 % of respondents from competitiveness regions agreed to this, versus
49 % in convergence regions
Structural reforms
More respondents agreed, rather than disagreed, with regard to structural reforms that the ESF
was instrumental in providing support in the five policy areas and, in particular, for the policy
area SI (52 % of the respondents agreed to this).
The percentages differed between the five policy areas.
SI: 13% strongly agreed, 39% agreed, 28% have neutral position, 6% disagreed, 4%
strongly disagreed and 11% provide no answer;
HC: 11% strongly agreed, 38% agreed, 25% have neutral position, 7% disagreed, 4%
strongly disagreed and 15% provide no answer;
A2E: 9% strongly agreed, 39% agreed, 23% have neutral position, 8% disagreed, 5%
strongly disagreed and 16% provide no answer;
SIC: 7% strongly agreed, 25% agreed, 32% have neutral position, 8% disagreed, 3%
strongly disagreed and 25% provide no answer;
PP: 6% strongly agreed, 27% agreed, 36% have neutral position, 7% disagreed, 3% strongly
disagreed and 22% provide no answer.

71
Relatively more organisations than individual citizens agreed that ESF was instrumental in
supporting structural reforms. Additionally, the individuals disagreed more that ESF was
instrumental in supporting structural reforms. In four of the five policy areas the differences
were significant:
For HC, 49 % of organisations agreed and 6 % disagreed, versus 49 % of individuals that
agreed and 21 % that disagreed.
For A2E, 50 % of organisations agreed and 7 % disagreed, versus 43 % of individuals that
agreed and 27 % that disagreed.
For SI, 52 % of organisations agreed and 6 % disagreed, versus 49 % of individuals that
agreed and 18 % that disagreed.
For PP, 34 % of organisations agreed and 6 % disagreed, versus 30 % of individuals that
agreed and 17 % that disagreed.
Overall analysis and conclusion
The most important overall conclusion is that most aspects of the ESF were judged favourably
by the respondents, or at least there were more respondents who responded favourably to the
statements, rather than unfavourably. When looking at the respondents as a whole, this was the
case for every single statement, with the notable exception of the statement on administrative
requirements. In that case, the requirement of the audits (one out of the nine administrative
requirements) was judged unfavourably by respondents, with two additional requirements
judged unfavourably by a substantial number of respondents.
This conclusion is further detailed in the report, along the lines of the five evaluation criteria
Relevance, Effectiveness, Efficiency, Coherence, and EU Added Value.
Comparison policy areas (highest percentages favourable per statement indicated in green,
lowest percentages favourable per statement indicated in red)
Statement 1 2 3 4 5 6
Policy area
HC 78 % 72 % 59 % 45 % 60 % 49 %
A2E 79 % 68 % 51 % 40 % 57 % 48 %
SI 81 % 69 % 59 % 39 % 59 % 52 %
Institutional Capacity 43 % 35 % 33 % 27 % 36 % 32 %
PP 47 % 44 % 39 % 33 % 37 % 33 %
Negative feedback
Besides the mostly positive feedback about the ESF, a limited amount of respondents (21)
provided some negative remarks. The most frequent negative feedback was concerning how the
funds were spent, which target groups were supported, which organisations were funded and
whether all funds were put to good use. Additionally, it was claimed that the extensive
administrative requirements interfered with the successful and efficient execution of projects.
Furthermore, the long term benefits of the ESF were contested by four respondents, mostly
because of the circumstances in their own organisation or the economic circumstances in the
region/country. Finally, the term ‘innovation’ was questioned by two respondents, who claimed
72
that ESF support aimed at innovations could also be used for projects that were not innovative
at all.
There were no specific characteristics of respondents providing such negative feedback
identified.
Messages and patterns emerging from the consultation of stakeholders
When analysing all of the results and differentiating between different subgroups, a number of
patterns emerge:
Policy areas
The policy areas HC, A2E and SI are judged more favourably than the areas of SIC and PP.
However, it is important to note that not all respondents were involved in all five of these policy
fields. Substantially fewer respondents have direct first-hand knowledge of the policy areas SIC
and PP. Also, the effects of intervention aimed at the latter two policy areas take a longer time
to become fully visible.
Organisations versus individuals
Respondents who filled out the questionnaire on behalf of organisations were generally more
positive about the areas HC, A2E, and SI than individual citizens. On the other hand, they were
less positive about the area SIC. Furthermore, individuals tended to judge the statements
unfavourably more often than organisations. However, their responses were mostly positive.
Access to employment: the Role in ESF mattered
Respondents involved in delivering/managing/coordinating ESF support and social partners had
more positive opinions about the area A2E than respondents who had received ESF support.
This finding is substantiated by the replies to statements about the support for individuals:
significantly more respondents involved in managing ESF indicated that ESF support helped in
gaining employment (including self-employment) and they also judged the support to the
unemployed and inactive more favourably than the recipients of ESF.
Recipients of ESF support, on the other hand, appear to judge the efforts in the area of HC more
favourably. This might also explain why recipients of ESF support also responded more
favourably to the statement about whether the ESF was successful in improving the skills of
teachers and educators. Furthermore, the recipients acknowledged the support for NEETs
(young people who are ‘Not in Education, Employment, or Training’), and the people with
secondary and higher educational attainment, more often than the other group.
Competitiveness, convergence and multi-objective
Due to the limited response from countries consisting of competitiveness regions, there were
hardly any significant differences in responses between competitiveness regions, convergence
regions and multi-objective countries. However in competitiveness regions there did seem to be
a pattern in the appreciation of A2E and for efforts aimed at individuals gaining employment. In
the convergence regions, the ESF projects were favourably viewed for their lasting

73
accomplishments for individuals, with significantly more respondents favourably judging the
results for individuals and structural reforms in the area of HC.
The full report on the open public consultation is published on DG EMPL’s website:
http://ec.europa.eu/social/BlobServlet?docId=15997&langId=en

74
Annex 5 Methods
a) Steps in the evaluation methodology and the five studies carried out
The design of the ex post evaluation presented a number of challenges relating to the extensive
geographical coverage, the wide thematic scope, the combination of support targeting both
individuals and systems, and the fact that the regulatory deadline set for finalising the
evaluation did not allow for final implementation results to be taken into account. Additional
limitations were data availability (see Annex 6) and the wide variation in the evaluations carried
out by the Member States during the programming period in terms of scope, topic, timing and
methods. The new rules under the Better Regulation Guidelines required the conduct of an open
public consultation that had not been initially planned and this delayed the finalisation of the
evaluation work by one year from 2015 to 2016.
Given the complexity of this task and the need for adequate preparation, DG EMPL launched a
preparatory study93
the results of which would support the Commission in designing the ex
post evaluation. The preparatory study aimed at assessing the availability of data and at
informing "which type of data" is available in "which Member State" and how it can be used for
the ex post evaluation.
A preparatory study recommended that the evaluation should be organised around three
thematic work packages selected on the basis of the information available and their strategic
importance in the light of the priorities set out in Article 3 of the ESF Regulation. It also
recommended that all data available at EU, Member-State and OP level be used and that
in-depth analysis be carried out in a selection of Member States, so as to ensure that a
significant part of the expenditure would be analysed in depth under each evaluation study. In
response to the study, the Commission launched three thematic studies, focusing on:
supporting the integration of disadvantaged groups into the labour market and society
(SI);94
investing in human capital, which includes adaptability of workers (HC);95
and
access and sustainable integration into employment (A2E).96
The SI and HC studies started in early 2014 and the A2E study at the end of 2014. All three
were based on 2013 monitoring data and existing evaluations at EU and Member-State level, and
covered 27 Member States (Croatia was not included). Two further thematic reports were
produced on the priorities with lower resource allocations (SIC and PP) as part of the work of
the preparation of the evaluation synthesis report.
The 2000-2006 ex post evaluation of ESF concluded that there were many differences between
Member States in the scope and use of ESF. Therefore, the preparatory study proposed a series
93 Preparatory study for the ex post evaluation of ESF 2007-2013; Panteia in association with LSE enterprise. 94 European Social Fund (ESF) 2007-2013 ex post evaluation: supporting the integration of disadvantaged
groups into the labour market and society, ICF international (2016). 95 European Social Fund (ESF) 2007-2013 ex post evaluation: investment in human capital, ICF international
(2016). 96 ESF 2007-2013 ex post evaluation: access and sustainable integration into employment, Metis GmbH in
association with Panteia (2016).

75
of clusters of similar interventions. The assumption was that interventions at a lower than the
priority axis were more clearly demarcated, had similar objectives and target groups and would
be a useful unit of analysis for the evaluation. Therefore a total of 872 actions were identified
across 43 OPs. The cluster framework was further refined during the conduct of the thematic
evaluation studies. The selection of in-depth interventions consisted of three sampling steps: 1)
data availability and evaluability; 2) financial volume and outputs; and 3) coverage of activities
and target groups. At the end of the process, a final verification was performed in order to ensure
that a good spread of interventions was achieved by clusters and target groups and that a
sufficient volume of expenditure and outputs were covered.
A synthesis study97
was conducted to:
integrate the main findings of the thematic evaluations;
update data on the basis of the 2014 annual implementation report (AIR);
perform additional work on Croatia
produce thematic reports on SIC and PP
produce country reports.
An inter-service steering group was established for each of the thematic evaluations and for the
synthesis study. Throughout the evaluation process, the Commission received technical advice
from external expert in evaluation methods and in HC: Professor Alan McGregor (University of
Glasgow), who helped assess deliverables and participated in steering group meetings.
To ensure the robustness of the data used for the evaluation, each thematic report and also
synthesis report was subject to comments from the Member States representatives in the ESF
Partnership for Evaluation with the support of the geographical units within DG EMPL. The
comments received mostly addressed technical issues, such as data gaps in the aggregation of
result indicators (DE, EL, NL), identification of sources supporting findings (EE, LV) as well
as issues such as correct spelling of projects (NL). All comments received in due time on all
deliverables were processed and integrated to the ESF ex post evaluation reports.
All interim and final deliverables have been published on DG EMPL’s website
(http://ec.europa.eu/social/main.jsp?catId=699&langId=en) and the CIRCA website
(https://circabc.europa.eu/).
b) Stakeholder consultation
The stakeholder consultation is summarized in the Annex 4
c) Other relevant studies/reports used
The ex post evaluation has also drawn on some of the ex post evaluations led by DG REGIO,
such as on delivery system,98
and macroeconomic modelling99
100
97 ESF 2007-2013 ex post evaluation: synthesis, Metis GmbH in consortium with Fondazione Giacomo Brodolini
and Panteia.

76
The Summary of data on the progress made in financing and implementing financial
engineering instruments (FEI)101
was used for information relating to the implementation of
FEIs (section 5.3). The results of the Survey of MAs on simplified cost options in the European
Social Fund102
were also used in section 5.3.
The following Court of Auditors reports were also used, as they complement the evaluation
findings:
EU education objectives: programmes aligned but shortcomings in performance
measurement (special report no 16/2016);103
EU policy initiatives and financial support for Roma integration: significant progress
made over the last decade, but additional efforts needed on the ground (special report
no 14/2016);104
and
Are tools in place to monitor the effectiveness of European Social Fund spending on
older workers? (special report no 25/2012).105
Commission’s support of youth action teams: redirection of ESF funding achieved, but
insufficient focus on results (special report no 25/2012).106
98 http://ec.europa.eu/regional_policy/sources/docgener/evaluation/pdf/expost2013/wp12_final_report.pdf 99 The impact of cohesion policy 2007-2013: model simulations with Quest III;
http://ec.europa.eu/regional_policy/sources/docgener/evaluation/pdf/expost2013/wp14a_final_report_en.pdf 100 The impact of cohesion policy 2007-2013: model simulations with RHOMOLO;
http://ec.europa.eu/regional_policy/sources/docgener/evaluation/pdf/expost2013/wp14b_final_report_en.pdf 101 2014 Catalogue number: KN-02-15-749-EN-N. 102 http://www.cc.cec/Ares/ext/documentInfoDetails.do?documentId=080166e5a40d1421 103 http://www.eca.europa.eu/en/Pages/DocItem.aspx?did=36886 104 http://www.eca.europa.eu/en/Pages/DocItem.aspx?did=36850 105 http://www.eca.europa.eu/Lists/ECADocuments/SR12_25/SR12_25_EN.PDF 106 http://www.eca.europa.eu/Lists/ECADocuments/SR15_17/SR_YAT_EN.pdf
77
Annex 6 Data Limitations
The thematic studies used data from the Member States submitted through SFC 2007,107
notably the 2013 AIR and national evaluations. The aggregated data presented in the synthesis
report rely on the 2014 AIR. For the in-depth analysis of interventions, the evaluation relied on
data sources provided by the MAs. Eurostat data were used where relevant. Despite efforts to
mobilise all available information, the ex post evaluation is subject to a series of limitations:
(1) design of programmes: Member States were able to formulate the PAx of the OPs in a
way that did not necessarily correspond precisely to the priorities defined in the ESF
Regulation (i.e. they could combine two of the latter in one PAx) while still complying
with their remit. To overcome this, external evaluators allocated each PAx to a single
policy theme for the purpose of the evaluation, even if some tackled several themes, as
PAx was the only level at which data on financial expenditure, outputs and results could
be correlated (this limitation is overcome in the new period by more robust definition of
Investment priorities);
(2) challenges in aggregating data on participation: for the first time, the evaluation
could draw on common indicators on the participation of individuals per PAx that were
suitable in principle for aggregation at EU level (see Annex XXIII of the General
Regulation). However, aggregation raised several issues. Member States applied their
own definitions for indicators where no EU-wide reference was available (e.g. migrants,
minorities). In some cases, participation data included indirect participants (e.g. pupils
benefiting indirectly from interventions supporting systems) and the same participants
were counted several times within the same intervention, leading to over-reporting.
Disadvantaged groups, older participants and participation by education level were
under-reported, notably due to legal restrictions and reluctance to provide, collect and
report such ‘sensitive’ data. These issues were confirmed by the Court of Auditors in
special reports no 14/2016 and no 25/2012 (see above). This limitation is remedied in
the 2013-2020 programming period by more a robust definition of common output
indicators.;
(3) challenges in aggregating data on results: the regulations laid down no common result
indicators for the 2007-2013 programming period. To obtain overall results, the
contractors aggregated similar programme-specific indicators into a limited number of
result indicators. As regards support for individuals, the results could be aggregated into
three categories of ‘positive result’:
gaining or maintaining employment;
obtaining a qualification; and
other positive results (such as improving skills and competences).
The results presented in this report represent a lower threshold of the total volume of
results achieved by ESF, since they are based on the fraction of results for which such
indicators could be aggregated; this covers 73 % of the ESF budget. Further results on
participation will be reported after 2014. ‘Soft’ results for participants (including
107 The 2007-2013 system for fund management in the European Community (the official IT exchange platform
between the Commission and Member States).

78
personal, attitudinal and behaviour results) were rarely quantified or assessed, leading to
under-estimation of the results obtained for SI activities. Results were rarely reported by
gender or age group, hampering the assessment of effectiveness by target group. While
double counting of results is theoretically possible for the different categories of
common results (eg. One person gaining qualification and employment), in practice
during in depth analysis of interventions, this was not confirmed. Most often, if any at
all, only single result category was set and measured. Given that aggregation of results
was incomplete, presented results are underreporting actual ESF achievements. Also, the
absence of a legal requirement to collect micro-data for individuals made it difficult to
calculate actual success rates for them. For all these reasons, success rates presented in
this report are to be treated with caution. As regards support for entities, the aggregated
number of entities supported and the number of deliverables (actions/tools developed,
studies and evaluations carried out, networks created, etc.) were calculated, but their
wide diversity hampered a robust assessment. This limitation is remedied in the 2013-
2020 programming period by more robust definition of common result indicators;
(4) some indicators did not have predefined targets: a significant proportion (37 %) of
programme indicators had no predefined targets; for some (6 %), no values were
reported at all. Furthermore, the contractors did not have enough information to assess
whether targets had been initially set or adjusted over time in a comparable way and
noted some cases where targets were not adjusted despite a reallocation of budgets;
(5) lack of essential data at intervention level: data for the interventions (or operations)
analysed in depth were scarce, especially on follow-up, but qualitative findings were
available This limitation is remedied in the 2013-2020 programming period by more
robust definition of data collection and storage requiriments; and
(6) lack of robust impact evaluations from Member States: although the Commission
created for the first time a database of all 1 163 evaluations carried out by Member
States during the programming period, these were mainly process-related and included
very few impact evaluations and even fewer counterfactual impact evaluations (CIEs).
The feasibility of CIEs and of cost-benefit and/or cost-effectiveness analyses was
severely constrained by the lack of suitable data, notably micro-data on individuals,
despite the Commission’s efforts during this period to promote the use of CIEs.
A number of measures were taken in this evaluation to overcome these limitations,108
which
were also pointed out by the Court of Auditors in its special report on education109
:
triangulation from various sources of evidence was systematically used to strengthen
conclusions. This included evidence collected during the in-depth analysis, the country
analysis, surveys, audit reports, national evaluations, other Commission evaluations, and
the results of the open public consultation;
Use of more of more qualitative assessment methods such as in depth analysis of
selected interventions;
108 ‘Weaknesses in monitoring also have an impact on the capacity of the Commission and Member States to carry
out evaluations’, observation 33. 109 EU education objectives: programmes aligned but shortcomings in performance measurement (special report
no 16/2016

79
the allocation to single policy themes and aggregations of data were checked with
Member-State authorities, which provided extensive comments. In a limited number of
cases (FR and DE), additional evidence from other, national sources was used to address
reporting gaps; and
verification of data by Member-State authorities, who were asked to verify all
quantitative information collected for in-depth interventions so as to improve the
robustness of subsequent analysis and conclusions.


