175
1 POLICY EVALUATION OF TARIFF RATE QUOTAS Commissioned by: Swiss Federal Office for Agriculture (FOAG) Final report (Version 18/11/2016)
1
POLICY EVALUATION OF TARIFF RATE QUOTAS
Commissioned by: Swiss Federal Office for Agriculture (FOAG)
Final report (Version 18/11/2016)
Policy evaluation of Tariff Rate Quotas
2
POLICY EVALUATION OF TARIFF RATE QUOTAS NOVEMBER 2016
Commissioning body
Swiss Federal Office for Agriculture (FOAG)
Project Manager Enrica Gentile – Areté srl
CONTACT DETAILS
Areté srl Via del Gomito 26/4
40127 Bologna – Italy +39.051.4388500
[email protected] [email protected] www.areteonline.net
Study Team
Areté Mauro Bruni Alberico Loi
Annachiara Saguatti Mario Gentile
Serena Berisio Luca Cuppari
External experts involved in the study
Prof. Roberto Esposti Prof. Maurizio Aragrande
Therese Haller Prof. Martin Huber
Please quote as: Loi A., Esposti R., Gentile M. et al. (2016), Policy evaluation of tariff rate quotas. Report mandated by the Swiss federal Office of Agriculture. Areté srl, Bologna.
Policy evaluation of Tariff Rate Quotas
3
Table of contents
0 EXECUTIVE SUMMARY .................................................................................................................. 7
0.1 Introduction......................................................................................................................................................... 7
0.2 The TRQ system in Switzerland ........................................................................................................................ 7
0.3 Summary of study methodology ....................................................................................................................... 8
0.4 Conclusions ........................................................................................................................................................ 9
1 INTRODUCTION: STUDY CONTEXT AND OBJECTIVES ............................................................ 14
1.1 Study context .................................................................................................................................................... 14
1.2 Policy framework for the application of TRQ-related provisions in Switzerland ....................................... 14
1.3 Objectives of the study .................................................................................................................................... 15
2 THE TRQ SYSTEM IN SWITZERLAND ......................................................................................... 18
2.1 Overview of the meat sector TRQs ................................................................................................................. 18 2.1.1 Products covered by the study ................................................................................................................... 18 2.1.2 Short overview of the genesis of the tool/ original policy goals .................................................................. 18 2.1.3 Key policy measures .................................................................................................................................. 18 2.1.4 Evolution of the functioning mechanisms ................................................................................................... 21
2.2 Overview of vegetables sector TRQs ............................................................................................................. 22 2.2.1 Products covered by the study ................................................................................................................... 22 2.2.2 Short overview of the genesis of the tool/ original policy goals .................................................................. 22 2.2.3 Key policy measures .................................................................................................................................. 22 2.2.4 Evolution of the functioning mechanisms ................................................................................................... 26
2.3 Main similarities and differences between the relevant TRQ regimes ........................................................ 27
3 STUDY METHODOLOGY .............................................................................................................. 29
3.1 Overall approach .............................................................................................................................................. 29
3.2 Methodology for the evaluation of the efficiency of TRQs ........................................................................... 32
3.3 Main horizontal and product specific indicators ........................................................................................... 34 3.3.1 Policy indicators ......................................................................................................................................... 34 3.3.2 Price indicators ........................................................................................................................................... 35
3.4 Applied methodology for the reply to evaluation questions ........................................................................ 35 3.4.1 Question 1.1: impact on domestic markets ................................................................................................ 35 3.4.2 Question 1.2: impact on domestic prices ................................................................................................... 35 3.4.3 Question 2.1: impact on domestic – world price differentials ..................................................................... 36 3.4.4 Question 2.2: impact on price stability........................................................................................................ 37

Policy evaluation of Tariff Rate Quotas
4
3.4.5 Question 2.3: impact on adequate provision .............................................................................................. 37 3.4.6 Question 3.1: rent and rent distribution ...................................................................................................... 38 3.4.7 Question 3.2: impact on import composition .............................................................................................. 38 3.4.8 Question 3.3: impact of market structure on rent distribution ..................................................................... 39 3.4.9 Question 3.4: impact of TRQs on market structure .................................................................................... 39 3.4.10 Question 4: proposed changes .................................................................................................................. 39
4 REPLY TO EVALUATION QUESTIONS ........................................................................................ 40
4.1 Reply to preliminary questions ....................................................................................................................... 40 4.1.1 Reply to Q 1.1: impact on domestic markets.............................................................................................. 40 4.1.2 Reply to Q 1.2: impact on domestic prices ................................................................................................. 68
4.2 Reply to questions on efficacy of TRQs ......................................................................................................... 93 4.2.1 Reply to Q 2.1: impact on domestic – world price differentials ................................................................... 93 4.2.2 Reply to Q 2.2: impact on price stability ................................................................................................... 108 4.2.3 Reply to Q 2.3: impact on adequate provision ......................................................................................... 113
4.3 Reply to questions on efficiency of TRQs ................................................................................................... 118 4.3.1 Reply to Q 3.1: rent and rent distribution.................................................................................................. 118 4.3.2 Reply to Q 3.2: impact on import composition.......................................................................................... 143 4.3.3 Reply to Q 3.3: impact of market structure on rent distribution ................................................................ 156 4.3.4 Reply to Q 3.4: impact of TRQs on market structure ............................................................................... 158 4.3.5 Reply to Q 4: proposed changes to improve efficacy and efficiency of existing TRQs system .... 159
5 INVESTIGATION ON THE USE OF TRQS IN OTHER COUNTRIES AND COMPARISON WITH THE SWISS CASE .............................................................................................................................. 160
5.1 Overview of notable examples of application of TRQs for beef ................................................................. 160
5.2 Comparative analysis of the administration of TRQs for beef: Switzerland vs. other countries ............ 161
6 CONCLUSIONS ........................................................................................................................... 164
7 ANNEX ......................................................................................................................................... 169
8 BIBLIOGRAPHY AND LITERATURE REVIEW ........................................................................... 170
8.1 Bibliography.................................................................................................................................................... 170
8.2 Literature review ............................................................................................................................................. 172
Policy evaluation of Tariff Rate Quotas
5
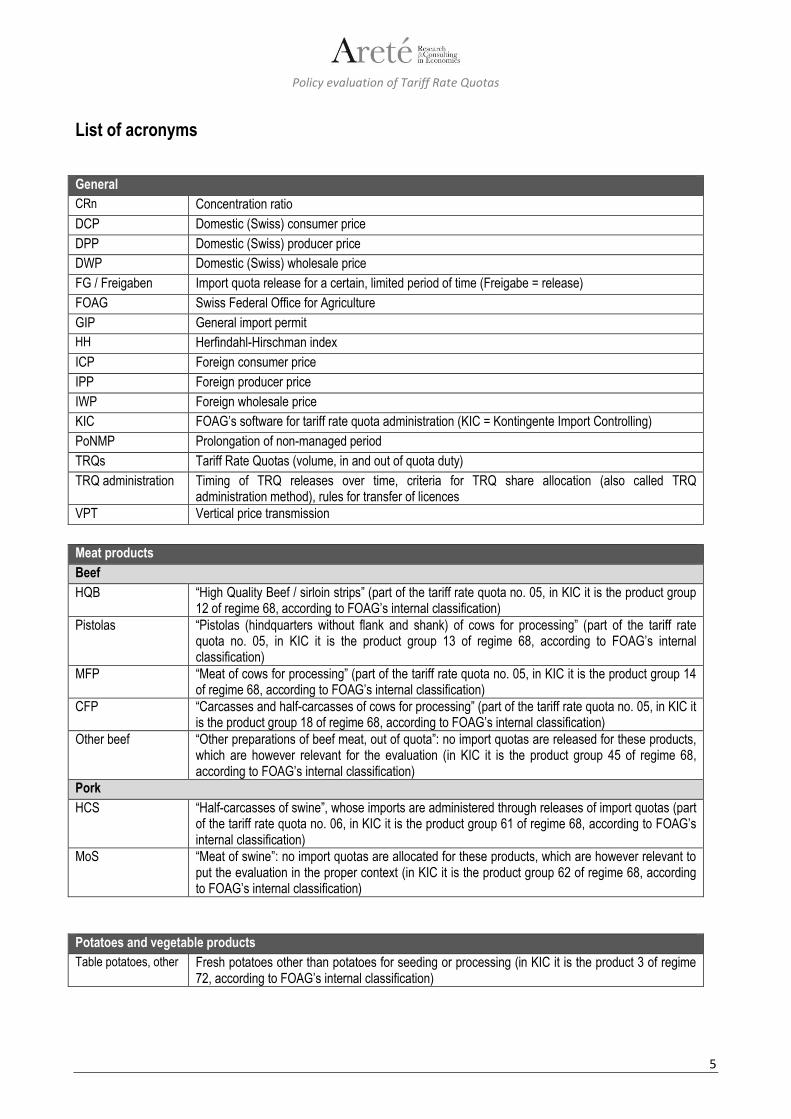
List of acronyms
General
CRn Concentration ratio
DCP Domestic (Swiss) consumer price
DPP Domestic (Swiss) producer price
DWP Domestic (Swiss) wholesale price
FG / Freigaben Import quota release for a certain, limited period of time (Freigabe = release)
FOAG Swiss Federal Office for Agriculture
GIP General import permit
HH Herfindahl-Hirschman index
ICP Foreign consumer price
IPP Foreign producer price
IWP Foreign wholesale price
KIC FOAG’s software for tariff rate quota administration (KIC = Kontingente Import Controlling)
PoNMP Prolongation of non-managed period
TRQs Tariff Rate Quotas (volume, in and out of quota duty)
TRQ administration Timing of TRQ releases over time, criteria for TRQ share allocation (also called TRQ administration method), rules for transfer of licences
VPT Vertical price transmission
Meat products
Beef
HQB “High Quality Beef / sirloin strips” (part of the tariff rate quota no. 05, in KIC it is the product group 12 of regime 68, according to FOAG’s internal classification)
Pistolas “Pistolas (hindquarters without flank and shank) of cows for processing” (part of the tariff rate quota no. 05, in KIC it is the product group 13 of regime 68, according to FOAG’s internal classification)
MFP “Meat of cows for processing” (part of the tariff rate quota no. 05, in KIC it is the product group 14 of regime 68, according to FOAG’s internal classification)
CFP “Carcasses and half-carcasses of cows for processing” (part of the tariff rate quota no. 05, in KIC it is the product group 18 of regime 68, according to FOAG’s internal classification)
Other beef “Other preparations of beef meat, out of quota”: no import quotas are released for these products, which are however relevant for the evaluation (in KIC it is the product group 45 of regime 68, according to FOAG’s internal classification)
Pork
HCS “Half-carcasses of swine”, whose imports are administered through releases of import quotas (part of the tariff rate quota no. 06, in KIC it is the product group 61 of regime 68, according to FOAG’s internal classification)
MoS “Meat of swine”: no import quotas are allocated for these products, which are however relevant to put the evaluation in the proper context (in KIC it is the product group 62 of regime 68, according to FOAG’s internal classification)
Potatoes and vegetable products
Table potatoes, other Fresh potatoes other than potatoes for seeding or processing (in KIC it is the product 3 of regime 72, according to FOAG’s internal classification)

Policy evaluation of Tariff Rate Quotas
6
Potatoes and vegetable products
Round tomatoes Tomatoes other than Cherry and San Marzano tomatoes, but including “beef” tomatoes and “other” tomatoes, which were covered by separate allocations of import quotas through the import quota release system up to 2006 (in KIC it is the product group 121 of regime 13, according to FOAG’s internal classification)
Apples Table apples without apples for juice and cider (in KIC it is the product 91 of regime 13, according to FOAG’s internal classification)
Strawberries Strawberries without wood strawberries and those for processing (in KIC it is the product 101 of regime 13, according to FOAG’s internal classification)
Policy evaluation of Tariff Rate Quotas
7
0 Executive summary
0.1 Introduction
The present study is the first comprehensive evaluation of the Swiss Tariff Rate Quotas (TRQs), the key instrument for border protection of the agricultural sector in Switzerland. The introduction of the TRQs was a consequence of the WTO Uruguay round, as in the previous period imports of agricultural products were quantitatively restricted by quotas. The international obligations requested to implement a minimal in-quota market access per product group and the possibility of importing unlimited quantities at a higher out-of-quota tariff. The system is currently based on 28 TRQs for imports of livestock, animal and vegetable products which are administered in different manners (auctioning; requirements on domestic purchases; historical imports; first-come, first-served).
The study focuses on the assessment of the system’s efficacy and efficiency1 for selected products. The following products have then been chosen for the evaluation on the basis of their economic relevance, the data availability and their representativeness of the TRQ administration methods:
• Meat: beef; pork; • Vegetable products: potatoes; tomatoes; apples; strawberries.
The study has assessed the efficacy and efficiency of the policy with reference to the following technical objectives set out in the intervention logic2: i) to support domestic agricultural production by limiting imports to maintain a price differential between the domestic prices and the international ones; ii) to contribute to agricultural producers’ surplus (income support); iii) to contribute to ensuring stable conditions for agricultural production and iv) to allow an adequate provision of domestic markets.
0.2 The TRQ system in Switzerland
For beef, Switzerland has a self-sufficiency ratio of more than 80%, with seasonal variations. In-quota imports are mainly prime cuts or fresh and chilled carcasses and occur within the TRQ n.05 which is further subdivided into various sub-quotas; the relevant product category for the present study is “Other meat of bovine animals” included – together with edible offal – in the sub-quota category 05.71. The TRQ is opened by the Swiss Federal Office for Agriculture (FOAG) at the request of Proviande (sector association including producers, processors, traders, distributors and importers), according to market needs. Until 2004, quotas were distributed according to domestic purchases of meat; from 2005 to 2007, a transition of the system towards auctioning of quotas took place, with 33% of the quota auctioned in 2005, 66% in 2006 and 90% starting from 2007. The 10% share of quota distributed according to public market purchases was maintained. Due to a decision of the Federal Parliament, in 2015 this reform was partially withdrawn.
For pork, domestic production nearly covers the totality of the market needs; the self-sufficiency ratio is over 90%. Import quota releases occur rarely and are limited to half-carcasses, to better meet the industry’s interests to cover a larger part of the value chain domestically. These releases, opened by FOAG at the request of Proviande, mainly serve to stabilize domestic supply and prices. As this global TRQ (n. 06) is shared with poultry meat, there is no difficulty to fulfil the quota (mostly by poultry imports). The TRQ is subdivided into sub-quotas, the relevant one for this study being “Pork half carcasses” (sub-quota category 06.41). Similarly to the case of beef, the only significant change in recent years has concerned the system of quota allocation. Up to 2004, import quotas for pork were distributed according to domestic purchases (slaughters). Starting from 2005, a transition of the system towards the allocation of import quotas via auctioning took place: the share allocated by auctioning was set at 33% in 2005 and increased up to 66% in 2006. Since 2007, the quotas for half-carcasses are fully auctioned.
The seasonal nature of domestic production of fruit and vegetables covered by the study (potatoes, tomatoes, apples, strawberries) has implications on the rationale of the related policy measures, which are basically aimed at managing imports in the months when domestic production is placed on the market, and at allowing adequate supply when domestic production is unavailable (this also includes stock depletion in the case of potatoes and apples, which are storable products). The methods and timing of TRQ administration are hence tailored to the duration of the domestic production period and to the storage possibilities of each product. For fresh vegetables and fruits, there is a distinction between a so called managed period and a non-managed period (“two-phase system”). During the period when the imports of a product are not managed, no out-of-quota tariff is applied and all imports occur at the low in-quota rate.
Imports of potatoes are needed when the Swiss harvest is late or when quality isn't good enough. Usually, the stocks last until the beginning of the subsequent campaign, and therefore only early potatoes are imported in most years. Only table potatoes are of
1 The term efficacy refers to whether the policy measure has reached its objectives, while the term efficiency refers to the size and distribution of the costs and benefits while reaching these objectives. 2 The intervention logic is defined as a set of hypothetical causal relations that describe how a policy measure (intervention) is expected to attain its objectives.
Policy evaluation of Tariff Rate Quotas
8
interest for this study; no varieties or types are distinguished; the only differentiation is with respect to packaging: while the in quota tariff is the same, for out-of-quota imports potatoes in bulk, sacks or open containers have a different tariff number than other packaging. Potatoes and potato products are imported under TRQ n.14, which is further divided into sub-quotas; since 2009 the quota has been opened for the period from January to May. Additional quota shares are opened according to market needs. For this purpose, the FOAG releases additional shares on request of the umbrella organization3 Swisspatat.
Tomatoes are imported under TRQ n.15 and “round tomatoes” is the only category covered in the present study. From October 21st to April 30th, tomatoes can be imported at the in-quota tariff: there is no out-of-quota tariff applied (the quota is “not managed”); the managed period lasts from May 1st to October 20th. For round tomatoes, the period in which the TRQ is effectively administered is shorter, and lasts from June 1st to September 30th. During the managed period, the quota can be opened biweekly at the request of any importer, if the umbrella organization agrees and makes a request to the FOAG; the volume released is sufficiently high to make sure that the requested quantities can be imported. The quota shares are distributed according to the market shares of the previous year, which include domestic purchases as well as imports.
For apples, Switzerland has a large domestic supply, with surpluses on the domestic demand. Nevertheless, there are import needs due to seasonal variations and quality reasons, as well as to ensure availability of various apples varieties on the domestic market. As a consequence, the regulation of imports via TRQs is based on a two-phase system, as for other fresh fruit and vegetables. The “out of season period”, when the TRQ for apples is not managed, only lasts for one month each year (from June 15 th to July 14th). It can be extended in case of important shortages in stored apples or – more frequently – when the start of the Swiss harvest is later than the 15th of July: in that case, the FOAG usually prolongs the non-managed period and does not distribute import quotas, which means that all imports can be made at the in-quota tariff. Apples are imported under TRQ n. 17, and there is a tariff distinction between open packing and other packings. Quotas are allocated with respect to purchases during the previous year, including domestic production as well as imports; however, as imported quantities are much smaller than domestic production, the allocation mainly depends on domestic purchases.
The production period of most domestic strawberries is only three and a half months long (from May 15th to August 31st); this is the period when their TRQ (n. 19) is managed. Outside this period, imports at the in-quota tariff are not limited. Within the managed period, the regulation is is designed to meet the time-specific needs. Quota openings can take place twice a week, and the decisions are based on consumption data of the previous year and current information on production. Similarly to apples, time slots within the managed period may be defined where imports at the in-quota tariff are not limited (prolongations of non-managed period). During the managed period, the quota can be opened biweekly at the request of importers, if the umbrella organization agrees and makes a demand to the FOAG. The opened volume can be higher than what is needed to supply the market, to make sure that the requested quantities can be imported.
For products covered by the evaluation, TRQs are usually filled or even overfilled (that is, additional imports are authorized at the in quota duty, in excess to the quota notified at the WTO).
0.3 Summary of study methodology
Study methodology was based on both quantitative and qualitative approaches.
Quantitative analysis and econometric methods are used - within the limits given by the availability of suitable datasets – for an empirical assessment of the influence of TRQs on a number of aspects which are especially relevant for providing an answer to evaluation questions 1.1, 1.2, 2.1, 2.2, 2.3 and 3.1 (for a complete list of evaluation questions see boxes at § 0.4).
Quantitative analyses for the purposes of the assessment have been carried out on a series of aspects. The most important ones are:
1. Definition of sets of criteria, indicators and (where applicable) benchmarks for the purposes of quantitative analysis. 2. Processing of raw data to obtain datasets which are suitable for the application of the foreseen methodology. 3. Illustration of the evolution of relevant variables / indicators over the period considered for the assessment (2000-2014),
through series of graphical representations. 4. Preliminary appraisal through visual inspection of graphical representations. 5. Analysis of the statistical properties of the relevant time series through a battery of econometric tests aimed at detecting:
the presence and nature of auto-correlation; presence of unit roots (non-stationarity); presence of ARCH effects (indicating variation in price volatility); presence of seasonality; presence of structural breaks.
3 An umbrella organisation is an inter-branch organisation which includes all the participants into a product’s supply chain, from producers to retailers. Its objective is usually to provide a means of allowing dialogue between actors in the supply chain and in promoting best practices and market transparency.

Policy evaluation of Tariff Rate Quotas
9
6. Wherever the features of the available datasets allow their application, econometric estimations are performed in order to assess the influence of policy variables with respect to supply/demand variables, to the relationships between the external and the domestic prices and between prices along the supply chain. The isolation of the domestic market is assessed by looking for a long-run relationship linking the external and the domestic prices through vector autoregressive (VAR) models (in the levels or in the first differences). These relationships are estimated by explicitly including policy variables in the model, either as exogenous or endogenous regressors.
In the study methodology, quantitative descriptive analysis and econometric methods are complemented by qualitative approaches. Qualitative approaches are used as a main investigation tool to analyse theoretical background of the study, as a “backup assessment method”, when it emerges that some datasets lack the features required for the application of the proposed econometric methods or in order to add depth and detail to the quantitative explanation of the observed phenomena. The most important aspects where qualitative analysis was performed are:
1. Study of the intervention logic of TRQs and of the related administration systems. 2. Theoretical analysis of the functioning mechanisms of TRQs. 3. Study of the supply chain and in particular of its structure, its organisation and its functioning mechanisms.
Qualitative analyses have been based on different approaches (system approach, critical factor analysis) and data sources (desk research, literature review and interviews to knowledgeable subjects).
0.4 Conclusions
Generally speaking, the results of the analysis carried out to answer the specific evaluation questions (detailed below) indicate that whereas some of the policy objectives of TRQs are reached and therefore the policy can be considered partly effective, it is clearly inefficient. In addition to the volume of the TRQs and the height of the out-of-quota duty, also TRQ administration methods have an important role in this respect. However, some relevant elements for a thorough evaluation of the system were found to be missing (for instance, there is a lack of data on actual Swiss producer prices for fruit and vegetable products).
Conclusions on the efficacy of existing TRQs system
Preliminary questions
Q.1.1 What is the impact of TRQs on imports, production and consumption?
Q.1.2 What is the impact of TRQs on import and domestic prices at the various stages of the food chain?
Questions on efficacy
Q. 2.1 What is the contribution to existing price differentials between domestic and world prices? Is this difference lower than the out-of-quota tariff?
Q. 2.2 What is the contribution to stable domestic prices?
Q. 2.3 What is the contribution to allow an adequate provision of domestic markets?
The replies to preliminary question 1.1 highlighted that TRQ and TRQ administration have an evident impact on imports of all the six products covered by the assessment since the out-of-quota duties are usually extremely high and the volume of imports strongly depends on the releases of import quotas. Quotas are released only when the domestic production is not sufficient to cover domestic demand and this is consistent with the intention of the legislator to complement domestic supply with imports when necessary. As for the impacts of TRQ administration on domestic production and demand, the assessment found that it is more the TRQ administration which is carefully tailored to adapt to the conditions and the dynamics of production and demand (two-phase system to take into account seasonality of production for fruit and vegetables, less quota releases wherever a structural oversupply is detected, careful definition of the timing and volume of the quota releases for meat in order to ease the domestic market without putting pressure on prices, etc.), rather than TRQ administration having an impact on domestic production and consumption.
The replies to preliminary question 1.2 detected impacts of TRQ and TRQ administration on domestic prices for most of the products covered by the assessment (the only exceptions being potatoes and apples because of the very limited importance of imports for these products with respect to domestic production), allowing higher prices with respect to foreign markets. Impacts on prices were usually found to be in general consistent with those which would be expected in the light of the policy rationale.
Policy evaluation of Tariff Rate Quotas
10
However, while the policy rationale is centred on higher domestic producer prices (with special attention to the period in which seasonal products – tomatoes, strawberries - are placed on the market), the analysis showed higher prices at all the levels of the supply chain, and especially at wholesale and retail stages. For meat, quota releases are typically made when high domestic consumer prices signal a tight situation on the domestic market (low supply with respect to domestic demand), in order to complement domestic supply with imports. An interesting result is that, contrary to what would be expectable, domestic prices at all levels remain high during periods of quota releases, confirming that the release of import quotas is carefully managed in a way to ensure that there is no pressure on domestic prices. Potatoes are imported in general from January to May, when the TRQ is open. For fruit and vegetable products, following the seasonal character of TRQ administration, consumer prices are higher during the managed period; in this case the analysis is however limited by the availability of only reference prices at wholesale and producer levels. Asymmetric vertical price transmission, suggesting the presence of imbalances in bargaining power to the advantage of downstream stages of the supply chain, and especially of retailing, was detected in the supply chains of beef and pork. This implies that high consumer prices obtained by TRQ administration are only partially transmitted to producers’ prices.
As for efficacy proper, the replies to question 2.1 highlighted the presence of significant to substantial price differentials between the domestic prices and the foreign prices at most/all stages of the supply chain for all the six products covered by the assessment (for fruit and vegetable products, since most of the price series are only available during the campaign, it was possible to monitor this gap only in the managed period). The assessment of price differentials against the out-of-quota tariffs posed some important challenges, and suffered from a number of limitations in the available evidence base (in particular the features and length of the available price series). This notwithstanding, additional elements emerging from replies to other study questions (above all the limited/negligible extent of out-of-quota imports for all the six products studied, which indicated that the TRQ system did not allow to satisfy the increase in domestic demand via out-of-quota imports) allowed to conclude with reasonable confidence that price differentials between domestic and foreign prices are usually lower than the out-of-quota tariff.
The elements emerged from the replies to question 2.2, albeit non-conclusive, suggested that the TRQs and their administration have probably contributed to the greater stability of domestic prices vis-à-vis foreign prices, which was detected for all the six products at nearly all the stages of the supply chain (the only significant exceptions being consumer prices of beef and strawberries); once again, for fruit and vegetable products this analysis is severely limited by the fact that only indicative prices are available for the wholesale and producer stages of the domestic supply chain.
Finally, question 2.3 investigated the contribution of the TRQs and TRQ administration in allowing an adequate provision of domestic markets, a rather complex concept which was defined as a combination of:
i. the absence of product shortages (which would be signalled by a lower frequency of price spikes in Switzerland than in external markets);
ii. a balanced origin composition of imports (which should better guarantee supply security than an extremely polarised one, relying on a single dominant country);
iii. the absence of conditions (i.e. underutilised import quotas, especially when at the same time important transfers of the same occur among operators, significant volumes of out-of-quota imports by operators that are “locked out” of the in-quota import trade) which could suggest the occurrence of market rationing by importers.
Also in this case, the assessment posed some challenges, and suffered from limitations deriving mainly from the features and length of the available price series. The key conclusions can be summed up in as follows:
No elements emerged which could unequivocally suggest the occurrence of shortages for the six products covered in the assessment.
The products showing a highly polarised origin composition of imports (half-carcasses of swine and, to a lesser extent, potatoes and strawberries) were found to be in a situation of oversupply (pork), or saw a non-critical role of imports in supplying the domestic market (potatoes), or did not show any other elements suggesting potential threats in terms of supply security (strawberries).
The threat of market rationing by the leading importers, with consequent risk of sub-optimal provision of the domestic market, was detected for potatoes and (especially) for tomatoes, although it might potentially concern all products, since import quota releases (in terms of both volume and timing) are decided by market operators to avoid negative impacts on domestic prices.
Summary of conclusions on efficacy
The main conclusions on the efficacy of TRQs can be sketched as follows:
1. Concerning the support of domestic production, the analysis shows that imports are only allowed when domestic production is not sufficient to cover domestic demand, consistent with the intention of the legislator. Both TRQs (due to the height of out-of-quota duty) and TRQ administration (timing and frequency of quota releases) have an evident impact on imports of all the six products covered by the assessment. In this respect, it is more the TRQ administration which is precisely tailored to adapt to the

Policy evaluation of Tariff Rate Quotas
11
conditions and the dynamics of production and demand, rather than TRQ administration having an impact on domestic production and consumption.
2. TRQs helped keeping domestic prices higher than foreign ones at all the levels of the supply chain. TRQ administration also contributed to allow higher prices even in periods of quota releases. These contribute to support producers’ income4. However: a. While the policy rationale is centred on higher domestic producer prices, the analysis showed higher prices at all the levels
of the supply chain, and especially at wholesale and retail stages. b. Asymmetric vertical price transmission in the beef and pork market suggests the presence of imbalances in bargaining
power to the advantage of the downstream stages of the supply chain, so that increases in consumer prices are only partially transmitted to the producers’ prices.
c. Price differentials between domestic and foreign prices at all the stages of the supply chains are usually lower than the out-of-quota tariff (no arbitrage through out-of-quota imports is basically possible).
d. For fruit and vegetable products, the analysis is however limited by the availability of reference prices only. 3. On price stability, TRQs and their administration have probably contributed to the greater stability of domestic prices vis-à-vis
foreign prices, for all the six products at nearly all the stages of the supply chain. Also here, for fruit and vegetable products, the analysis is however limited by the availability of reference prices only.
4. On providing an adequate provision to domestic markets, albeit no elements suggest the occurrence of shortages for the six products, the threat of market rationing by leading importers (with sub-optimal provision of the domestic market) is concrete especially for potatoes and tomatoes, but might potentially concern all products.
Questions on efficiency
Q. 3.1 Which costs and benefits result for the various actors involved (economic welfare of producers, importers, processors, distributors, retailers, consumers, government), taking into account the relevant characteristics of world and domestic markets? In particular, what can be said about the impact on farmers vs the impact on the downstream industry? Which rents arise, and how are they distributed?
Q. 3.2 Which is the impact of TRQs and of their administration method on the structure of imports (effect on the price and volume composition of shipments, structure of importers)?
Q. 3.3 Does the Swiss market structure (not perfect competition) influence the distribution of costs, benefits, rents?
Q. 3.4 What is the impact of TRQs on the development of the market structure of the food chain / on the vertical chain of production? Do they promote the formation of non-competitive market structures? To which extent?
The assessment in relation to question 3.1 showed that there is a rent associated with TRQs, since domestic prices are kept higher than foreign ones by border protection. A series of limitations prevented from the quantification of rent / total surplus deriving from TRQs. Different studies and articles have provided general indications on the order of magnitude of the rent: the OECD5 estimated the gain of producer surplus in approximately CHF 1.01 billion, while – due to efficiency losses associated to border protection measures – the total cost for Swiss consumers is estimated around CHF 1.7 billion. The Swiss price monitor6 provides an indication of the extra-cost for Swiss consumers as between CHF 2 and 3 billion. According to the present study, the downstream sectors – and the retail stage in particular – have had an advantage over producers in capturing the rent created through the TRQs and their administration for most of the products covered by the assessment. This can be concluded for a number of reasons: different dynamics of domestic prices at the two extremes of the supply chain (producer: flat / consumer: increasing); asymmetries in price transmission (for meat); dominance of the leading retailers and limited importance of independent operators; fairly static arena of importers and no producers active in import trading. A possible exception to this emerged for potatoes (where, even in a market dominated by the two leading retailers, producers might hold a relatively bigger share in import trading in comparison with the other products) and for beef and pork (where the introduction of an auction-based import quota allocation has allowed the Swiss government to capture a part of the rent generated by the administration of the TRQ). Swiss consumers were found to be negatively affected (in terms of higher retail prices paid, or of foregone savings from lower prices that would prevail in absence of TRQs and TRQ administration) by the presence of the TRQs and their administration for all the products covered by the assessment. For beef and strawberries the potential rent accruing to the intermediate stages of the food chain has increased over time thanks to the diverging dynamics of domestic consumer price (increasing) and producer price (rather flat) over the respective foreign ones.
4 Note that a detailed analysis of costs and revenue composition falls outside the scope of the study. 5 OECD Review of Agricultural Policies for Switzerland, 2015 6 Newsletter 04/16, www.preisueberwacher.admin.ch/pue/it/home/documentazione/informazioni-ai-media/newsletter/2016.html

Policy evaluation of Tariff Rate Quotas
12
The reply to question 3.2 highlighted the following impacts of TRQs and of their administration method on the structure of imports:
i. Effects on quality/price composition of imports for all products except apples (where no significant impact on imported varieties and corresponding prices was found), promoting the import of specific typologies of products (high quality beef, half-carcasses of swine, early potatoes) or strictly regulating import volumes, with very low volumes of imports and peaks in import unit value7 during the management period (tomatoes and strawberries).
ii. Effects on origin composition of imports for beef (where the absence of origin-specific quota allocations resulted in a very diversified group of exporting countries) and strawberries (where the preferential quota for EU origins resulted in the prevalence of few EU countries as foreign suppliers).
iii. Effects on the structure of imports and of the arena of operators active in import trading for all the six products covered by the assessment, mainly determined by the possibility of trading import quotas among operators.
The practical relevance of the switch to auctioning of import quotas on the structure of the arena of operators active in importing and in-quota trading of beef and pork, was found to have been very limited. Service companies and some of the companies they operate on behalf of, which had been the key subjects in the system prior to 2005, succeeded in maintaining such a role also after the switch to auctioning (also thanks to the aforementioned possibility of trading import quotas among operators); this limited the effects of the switch to auctions in rebalancing the market power among importers. The introduction of auctions as administration method for meat allowed the entrance of new importers in the market: despite this, their relevance in terms of import rights (and of actual imports) has been low (it should also be noted that the presence of service companies constitutes a challenge in tracing what the various operators behind them actually import). Finally, it cannot be excluded that – in concentrated markets like meat– service companies providing pooling of demand, risk minimization and centrally managing the necessary administrative process for quota allocation, might further facilitate player coordination in import strategies in addition to what promoted by TRQs (see below). These companies act on behalf of many individual operators – some of very large dimensions – and their role in redistribution of quotas among their members is not clear: in this context, the potential impact on the overall market structure of these entities might be relevant. As per the potential effects on producers, no elements emerged from the analysis suggesting neither negative nor positive impacts of the switch to auctioning on producer prices and rents.
The replies to questions 3.3 and 3.4 are inter-linked with replies to questions 3.1 and 3.2.
The reply to question 3.3 highlighted that the non-perfect competition characterising the structure of the Swiss market for the products considered in the evaluation has had an influence on rent distribution: this conclusion, particularly evident for beef and pork where the econometric analysis on price transmission was feasible, also applies to fruit and vegetable products, on the basis of indirect findings of analysis carried out to answer previous questions. For all the six products covered by the assessment, the downstream stages of the food supply chain resulted to be those who are better positioned to capture the highest share of the rent.
Finally, the reply to question 3.4 (which focuses on the assessment of the reversed causal relationship tackled by question 3.3) concluded that the TRQ administration system of all the six products covered in the assessment formally encourages / allows the exchange of information and – more practically – of import quotas, and the cooperation among players within the respective supply chains. Although market structure and concentration depend on many other factors than TRQs, and even if no direct proof could be obtained for, ceteris paribus, a lower degree of concentration in the absence of TRQs, such self-regulated, well-coordinated and consensus-based processes almost certainly fosters more or less formalised alliances and partnerships among the operators themselves, thus influencing the overall structure of the market. The need to find agreements - both within the same stage of the supply chain and with the other stages - on volumes and timing of quota releases, the possibility to exchange quotas obtained through auctions (for meat) or to have a second round of trade to fine-tune a company’s import rights (for fruit and vegetable products), suggest that in an already concentrated market as the Swiss one, concertation and dialogue are crucial for an effective management of import activities; in such a context, the market structure, both in its formalised and in its practical form, can be impacted, and the incentives to a more aggressive competition can be limited. The resulting effects of these elements are almost certainly the promotion of non-competitive market structures, with an overall decrease in the efficiency of the system.
In general, the most critical aspects of the TRQ administration system highlighted by the assessment are the following:
i. Its remarkable complexity, especially as far as certain aspects of its functioning (e.g. original allocations of import quotas; trade of import quotas among operators) are concerned.
ii. The fact that crucial decisions for TRQ administration (timing and volume of releases of import quotas) are de facto decided by the concerned operators, through a coordinated, consensus-based process: in an agro-food system like the Swiss one, characterised by two leading retailers holding substantial shares in various markets, and with significant upstream vertical integration, this could result in further reinforcement of dominant positions with potentially negative effects on the overall efficiency of the system. In addition, the strategies of the various actors involved in the decisional process are by nature
7 Import unit value is calculated as the ratio between the value (in CHF) and the volume (in Kg net) of imports of a tariff line relevant for the allocation of import quota releases in a specified period (usually a month); it is basically the weighted average of imported values.
Policy evaluation of Tariff Rate Quotas
13
undisclosed: the functioning of the TRQ system is therefore not completely transparent to external observers / the general public.
Summary of conclusions on efficiency
The main conclusions of the analysis concerning TRQs efficiency can be summarized as follows:
1. A consolidated result of the relevant economic literature is that TRQs create rents to producers thanks to the border protection they offer; however, the net welfare effect is negative. The OECD and the Swiss price monitor have provided indications on the order of magnitude of the rent. According to the OECD analysis, the losses for consumers are higher than the benefits accruing to producers and to the governmental budget.
2. The downstream sectors have had an advantage over producers in capturing any rents created through the TRQs and their administration system for most of the products covered by the assessment. This is due to the conditions of imperfect competition in the intermediate stages of the food chain.
3. TRQs and their administration system influenced the quality composition of imports and their price. 4. The introduction of an auction-based import quota allocation has allowed the Swiss government to capture a part of the rent
generated by the administration of the TRQ. The practical effects of the switch to auctioning of import quotas on the structure of the arena of operators active in importing and in-quota trading of beef and pork have been very limited.
5. In addition to this, the following considerations can be made: a. As mentioned above, the non-perfect competition characterising the structure of the Swiss market for the six products
studied has influenced rent distribution, with the retail and wholesale stages capturing the largest part of the rent. b. At the same time, the TRQ administration system almost certainly fosters more or less formalised alliances and
partnerships among the operators themselves, thus influencing the overall structure of the market.
Conclusion on proposed changes to improve efficacy and efficiency
In light of the answers provided under Q1 – Q3, which changes could be recommended in the existing TRQs system to improve its efficacy and efficiency?
Question 4 explicitly refers to potential changes in the existing TRQs system to improve its efficacy and efficiency; in this context, it is worth noting that while the study highlighted a general good level of efficacy of the system – albeit with some areas of concern – the assessment of the efficiency of the system revealed serious limits.
The modification of specific elements of the existing system (e.g. overall simplification of the system; possible reduction of out-of-quota tariffs; introduction of limits and/or obligations regarding trade of import quotas and their filling) would only bring minor improvements; if more substantial improvements of the system’s efficiency are to be reached, more profound changes should be considered.

Policy evaluation of Tariff Rate Quotas
14
1 Introduction: study context and objectives
1.1 Study context
Direct payments and border protection are the key instruments of support to the Swiss agricultural sector. The Swiss tariff schedule consists of specific tariffs. There are currently 28 Tariff Rate Quotas (TRQs) for imports of livestock, animal and vegetable products, possibly including sub-quotas (some TRQs are sub-allocated to specific products) and preferential quotas. Nearly all TRQs are filled. TRQs are administered in different manners (such as auctioning; requirements on domestic purchases; historical imports; first-come, first-served).
No comprehensive evaluation of the TRQ-system for Switzerland has been carried out before the present study. Considering the economic relevance of TRQs, it is of crucial importance to assess their efficacy and efficiency. For the present evaluation of the TRQs, specific representative products whose imports are governed by this system have been identified according to the following criteria:
1) economic relevance; 2) data availability; 3) representativeness of the TRQ administration method.
The evaluation focuses on TRQs for the following products:
• Meat: beef; pork; • Vegetable products: potatoes; tomatoes; apples; strawberries.
1.2 Policy framework for the application of TRQ-related provisions in Switzerland
Switzerland regulates the imports of most agricultural products which have a domestic production. The legitimation of the Swiss agricultural policy derives from art. 104 paragraph 1 of the Swiss Constitution, which states that the Confederation has to ensure that agriculture makes an essential contribution towards a secure provision of the population, the conservation of natural resources and the upkeep of the countryside, decentralized settlement, and that it does so in a sustainable and market-oriented way.
The base for the regulations with respect to the imports of agricultural products is given by legal texts on agriculture (Agriculture Act, Landwirtschaftsgesetz, LwG, SR 910.1) and on customs, such as the Customs Tariff Act (Zolltarifgesetz, ZTG; SR 632.10) – which however is not, strictly speaking, part of the agricultural legislation – as well as by ordinances on agricultural production such as the Ordinance on Imports of Agricultural Products (Agrareinfuhrverordnung, AEV; SR 916.01). In addition, there is a specific ordinance for vegetable products (Verordnung über die Ein- und Ausfuhr von Gemüse, Obst und Gartenbauerzeugnissen, VEAGOG; SR 916.121.10) and another one for animals for slaughter and meat (Schlachtviehverordnung, SV; SR 916.341). For TRQ releases, the intention of the legislator is to complement domestic production with imports only when this is needed to supply the domestic market (Art. 5 VEAGOG, Art. 16 Schlachtviehverordnung).
A general import permit (GIP) is needed to import many agricultural products. It is attributed upon written request to operators with Swiss domicile. These might be legal or natural persons. A GIP is valid for an unlimited period of time and is not transferable.
Border protection had been in place for several decades, also before Switzerland joined the World Trade Organization (WTO) in 1995. When joining the WTO, Switzerland transformed all of its border protection into duties and tariff rate quotas (TRQs). As a consequence, a number of quantitative import restrictions had to be converted. Import regulations were notified at the WTO for all products. In the case of TRQs, this notification consisted in a minimal or a current access quota as well as in the tariff levels for in-quota and out-of-quota imports. The related figures were defined in the annex to the Marrakech Protocol as part of the WTO Uruguay Round agreement; some modifications and rectifications were effective from 2002 on (see Certified True Copy WT/LET/465). For all the products considered in this study, notified tariffs have not been changed (see annexes 1 and 2 to the Customs Tariff Act SR 632.108). The notified tariffs represent the upper limit for the applied tariffs. The Ordinance on Imports of Agricultural Products (SR 916.01) defines applied tariffs which are lower than the notified ones9. For the products considered in this study, those tariffs are the same today as they were in 2002.
The definition of TRQ volumes made according to the criteria set out in the URAA in most cases basically reproduced the pre-existing market access possibilities (see also Conseil fédéral suisse (1994). Message relatif à l'approbation des accords du GATT/OMC (Cycle d'Uruguay) (Message 1 GATT) du 19 septembre 1994, FF 1994 IV 1). It was then possible to limit the economic impact of the legislative changes that were implemented. TRQs are usually filled or even overfilled (that is, additional imports are authorized at the in quota duty, in excess to the quota notified at the WTO).
8 These annexes are available on http://www.ezv.admin.ch/pdf_linker.php?doc=Generaltarif downloaded on 09/10/15. 9 Among the products covered by this study, this applies for example to the out-of-quota tariff in the case of full supply during the managed period for strawberries, apples and tomatoes, as well as for the in-quota tariff for apples.

Policy evaluation of Tariff Rate Quotas
15
1.3 Objectives of the study
The evaluation of TRQs is mainly based on the concept of intervention logic. Policy measures are based on explicit and implicit hypotheses concerning their functioning. The intervention logic is defined as a set of hypothetical causal relations that describe how a policy measure (intervention) is expected to attain its objectives.
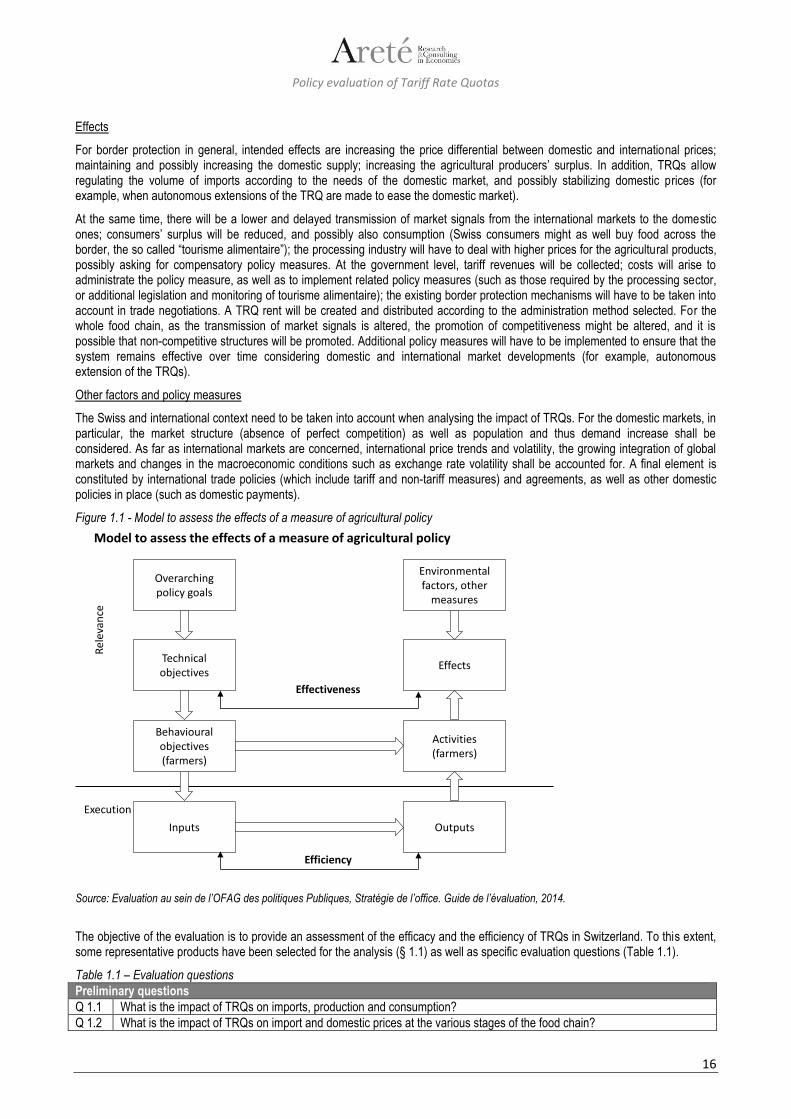
The intervention logic, by allowing to set the appropriate key questions, constitutes the basis for the evaluation. It encompasses the following elements (see Figure 1.1): overarching policy objectives (in Switzerland typically set out in the Constitution); technical objectives of the policy measure (identified based on the analysis of the legal texts and on economic considerations); behavioural objectives (i.e. changes in the behaviour of the economic agents that should be brought about by the measure); inputs and outputs of the administration of the policy measure; activities of the economic actors; effects (intended and unintended) of the policy measure; other relevant factors (such as the economic and environmental context).
These elements are described in detail below.
Overarching policy objectives
The overarching policy objectives of border protection for agriculture are set out in art. 104 of the Swiss Constitution: «La Confédération veille à ce que l'agriculture, par une production répondant à la fois aux exigences du développement durable et à celles du marché, contribue substantiellement: a. à la sécurité de l'approvisionnement de la population; b. à la conservation des ressources naturelles et à l'entretien du paysage rural; c. à l'occupation décentralisée du territoire. […]».
Technical objectives
In general, border protection aims are: to support domestic production by limiting imports to maintain a price differential between the domestic prices and the international ones; to contribute to agricultural producers’ surplus (income support); to contribute to ensuring stable conditions for agricultural production. Border protection mechanisms shall respect international (notably WTO) agreements.
In Switzerland, TRQs have mostly replaced, following the Uruguay Round Agreement on Agriculture (URAA), pre-existing quantitative restrictions on imports. TRQs allow managing the volume of imports in view of an adequate provision of domestic markets and stabilizing the framework conditions for domestic production. Since the opening of the quota can be regulated at the tariff line level, it is possible that only certain products can be imported within the TRQ (the quota can be opened only for specific tariff lines). Depending on domestic market conditions, it is possible to authorize imports at the in-quota tariff above the limits of the notified TRQ size at the WTO. The administration of TRQs shall ensure that the quota is allocated to private actors by ensuring competitiveness and transparency.
Behavioural objectives
Importers can first import within the TRQs and, if market conditions allow, over the TRQ (the out-of-quota duty is usually very high). Importers benefit from the lower in-quota duty only for those products for which the quota is opened. Importers shall compete to obtain the right to import at the in-quota duty. In respect to the pre-existing system of quantitative restrictions to imports, the whole food chain shall be more regularly confronted with market conditions. The price differential to the world market prices shall maintain / trigger a higher supply by domestic producers.
Inputs / Outputs
The administration of the TRQs requires financial and human resources (inputs) in order to grant import permits and to perform all necessary checks (outputs) on the imported volumes. These vary, amongst others, according to the complexity of the administration method.
Activities
Importers will first import within the TRQs and, if market conditions allow, over the TRQ (the out-of-quota duty is usually rather high). Depending on the administration method, rent-seeking behaviour will arise to obtain the TRQ-rent. Due to the price differential between domestic and international prices, domestic supply will tend to increase; on the other hand, consumption might be lower and / or consumers will have an incentive to buy food across the border (tourisme alimentaire). Also, the measures may motivate the food processing industry to ask for policy measures to compensate for the higher costs of domestic agricultural produce (as has happened in Switzerland, cf. the so called “Chocolate law”, which includes import duties and export subsidies for processed food products; the request for inward processing traffic; or the request of tariff reductions for specific uses of the product). Finally, the market structure of the whole agro food chain as well as its development over time might be affected, notably concerning the level of market concentration.
Policy evaluation of Tariff Rate Quotas
16
Effects
For border protection in general, intended effects are increasing the price differential between domestic and international prices; maintaining and possibly increasing the domestic supply; increasing the agricultural producers’ surplus. In addition, TRQs allow regulating the volume of imports according to the needs of the domestic market, and possibly stabilizing domestic prices (for example, when autonomous extensions of the TRQ are made to ease the domestic market).
At the same time, there will be a lower and delayed transmission of market signals from the international markets to the domestic ones; consumers’ surplus will be reduced, and possibly also consumption (Swiss consumers might as well buy food across the border, the so called “tourisme alimentaire”); the processing industry will have to deal with higher prices for the agricultural products, possibly asking for compensatory policy measures. At the government level, tariff revenues will be collected; costs will arise to administrate the policy measure, as well as to implement related policy measures (such as those required by the processing sector, or additional legislation and monitoring of tourisme alimentaire); the existing border protection mechanisms will have to be taken into account in trade negotiations. A TRQ rent will be created and distributed according to the administration method selected. For the whole food chain, as the transmission of market signals is altered, the promotion of competitiveness might be altered, and it is possible that non-competitive structures will be promoted. Additional policy measures will have to be implemented to ensure that the system remains effective over time considering domestic and international market developments (for example, autonomous extension of the TRQs).
Other factors and policy measures
The Swiss and international context need to be taken into account when analysing the impact of TRQs. For the domestic markets, in particular, the market structure (absence of perfect competition) as well as population and thus demand increase shall be considered. As far as international markets are concerned, international price trends and volatility, the growing integration of global markets and changes in the macroeconomic conditions such as exchange rate volatility shall be accounted for. A final element is constituted by international trade policies (which include tariff and non-tariff measures) and agreements, as well as other domestic policies in place (such as domestic payments).
Figure 1.1 - Model to assess the effects of a measure of agricultural policy
Source: Evaluation au sein de l’OFAG des politiques Publiques, Stratégie de l’office. Guide de l’évaluation, 2014.
The objective of the evaluation is to provide an assessment of the efficacy and the efficiency of TRQs in Switzerland. To this extent, some representative products have been selected for the analysis (§ 1.1) as well as specific evaluation questions (Table 1.1).
Table 1.1 – Evaluation questions
Model to assess the effects of a measure of agricultural policy
Overarching policy goals
Technical objectives
Environmental factors, other
measures
Effects
Behavioural objectives (farmers)
Activities (farmers)
Inputs Outputs
Rel
eva
nce
Effectiveness
Efficiency
Execution
Preliminary questions
Q 1.1 What is the impact of TRQs on imports, production and consumption?
Q 1.2 What is the impact of TRQs on import and domestic prices at the various stages of the food chain?
Policy evaluation of Tariff Rate Quotas
17
Questions on efficacy of TRQs
Q 2.1 What is the contribution to existing price differentials between domestic and world prices? Is this difference lower than the out-of-quota tariff?
Q 2.2 What is the contribution to stable domestic prices?
Q 2.3 What is the contribution to allow an adequate provision of domestic markets?
Question on efficiency of TRQs
Q 3.1 Which costs and benefits result for the various actors involved (economic welfare of producers, importers, processors, distributors, retailers, consumers, government), taking into account the relevant characteristics of world and domestic markets? In particular, what can be said about the impact on farmers vs the impact on the downstream industry? Which rents arise, and how are they distributed?
Q 3.2 Which is the impact of TRQs and of their administration method on the structure of imports (effect on the price and volume composition of shipments, structure of importers)?
Q 3.3 Does the Swiss market structure (not perfect competition) influence the distribution of costs, benefits, rents?
Q 3.4 What is the impact of TRQs on the development of the market structure of the food chain / on the vertical chain of production? Do they promote the formation of non-competitive market structures? To which extent?
Proposed changes
Q 4 In light of the answers provided under Q1 – Q3, which changes could be proposed in the existing TRQs system to improve its efficacy and efficiency?

Policy evaluation of Tariff Rate Quotas
18
2 The TRQ system in Switzerland
2.1 Overview of the meat sector TRQs
2.1.1 Products covered by the study
The study covers specific product groups, namely (see also List of Acronyms):
1. For beef: a. High Quality Beef / sirloin strips (HQB)10 b. Pistolas (hindquarters without flank and shank) of cows, for processing (Pistolas) c. Meat of cows for processing (MFP) d. Carcasses and half-carcasses of cows, for processing (CFP) e. Other preparations of beef meat, out of quota (Other beef)
2. For pork:
a. Half-carcasses of swine (HCS) b. Meat of swine (MoS)
2.1.2 Short overview of the genesis of the tool/ original policy goals
As mentioned, the introduction of the TRQ was a consequence of the WTO Uruguay round. In the previous period imports of beef, as those of agricultural products in general, were quantitatively restricted by quotas. The international obligations requested to implement a minimal in-quota market access per product group and the possibility of importing unlimited quantities at a higher out-of-quota tariff. These out-of-quota tariffs were set at an extremely high level for most products, ensuring that any imports beyond the quota would happen at a price not having the capacity of impacting the internal one. Import quota releases are regulated differently for specific products, i.e., for various pieces of meat and even within a single tariff line. In-quota imports are not always possible for all the products within a single tariff line, and some tariff lines never get releases: this implies that no in quota imports can be performed. For beef, Switzerland has a self-sufficiency ratio of more than 80%, with seasonal variations. In-quota imports are mainly prime cuts or fresh and chilled carcasses. For prime cuts, some out-of-quota imports are also registered: these can be profitable in spite of the high out-of-quota tariff due to the high value of such products. Meat preparations are as well imported out-of-quota, as well as minimally processed meat. In these cases, however, it is the much lower tariff of chapter 16 (preparations of meat) in respect to chapter 2 (meat) to make imports profitable11.
The policy goals of the TRQ for pork generally are the same as for beef. However, domestic production of pork nearly covers the totality of the market needs; the self-sufficiency ratio is over 90%. Import quota releases are limited to half-carcasses, to better meet the industry’s interests to cover a larger part of the value chain domestically. These releases mainly serve to stab ilize domestic supply and prices. As this global TRQ is shared with poultry meat, there is no difficulty to fill the quota (for the most part by poultry imports). Poultry production only covers about 50% of the domestic consumption. Out-of-quota imports of pork occur for prime cuts and for meat preparations, as for processed meat the tariff is much lower.
2.1.3 Key policy measures
2.1.3.1 Beef
Various kinds of meat are imported within TRQ n. 05 and, among them, imports of carcasses and half-carcasses of cows for processing are also made by the domestic industry to be processed domestically. This allows to cover a larger part of the value chain and to generate more value added domestically. It must also be mentioned that agricultural products can be imported for being re-exported after processing (inward processing, art. 12 customs law, SR. 631.0) without duty or with reimbursement of the duty. These volumes then do not remain on the domestic Swiss market. The quantity of meat imported for inward processing has been increasing in recent years; this mainly concerns air-dried meat, a Swiss traditional specialty.
In Figure 2.1 the relative importance (in volume) of in-quota imports of different meat categories within the whole TRQ n.05 are reported for the years 2006, 2010 and 2014. Other beef meat (the first area starting from the bottom) is the relevant product for the present evaluation. Other beef meat and edible offal correspond to sub-quota category 5.71.
10 Definition and certification requirements detailed in the Swiss Ordinance of 26 November 2003 on the meat stock and meat market (https://www.blw.admin.ch/blw/en/home/markt/einfuhr-von-agrarprodukten/fleisch-und-schlachttiere.html) 11 Since July 1st 2016, meat which is merely seasoned (not further prepared) must be imported in chapter 2 with much higher tariffs than those in chapter 16.

Policy evaluation of Tariff Rate Quotas
19
Figure 2.1 - Relative importance of other beef meat within TRQ No. 05 (2006, 2010 and 2014 volumes of in-quota imports)
The global TRQ No. 05 (“red meat”) includes beef, horsemeat, mutton and goat meat. Meat specialties such as air-dried meat (sub-quota No. 5.1, included in the preferential tariff quota no. 102 with the EU) and tinned beef (sub-quota No. 5.2), as well as kosher and halal meat (sub-quotas 5.3 to 5.6), are part of it. However, the largest part of the quota is grouped in sub-quota 5.7 (other meat).
Within this sub-quota, there are various further sub-groups, or “categories”. There is a distinction between other beef meat and offal (category 5.71) and bovine cuts for dried meat (category 5.72). Categories 5.73 to 5.76 do not concern beef. Category 5.77 includes processed beef and beef as an ingredient for soups or as raw material for animal feed only12.
Generally, for all products there is a distinction between fresh or chilled meat on one hand, and frozen meat on the other13. Generally speaking, within sub-quota 5.7, there are three main groups of products to be considered: other meat of bovine animals, edible offal and veal. Other meat of bovine animals is the only category analysed in this study. Edible offal – not analysed in the present study – has high relative importance as well, since the imported volumes are remarkable. For this product group, specific quotas are opened for beef tongues, veal liver, and ox-muzzles (classed among “other edible offal”). Veal has minor quantitative importance; its quota is not further specified. There is a distinction of tariffs for carcasses or half carcasses, other meat with bone in, and boneless meat. Veal, tongues and veal liver might also be kosher or halal (sub-quotas No. 5.3 and 5.5); in these cases, they are assigned a specific statistical key).
In comparison with other products covered by the study, “other meat of bovine animals” is the most complex product group relevant for this evaluation. Within this group, it is generally considered whether carcasses or half-carcasses, meat with bone in or boneless meat is imported. Further distinctions through 3-digit suffixes (“statistical keys”) are made to further identify sub-quota categories (for further details, see tables in the Annex):
Sirloin strips and High Quality Beef, in category 5.71.
Bovine cuts destined to production of dried meat, in category 5.72.
Since 2014, in order to improve the transparency of the system for reporting purposes, a distinction was introduced for carcasses, half-carcasses, forequarters and pistolas (hindquarters without flank and shank) with respect to the age of the animal. However, this distinction was in practice never used for the TRQ releases.
In the past there have been various changes in the specifications of the single quota allocations, according to what requested by the operators (FOAG releases import quotas on request of the meat sector association; see below in the text)14.
The typologies of beef comprised within sub-quota 5.7 are reported in Annex 7.1.1.
For animals for slaughter and meat mainly produced through the use of coarse fodder, Switzerland notified, under its WTO obligations, a quota based on a minimal market access of 22 500 tons (WTO, 1996; G/AG/N/CHE/4, 15 July 1996). Thereof, a minimum of 2 000 tons was notified for beef (WTO, 1995; G/AG/N/CHE/1, 13 December 1995), including a minimum of 1 200 tons of High Quality Beef. These quantities are still valid. Until 2008, there were special quantities allocated to the EU (200 tons net for air-dried beef); since 2008, there are no special allocations to supplying countries anymore.
12 See: Art. 14 Schlachtviehverordnung SR 916.341 13 See www.tares.ch 14 In 2004, import quotas were released for beef, without closer specification; from 2005 to 2009 such quotas were limited to meat for processing from cows
(i.e. not from steers or heifers). In 2009, 2011 and 2012, specific quotas were opened for pistolas of cows for processing. In 2006 and since 2008, there are quotas opened for carcasses and half carcasses of cows for processing.
29% 34%43%
1%2%
1%35%
31%22%
3% 1% 1%
26% 25% 30%
2% 1% 1%4% 5% 3%
2006 2010 2014
TRQ n. 05
livestock for slaughter
processed red meat
edible offal
veal meat
lamb, goat, horse meat
halal and kosher beef
other beef meat
Policy evaluation of Tariff Rate Quotas
20
The tariffs notified as part of the WTO agreement provide an upper limit to the applied tariffs, which for some beef products are lower than the notified tariffs (but remained unchanged within the timeframe considered in this study). Relevant tariffs for beef products here analysed are equal to CHF 159/100 kg gross (in quota tariff for deboned meat of other bovine animals), CHF 2,212/100 kg gross (out-of-quota fresh or chilled) and CHF 2,057/100 kg gross (out-of-quota frozen); the complete set of tariffs is reported in Annex 7.1.1.
Since April 2007, there is a reduced out-of-quota tariff for beef pieces for the production of air-dried meat. There are lower in-quota and out-of-quota tariffs for specific country groups15.
Import quotas are released by the FOAG according to market needs (Art. 16. Schlachtviehverordnung, SV; SR 916.341). As these needs are assessed by the market players, the FOAG releases import quotas on request of Proviande, the meat sector association including producers, processors, traders, retailers and importers. Consumers are represented in the executive board with an advisory vote only.
The normal duration of import periods for beef types covered by this study is four weeks; however, the FOAG can define shorter or longer periods. There is no overlapping of periods, and no period exceeds the end of the calendar year.
In cases of force majeure which cause problems with logistics, a prolongation of the import period can be requested to the FOAG (Art. 16 paragraph 6 SV, SR 916.341). Since January 2012, there is also a possibility to request a transfer of a part of quota shares to the subsequent import period within the same calendar year, in case they are purchased by auction and already paid for (Art. 16a). However, this part must be at least 500 kg gross but at most 5% of quota share. All requests must be received by the FOAG before the end of the import period. Until today, this possibility has never been used.
Two operators who are both entitled to get quota shares may agree that the quantity imported by one of them is credited to the quota share attributed to the other one (Art. 14 Abs. 1 AEV; SR 916.01). Those agreements must be reported to the FOAG. The operators which are originally not entitled to get a quota can also receive a quota transfer. Usually, imports occur via large import organizations that get the right to use the quotas even before they are assigned.
2.1.3.2 Pork
TRQ No. 06 is shared between pork and poultry (Art. 15 SV; SR 916.341). Sub-quotas 06.1 to 06.3 (dried and tinned ham, sausages) are not covered by this study. The related typologies of fresh, chilled or frozen pork are carcasses or half-carcasses, hams, shoulders and cuts thereof, with bone in and other cuts; the complete list is reported in Annex 7.1.2. Sub-quota No. 06.4 is subdivided into three categories: 06.41 for pork meat and 06.42 for poultry meat and offal, 06.43 preparations for pork and poultry as a primary matter for soups and sauces. Sub-quota category no. 06.41 is the one covered by this study and is opened for half-carcasses only. Sub-quota category no. 06.43 is always open.
The minimum TRQ quota for pork and poultry is 54 482 tons per year. Most of it is actually used for poultry imports (see Figure 2.2). Within sub-quota No. 06.4, there is an indicative quantity of 8 498 tons for pork. As a rule, quotas are released to stabilize domestic pork prices. The minimum quantity to be released for TRQ No. 06.4 as a whole is usually exceeded, due to the quotas for poultry.
In Figure 2.2 the relative importance (in volume) of in-quota imports of different meat categories within the whole TRQ n.06 are reported for the years 2006, 2010 and 2014. Pork half carcasses is the relevant product for the present evaluation.
15 For example, the regular tariff for deboned meat of other bovine animals is 159 CHF per 100 kg gross, but for EFTA countries and the Southern African Customs Union it is 103 CHF, and for GSP developing countries, Chili, Colombia, Japan, the Republic of Korea, Peru and Ukraine it is 150 CHF. Imports from least developed countries including Lesotho are not subject to tariffs, neither for in-quota nor for out-of-quota imports. The country-specific tariffs for each product are indicated in www.tares.ch
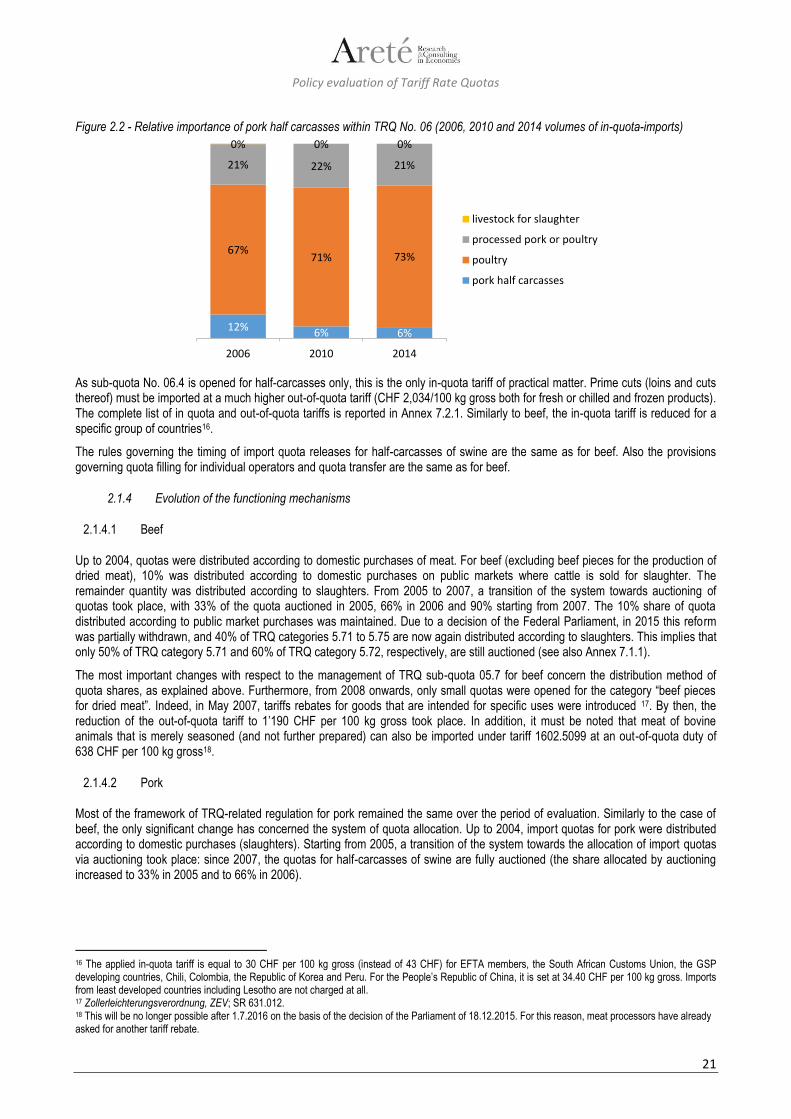
Policy evaluation of Tariff Rate Quotas
21
Figure 2.2 - Relative importance of pork half carcasses within TRQ No. 06 (2006, 2010 and 2014 volumes of in-quota-imports)
As sub-quota No. 06.4 is opened for half-carcasses only, this is the only in-quota tariff of practical matter. Prime cuts (loins and cuts thereof) must be imported at a much higher out-of-quota tariff (CHF 2,034/100 kg gross both for fresh or chilled and frozen products). The complete list of in quota and out-of-quota tariffs is reported in Annex 7.2.1. Similarly to beef, the in-quota tariff is reduced for a specific group of countries16.
The rules governing the timing of import quota releases for half-carcasses of swine are the same as for beef. Also the provisions governing quota filling for individual operators and quota transfer are the same as for beef.
2.1.4 Evolution of the functioning mechanisms
2.1.4.1 Beef
Up to 2004, quotas were distributed according to domestic purchases of meat. For beef (excluding beef pieces for the production of dried meat), 10% was distributed according to domestic purchases on public markets where cattle is sold for slaughter. The remainder quantity was distributed according to slaughters. From 2005 to 2007, a transition of the system towards auctioning of quotas took place, with 33% of the quota auctioned in 2005, 66% in 2006 and 90% starting from 2007. The 10% share of quota distributed according to public market purchases was maintained. Due to a decision of the Federal Parliament, in 2015 this reform was partially withdrawn, and 40% of TRQ categories 5.71 to 5.75 are now again distributed according to slaughters. This implies that only 50% of TRQ category 5.71 and 60% of TRQ category 5.72, respectively, are still auctioned (see also Annex 7.1.1).
The most important changes with respect to the management of TRQ sub-quota 05.7 for beef concern the distribution method of quota shares, as explained above. Furthermore, from 2008 onwards, only small quotas were opened for the category “beef pieces for dried meat”. Indeed, in May 2007, tariffs rebates for goods that are intended for specific uses were introduced 17. By then, the reduction of the out-of-quota tariff to 1’190 CHF per 100 kg gross took place. In addition, it must be noted that meat of bovine animals that is merely seasoned (and not further prepared) can also be imported under tariff 1602.5099 at an out-of-quota duty of 638 CHF per 100 kg gross18.
2.1.4.2 Pork
Most of the framework of TRQ-related regulation for pork remained the same over the period of evaluation. Similarly to the case of beef, the only significant change has concerned the system of quota allocation. Up to 2004, import quotas for pork were distributed according to domestic purchases (slaughters). Starting from 2005, a transition of the system towards the allocation of import quotas via auctioning took place: since 2007, the quotas for half-carcasses of swine are fully auctioned (the share allocated by auctioning increased to 33% in 2005 and to 66% in 2006).
16 The applied in-quota tariff is equal to 30 CHF per 100 kg gross (instead of 43 CHF) for EFTA members, the South African Customs Union, the GSP developing countries, Chili, Colombia, the Republic of Korea and Peru. For the People’s Republic of China, it is set at 34.40 CHF per 100 kg gross. Imports from least developed countries including Lesotho are not charged at all. 17 Zollerleichterungsverordnung, ZEV; SR 631.012. 18 This will be no longer possible after 1.7.2016 on the basis of the decision of the Parliament of 18.12.2015. For this reason, meat processors have already asked for another tariff rebate.
12% 6% 6%
67%71% 73%
21% 22% 21%
0% 0% 0%
2006 2010 2014
TRQ n. 06
livestock for slaughter
processed pork or poultry
poultry
pork half carcasses

Policy evaluation of Tariff Rate Quotas
22
2.2 Overview of vegetables sector TRQs
2.2.1 Products covered by the study
The study covers specific product groups (see also List of Acronyms):
Potatoes, namely: 1. “Table potatoes”.
Fruit & vegetables, namely: 1. “Round tomatoes” (this includes both “beef” tomatoes and “other” tomatoes, which were covered by separate
allocations of import quotas through the import quota release system up to 2006). 2. “Apples”. 3. “Strawberries”.
2.2.2 Short overview of the genesis of the tool/ original policy goals
The seasonal nature of domestic production of the fruit and vegetable products covered by the study (potatoes, tomatoes, apples, strawberries) has implications on the rationale of the related policy measures, which are basically aimed at managing imports in the months when domestic production is placed on the market, and at allowing adequate supply when domestic production is unavailable (this also includes stock depletion in the case of potatoes and apples, which are storable products).
The methods and timing of TRQ administration are hence tailored to the duration of the domestic production period and to the storage possibilities of each product. For fresh vegetables and fruits, there is a distinction between a so called managed period and a non-managed period. During the period when the imports of a product are not managed, no out-of-quota tariff is applied.
With respect to production and storage possibilities, potatoes are comparable with apples. Imports of ware potatoes are needed when the Swiss harvest is late or when quality isn't good enough. Usually, the stocks last until the beginning of the subsequent campaign, and therefore only early potatoes are imported in most years. The number of quota releases is usually small; every year there is at least one release to assure market access for a base quantity of table potatoes according to the GATT-Agreement. This quantity is the same every year. Additional releases may be needed according to variations in domestic yields, or when the quality of the indigenous production does not meet local market requirements.
For tomatoes, the main period of domestic production – and thus the managed period for the TRQ – lasts nearly six months. However, usually the out-of-quota tariff is applied for a four-month period only. Otherwise, the management of the TRQ for tomatoes resembles the one for strawberries in many respects.
For apples, Switzerland has a large domestic supply, with surpluses on the domestic demand. Nevertheless, there are import needs due to seasonal variations and quality reasons, as well as to ensure availability of various apples varieties on the domestic market. As a consequence, the regulation of imports via TRQs is based on a two-phase system, as for other fresh fruit and vegetables. The storage of apples can last for a long time, but storage possibilities depend very much on the specific variety. The “out of season period”, when the TRQ for apples is not managed, only lasts for one month each year (from June 15th to July 14th). It can be extended in case of important shortages in stored apples or – more frequently – when the start of the Swiss harvest falls later than the 15th of July: in that case, the FOAG usually prolongs the non-managed period and does not distribute import quotas, which means that all imports can be made at the in-quota tariff.
The production period of most domestic strawberries is only three and a half months long; this is the period when their TRQ is managed. Outside this period, imports at the in-quota tariff are not limited. Within the managed period, the regulation is very close to the time-specific needs. Quota openings can take place twice a week, and the decisions are based on consumption data of the previous year and current information on production.
2.2.3 Key policy measures
2.2.3.1 Potatoes
Different tariff lines are defined according to the potatoes’ use: seed potatoes (0701.1010/90), potatoes for processing (0701.9010/91/99, statistical key 911) and other potatoes (table potatoes, 0701.9010/91/99, statistical key 912; see also Annex 7.1.3). Only table potatoes are of interest for this study. No varieties or types are distinguished; the only differentiation is with respect to packaging: potatoes in bulk, sacks or open containers have a different tariff number than other types of packaging for out-of-quota imports.
For potatoes and potato products, a quota of 22 250 tons (TRQ No. 14; see Figure 2.3) was notified to the WTO. The first sub-quota, for fresh potatoes, amounts to 18 250 tons; it is used for seed potatoes (2 500 tons) as well as for potatoes for industrial use (9 250
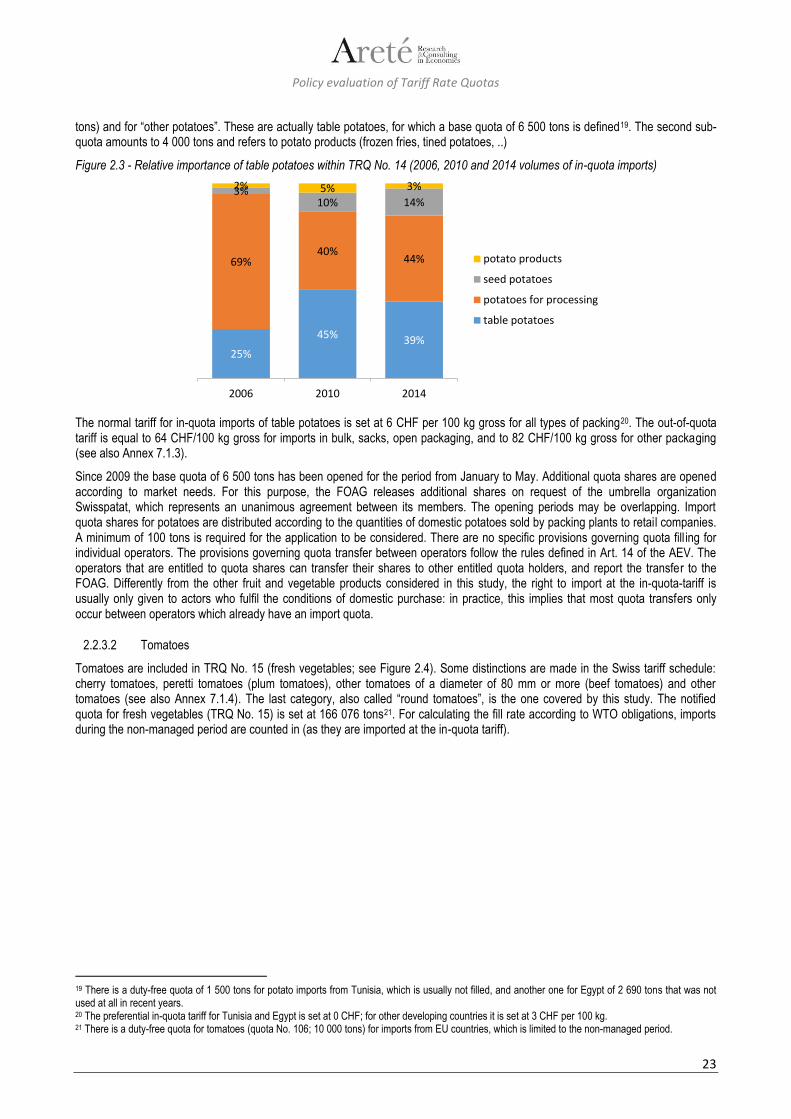
Policy evaluation of Tariff Rate Quotas
23
tons) and for “other potatoes”. These are actually table potatoes, for which a base quota of 6 500 tons is defined19. The second sub-quota amounts to 4 000 tons and refers to potato products (frozen fries, tined potatoes, ..)
Figure 2.3 - Relative importance of table potatoes within TRQ No. 14 (2006, 2010 and 2014 volumes of in-quota imports)
The normal tariff for in-quota imports of table potatoes is set at 6 CHF per 100 kg gross for all types of packing20. The out-of-quota tariff is equal to 64 CHF/100 kg gross for imports in bulk, sacks, open packaging, and to 82 CHF/100 kg gross for other packaging (see also Annex 7.1.3).
Since 2009 the base quota of 6 500 tons has been opened for the period from January to May. Additional quota shares are opened according to market needs. For this purpose, the FOAG releases additional shares on request of the umbrella organization Swisspatat, which represents an unanimous agreement between its members. The opening periods may be overlapping. Import quota shares for potatoes are distributed according to the quantities of domestic potatoes sold by packing plants to retail companies. A minimum of 100 tons is required for the application to be considered. There are no specific provisions governing quota fill ing for individual operators. The provisions governing quota transfer between operators follow the rules defined in Art. 14 of the AEV. The operators that are entitled to quota shares can transfer their shares to other entitled quota holders, and report the transfer to the FOAG. Differently from the other fruit and vegetable products considered in this study, the right to import at the in-quota-tariff is usually only given to actors who fulfil the conditions of domestic purchase: in practice, this implies that most quota transfers only occur between operators which already have an import quota.
2.2.3.2 Tomatoes
Tomatoes are included in TRQ No. 15 (fresh vegetables; see Figure 2.4). Some distinctions are made in the Swiss tariff schedule: cherry tomatoes, peretti tomatoes (plum tomatoes), other tomatoes of a diameter of 80 mm or more (beef tomatoes) and other tomatoes (see also Annex 7.1.4). The last category, also called “round tomatoes”, is the one covered by this study. The notified quota for fresh vegetables (TRQ No. 15) is set at 166 076 tons21. For calculating the fill rate according to WTO obligations, imports during the non-managed period are counted in (as they are imported at the in-quota tariff).
19 There is a duty-free quota of 1 500 tons for potato imports from Tunisia, which is usually not filled, and another one for Egypt of 2 690 tons that was not used at all in recent years. 20 The preferential in-quota tariff for Tunisia and Egypt is set at 0 CHF; for other developing countries it is set at 3 CHF per 100 kg. 21 There is a duty-free quota for tomatoes (quota No. 106; 10 000 tons) for imports from EU countries, which is limited to the non-managed period.
25%
45% 39%
69%40%
44%
3%10% 14%
2% 5% 3%
2006 2010 2014
TRQ n. 14
potato products
seed potatoes
potatoes for processing
table potatoes
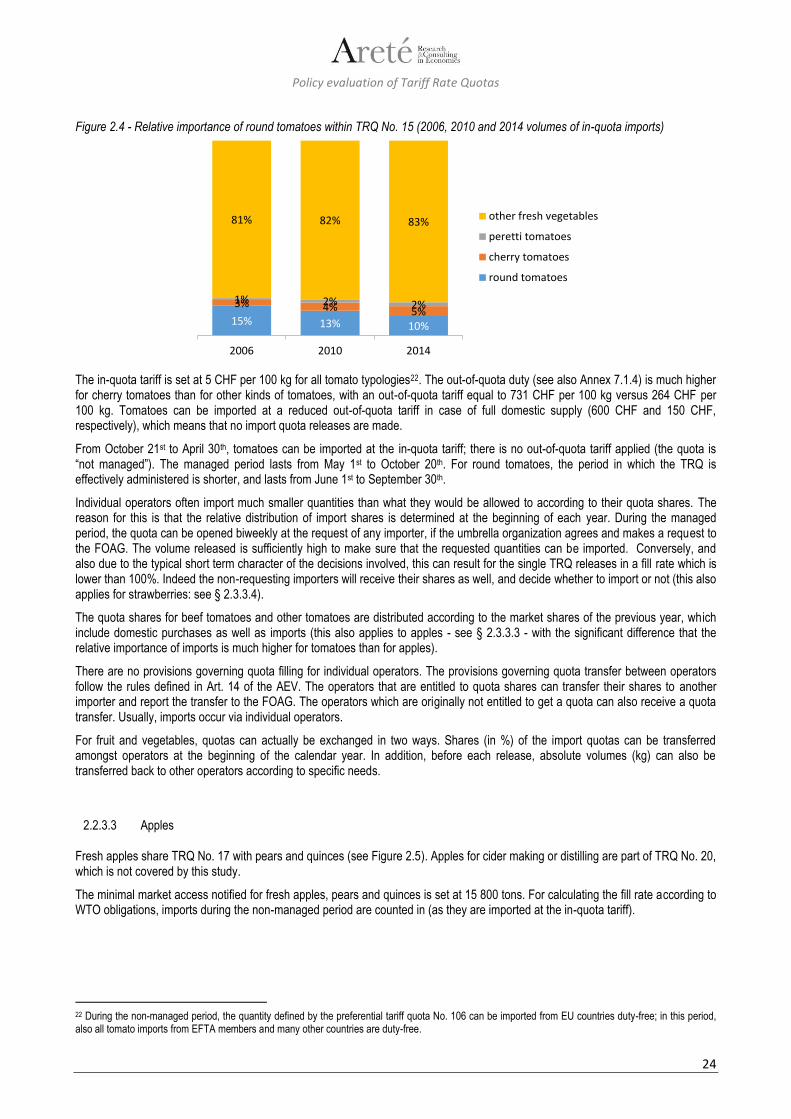
Policy evaluation of Tariff Rate Quotas
24
Figure 2.4 - Relative importance of round tomatoes within TRQ No. 15 (2006, 2010 and 2014 volumes of in-quota imports)
The in-quota tariff is set at 5 CHF per 100 kg for all tomato typologies22. The out-of-quota duty (see also Annex 7.1.4) is much higher for cherry tomatoes than for other kinds of tomatoes, with an out-of-quota tariff equal to 731 CHF per 100 kg versus 264 CHF per 100 kg. Tomatoes can be imported at a reduced out-of-quota tariff in case of full domestic supply (600 CHF and 150 CHF, respectively), which means that no import quota releases are made.
From October 21st to April 30th, tomatoes can be imported at the in-quota tariff; there is no out-of-quota tariff applied (the quota is “not managed”). The managed period lasts from May 1st to October 20th. For round tomatoes, the period in which the TRQ is effectively administered is shorter, and lasts from June 1st to September 30th.
Individual operators often import much smaller quantities than what they would be allowed to according to their quota shares. The reason for this is that the relative distribution of import shares is determined at the beginning of each year. During the managed period, the quota can be opened biweekly at the request of any importer, if the umbrella organization agrees and makes a request to the FOAG. The volume released is sufficiently high to make sure that the requested quantities can be imported. Conversely, and also due to the typical short term character of the decisions involved, this can result for the single TRQ releases in a fill rate which is lower than 100%. Indeed the non-requesting importers will receive their shares as well, and decide whether to import or not (this also applies for strawberries: see § 2.3.3.4).
The quota shares for beef tomatoes and other tomatoes are distributed according to the market shares of the previous year, which include domestic purchases as well as imports (this also applies to apples - see § 2.3.3.3 - with the significant difference that the relative importance of imports is much higher for tomatoes than for apples).
There are no provisions governing quota filling for individual operators. The provisions governing quota transfer between operators follow the rules defined in Art. 14 of the AEV. The operators that are entitled to quota shares can transfer their shares to another importer and report the transfer to the FOAG. The operators which are originally not entitled to get a quota can also receive a quota transfer. Usually, imports occur via individual operators.
For fruit and vegetables, quotas can actually be exchanged in two ways. Shares (in %) of the import quotas can be transferred amongst operators at the beginning of the calendar year. In addition, before each release, absolute volumes (kg) can also be transferred back to other operators according to specific needs.
2.2.3.3 Apples
Fresh apples share TRQ No. 17 with pears and quinces (see Figure 2.5). Apples for cider making or distilling are part of TRQ No. 20, which is not covered by this study.
The minimal market access notified for fresh apples, pears and quinces is set at 15 800 tons. For calculating the fill rate according to WTO obligations, imports during the non-managed period are counted in (as they are imported at the in-quota tariff).
22 During the non-managed period, the quantity defined by the preferential tariff quota No. 106 can be imported from EU countries duty-free; in this period, also all tomato imports from EFTA members and many other countries are duty-free.
15% 13% 10%
3% 4% 5%1% 2% 2%
81% 82% 83%
2006 2010 2014
TRQ n. 15
other fresh vegetables
peretti tomatoes
cherry tomatoes
round tomatoes
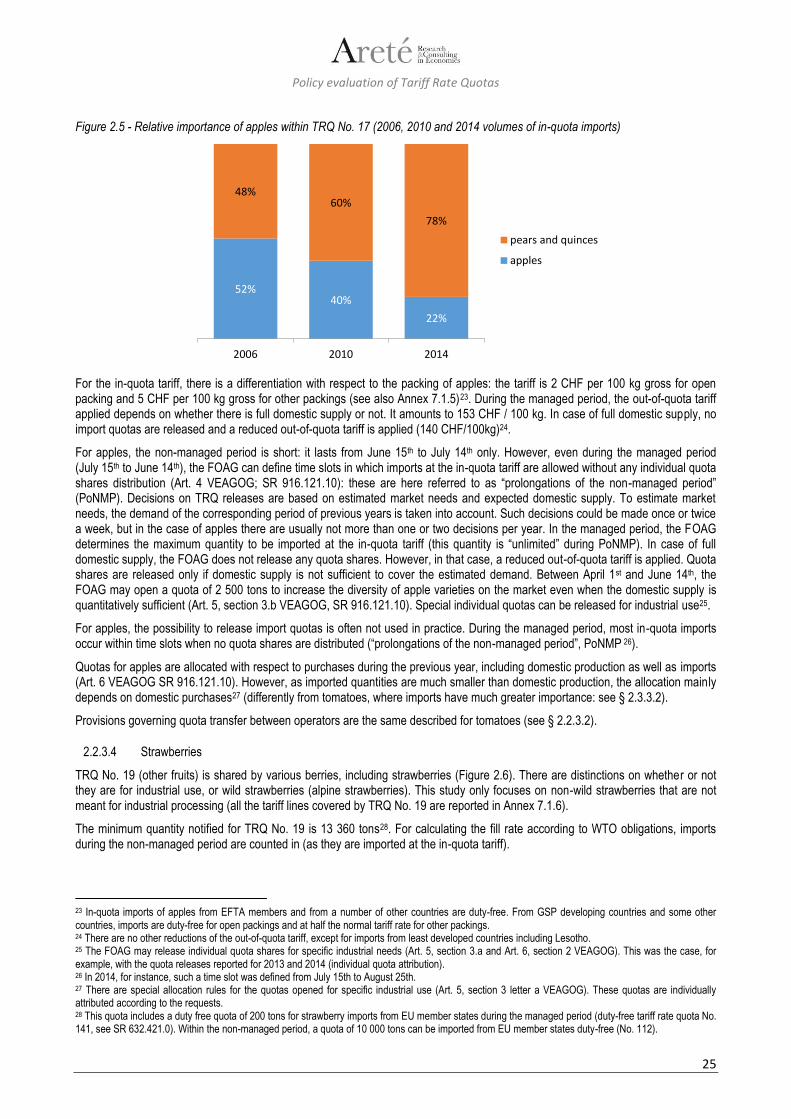
Policy evaluation of Tariff Rate Quotas
25
Figure 2.5 - Relative importance of apples within TRQ No. 17 (2006, 2010 and 2014 volumes of in-quota imports)
For the in-quota tariff, there is a differentiation with respect to the packing of apples: the tariff is 2 CHF per 100 kg gross for open packing and 5 CHF per 100 kg gross for other packings (see also Annex 7.1.5)23. During the managed period, the out-of-quota tariff applied depends on whether there is full domestic supply or not. It amounts to 153 CHF / 100 kg. In case of full domestic supply, no import quotas are released and a reduced out-of-quota tariff is applied (140 CHF/100kg)24.
For apples, the non-managed period is short: it lasts from June 15th to July 14th only. However, even during the managed period (July 15th to June 14th), the FOAG can define time slots in which imports at the in-quota tariff are allowed without any individual quota shares distribution (Art. 4 VEAGOG; SR 916.121.10): these are here referred to as “prolongations of the non-managed period” (PoNMP). Decisions on TRQ releases are based on estimated market needs and expected domestic supply. To estimate market needs, the demand of the corresponding period of previous years is taken into account. Such decisions could be made once or twice a week, but in the case of apples there are usually not more than one or two decisions per year. In the managed period, the FOAG determines the maximum quantity to be imported at the in-quota tariff (this quantity is “unlimited” during PoNMP). In case of full domestic supply, the FOAG does not release any quota shares. However, in that case, a reduced out-of-quota tariff is applied. Quota shares are released only if domestic supply is not sufficient to cover the estimated demand. Between April 1st and June 14th, the FOAG may open a quota of 2 500 tons to increase the diversity of apple varieties on the market even when the domestic supply is quantitatively sufficient (Art. 5, section 3.b VEAGOG, SR 916.121.10). Special individual quotas can be released for industrial use25.
For apples, the possibility to release import quotas is often not used in practice. During the managed period, most in-quota imports occur within time slots when no quota shares are distributed (“prolongations of the non-managed period”, PoNMP 26).
Quotas for apples are allocated with respect to purchases during the previous year, including domestic production as well as imports (Art. 6 VEAGOG SR 916.121.10). However, as imported quantities are much smaller than domestic production, the allocation mainly depends on domestic purchases27 (differently from tomatoes, where imports have much greater importance: see § 2.3.3.2).
Provisions governing quota transfer between operators are the same described for tomatoes (see § 2.2.3.2).
2.2.3.4 Strawberries
TRQ No. 19 (other fruits) is shared by various berries, including strawberries (Figure 2.6). There are distinctions on whether or not they are for industrial use, or wild strawberries (alpine strawberries). This study only focuses on non-wild strawberries that are not meant for industrial processing (all the tariff lines covered by TRQ No. 19 are reported in Annex 7.1.6).
The minimum quantity notified for TRQ No. 19 is 13 360 tons28. For calculating the fill rate according to WTO obligations, imports during the non-managed period are counted in (as they are imported at the in-quota tariff).
23 In-quota imports of apples from EFTA members and from a number of other countries are duty-free. From GSP developing countries and some other countries, imports are duty-free for open packings and at half the normal tariff rate for other packings. 24 There are no other reductions of the out-of-quota tariff, except for imports from least developed countries including Lesotho. 25 The FOAG may release individual quota shares for specific industrial needs (Art. 5, section 3.a and Art. 6, section 2 VEAGOG). This was the case, for example, with the quota releases reported for 2013 and 2014 (individual quota attribution). 26 In 2014, for instance, such a time slot was defined from July 15th to August 25th. 27 There are special allocation rules for the quotas opened for specific industrial use (Art. 5, section 3 letter a VEAGOG). These quotas are individually attributed according to the requests. 28 This quota includes a duty free quota of 200 tons for strawberry imports from EU member states during the managed period (duty-free tariff rate quota No. 141, see SR 632.421.0). Within the non-managed period, a quota of 10 000 tons can be imported from EU member states duty-free (No. 112).
52%40%
22%
48%60%
78%
2006 2010 2014
TRQ n. 17
pears and quinces
apples

Policy evaluation of Tariff Rate Quotas
26
Figure 2.6 - Relative importance of strawberries within TRQ No. 19 (2006, 2010 and 2014 volumes of in-quota imports)
The in quota tariff during the non-managed period is set at 3 CHF per 100 kg gross29. For out-of-quota imports, the normal tariff is 510 CHF per 100 kg gross. In case there is full supply from domestic sources, a reduced tariff of 450 CHF per 100 kg gross is applied30.
No quantitative restrictions exist for the period from September 1st to May 14th; the managed period lasts from May 15th to August 31st. Similarly to apples, time slots within the managed period may be defined where imports at the in-quota tariff are not limited (PoNMP )31. As the FOAG decides once or twice a week on quota openings, the periods are sometimes overlapping but end always at the same day.
For strawberries, the quota shares are distributed in proportion to the import shares of the previous year. There are no specific provisions governing quota filling for individual operators. Individual operators often don’t import or import only much smaller quantities than what they would be allowed to according to their quota shares. The reason for this is that the relative distribution of import shares is determined at the beginning of each year. During the managed period, the quota can be opened biweekly at the request of importers, if the umbrella organization agrees and makes a demand to the FOAG. The opened volume can be higher than what is needed to supply the market, to make sure that the requested quantities can be imported. The non-requesting importers will receive their shares as well, and decide whether to import or not. They would also have the possibility to give their share to another importer for use (Art. 14 AEV). Provisions governing quota transfer between operators are the same described for tomatoes (see § 2.2.3.2).
2.2.4 Evolution of the functioning mechanisms
2.2.4.1 Potatoes
The framework of TRQ-related regulations for table potato imports remained the same over the years covered by the evaluation.
2.2.4.2 Tomatoes
With respect to the administration of the TRQ for fresh tomatoes, some changes took place over the period of evaluation; in particular, the previously separate allocation systems of import quotas for beef tomatoes and other round tomatoes have been combined in a single allocation system from 2007 onwards32.
2.2.4.3 Apples
For TRQ No. 17, the policy framework remained unchanged over the period of evaluation. However, it allows a large range of adaptation to each year’s requirements, which first of all depend on domestic apple yields.
29 For EFTA member countries and for several other countries (including the GSP developing countries), the tariff is set at 0 CHF in both cases. 30 No exemptions concerning the out-of-quota tariff are made other than those for imports from least developed countries including Lesotho. 31 In 2014, such a time slot was defined from June 15th to 16th. From May 28th to July 1st and from August 13th to 19th, there was full supply from domestic sources; strawberry imports were only possible at a reduced out-of-quota tariff. For the rest of time, quota shares were opened for periods with various lengths. 32 As for product typologies falling outside the scope of this study, since 2007 a time slot for in-quota imports of sugo pelati without quantitative restriction has also been introduced; this was mainly done to facilitate administration, as before that, individual requests for this use were generally allowed.
95% 92%85%
5% 8%15%
2006 2010 2014
TRQ n. 19
other berries
strawberries
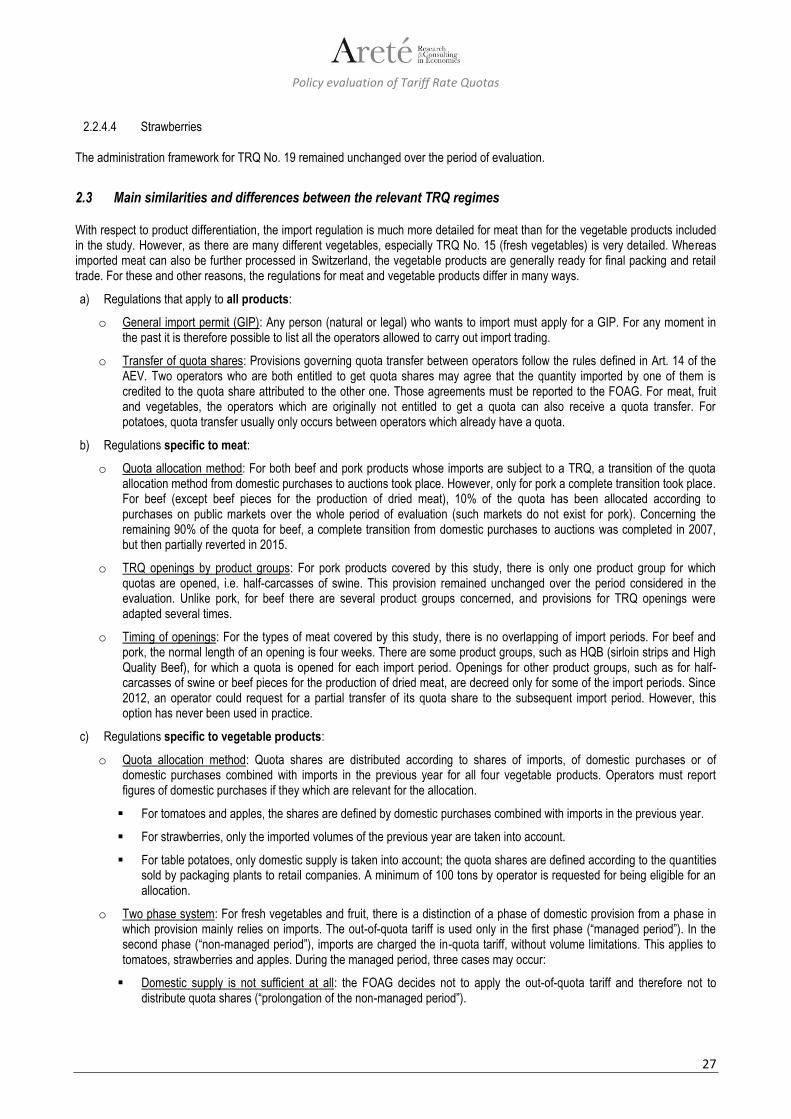
Policy evaluation of Tariff Rate Quotas
27
2.2.4.4 Strawberries
The administration framework for TRQ No. 19 remained unchanged over the period of evaluation.
2.3 Main similarities and differences between the relevant TRQ regimes
With respect to product differentiation, the import regulation is much more detailed for meat than for the vegetable products included in the study. However, as there are many different vegetables, especially TRQ No. 15 (fresh vegetables) is very detailed. Whereas imported meat can also be further processed in Switzerland, the vegetable products are generally ready for final packing and retail trade. For these and other reasons, the regulations for meat and vegetable products differ in many ways.
a) Regulations that apply to all products:
o General import permit (GIP): Any person (natural or legal) who wants to import must apply for a GIP. For any moment in the past it is therefore possible to list all the operators allowed to carry out import trading.
o Transfer of quota shares: Provisions governing quota transfer between operators follow the rules defined in Art. 14 of the AEV. Two operators who are both entitled to get quota shares may agree that the quantity imported by one of them is credited to the quota share attributed to the other one. Those agreements must be reported to the FOAG. For meat, fruit and vegetables, the operators which are originally not entitled to get a quota can also receive a quota transfer. For potatoes, quota transfer usually only occurs between operators which already have a quota.
b) Regulations specific to meat:
o Quota allocation method: For both beef and pork products whose imports are subject to a TRQ, a transition of the quota allocation method from domestic purchases to auctions took place. However, only for pork a complete transition took place. For beef (except beef pieces for the production of dried meat), 10% of the quota has been allocated according to purchases on public markets over the whole period of evaluation (such markets do not exist for pork). Concerning the remaining 90% of the quota for beef, a complete transition from domestic purchases to auctions was completed in 2007, but then partially reverted in 2015.
o TRQ openings by product groups: For pork products covered by this study, there is only one product group for which quotas are opened, i.e. half-carcasses of swine. This provision remained unchanged over the period considered in the evaluation. Unlike pork, for beef there are several product groups concerned, and provisions for TRQ openings were adapted several times.
o Timing of openings: For the types of meat covered by this study, there is no overlapping of import periods. For beef and pork, the normal length of an opening is four weeks. There are some product groups, such as HQB (sirloin strips and High Quality Beef), for which a quota is opened for each import period. Openings for other product groups, such as for half-carcasses of swine or beef pieces for the production of dried meat, are decreed only for some of the import periods. Since 2012, an operator could request for a partial transfer of its quota share to the subsequent import period. However, this option has never been used in practice.
c) Regulations specific to vegetable products:
o Quota allocation method: Quota shares are distributed according to shares of imports, of domestic purchases or of domestic purchases combined with imports in the previous year for all four vegetable products. Operators must report figures of domestic purchases if they which are relevant for the allocation.
For tomatoes and apples, the shares are defined by domestic purchases combined with imports in the previous year.
For strawberries, only the imported volumes of the previous year are taken into account.
For table potatoes, only domestic supply is taken into account; the quota shares are defined according to the quantities sold by packaging plants to retail companies. A minimum of 100 tons by operator is requested for being eligible for an allocation.
o Two phase system: For fresh vegetables and fruit, there is a distinction of a phase of domestic provision from a phase in which provision mainly relies on imports. The out-of-quota tariff is used only in the first phase (“managed period”). In the second phase (“non-managed period”), imports are charged the in-quota tariff, without volume limitations. This applies to tomatoes, strawberries and apples. During the managed period, three cases may occur:
Domestic supply is not sufficient at all: the FOAG decides not to apply the out-of-quota tariff and therefore not to distribute quota shares (“prolongation of the non-managed period”).
Policy evaluation of Tariff Rate Quotas
28
Domestic production provides full supply: no import quotas are released and any imports are charged the out-of-quota tariff, which in that case is reduced.
Domestic production is only partially sufficient: the FOAG releases a quota for a specific time slot, and distributes the quota shares. Imports beyond distributed quota shares are charged the full out-of-quota tariff.
o For table potatoes, in-quota imports are possible only when import quotas are released during the specific period (January-May); no in-quota imports are normally allowed from July to December.
o Timing of quota releases: For all four vegetable products, overlapping time slots of quota releases may occur. When a release is decreed, its volume, beginning and end are fixed. As potatoes are storable, there is no need for short-term decisions to change the opened in-quota volume. For fresh vegetables and fruit, decisions to increase the in-quota quantity may be taken twice a week.
o Special regulation for industrial needs: For fresh vegetables and fruit, there is a possibility to assign individual quota shares upon request from operators who have special needs for processing. Such assignments occurred for apples and tomatoes (sugo pelati); for the second case, since 2007 a special time slot is opened for unrestricted in-quota imports. For potatoes, there is a special tariff quota for potatoes for industry. Strawberries for processing are not part of the tariff quota system (no GIP needed nor imports are counted as in-quota imports).

Policy evaluation of Tariff Rate Quotas
29
3 Study methodology
3.1 Overall approach
Quantitative analysis and econometric methods are used - within the limits given by the availability of suitable datasets – for an empirical assessment of the influence of TRQs on a number of aspects which are especially relevant for providing an answer to evaluation questions 1.1, 1.2, 2.1, 2.2, 2.3 and 3.1.
In the study methodology, quantitative descriptive analysis and econometric methods are complemented by qualitative approaches, in order to add depth and detail to the explanation of the observed phenomena. Qualitative approaches are used as a “backup assessment method”, when it emerges that some datasets lack the features required for the application of the proposed econometric methods.
Quantitative analyses for the purposes of the assessment (i.e. for replying to each evaluation question) have been carried out in the framework of an approach based on the following key steps:
1. Study of the intervention logic of TRQs and of the related administration systems. 2. Theoretical analysis of the functioning mechanisms of TRQs. 3. Definition of adequate sets of criteria, indicators and (where applicable) benchmarks for the purposes of quantitative
analysis. The definition of indicators is aimed at reducing the complexity of the several available time series without a relevant loss of information. A number of quantitative indicators (see Annex 7.2.5) were identified in order to synthesize the information on product-specific supply/demand conditions (policy indicators), on price gaps between the different levels of the supply chain and between domestic and foreign prices (price indicators), on the structure of imports (concentration indexes), etc.
4. Processing of raw data to obtain datasets which are suitable for the application of the foreseen methodology, and which properly take into account the numerous specificities concerning the application of TRQs in Switzerland.
5. Illustration of the evolution of relevant variables / indicators over the period considered for the assessment (2000-2014), through series of graphical representations.
6. Preliminary appraisal through visual inspection of graphical representations, in order to identify – if present – evident long-run patterns and correlations that link together supply/demand variables, prices and policy-related variables, and that should be further investigated through the analysis of the statistical properties of time series and through econometric analysis, wherever this is appropriate and feasible.
7. Analysis of the statistical properties of the relevant time series, through a battery of econometric tests aimed at detecting: the presence and nature of auto-correlation; presence of unit roots (non-stationarity); presence of ARCH effects (indicating variation in price volatility); presence of seasonality (where present, seasonality needs to be properly taken into account); presence of structural breaks (for a visual/qualitative association with policy changes, i.e. variation of quotas and/or tariff levels).
8. Wherever the features of the available datasets allow their application, econometric estimations are performed in order to assess the influence of policy variables with respect to supply/demand variables, to the relationships between the external and the domestic prices and between prices along the supply chain. The isolation of the domestic market is assessed by looking for a long-run relationship linking the external and the domestic prices through vector autoregressive (VAR) models (in the levels or in the first differences). These relationships are estimated by explicitly including policy variables in the model, either as exogenous or endogenous regressors.
Qualitative analysis was centred on the critical factor analysis and applied in the wider context of the system approach (see description in Box 3). Within the context of qualitative analysis, also a series of in-depth interviews with relevant experts were performed to get additional information on single product market’s functioning as well as on other relevant themes for the study. Table 3.1 reports the categories of interviewed experts; the complete list of questions is reported in Annex (§ 7.9).
Table 3.1 – Summary of performed interviews Category
1 Potato sector expert
2 Strawberry sector expert
3 Tomato sector expert
4 Swiss TRQ expert
5 Swiss TRQ expert // meat sector expert
Other popular approaches in policy evaluation focus on the assessment of treatment effects, either through “difference-in-differences” designs or through “Regression discontinuity” designs (see Annex 7.2.1). Both approaches rely on the definition of a net distinction between pre- and post-treatment and of a level of treatment through an exogenous binary variable. Most of all, they imply the definition of a clear outcome variable onto which treatment effects should be measured. However, the nature of the phenomena
Policy evaluation of Tariff Rate Quotas
30
that are assessed in the present study makes these approaches unsuitable: the policy variable should be allowed to be an endogenous variable and to cause a series of multiple effects on several outcome variables. For this reason, the whole econometric analysis is based on VAR models, highlighting whenever relevant the endogenous nature of the critical variables.
The following boxes provide some key theoretical elements of the methodology which are relevant for multiple evaluation questions; a more detailed description of the different methods as well as all the question-specific elements (tools; criteria, related indicators and benchmarks) are illustrated through a series of tables in Annex 7.2. A detailed description of the methods for preliminary questions is reported in Annex 7.2.2., for questions on efficacy in Annex 7.2.3 and for question on efficiency in Annex 7.2.4.
Box 1 – Econometric models and equations
The econometric analyses performed for the purposes of the assessment are based on two different models:
1. Model 1 / “Policy Model”
2. Model 2 / “Price Transmission Model”
Both models are based on VAR and are relevant for question 1.1 (Model 1) and for questions 1.2, 2.1 and 2.2 (Model 2).
a. The VAR model33 is the starting specification; preliminary tests (in particular, unit root tests) confirmed that no alternative specifications (first-difference VAR models; vector error correction, VEC models34) were needed.
b. Usual criteria (AIC) were followed to select the optimal lags within the VAR models. Nonetheless, in order to maximize the consistency between the two models and facilitate the interpretation of results, the aim was to find a lag order that was the same or very close in the two cases. In the identification of this lag order - especially for vegetable products - particular attention was paid to include the seasonal effects as indicated by the preliminary tests on individual series.
c. Model 1 is referred to as “Policy Model” as it aims at identifying the causal chain linking the domestic market (production and consumer prices) with the change in import volumes and the respective policy regime (in-quota imports). This causal chain is different across different products (in particular, between vegetable and animal products). These causal relationships cannot be easily and directly derived from estimated parameters, but can still be formally tested in the form of Granger causality tests35.
d. In Model 1, the vector of deterministic components also includes exogenous stochastic variables. Among these, the external (foreign) price was included as a further driver of the domestic consumer price. Alternatively, the import unit value was included in the model to take into account the changing composition of imports as a consequence of the policy itself. In this case, however, such variable had to be included among the endogenous variables (thus the VAR has an additional equation).
e. Model 2 is referred to as “Price transmission model” as it aims at assessing the price transmission elasticity across markets. For this reason, the logarithms of prices are used in order to directly interpret the estimated parameters in terms of transmission elasticity. A perfect transmission of price shocks across markets implies an elasticity close to 1; on the opposite, the further the elasticity deviates from 1, the lower the transmission of price shocks.
f. For simplicity, model 2 combines both horizontal (from external to domestic markets) and vertical (i.e. across the supply chain) price transmission. Data availability and specific conditions on a certain commodity market implied the inclusion of the foreign/external wholesale and consumer prices as exogenous variables within the model.
g. Besides price transmission elasticity, model 2 estimation also allows assessing the sequence of movements of price shocks. Again, Granger causality tests has been used in this respect, as well as the identification of the underlying structural VAR (SVAR) model.
h. The policy variable enters model 2 as an endogenous or exogenous variable according to the results emerging from model 1 estimation. For this reason, and also to better answer questions about the impact of the TRQ policy, for any product under investigation the two models are estimated in sequence (model 1 first and then model 2).
i. Asymmetries in vertical price transmission are assessed through the estimation of regime switching VAR in which, besides the regressors that are included in model 2, a regressor which only accounts for positive variations of prices is included. This allows testing the presence and the direction of asymmetries in vertical price transmission36.
33 VAR (Vector Auto Regression) Model, is an econometric model used to capture the linear interdependencies among multiple time series. VAR models generalize the univariate autoregressive model (AR model) by allowing for more than one evolving variable. 34 VEC Models are preferred to VEC models whenever the considered time series are non-stationary and cointegrated. 35 The Granger causality test is used to verify which of the considered time series anticipates the others and, therefore, can be considered to cause the others. It is a statistical concept of causality that is based on prediction. According to Granger causality, if a signal X1 "Granger-causes" (or "G-causes") a signal X2, then past values of X1 should contain information that helps predict X2 above and beyond the information contained in past values of X2 alone. 36 The research of asymmetries in vertical price transmission in the Swiss beef supply chain was already performed in a previous study (El Benni, N., Finger, R., Hediger, W., Transmission of beef and veal prices in different marketing channels, 2014) but there no evidence of asymmetry was found. It is worth noting that two important differences between the present analysis and the one carried out in El Benni et al., 2014 are: a) The “Einstandspreis” – used in Benni et al– should not be intended as a producer price (for example for considerations on price transmission along the food chain). The present study uses
Policy evaluation of Tariff Rate Quotas
31
Box 2 – Price transmission analysis
The analysis of price transmission is especially relevant for questions 1.2, 2.1 and 3.1., as it allows to detect the presence of asymmetries and to investigate on the underlying factors - which can include imperfect competition and market power.
The main types of price transmission mechanisms are the following:
1. Vertical (input market to output market): it takes place along the supply chains - see below – and concerns the way in which an input cost is transmitted into the output price.
2. Horizontal (origin market to destination market): it takes place between spatially separated markets, and concerns the way in which the price of a product is transmitted across space.
3. Indirect (product market vs. technically related product markets): it concerns the way in which the price of a product is transmitted to substitute/complementary products.
Under perfect market competition assumptions, any price shock in a market should be perfectly transmitted to the related markets, given the costs of the technical processes that allow for vertical and horizontal product transfer. In this case, price trends would reveal similar patterns and substantial symmetries in the two markets, although at different price levels. On the contrary, the presence of asymmetries would reveal some kind of market imperfection, which could derive - among others - from imbalances in market power of actors.
Price transmission is usually analysed according to the following relevant dimensions:
a. magnitude or intensity (the extent to which a price variation in a market is transmitted to another market); b. speed (how fast a price variation in a market is transmitted to another market); c. nature (the sign, positive or negative, of price variation to be transmitted); d. direction (from which market to which market the variation is transmitted).
Quantitative methods are usually applied in the study of price transmission.
To assess horizontal price transmission (HPT: questions 2.1 and 2.2) and vertical price transmission (VPT: questions 1.2 and 3.1) VAR or cointegration models (VEC) are estimated. To take into account the presence of market power along the food chain, however, asymmetric price transmission could be allowed by introducing a dummy variable into the model in order to distinguish between two regimes (regime switching VAR). The assessment of asymmetries in vertical price transmission is done by including in the price transmission model a regressor that only measures the different intensity and direction of the price transmission from one level of the supply chain to the others when positive vs. negative price variations occur.
It is important to underline that when time series of data for different types / varieties / grades of the same product are available, the econometric analysis is not applied to each of these series, but only to the series for the type / variety / grade which was considered prevalent / most representative, as agreed with the FOAG.
Box 3 – Supply chain analysis and critical factors analysis
The supply chain analysis constitutes an extremely important element of the methodology for answering questions 1.2 and 3.1 (in combination with the analysis of price transmission: see Box 2), as well as to questions 3.2, 3.3 and 3.4.
The supply chain analysis combines qualitative and quantitative methods and tools, in the framework of the so called “system approach” (which considers all the individual elements of a study object as a single, integrated entity, i.e. a “system”). The analysis focuses on the three key dimensions which characterise a supply chain:
1. Its structure, defined by the number of stages (farming, first and second processing, distribution) and by the number, type and size of actors which operate at each stage.
2. Its organisation, defined by the linkages between the actors (direct or indirect control, cooperation/coordination, etc.) and by their geographical distribution.
3. Its functioning mechanisms, i.e. the tools, which allow and regulate the interaction between actors (regulations, agreements, contracts etc.). In the context of the evaluation, it is important to consider that the administration methods of TRQs can constitute a barrier to entry for certain types of operators in the international trading of the concerned products.
A qualitative method often used in the framework of the system approach is the critical factors analysis, which allows a qualitative investigation on the factors exerting an influence on the functioning of a certain system (or on specific aspects of it), which can be an agribusiness supply chain. All the factors, which are able to exert a positive or negative influence in this respect are identified as critical factors. Critical factors can facilitate (promoting factors) or hinder (limiting factors) the functioning of the system (or of specific elements of
producer price data instead; b) El Benni et al., 2014 focuses on the relation between price received by butchers/importers and prices paid by butchers/importers if they use the whole of the TRQ rent they get to pay farmers. The latter is a very strong assumption and is precisely at the core of the themes covered by the present study.
Policy evaluation of Tariff Rate Quotas
32
the same). In the evaluation, the critical factors analysis was applied whenever the available evidence base did not allow for a quantitative assessment of the relative importance of each variable in explaining an observed phenomenon.
Box 4 – Approach to the study of the supply chain structure and of the conduct of operators
The main challenge in the study of the supply chain structure and of the conduct of operators is investigating the linkages which cause separate entities with different weights in the negotiations according to their economic power to act in a coordinated way. In practical terms, this entails the construction of “clusters” of operators in the supply chain which can be assumed to act as a single operator, by virtue of the linkages between them. These linkages can be of vertical nature (between operators at different levels of the supply chain) and of horizontal nature (between operators at the same level of the supply chain). The issue is of particular relevance for the assessment of the concentration of import flows – as separate import quotas are allocated to distinct entities which may however act in a coordinated way - and of the overall market for each of the products under study, as well as for the study of the conduct of operators with reference to management of import flows and competition at the different levels of the supply chain.
A preliminary investigation on the Swiss agro-food system, where two large-scale retailers hold substantial shares of the domestic food market and control a wide range of other operators at different levels of the supply chains, suggested to adopt a top-down approach in the construction of “clusters” of operators. All the operators under direct control of each of these leading large-scale retailers, which have been allocated import quotas for the relevant products at least once in the observed period, were identified and assigned to the respective “cluster”. To the extent allowed by the available information, each “cluster” was further expanded by adding the operators which are under indirect control of each leading large-scale retailer (this happens when their subsidiaries exert control over other operators).
In the study of concentration, the estimation of the aggregated share of import flows/quotas controlled by the two above “clusters” allowed to assess the extent of the aggregated share controlled by their competitors: if the latter remained substantial, the investigation on possible linkages between operators was further extended also to those outside the two above “clusters”, in order to identify other possible “clusters” which can have a significant economic importance. The study of the conduct of operators in the supply chain was also focused mainly on the leading “clusters” identified through the study of concentration.
Extremely detailed quanti-qualitative information on actual import flows and on the administration of TRQs is available from official sources (FOAG) for any individual entity to which import quotas can be allocated. Such information, when combined with qualitative information on linkages between operators - sourced via desk research (annual reports of the leading operators; company websites; articles in specialised press; public and proprietary databases) and through interviews to knowledgeable subjects (mainly researchers and consultants) – allowed to perform a wide range of analyses which were relevant for answering questions 3.1, 3.2, 3.3 and 3.4.
3.2 Methodology for the evaluation of the efficiency of TRQs
Question 3.1 focuses on the costs and benefits resulting from TRQs for the various actors involved (economic welfare37 of producers, importers, processors, distributors, retailers, consumers, government) and on the possible formation and distribution of rents among those actors. The term “rent” is used in its broadest meaning, i.e. as “surplus” in a standard “welfare analysis” fashion. In a nutshell, higher domestic prices resulting from TRQs will bring a negative variation of the surplus of consumers and a positive variation of the surplus of producers, while the Government will benefit from tariff revenues. The so called “quota rent”38 will be allocated to different actors depending on the TRQ administration method.
The size of the overall rent is function of a number of elements: produced, consumed and imported volumes as well as producer, consumer and import prices. In this context, due to a series of limitations (see further in the text), the present study does not provide an estimation of the overall rent on the basis of the above elements. On the contrary, the analyses concentrate on how the rent is distributed among the different actors operating at various stages of the food chain, mainly through in-depth investigations of the relationships among the different prices and their evolution over time.
The methodology for replying to question 3.1 is determined, to a significant extent, by the methodology, the results and the limitations of the assessment carried out for questions 1.1 and 1.2, inasmuch these provide essential elements for answering question 3.1:
1. Nature and extent of the impact of TRQs (and of the related administration mechanisms) on import volumes of the products considered in the evaluation (question 1.1);
37 Economic welfare can be defined as the overall level of financial satisfaction and prosperity experienced by participants in an economic system; in this context economic welfare is function of a plurality of factors (distance from a theoretical perfect market, prices paid at all the levels of the supply chain and by consumers, levels of concentration in the market, information asymmetries, etc.). Generally speaking, TRQs reduce overall welfare influencing competition and through the creation of rents. 38 Difference between the domestic price and the world price with the in-quota tariff, multiplied by the volume of in quota imports (see for example Skully, 2001).

Policy evaluation of Tariff Rate Quotas
33
2. Nature and extent of the impact of TRQs (and of the related administration mechanisms) on prices at all levels of the supply chains of the products considered in the evaluation, and in particular on any impacts on vertical price transmission (question 1.2).
The overall approach for replying to question 3.1 was centred on the concept of “potential rent”. This concept refers to the overall rent which is present on the domestic market since TRQs are in place, in a standard “welfare analysis” fashion (see above; negative surplus for consumers; positive surplus for producers; positive surplus for the Government and the actors to which the TRQ is allocated). In this framework, the losses for consumers are found to be higher than the benefits accruing to producers and to the governmental budget. The use of the term “potential rent” wants to stress the unavailability of datasets which allow an adequate representation (i.e. through continuous time series of data with a monthly frequency, as the assessment of the aspects at question 1.1 and 1.2 is based on datasets with such features) of the costs incurred by the actors involved in the supply chain, and of their development over time. It remains safe that any available quantitative or qualitative element concerning the costs incurred by any typology of actors in the chain has anyway been considered in replying to question 3.1. We will henceforth focus on the distribution of the “potential rent” along the supply chain, which is defined by a combination of elements:
1. Difference between Swiss domestic and foreign prices due to the presence of TRQs. The higher such difference, the greater the potential rent.
2. Extent of the difference between price levels at the various stages of the supply chain (e.g. retail price vs. import price). The higher such difference, the greater the part of the overall potential rent that the specific stage of the supply chain is able to capture.
3. Features of vertical price transmission (VPT) between different stages of the supply chain. The more imperfect VPT is, the less uniform is the distribution of the potential rent.
4. Structure and concentration at the different stages of the supply chain. A concentrated structure in one or more stages of the supply chain, together with the presence of operators in a clear position of dominance over competitors and over vertically linked operators at the various stages of the supply chain, reinforce the potential for capturing a greater share of any rent which is created in the concerned stages of the supply chain.
The above potential rent can be attributed to the TRQs under study inasmuch the elements at point 1 and 2 above derive from the presence and functioning of such TRQs, as assessed at questions 1.1, 1.2 and 2.1.
The elements at point 2, 3 and 4 are likely to have been determined by factors that are related to the nature, functioning and evolution of the concerned supply chains, rather than by TRQs per se: however, TRQs and their administration may have contributed to reinforce concentration levels in certain stages of the chain and/or the dominant position of specific actors. Although concentration depends on many other factors than TRQs, the specific nature of the administration process (a self-regulated, coordinated and consensus-based process) is likely to incentive more or less formalised alliances and partnerships among the operators. The influence of TRQs on the structure of the concerned supply chain and on the distribution of costs, benefits, rents is investigated under questions 3.2, 3.3 and 3.4: a number of elements from the replies to these questions are hence relevant for replying to question 3.1, and vice versa.
In particular, the following elements - which can be characterised quanti-qualitatively - are relevant in this respect:
1. Vertical position in the supply chain of importers which have access to TRQs, vis-à-vis the other actors in the chain. 2. Structure of the supply chain, with special respect to linkages of vertical integration or coordination between actors (and
especially between importers which have access to TRQs and the other actors in the chain). 3. Turnover in the arena of importers which have access to TRQs, with special respect to importers in leading positions.
As already noted, TRQ administration mechanisms can have an influence on the aspects at point 1 to 3 above. First of all, as explained above, various actors can benefit from the “quota rent” according to the administration method chosen. This rent wi ll notably accrue to the Government, if the quota is administered through auctions, or to market operators, if other administration methods are used. In addition, the existing literature39;40 points out that if imports are severely hampered, downstream levels of the supply chain also benefit from protection, which, in turn, may hinder competition. In the Swiss context, the high concentration levels to downstream agriculture and limited access to import quota shares (also due to previous allocation criteria based on domestic purchases) explain why also competition for import quotas is far from being perfect: imperfect competition not only generates quota rents, but also additional margins to the detriment of consumers and producers. For what concerns import quota allocation methods based on auctions, Joerin’s study concludes that the revenue from an auction does not constitute an additional burden to the trade; importers are willing to pay for a quota since they can apply higher prices in the destination country due to the limitation of the imported quantity. A quota auctioning does not raise the prices of imported goods, it only transfers to the state the rent previously perceived by market players.
In conclusion, the combination of all the above elements has been taken into account for replying to question 3.1, i.e. to:
39 Message of 23 July 2002 on the future development of agricultural policy (Politique agricole 2007), FF 2002 4401 ss ch. 2.2.4, reporting the conclusions of Joerin’s study of June 2000 (see following note). 40 R. Joerin, The regulation of market access (Die Regelung des Marktzutritts), Eidgenoessische Technische Hochschule Zurich, 2000.
Policy evaluation of Tariff Rate Quotas
34
1. Quantify the total “surplus” deriving from the TRQ and their administration for the products under study. 2. Identify the stage(s) of the supply chain which are able to retain the most important shares of such “surplus”, in the light of
all the elements considered in the assessment. 3. To the extent allowed by the availability of the needed quantitative elements, attempt a quantification of the shares of such
“surplus” retained by each stage of the supply chain, and/or by specific dominant actors in the chain.
A series of limitations prevented from the quantification of rent / total surplus deriving from TRQs, the most important one being the above mentioned unavailability of frequent and continuous time series of data on the costs incurred by the actors involved in the supply chain; other serious limitations refer to the difficulty in elaborating detailed reliable estimates on traded volumes (and relative prices) for the different products in a scenario with no border protection. Despite these difficulties, different studies and articles have provided general indications on the order of magnitude of the rent: OECD41 estimated the gain of producer surplus in approximately CHF 1.01 billion, while – due to efficiency losses associated to border protection measures – the total cost for Swiss consumers is estimated around CHF 1.7 billion42. The Swiss price monitor43 provides a higher indication of the extra-cost for Swiss consumers as between CHF 2 and 3 billion.
The key elements of the operational methodology for answering to question 3.1 are detailed in Annex 7.2.4.1.
3.3 Main horizontal and product specific indicators
In order to provide a synthesis of the information conveyed by the great amount of data that were made available to the study team by FOAG, a number of sets of indicators were selected: these are synthetically described in the following paragraph.
A comprehensive description of the datasets used is reported in Annex 7.2.5, while a complete description of the limitations of the study is provided in Annex 7.2.6.
As a brief summary of the main horizontal issues encountered in the carrying out of the analysis, the unavailability (or the very limited availability) of data on demand for the different products44, as well as the limited usefulness of data on stocks for products like potatoes and apples45, resulted in the necessity to base most of the analysis on production, price and policy data only.
As a second relevant limitation, the availability of some external prices only for shorter timespans with respect to the period covered by the analysis (Jan 2000 – Dec 2014) resulted in a limited usefulness of these prices for comparisons on longer periods.
Finally, the availability of only “reference” domestic producer and wholesale prices for most of fruit and vegetable products was duly taken into account in the interpretation of analysis; lack of data for actual market prices paid to Swiss producers is in fact only partially circumvented by the use of reference prices, if the assumption is made that they do not differ too much from the real prices which are paid. Indeed, the fact that prices paid for real market transactions are not collected is a severe limitation for a full assessment of the impact of this policy at the various levels of the food chain, and namely for producers.
3.3.1 Policy indicators
- Quota fill rate (%): ratio between the actual in-quota imports and the actual allocated import quota for each release (Import/Zuteilung eff., as reported in the Kontingentsübersicht datasets).
- In-quota import / total imports (%): this indicator provides a measure of the share of total imports that is satisfied by in-quota imports. For tomatoes, apples and strawberries, in-quota imports refer to those occurring in the managed period. It was agreed with FOAG that imports occurring in the “prolongation of the non-managed period” (PoNMP) were represented separately and were not considered as in-quota imports.
- Policy intensity: a policy indicator whose value changes according to the different relevant import regimes, more specifically:
o it is equal to the in-quota import / total imports % ratio in the managed period when import quota releases are made;
o it is equal to 1 (one) in the managed period when no import quota releases are made (“full domestic supply” for fruit and vegetables; maximum policy intensity: only imports at the out-of-quota tariffs are possible);
41 OECD Review of Agricultural Policies for Switzerland, 2015. 42 The total cost of supporting producers is of around CHF 1.49 billion, taking into consideration the increase in consumer surplus, the decline in payments linked to current output or input and the loss of tariff revenue. 43 Newsletter 04/16, www.preisueberwacher.admin.ch/pue/it/home/documentazione/informazioni-ai-media/newsletter/2016.html 44 Some issues include the fact that data on demand were only available for shorter timeframe with respect to period analysed in the study (2000-2014) and only on an annual basis; or that they are calculated taking into account only some distribution channels. 45 For potatoes, the main limitation was due to the impossibility to distinguish between stocks of table potatoes for direct consumption and stocks for processing. Being the present study only focused on the first category, the use of stock data would have been misleading. For apples, the main limitation was due to the unavailability of stock data during the months of campaign (i.e. when the stock movements mostly influence the stocks for the rest of the year), resulting in an incomplete picture for the purposes of the assessment.
Policy evaluation of Tariff Rate Quotas
35
o it is equal to 0 (zero) in the non-managed period and in the PoNMP (minimum policy intensity: unlimited imports at the in-quota tariff are possible).
The policy intensity indicator has been developed in order to properly consider the different situations which result from the administration of the TRQs under study. Note that, for the meat products and for potatoes, a higher policy intensity corresponds to a situation in which more imports are allowed (if there are no quota releases, the very high out-of-quota duty applies), while for fruit and vegetable a higher policy intensity corresponds to a more severe limitation of imports (if there are no quota releases, the TRQ is not administered).
For beef, an additional specific policy indicator was developed to take into account the different size of import quota releases: in this case the indicator is equal to 1 in case of quota releases equal or higher than 400 tons, and equal to 0 in case of smaller releases.
A complete description of policy indicators is reported in Annex 7.2.5.1.
3.3.2 Price indicators
A complete description of price series and price indicators is reported in Annex 7.2.5.2.
3.4 Applied methodology for the reply to evaluation questions
3.4.1 Question 1.1: impact on domestic markets
What is the impact of TRQs on imports, production and consumption?
The reply to this question is based on the use of a combination of methods. Impacts on consumption were not analysed due to the above mentioned limits in the data on demand (limited timeframe and frequency).
Visual inspection of graphical representations of time series of the relevant variables was systematically performed as a preliminary step for all products.
A descriptive analysis through appropriate tests on the means of the relevant variables (total imports and domestic production) under different policy regimes (when import quota releases are made and when the import quota releases are not made: for tomatoes, apples and strawberries the latter condition also applies in the non-managed period and in the PoNMP) was then performed. This kind of analysis did not seek to make any inference on the causal relationships between the variables; rather it provided evidence on the significance of the differences of the means under the different policy regimes from a statistical point of view.
For the products - beef, pork - for which it is not possible to distinguish systematically between periods with and without import quota releases, a different and product-specific approach was adopted.
For beef, the assessment was conducted by making a distinction between the pre-2007 and post-2007 periods, in order to assess the effects of the change in the quota allocation system (introduction of auctioning). Since all variables were found to be characterized by a trend (see Annex 7.3.3), the testing procedure was applied to de-trended time series. In addition, an analysis on smaller vs. larger quota releases was conducted.
For pork, a distinction between pre-2009 and post-2009 periods was used, because starting from that year the administration of the policy was much stricter (i.e. import quota releases have been less frequent). Since all variables were found to be characterized by a trend, the testing procedure was applied to de-trended time series (see Annex 7.4.3). In addition, the analysis was also conducted only with reference to the period from 2009 onwards, by distinguishing between periods with and without import quota releases. The series considered for this analysis were not de-trended.
The statistical tests used for this assessment were the parametric Welch Two Sample t-test and the non-parametric Wilcoxon rank sum test with continuity correction, where the latter requires no assumptions on the normality of the data distribution. When the two tests suggested the same evidence, no test on the normality of the data was conducted. Differently, whenever the tests did not provide the same evidence, the results of the more appropriate test were considered, on the basis of the results of the test on the normality of the data.
Finally, inference based on the results of an econometric model (“policy model”) that linked the policy intensity and the market variables was applied, in order to assess the role of the policy in this respect.
3.4.2 Question 1.2: impact on domestic prices
What is the impact of TRQs on import and domestic prices at the various stages of the food chain?
Policy evaluation of Tariff Rate Quotas
36
Visual inspection of graphical representations was performed for a preliminary appraisal of the relevant time series.
A descriptive analysis through appropriate tests on the means of the relevant variables (domestic consumer price, domestic wholesale price, domestic producer price, import unit value) under different import regimes (periods with and without import quota releases: for tomatoes, apples and strawberries the latter condition also applies in the non-managed period and in the PoNMP) was then carried out. This kind of analysis did not seek to make any inference on the causal relationships between the variables; it rather provided evidence on the significance of the differences of the means under the different import regimes from a statistical point of view.
For the products - beef and pork - for which no systematic distinction between periods with and without import quota releases applies, a different and product-specific approach was adopted.
For beef, the assessment was again conducted by making a distinction between the pre-2007 and post-2007 periods (to consider the switch to partial auctioning). Since all variables were found to be characterized by a trend (see Annex 7.3.3), the testing procedure was applied to de-trended time series. In addition, an analysis on smaller vs. larger quota releases was conducted.
For pork, the distinction between the pre-2009 and post-2009 periods was again used to assess the possible effects of the stricter import regulation applied from 2009 onwards. Since all variables were found to be characterized by a trend (see Annex 7.4.3), the testing procedure was conducted on de-trended time series. In addition, the analysis was also conducted only with reference to the period from 2009 onwards, by distinguishing between periods with and without import quota releases.
The statistical tests used for this assessment were the parametric Welch Two Sample t-test and the non-parametric Wilcoxon rank sum test with continuity correction, where the latter requires no assumptions on the normality of the data distribution (see above in the text).
The final step in the assessment was based on inference from the results of econometric models (“price transmission model”) that linked the different prices and some other market variables in order to assess the price transmission along the supply chain; in the context of question 1.2 also the presence of asymmetric price transmission was assessed for beef and pork trough specific additional econometric models.
For fruit and vegetable products – where the limited series of data did not allow the use of price transmission model – the analysis was based on visual inspection of price series at the different stages of the supply chain and on the evolution of the relative gaps.
3.4.3 Question 2.1: impact on domestic – world price differentials
What is the contribution to existing price differentials between domestic and world prices? Is this difference lower than the out-of-quota tariff?
Also in this case, the visual inspection of graphical representations of the relevant variables constituted a preliminary step in the assessment. This was followed by a descriptive analysis through appropriate tests on the means of the relevant variables (gap between foreign price and domestic prices) under the different policy regimes (periods with/without import quota releases: for tomatoes, apples and strawberries the latter condition also applied in the non-managed period and in the PoNMP). This kind of analysis did not seek to make any inference on the causal relationships between the variables; it rather provided evidence on the significance of the differences of the means under the different policy regimes from a statistical point of view.
The main challenge for the assessment is the non-availability of proper “world prices” for the products covered by the evaluation. To overcome such limitation, prices at different levels of the supply chain in neighbouring countries (external prices) had to be considered. Also the “gate price” at the Swiss border (for which the import unit value, net of the duty, constitutes the better proxy) was found to suffer from a number of limitations, above all its non-representative nature in periods when only extremely limited volumes of the concerned products are imported. An issue of non-perfect product comparability (comparison between prices for different typologies / grades of a certain product) also emerged for some of the products covered by the evaluation. All the above issues limited to a certain extent the robustness of the results of the assessment, sometimes impeding the formulation of conclusive replies for this question; in this context, important additional evidence was provided for all products by an analysis on the volumes of out-of-quota imports, assuming that negligible or very low volumes indicate price differentials below the out-of-quota tariff (in other terms, a protective enough out-of-quota tariff).
The following price gaps where investigated:
Domestic producer price - foreign producer price
Domestic wholesale price - foreign wholesale price
Domestic consumer price - foreign consumer price
For the products for which it was impossible to systematically distinguish between periods with and without import quota releases, i.e. for beef and pork, a different and product-specific approach was adopted.
Policy evaluation of Tariff Rate Quotas
37
For beef, the assessment was conducted by making a distinction between the pre-2007 and post-2007 periods, in order to take into account the effect of the introduction of auctioning of import quotas. Since all variables were found to be characterized by a trend (see Annex 7.3.3), the testing procedure was conducted on de-trended time series. In addition, an analysis on smaller vs. larger quota releases was conducted.
For pork, the distinction between the pre-2009 and post-2009 periods was again used, as import quota releases have been less frequent from 2009 onwards. Since all variables were found to be characterized by a trend (see Annex 7.4.3), the testing procedure was conducted on de-trended time series. In addition, the analysis was also conducted with reference to the post-2009 period only, by distinguishing between periods with and without import quota releases.
The statistical tests used for this assessment were the parametric Welch Two Sample t-test and the non-parametric Wilcoxon rank sum test with continuity correction, where the latter requires no assumptions on the normality of the data distribution (see in the text above).
The final step in the assessment moved from the results of econometric models on causality relations and impulse response.
3.4.4 Question 2.2: impact on price stability
What is the contribution to stable domestic prices?
In order to reply to this question, the preliminary appraisal through visual inspection of graphical representations of time series of prices was completed by a descriptive analysis based on the comparison of the coefficients of variation (CV) of the relevant variables (domestic and foreign prices) and on appropriate tests on their variances (F-test). The comparison of the CV did not allow to assess the significance of their difference from a statistical point of view: this was done by testing the difference between the variances of the series of domestic and foreign prices. Nevertheless, it shall be noted that the variance of the domestic price series could be higher simply due to the fact that Swiss domestic prices have a higher mean than the foreign ones. For this reason, the focus on the CV provided a useful complementary information to the results of the test, in the form of a measure of the variability of a sample without reference to the scale of the data.
3.4.5 Question 2.3: impact on adequate provision
What is the contribution to allow an adequate provision of domestic markets?
The reply to this question is based on a combination of elements defining a working concept of “adequate provision”, a rather complex concept which was defined as a combination of:
i. the absence of product shortages (which would be signalled by a lower frequency of price spikes in Switzerland than in external markets);
ii. a balanced origin composition of imports (which should better guarantee supply security than an extremely polarised one, relying on a single dominant country);
iii. the absence of conditions (underutilised import quotas, especially in case of important transfers of the same among operators, and significant volumes of out-of-quota imports by operators that are “locked out” of the in-quota import trade) which could suggest the threat of market rationing by importers.
As per the first point, a descriptive analysis through appropriate tests on the means of the annual number of peaks in domestic and foreign consumer prices was performed for the purposes of such assessment. Peaks in prices were identified as those observations above the expected value plus one time the standard deviation. The statistical tests used for this assessment were the parametric Welch Two Sample t-test and the non-parametric Wilcoxon rank sum test with continuity correction, where the latter requires no assumptions on the normality of the data distribution (see above in the text).
Concerning the analysis of the origin of imports, the composition of exporting countries was performed on two years for each product, with the objective to understand the relative weight of each country on total imports and its evolution as well as the number of total supplying countries and their evolution.
The opportunity to perform the last analysis was tested for all products and it was finally performed for potatoes and tomatoes, since only for these products the simultaneous presence of different elements was identified in some years, namely:
Quota fill rates of the main players/gainers of import quotas significantly below 100%46.
Significant inward amount of trade of import quotas for the same players47.
Relatively high weight of out-of-quota imports by other players48.
46 This was not observed for beef, pork, apples and strawberries. 47 Observed in all the products apart from strawberries.

Policy evaluation of Tariff Rate Quotas
38
The above parameters were analyses for selected years with the objective to understand the potential threat of market rationing by the leading importers.
3.4.6 Question 3.1: rent and rent distribution
Which costs and benefits result for the various actors involved (economic welfare of producers, importers, processors, distributors, retailers, consumers, government), taking into account the relevant characteristics of world and domestic markets? In particular, what can be said about the impact on farmers vs the impact on the downstream industry? Which rents arise, and how are they distributed?
[The product-specific TRQ-administration methods and changes therein over the years shall be taken into account:
- Beef : changes in the administration method (auctioning, domestic purchases); release of the TRQ only for specific tariff lines
- Pork : auctioning; release of the TRQ only for carcasses - Potatoes : domestic purchases; opening of the TRQ limited in time (only a few months) - Apples : two-period system, with short “out-of-season period” - Tomatoes, strawberries: two-period system; TRQ releases with weekly frequency]
An in-depth analysis of the Swiss supply chain of the products under analysis was performed with the objective of estimating the concentration of imports.
As a basis for these analyses, a mapping of the different players and of their positioning along the supply chain was also performed, together with an analysis on the main groups/conglomerates operating in the Swiss market and their composition (parent companies, subsidiaries, partners, other related companies, etc.).
Groups of individual importers and/or import quota holders can act in a coordinated way due to linkages of various nature among them. The first step in the analysis hence consisted in the “clustering” of a number of individual operators whenever such linkages could be detected. The strongest (and relatively easy to detect) linkages derive from financial control of an operator by another operator. Investigations to detect such linkages were carried out:
starting from Annual Reports of publicly listed companies, which provide a detail of controlled subsidiaries;
through web searches for non-listed companies.
More details on the adopted approach for clustering are reported in Annex 7.2.4.1
Two types of concentration indexes were used in the assessment: Concentration ratios (CRn) and Herfindahl-Hirschman indexes (HH). For a complete description of the indexes and a numeric example of their application, please refer to Annex 7.2.4.1.
Considerations on the domestic market structure for the concerned products – especially in terms of dimension and of concentration of players – were also developed, in order to put the structural analysis of imports in the proper overall context.
Additional elements for the assessment were drawn from answers to questions 1 (1.1 and 1.2) and 2 (2.1, 2.2 and 2.3) and from additional quantitative and qualitative evidence, according to the methodology illustrated in the previous paragraphs.
3.4.7 Question 3.2: impact on import composition
Which is the impact of TRQs and of their administration method on the structure of imports (effect on the price and volume composition of shipments, structure of importers)?
The analysis carried out for question 3.1 was further detailed by estimating the levels of concentration at different stages of the process leading to actual in-quota imports, namely:
1. Initial attribution of quotas (according to the various allocation methods). 2. After exchanges of quotas between importers; for fruit and vegetable products, both rounds of trade were considered (i.e.
“trade in percentage”, which takes place before the beginning of the tariff quota releases, and “trade in absolute volume”, which takes place before imports occur, when quotas are released).
3. Comparison between the final quotas (after trading) for each importer and the respective actual in-quota imports.
An analysis on the main purchasers and sellers of import quotas for each product was also performed for 1 or 2 reference years, with the objective of understanding the main flows of quota exchange and the way in which they depend on import volumes, methodology of import quota attribution and stages in the transition towards an auction-based quota allocation system.
48 Only observed in potatoes and tomatoes.

Policy evaluation of Tariff Rate Quotas
39
In addition, for meat products concerned by the switch from a quota attribution system based entirely on domestic purchases to a system based (fully or partially) on auctions, an analysis on the entire period covered by the evaluation (2000-2014) was performed with the objective of estimating the impact of the switch on the number and the relative importance (both in terms of assigned quotas and in terms of actual imports) of the operators importing in-quota.
Finally, an analysis on the main countries of origin of the import of the products under study has been performed, with the objective to appraise the relative importance of different countries of origin for the Swiss market and to appreciate if and how their importance has changed in the last years.
3.4.8 Question 3.3: impact of market structure on rent distribution
Does the Swiss market structure (not perfect competition) influence the distribution of costs, benefits, rents?
The answer to question 3.3 was mainly based on the results of previous questions (1, 2 and 3.1 and 3.2) plus qualitative elements deriving from interviews and literature. Some assumptions on the presumable influence of the Swiss market structure on the distribution of costs, benefits and rents were developed and compared with the available evidence.
3.4.9 Question 3.4: impact of TRQs on market structure
What is the impact of TRQs on the development of the market structure of the food chain / on the vertical chain of production? Do they promote the formation of non-competitive market structures? To which extent?
The answer to question 3.4 was mainly based on the findings of previous questions (1, 2, 3.1, 3.2 and 3.3) plus qualitative elements deriving from interviews and literature. In addition, both the analysis on market players’ positioning along the supply chain and the mapping of the main groups/conglomerates provided useful elements to appreciate the potential formation of new alliances/partnerships along the supply chain (both horizontally and vertically).
3.4.10 Question 4: proposed changes
In light of the answers provided under Q1 – Q3, which changes could be proposed in the existing TRQs system to improve its efficacy and efficiency?
The answer to question 4 was based on the key findings of all the previous questions, as well as on the results of the comparative analysis of TRQ administration methods in Switzerland and in selected third countries, as reported in § 5. Considerations on the main achievements and weaknesses of the each administration system were made in the light of the most significant differences emerged from the comparison, with a view to highlighting the potential effects of and/or threats/limitations to the adoption of different mechanisms for TRQ administration in Switzerland.
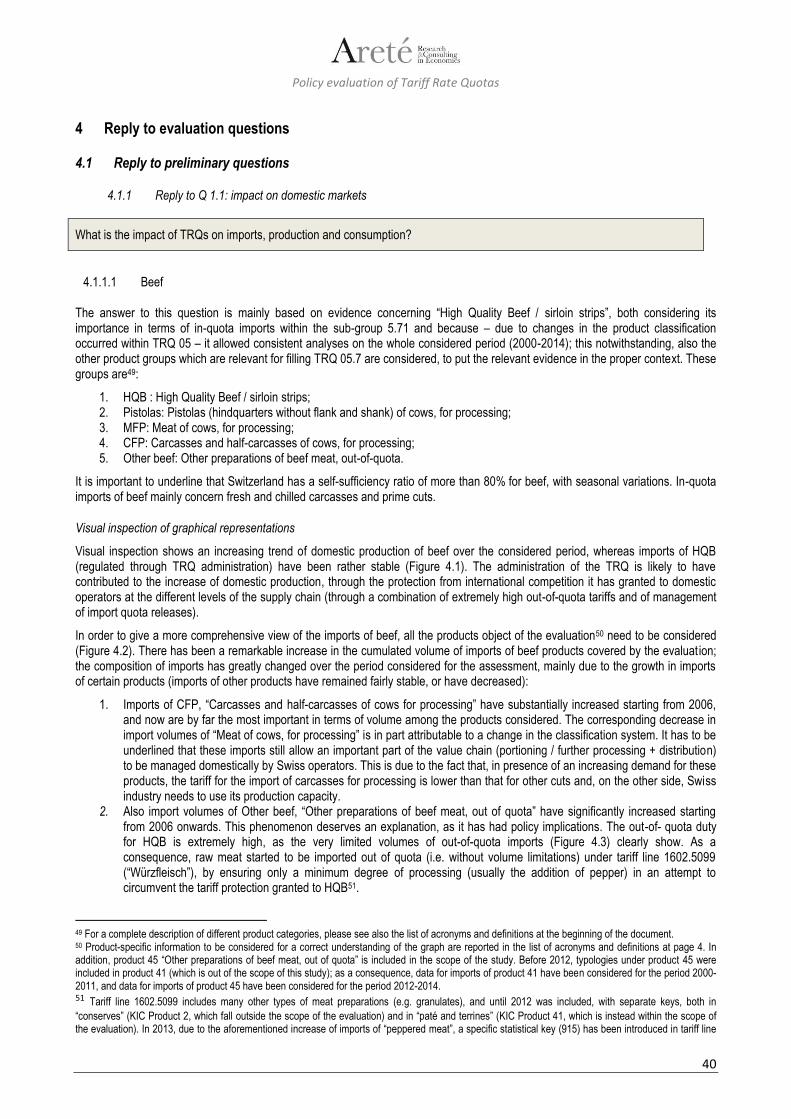
Policy evaluation of Tariff Rate Quotas
40
4 Reply to evaluation questions
4.1 Reply to preliminary questions
4.1.1 Reply to Q 1.1: impact on domestic markets
What is the impact of TRQs on imports, production and consumption?
4.1.1.1 Beef
The answer to this question is mainly based on evidence concerning “High Quality Beef / sirloin strips”, both considering its importance in terms of in-quota imports within the sub-group 5.71 and because – due to changes in the product classification occurred within TRQ 05 – it allowed consistent analyses on the whole considered period (2000-2014); this notwithstanding, also the other product groups which are relevant for filling TRQ 05.7 are considered, to put the relevant evidence in the proper context. These groups are49:
1. HQB : High Quality Beef / sirloin strips; 2. Pistolas: Pistolas (hindquarters without flank and shank) of cows, for processing; 3. MFP: Meat of cows, for processing; 4. CFP: Carcasses and half-carcasses of cows, for processing; 5. Other beef: Other preparations of beef meat, out-of-quota.
It is important to underline that Switzerland has a self-sufficiency ratio of more than 80% for beef, with seasonal variations. In-quota imports of beef mainly concern fresh and chilled carcasses and prime cuts.
Visual inspection of graphical representations
Visual inspection shows an increasing trend of domestic production of beef over the considered period, whereas imports of HQB (regulated through TRQ administration) have been rather stable (Figure 4.1). The administration of the TRQ is likely to have contributed to the increase of domestic production, through the protection from international competition it has granted to domestic operators at the different levels of the supply chain (through a combination of extremely high out-of-quota tariffs and of management of import quota releases).
In order to give a more comprehensive view of the imports of beef, all the products object of the evaluation50 need to be considered (Figure 4.2). There has been a remarkable increase in the cumulated volume of imports of beef products covered by the evaluation; the composition of imports has greatly changed over the period considered for the assessment, mainly due to the growth in imports of certain products (imports of other products have remained fairly stable, or have decreased):
1. Imports of CFP, “Carcasses and half-carcasses of cows for processing” have substantially increased starting from 2006, and now are by far the most important in terms of volume among the products considered. The corresponding decrease in import volumes of “Meat of cows, for processing” is in part attributable to a change in the classification system. It has to be underlined that these imports still allow an important part of the value chain (portioning / further processing + distribution) to be managed domestically by Swiss operators. This is due to the fact that, in presence of an increasing demand for these products, the tariff for the import of carcasses for processing is lower than that for other cuts and, on the other side, Swiss industry needs to use its production capacity.
2. Also import volumes of Other beef, “Other preparations of beef meat, out of quota” have significantly increased starting from 2006 onwards. This phenomenon deserves an explanation, as it has had policy implications. The out-of- quota duty for HQB is extremely high, as the very limited volumes of out-of-quota imports (Figure 4.3) clearly show. As a consequence, raw meat started to be imported out of quota (i.e. without volume limitations) under tariff line 1602.5099 (“Würzfleisch”), by ensuring only a minimum degree of processing (usually the addition of pepper) in an attempt to circumvent the tariff protection granted to HQB51.
49 For a complete description of different product categories, please see also the list of acronyms and definitions at the beginning of the document. 50 Product-specific information to be considered for a correct understanding of the graph are reported in the list of acronyms and definitions at page 4. In addition, product 45 “Other preparations of beef meat, out of quota” is included in the scope of the study. Before 2012, typologies under product 45 were included in product 41 (which is out of the scope of this study); as a consequence, data for imports of product 41 have been considered for the period 2000-2011, and data for imports of product 45 have been considered for the period 2012-2014. 51 Tariff line 1602.5099 includes many other types of meat preparations (e.g. granulates), and until 2012 was included, with separate keys, both in
“conserves” (KIC Product 2, which fall outside the scope of the evaluation) and in “paté and terrines” (KIC Product 41, which is instead within the scope of the evaluation). In 2013, due to the aforementioned increase of imports of “peppered meat”, a specific statistical key (915) has been introduced in tariff line
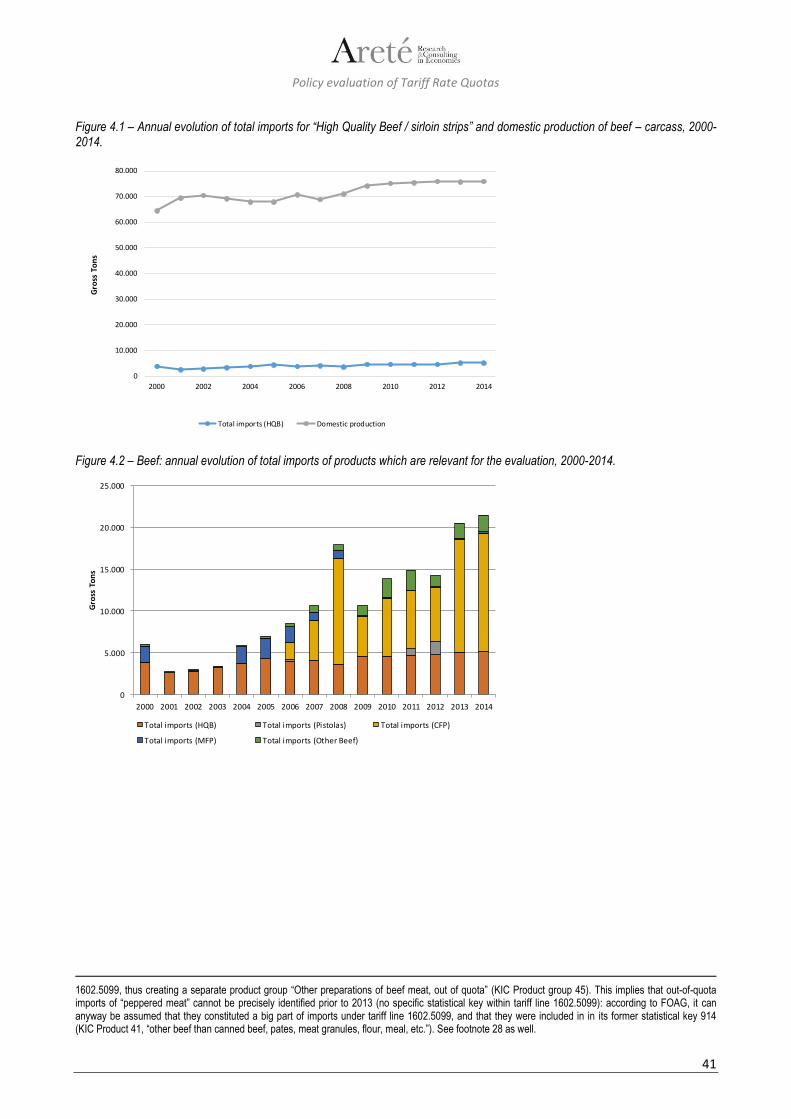
Policy evaluation of Tariff Rate Quotas
41
Figure 4.1 – Annual evolution of total imports for “High Quality Beef / sirloin strips” and domestic production of beef – carcass, 2000-2014.
Figure 4.2 – Beef: annual evolution of total imports of products which are relevant for the evaluation, 2000-2014.
1602.5099, thus creating a separate product group “Other preparations of beef meat, out of quota” (KIC Product group 45). This implies that out-of-quota imports of “peppered meat” cannot be precisely identified prior to 2013 (no specific statistical key within tariff line 1602.5099): according to FOAG, it can anyway be assumed that they constituted a big part of imports under tariff line 1602.5099, and that they were included in in its former statistical key 914 (KIC Product 41, “other beef than canned beef, pates, meat granules, flour, meal, etc.”). See footnote 28 as well.
0
10.000
20.000
30.000
40.000
50.000
60.000
70.000
80.000
2000 2002 2004 2006 2008 2010 2012 2014
Gro
ss T
on
s
Total imports (HQB) Domestic production
0
5.000
10.000
15.000
20.000
25.000
2000 2001 2002 2003 2004 2005 2006 2007 2008 2009 2010 2011 2012 2013 2014
Gro
ss T
on
s
Total imports (HQB) Total imports (Pistolas) Total imports (CFP)
Total imports (MFP) Total imports (Other Beef)

Policy evaluation of Tariff Rate Quotas
42
Figure 4.3 – Annual evolution of total imports of “High Quality Beef / sirloin strips”, in-quota vs. out-of-quota imports, 2000-2014.
Releases of import quotas for HQB have regularly been made all year round, in every month of the period considered in the assessment: only the total allocated volume for each release of import quotas has varied.
0
1.000
2.000
3.000
4.000
5.000
6.000
2000 2001 2002 2003 2004 2005 2006 2007 2008 2009 2010 2011 2012 2013 2014
Gro
ss T
on
s
In quota import (HQB) Out of quota import (HQB)
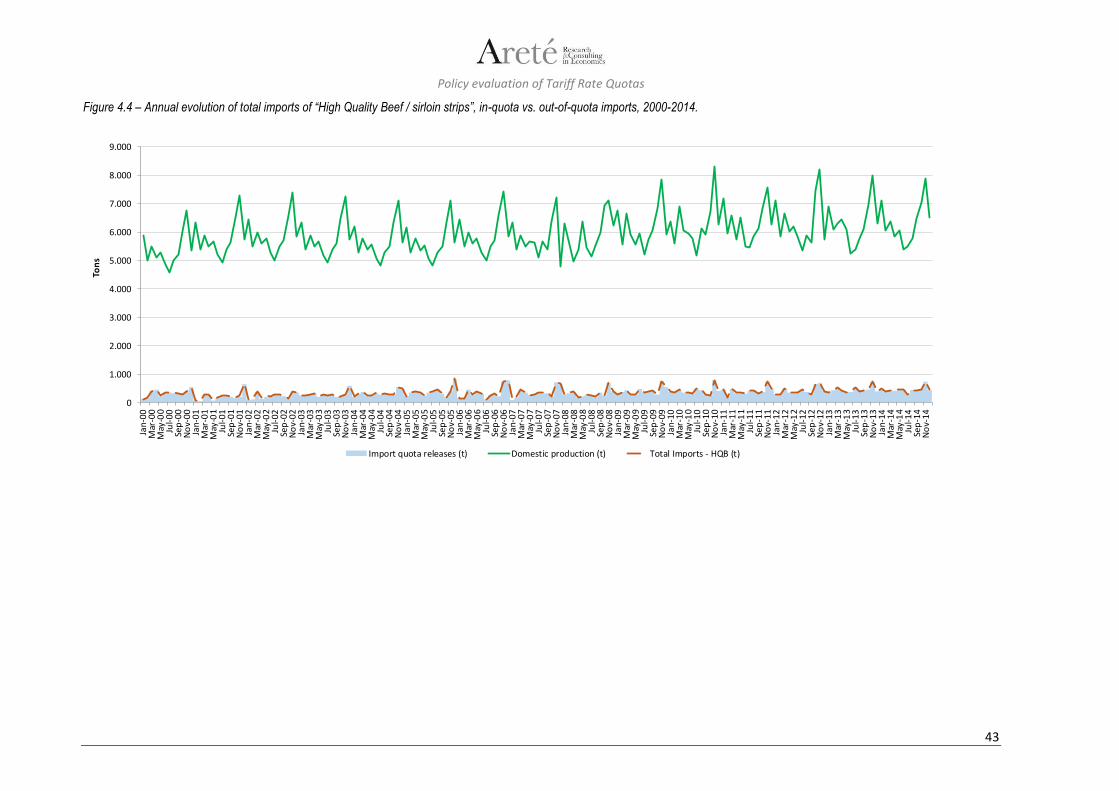
Policy evaluation of Tariff Rate Quotas
43
Figure 4.4 – Annual evolution of total imports of “High Quality Beef / sirloin strips”, in-quota vs. out-of-quota imports, 2000-2014.
0
1.000
2.000
3.000
4.000
5.000
6.000
7.000
8.000
9.000Ja
n-0
0M
ar-0
0M
ay-0
0Ju
l-0
0Se
p-0
0N
ov-
00
Jan
-01
Mar
-01
May
-01
Jul-
01
Sep
-01
No
v-0
1Ja
n-0
2M
ar-0
2M
ay-0
2Ju
l-02
Sep
-02
No
v-0
2Ja
n-0
3M
ar-0
3M
ay-0
3Ju
l-03
Sep
-03
No
v-0
3Ja
n-0
4M
ar-0
4M
ay-0
4Ju
l-0
4Se
p-0
4N
ov-
04
Jan
-05
Mar
-05
May
-05
Jul-
05
Sep
-05
No
v-0
5Ja
n-0
6M
ar-0
6M
ay-0
6Ju
l-0
6Se
p-0
6N
ov-
06
Jan
-07
Mar
-07
May
-07
Jul-0
7Se
p-0
7N
ov-
07
Jan
-08
Mar
-08
May
-08
Jul-
08
Sep
-08
No
v-0
8Ja
n-0
9M
ar-0
9M
ay-0
9Ju
l-0
9Se
p-0
9N
ov-
09
Jan
-10
Mar
-10
May
-10
Jul-
10
Sep
-10
No
v-1
0Ja
n-1
1M
ar-1
1M
ay-1
1Ju
l-1
1Se
p-1
1N
ov-
11
Jan
-12
Mar
-12
May
-12
Jul-1
2Se
p-1
2N
ov-
12
Jan
-13
Mar
-13
May
-13
Jul-
13
Sep
-13
No
v-1
3Ja
n-1
4M
ar-1
4M
ay-1
4Ju
l-1
4Se
p-1
4N
ov-
14
Ton
s
Import quota releases (t) Domestic production (t) Total Imports - HQB (t)

Policy evaluation of Tariff Rate Quotas
44
Statistical tests
The results (see also Annex 7.3.3) show that the difference in mean between the periods in which “large” and “small” volumes of import quotas are allocated for HQB is statistically significant (at a 1% significance level) both for total imports and domestic production. Consistently with the extremely limited importance of out-of-quota imports, the mean of total imports when “large” quota releases are made is higher than the mean of total imports when “small” releases are made: this suggests that TRQ administration plays an important role in determining the total volume of imports of HQB.
The volume of allocated import quotas for HQB is very limited if measured against total Swiss production of beef: the results of statistical tests (comparison of means of production volumes for “large” vs. “small” import quota releases) actually revealed no useful evidence for the assessment.
Results of the econometric policy model
The econometric policy model is based on the following variables:
Domestic Production (in tons)
Domestic consumer price (in CHF/ton)
Total imports (in tons) / Policy Intensity indicator52 (as defined at § 3.3.1)
Import unit value (in CHF/ton)
Figure 4.5 summarizes the results of the Granger causality test53 and of the impulse response function54 for beef (further details as well as the complete set of results are reported in Annex 7.3.4).
The assumed causal chain for HQB - which was suggested by the available information on the process which leads the supply chain actors to request the release of import quotas to FOAG - was confirmed by the Granger causality test. From interviews with independent experts and as foreseen in the Schlachtviehverordnung (Slaughter Regulation), it emerged that the volume of import quota releases to request to FOAG is decided by the inter-branch organisation Proviande (i.e. through concertation among the supply chain actors) taking into account the balance between domestic production and market demand, as this mainly determines domestic prices. Volumes of quota releases are requested to an extent that prevents negative impacts on domestic prices.
As for the impulse response function, the results showed that a decrease in domestic production results in an increase of domestic consumer price (this is clearly consistent with market economics). A direct correlation (even if less strong than the previous one) was found between increases in domestic consumer price and increases in imports: this is also consistent with market economics in a country which is not self-sufficient for HQB, and with the rationale of TRQ administration for this product (increases in domestic prices are usually related to a tighter supply/demand balance: imports are then needed to avoid leaving a part of the demand unsatisfied).
The inverse correlation found between total imports and import unit value might be explained, at least in part, by different volumes of import quota releases (which have a strong direct impact on total imports volumes), also considering the available information on the process behind requests of import quota releases. Whenever “small” quota releases are made, these can be reasonably related to specific “emergency” needs and/or to the need of importing special product typologies with a higher unit value; on the contrary, “large” quota releases can be reasonably linked to tighter supply/demand conditions, where more substantial imports of “standard” HQB are needed to satisfy the demand.
52 On the basis of how policy intensity was defined for HQB, total imports and the policy indicator systematically assume extremely similar values (due to negligible out-of-quota imports), and are hence considered as a single variable (only total imports were included in the econometric models). 53 The Granger causality test is used to test the null hypothesis of no Granger causality. Therefore, a significant result of the test indicates that the null hypothesis of no Granger causality between the two variables should be rejected. 54 An impulse response function describes how shocks to a system of equations affect those equations over time. The IRF graphs show the impact (y-axis) that a shock at time t on a variable causes on another variable at different lags (x-axis). Impacts are significantly different from 0 when the area included between the confidence intervals does not include the value 0 (y-axis).
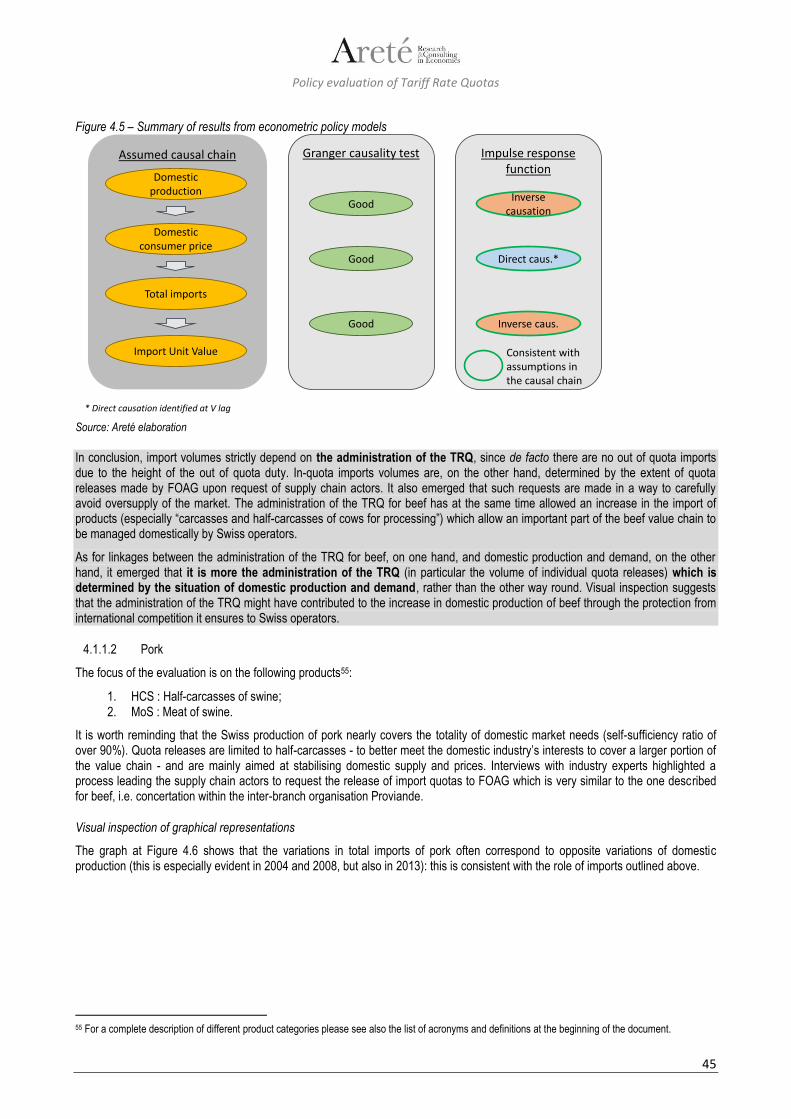
Policy evaluation of Tariff Rate Quotas
45
Figure 4.5 – Summary of results from econometric policy models
Source: Areté elaboration In conclusion, import volumes strictly depend on the administration of the TRQ, since de facto there are no out of quota imports due to the height of the out of quota duty. In-quota imports volumes are, on the other hand, determined by the extent of quota releases made by FOAG upon request of supply chain actors. It also emerged that such requests are made in a way to carefully avoid oversupply of the market. The administration of the TRQ for beef has at the same time allowed an increase in the import of products (especially “carcasses and half-carcasses of cows for processing”) which allow an important part of the beef value chain to be managed domestically by Swiss operators.
As for linkages between the administration of the TRQ for beef, on one hand, and domestic production and demand, on the other hand, it emerged that it is more the administration of the TRQ (in particular the volume of individual quota releases) which is determined by the situation of domestic production and demand, rather than the other way round. Visual inspection suggests that the administration of the TRQ might have contributed to the increase in domestic production of beef through the protection from international competition it ensures to Swiss operators.
4.1.1.2 Pork
The focus of the evaluation is on the following products55:
1. HCS : Half-carcasses of swine; 2. MoS : Meat of swine.
It is worth reminding that the Swiss production of pork nearly covers the totality of domestic market needs (self-sufficiency ratio of over 90%). Quota releases are limited to half-carcasses - to better meet the domestic industry’s interests to cover a larger portion of the value chain - and are mainly aimed at stabilising domestic supply and prices. Interviews with industry experts highlighted a process leading the supply chain actors to request the release of import quotas to FOAG which is very similar to the one described for beef, i.e. concertation within the inter-branch organisation Proviande.
Visual inspection of graphical representations
The graph at Figure 4.6 shows that the variations in total imports of pork often correspond to opposite variations of domestic production (this is especially evident in 2004 and 2008, but also in 2013): this is consistent with the role of imports outlined above.
55 For a complete description of different product categories please see also the list of acronyms and definitions at the beginning of the document.
Assumed causal chain
Domestic production
Domestic consumer price
Total imports
Import Unit Value
* Direct causation identified at V lag
Impulse response function
Direct caus.*
Inverse causation
Inverse caus.
Granger causality test
Good
Good
Good
Consistent with assumptions in the causal chain
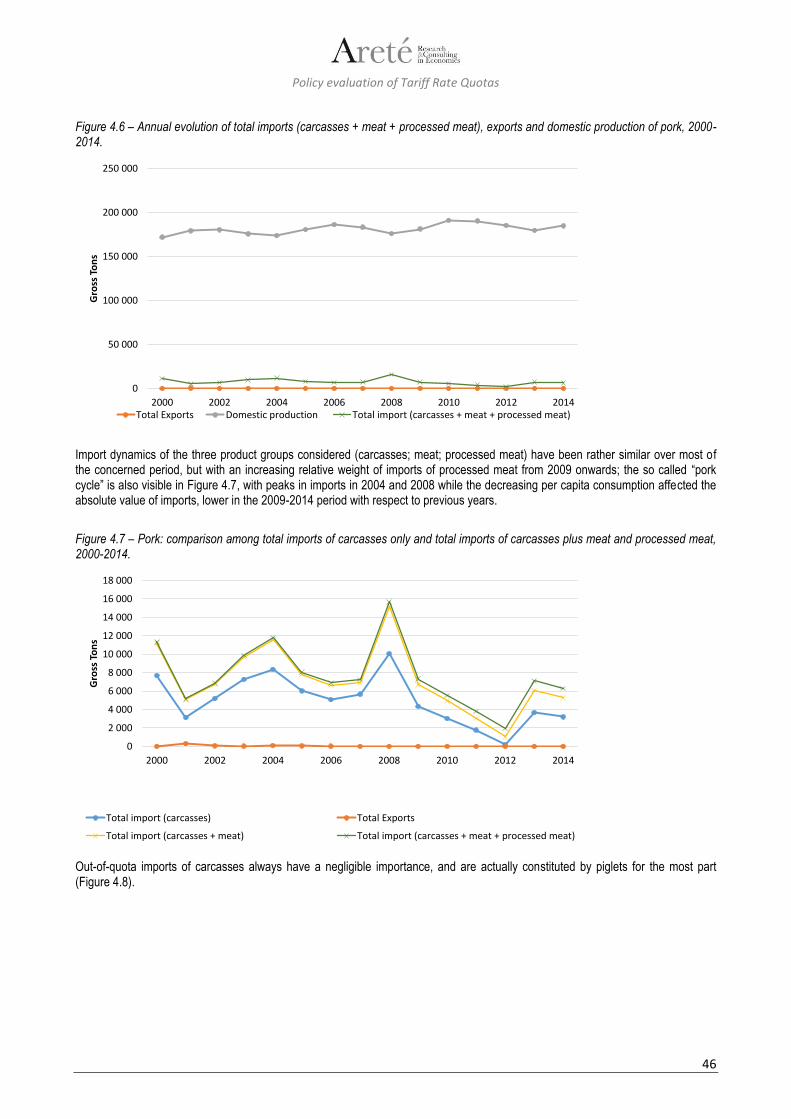
Policy evaluation of Tariff Rate Quotas
46
Figure 4.6 – Annual evolution of total imports (carcasses + meat + processed meat), exports and domestic production of pork, 2000-2014.
Import dynamics of the three product groups considered (carcasses; meat; processed meat) have been rather similar over most of the concerned period, but with an increasing relative weight of imports of processed meat from 2009 onwards; the so called “pork cycle” is also visible in Figure 4.7, with peaks in imports in 2004 and 2008 while the decreasing per capita consumption affected the absolute value of imports, lower in the 2009-2014 period with respect to previous years.
Figure 4.7 – Pork: comparison among total imports of carcasses only and total imports of carcasses plus meat and processed meat, 2000-2014.
Out-of-quota imports of carcasses always have a negligible importance, and are actually constituted by piglets for the most part (Figure 4.8).
0
50 000
100 000
150 000
200 000
250 000
2000 2002 2004 2006 2008 2010 2012 2014
Gro
ss T
on
s
Total Exports Domestic production Total import (carcasses + meat + processed meat)
0
2 000
4 000
6 000
8 000
10 000
12 000
14 000
16 000
18 000
2000 2002 2004 2006 2008 2010 2012 2014
Gro
ss T
on
s
Total import (carcasses) Total Exports
Total import (carcasses + meat) Total import (carcasses + meat + processed meat)

Policy evaluation of Tariff Rate Quotas
47
Figure 4.8 – Pork: breakdown of total imports of carcasses, in-quota vs. out-of-quota imports, 2000-2014.
0
2 000
4 000
6 000
8 000
10 000
12 000
2000 2001 2002 2003 2004 2005 2006 2007 2008 2009 2010 2011 2012 2013 2014
Gro
ss T
on
s
In quota import Out of quota import
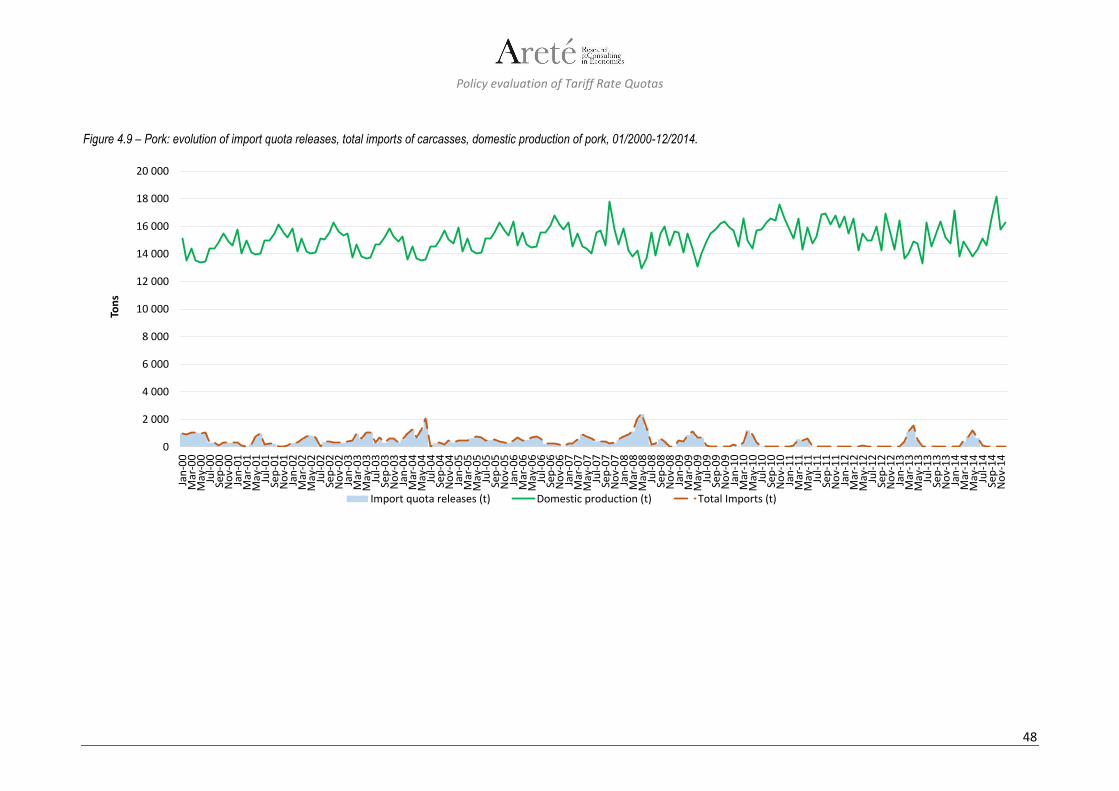
Policy evaluation of Tariff Rate Quotas
48
Figure 4.9 – Pork: evolution of import quota releases, total imports of carcasses, domestic production of pork, 01/2000-12/2014.
0
2 000
4 000
6 000
8 000
10 000
12 000
14 000
16 000
18 000
20 000Ja
n-0
0M
ar-0
0M
ay-0
0Ju
l-0
0Se
p-0
0N
ov-
00
Jan
-01
Mar
-01
May
-01
Jul-
01
Sep
-01
No
v-0
1Ja
n-0
2M
ar-0
2M
ay-0
2Ju
l-0
2Se
p-0
2N
ov-
02
Jan
-03
Mar
-03
May
-03
Jul-
03
Sep
-03
No
v-0
3Ja
n-0
4M
ar-0
4M
ay-0
4Ju
l-0
4Se
p-0
4N
ov-
04
Jan
-05
Mar
-05
May
-05
Jul-
05
Sep
-05
No
v-0
5Ja
n-0
6M
ar-0
6M
ay-0
6Ju
l-0
6Se
p-0
6N
ov-
06
Jan
-07
Mar
-07
May
-07
Jul-
07
Sep
-07
No
v-0
7Ja
n-0
8M
ar-0
8M
ay-0
8Ju
l-0
8Se
p-0
8N
ov-
08
Jan
-09
Mar
-09
May
-09
Jul-
09
Sep
-09
No
v-0
9Ja
n-1
0M
ar-1
0M
ay-1
0Ju
l-1
0Se
p-1
0N
ov-
10
Jan
-11
Mar
-11
May
-11
Jul-
11
Sep
-11
No
v-1
1Ja
n-1
2M
ar-1
2M
ay-1
2Ju
l-1
2Se
p-1
2N
ov-
12
Jan
-13
Mar
-13
May
-13
Jul-
13
Sep
-13
No
v-1
3Ja
n-1
4M
ar-1
4M
ay-1
4Ju
l-1
4Se
p-1
4N
ov-
14
Ton
s
Import quota releases (t) Domestic production (t) Total Imports (t)
Policy evaluation of Tariff Rate Quotas
49
The most noteworthy development to highlight in the administration of the TRQ is the reduced frequency of import quota releases for carcasses from 2009 onwards; this has to be related to the decline in overall imports of carcasses from the same year onwards (Figure 4.8), and also to an increase in domestic production vis-à-vis a stability of domestic consumption. The greater volumes of import quota releases tend to coincide with periods characterised by lower levels of monthly production, i.e. when the supply/demand balance is tighter.
Statistical tests
The assessment was first conducted by making a distinction between pre-2009 and post-2009 periods, since TRQ administration was much stricter starting from that year (less frequent import quota releases). A statistically significant difference (1% significance level) in the mean volumes of total imports between the two periods emerged from the tests: the mean of total imports from 2009 onwards was found to be lower than the mean of total imports before 2009 (see also Annex 7.4.3).
No significant difference was instead found in the volumes of domestic production in the two considered periods, this seems to confirm that changes in TRQ administration, and in the relative amount of imports, are due to changes in domestic consumption (lower per capita consumption) rather than in the domestic supply.
In a second step of the analysis, only the period from 2009 onwards was considered, and the difference in mean between the variables observed in periods with and without quota releases was analysed. Such difference was found to be statistically significant (at a 1% significance level) for both total imports and domestic production (see also Annex 7.4.3).
The mean of total imports in periods with quota releases was found to be higher than in periods without quota releases: this suggests that TRQ administration seriously limits imports when no quotas are released (an extremely high out-of-quota tariff actually applies in such periods).
The mean of domestic production in periods with quota releases is lower than in periods without quota releases. This suggests the recourse to import quota releases in situations when domestic production is insufficient to meet the demand, a finding which is consistent with the policy rationale outlined in the introduction.
Results of the econometric policy model
The econometric policy model is based on the following variables:
Domestic Production (in tons)
Domestic consumer price (in CHF/ton)
Total imports (in tons)56 / Policy Intensity indicator (as defined at § 3.3.1)
Foreign wholesale price (in CHF/ton), as exogenous variable
Figure 4.10 summarises the results of the Granger causality test and of the impulse response function for pork (further details as well as the complete set of results are reported in Annex 7.4.4).
56 On the basis of how policy intensity was defined for the Pork product, total imports and policy indicator are considered as the same variable and therefore total imports only were included in the econometric models.

Policy evaluation of Tariff Rate Quotas
50
Figure 4.10 – Summary of results from econometric policy models
Source: Areté elaboration
The causal chain hypothesised in the policy model for pork was confirmed only in part by the Granger causality test: the relationship between domestic production and domestic consumer price was found to be statistically significant, while the one between domestic consumer price and policy intensity / total imports (these two variables can be merged in a single one, due to negligible out-of-quota imports) was not. This could be explained by the limited frequency of import quota releases from 2009 onwards (which reduced the number of available observations) and by the decreasing role of imports in determining the balance between supply and demand of pork on the Swiss market. Additional elements impacting the relationship between domestic consumer prices and total imports are seasonality and sales promotions, the latter planned months in advance (and therefore fixed), and the fact that, on the opposite, import quota releases are often decided at short notice.
As for the impulse response function, the inverse correlation between domestic production and domestic consumer prices was found to be solid, consistently with the economic theory.
In conclusion, import volumes strictly depend on the administration of the TRQ for pork, since de facto there are no out of quota imports due to the height of the out of quota duty. In-quota imports are determined by the extent of quota releases made by FOAG upon request of supply chain actors, with a view to avoiding an oversupply of the market (the frequency of import quota releases, and the volume of imports, have greatly decreased from 2009 onwards, due to changing conditions in the domestic market, e.g. the reduction of per capita domestic consumption).
As for linkages between the administration of the TRQ for pork, on one hand, and domestic production and demand, on the other hand, the assessment – and in particular the results of the statistical tests – showed that it is more the administration of the TRQ (frequency and volume of quota releases) which is determined by the situation of domestic production and demand, rather than the other way round. The administration of the TRQ has actually been adapted to the changing conditions on the Swiss market for pork, with import quota releases mainly serving the purpose of stabilising supply in periods when domestic production was more limited.
4.1.1.3 Potatoes
The evaluation focuses on table potatoes: potatoes for processing, potato products and seed potatoes are outside the scope of the study.
The rationale of TRQ administration for potatoes takes into account their storage possibilities. In Switzerland, imports of ware potatoes are needed when the harvest of domestic potatoes is late. The stocks of the previous campaign usually last until the beginning of the subsequent one, and therefore only early potatoes are imported in most years. The number of import quota releases per year is usually limited; every year there is at least one opening to assure market access for a base quantity of table potatoes according to the GATT-Agreement. This quantity is the same every year. Additional releases may be needed according to variations in domestic yields, or when the quality of the Swiss production does not meet local market requirements. Information sourced from interviews with experts highlighted that the process within SWISSPATAT leading to decisions concerning requests for additional quota releases is a consensus-based one: supply chain actors must agree about the estimated extent of prospective domestic yield, consumption, and stock depletion to make their requests to FOAG.
Assumed causal chain
Domestic production
Domestic consumer price
Total imports
International wholesale price*
* Exogenous variable
Granger causality test
Good
not statistically significant
Impulse response function
not statistically significant
Inverse causation
Consistent with assumptions in the causal chain

Policy evaluation of Tariff Rate Quotas
51
Visual inspection of graphical representations
The most noteworthy trends emerging from visual inspection (Figure 4.11) are:
1. an evident increase in both domestic production of potatoes for human consumption (from 2006 onwards) and in supply of packed table potatoes for retail only (from 2004 onwards);
2. an increase in imports of table potatoes (mostly constituted by early potatoes) from 2005 onwards.
Figure 4.11 – Annual evolution of total imports of table potatoes, exports and total domestic production of potatoes for human consumption and supply of packed potatoes for retail only, 2002-2014.
There is a clear prevalence of in-quota imports (Figure 4.12); out-of-quota imports (especially those in other packings) usually have a limited importance. It is worth noting that higher in-quota imports in some years are due to temporary increases of the volume covered by the concerned TRQ, upon request of sector operators (additional quota releases).
Figure 4.12 – Breakdown of total imports of table potatoes, in-quota vs. out-of-quota imports, 2000-2014.
The graph at Figure 4.13 highlights the role played by in-quota imports (which are usually constituted for the most part by early potatoes) in completing the domestic supply of packed potatoes for retail.
0
20 000
40 000
60 000
80 000
100 000
120 000
140 000
160 000
180 000
200 000
2002 2004 2006 2008 2010 2012 2014
Ton
s
Total imports Total exports
Supply (packed for retail only) Domestic production for human cons.
0
2 000
4 000
6 000
8 000
10 000
12 000
14 000
16 000
18 000
2000 2001 2002 2003 2004 2005 2006 2007 2008 2009 2010 2011 2012 2013 2014
Ton
s
In quota import Out of quota, in bulk Out of quota, other (Other packing)

Policy evaluation of Tariff Rate Quotas
52
From 1999 until 2008, the TRQ was opened from March until mid-May. In order to take into account the new duty-free quota to Egypt, it was decided to extend, as from 2009, the period from 1st of January until the end of May. In 2010, due to late delivery by Egyptian authorities of documents pertaining to pest-free areas, the TRQ opening was delayed until 15th of February.
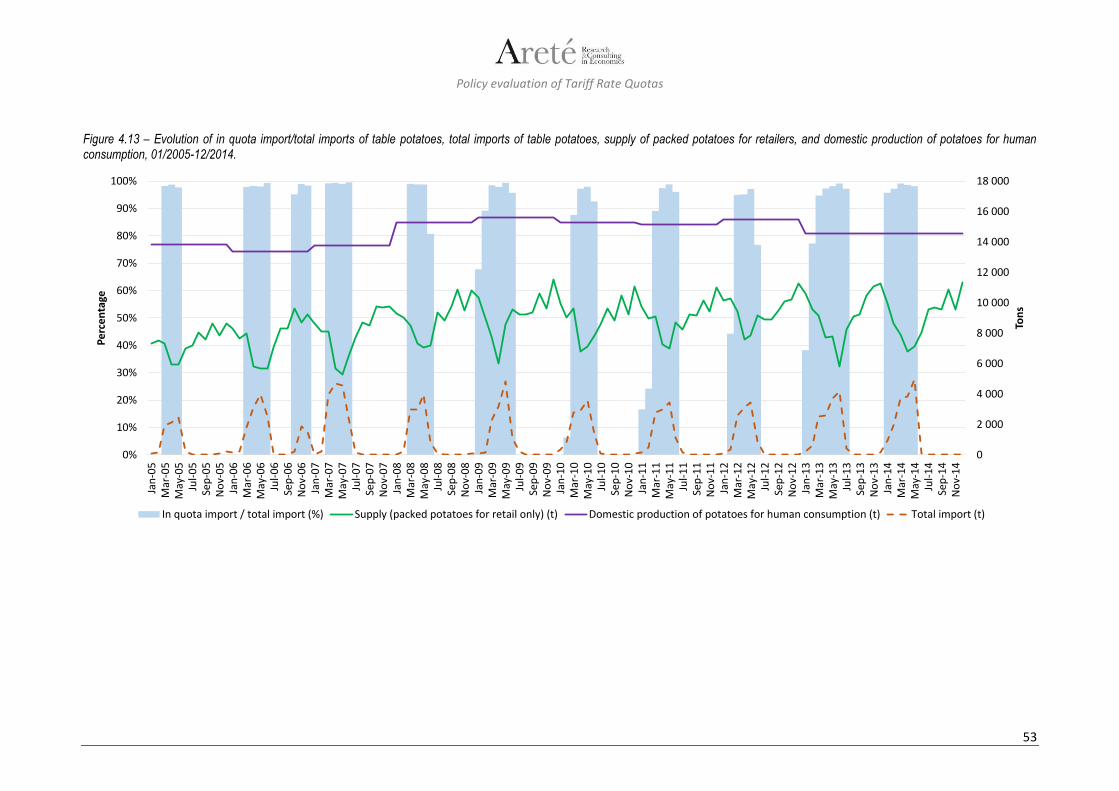
Policy evaluation of Tariff Rate Quotas
53
Figure 4.13 – Evolution of in quota import/total imports of table potatoes, total imports of table potatoes, supply of packed potatoes for retailers, and domestic production of potatoes for human consumption, 01/2005-12/2014.
0
2 000
4 000
6 000
8 000
10 000
12 000
14 000
16 000
18 000
0%
10%
20%
30%
40%
50%
60%
70%
80%
90%
100%
Jan
-05
Mar
-05
May
-05
Jul-
05
Sep
-05
No
v-0
5Ja
n-0
6M
ar-0
6M
ay-0
6Ju
l-0
6Se
p-0
6N
ov-
06
Jan
-07
Mar
-07
May
-07
Jul-
07
Sep
-07
No
v-0
7Ja
n-0
8M
ar-0
8M
ay-0
8Ju
l-0
8Se
p-0
8N
ov-
08
Jan
-09
Mar
-09
May
-09
Jul-
09
Sep
-09
No
v-0
9Ja
n-1
0M
ar-1
0M
ay-1
0Ju
l-1
0Se
p-1
0N
ov-
10
Jan
-11
Mar
-11
May
-11
Jul-
11
Sep
-11
No
v-1
1Ja
n-1
2M
ar-1
2M
ay-1
2Ju
l-1
2Se
p-1
2N
ov-
12
Jan
-13
Mar
-13
May
-13
Jul-
13
Sep
-13
No
v-1
3Ja
n-1
4M
ar-1
4M
ay-1
4Ju
l-1
4Se
p-1
4N
ov-
14
Ton
s
Pe
rce
nta
ge
In quota import / total import (%) Supply (packed potatoes for retail only) (t) Domestic production of potatoes for human consumption (t) Total import (t)
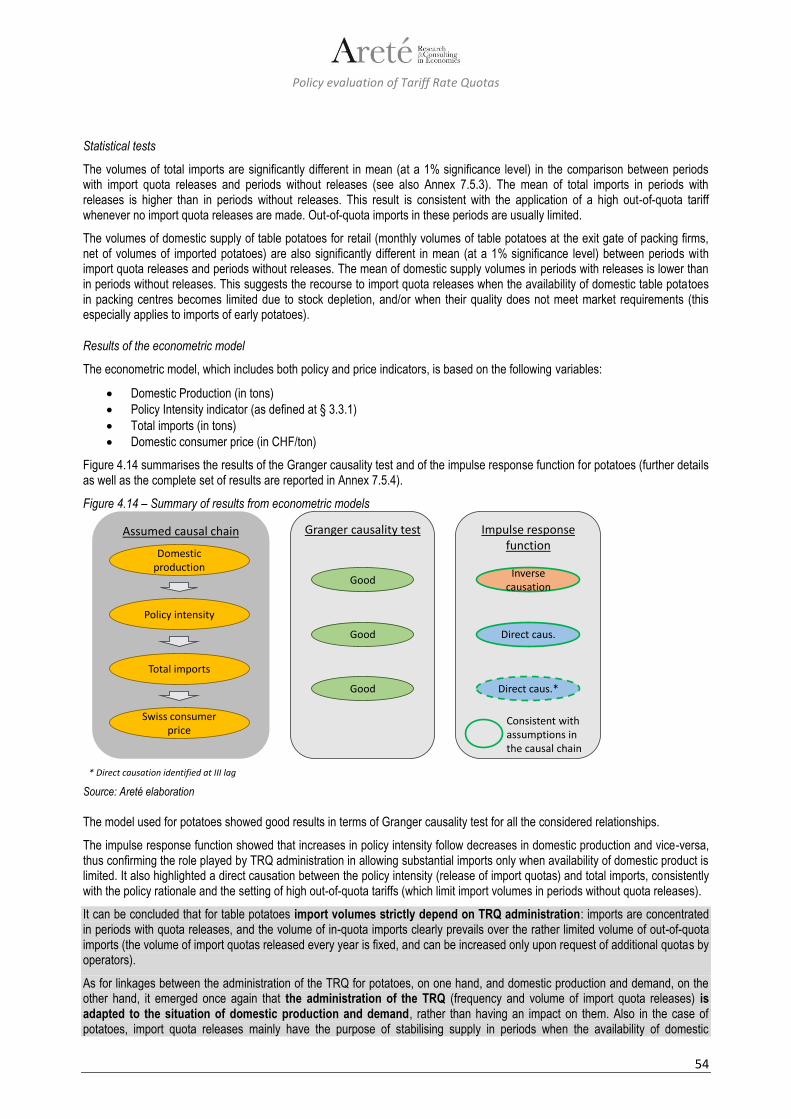
Policy evaluation of Tariff Rate Quotas
54
Statistical tests
The volumes of total imports are significantly different in mean (at a 1% significance level) in the comparison between periods with import quota releases and periods without releases (see also Annex 7.5.3). The mean of total imports in periods with releases is higher than in periods without releases. This result is consistent with the application of a high out-of-quota tariff whenever no import quota releases are made. Out-of-quota imports in these periods are usually limited.
The volumes of domestic supply of table potatoes for retail (monthly volumes of table potatoes at the exit gate of packing firms, net of volumes of imported potatoes) are also significantly different in mean (at a 1% significance level) between periods with import quota releases and periods without releases. The mean of domestic supply volumes in periods with releases is lower than in periods without releases. This suggests the recourse to import quota releases when the availability of domestic table potatoes in packing centres becomes limited due to stock depletion, and/or when their quality does not meet market requirements (this especially applies to imports of early potatoes).
Results of the econometric model
The econometric model, which includes both policy and price indicators, is based on the following variables:
Domestic Production (in tons)
Policy Intensity indicator (as defined at § 3.3.1)
Total imports (in tons)
Domestic consumer price (in CHF/ton)
Figure 4.14 summarises the results of the Granger causality test and of the impulse response function for potatoes (further details as well as the complete set of results are reported in Annex 7.5.4).
Figure 4.14 – Summary of results from econometric models
Source: Areté elaboration The model used for potatoes showed good results in terms of Granger causality test for all the considered relationships.
The impulse response function showed that increases in policy intensity follow decreases in domestic production and vice-versa, thus confirming the role played by TRQ administration in allowing substantial imports only when availability of domestic product is limited. It also highlighted a direct causation between the policy intensity (release of import quotas) and total imports, consistently with the policy rationale and the setting of high out-of-quota tariffs (which limit import volumes in periods without quota releases).
It can be concluded that for table potatoes import volumes strictly depend on TRQ administration: imports are concentrated in periods with quota releases, and the volume of in-quota imports clearly prevails over the rather limited volume of out-of-quota imports (the volume of import quotas released every year is fixed, and can be increased only upon request of additional quotas by operators).
As for linkages between the administration of the TRQ for potatoes, on one hand, and domestic production and demand, on the other hand, it emerged once again that the administration of the TRQ (frequency and volume of import quota releases) is adapted to the situation of domestic production and demand, rather than having an impact on them. Also in the case of potatoes, import quota releases mainly have the purpose of stabilising supply in periods when the availability of domestic
Assumed causal chain
Domestic production
Policy intensity
Total imports
Swiss consumer price
Granger causality test
Good
Good
Good
Impulse response function
Inverse causation
Direct caus.
Direct caus.*
* Direct causation identified at III lag
Consistent with assumptions in the causal chain
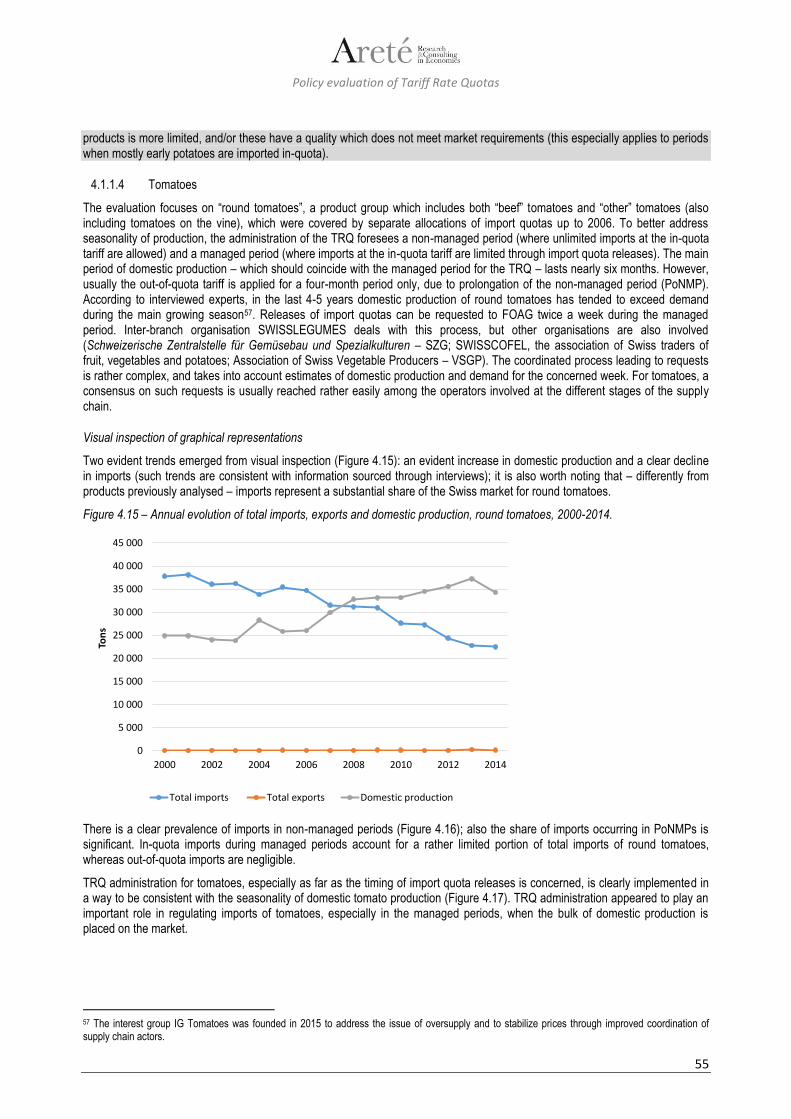
Policy evaluation of Tariff Rate Quotas
55
products is more limited, and/or these have a quality which does not meet market requirements (this especially applies to periods when mostly early potatoes are imported in-quota).
4.1.1.4 Tomatoes
The evaluation focuses on “round tomatoes”, a product group which includes both “beef” tomatoes and “other” tomatoes (also including tomatoes on the vine), which were covered by separate allocations of import quotas up to 2006. To better address seasonality of production, the administration of the TRQ foresees a non-managed period (where unlimited imports at the in-quota tariff are allowed) and a managed period (where imports at the in-quota tariff are limited through import quota releases). The main period of domestic production – which should coincide with the managed period for the TRQ – lasts nearly six months. However, usually the out-of-quota tariff is applied for a four-month period only, due to prolongation of the non-managed period (PoNMP). According to interviewed experts, in the last 4-5 years domestic production of round tomatoes has tended to exceed demand during the main growing season57. Releases of import quotas can be requested to FOAG twice a week during the managed period. Inter-branch organisation SWISSLEGUMES deals with this process, but other organisations are also involved (Schweizerische Zentralstelle für Gemüsebau und Spezialkulturen – SZG; SWISSCOFEL, the association of Swiss traders of fruit, vegetables and potatoes; Association of Swiss Vegetable Producers – VSGP). The coordinated process leading to requests is rather complex, and takes into account estimates of domestic production and demand for the concerned week. For tomatoes, a consensus on such requests is usually reached rather easily among the operators involved at the different stages of the supply chain.
Visual inspection of graphical representations
Two evident trends emerged from visual inspection (Figure 4.15): an evident increase in domestic production and a clear decline in imports (such trends are consistent with information sourced through interviews); it is also worth noting that – differently from products previously analysed – imports represent a substantial share of the Swiss market for round tomatoes.
Figure 4.15 – Annual evolution of total imports, exports and domestic production, round tomatoes, 2000-2014.
There is a clear prevalence of imports in non-managed periods (Figure 4.16); also the share of imports occurring in PoNMPs is significant. In-quota imports during managed periods account for a rather limited portion of total imports of round tomatoes, whereas out-of-quota imports are negligible.
TRQ administration for tomatoes, especially as far as the timing of import quota releases is concerned, is clearly implemented in a way to be consistent with the seasonality of domestic tomato production (Figure 4.17). TRQ administration appeared to play an important role in regulating imports of tomatoes, especially in the managed periods, when the bulk of domestic production is placed on the market.
57 The interest group IG Tomatoes was founded in 2015 to address the issue of oversupply and to stabilize prices through improved coordination of supply chain actors.
0
5 000
10 000
15 000
20 000
25 000
30 000
35 000
40 000
45 000
2000 2002 2004 2006 2008 2010 2012 2014
Ton
s
Total imports Total exports Domestic production

Policy evaluation of Tariff Rate Quotas
56
Figure 4.16 – Breakdown of total imports of round tomatoes by import regime, 2000-2014.
The increase in domestic production starting from 2003 is also visible in Figure 4.17 looking at the wider “basis” of the production peaks in summer both during and before/after the administered phase: this is due to the longer season of production.
In the same figure the decrease of imports is also clear both in the administered period – because of less TRQ released – and during the non-administered period: this is explainable by the availability of domestic production also during the non-administered period. Because of the demand for domestic products, these are present in the market thanks to the integration of the food chain (producers in the non-administered phase sell to the wholesalers to whom they will sell also during the administered phase).
0
5 000
10 000
15 000
20 000
25 000
30 000
35 000
40 000
45 000
2000 2001 2002 2003 2004 2005 2006 2007 2008 2009 2010 2011 2012 2013 2014
Ton
s
Out of quota import during the managed periods
In quota import during the managed periods
Import during the prolongation of the non-managed periods
Import in non-managed periods
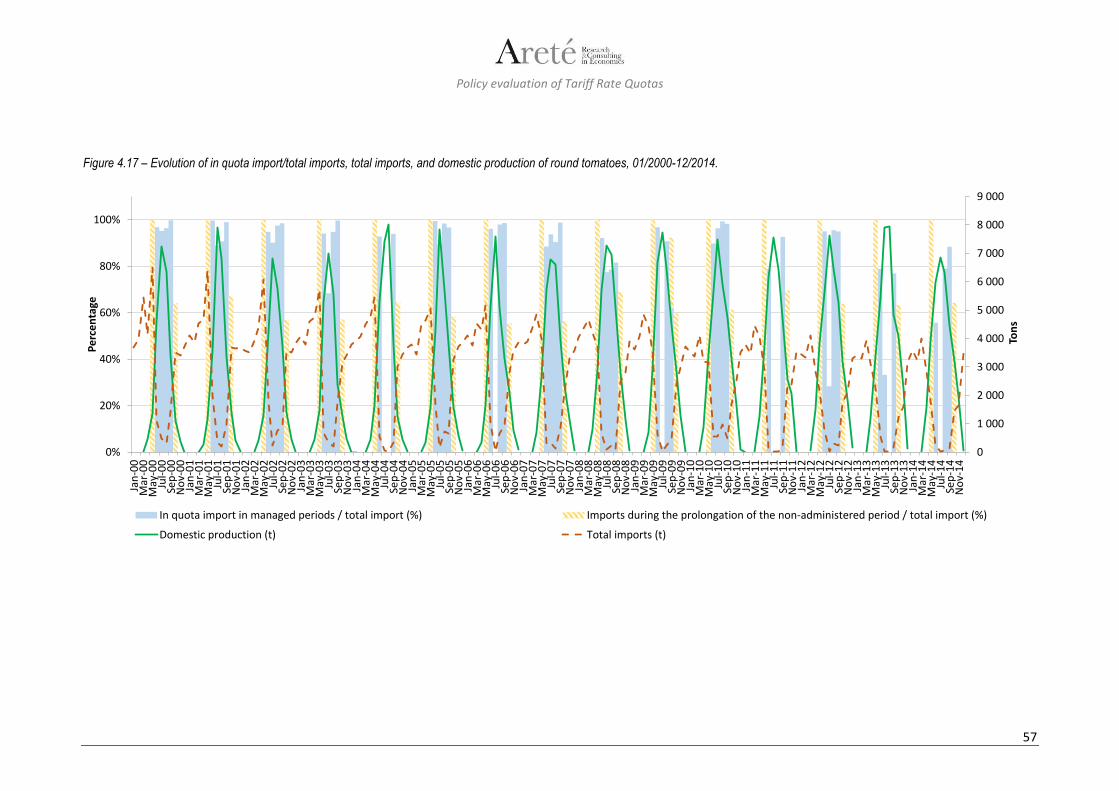
Policy evaluation of Tariff Rate Quotas
57
Figure 4.17 – Evolution of in quota import/total imports, total imports, and domestic production of round tomatoes, 01/2000-12/2014.
0
1 000
2 000
3 000
4 000
5 000
6 000
7 000
8 000
9 000
0%
20%
40%
60%
80%
100%
Jan
-00
Mar
-00
May
-00
Jul-
00
Sep
-00
No
v-0
0Ja
n-0
1M
ar-0
1M
ay-0
1Ju
l-0
1Se
p-0
1N
ov-
01
Jan
-02
Mar
-02
May
-02
Jul-
02
Sep
-02
No
v-0
2Ja
n-0
3M
ar-0
3M
ay-0
3Ju
l-0
3Se
p-0
3N
ov-
03
Jan
-04
Mar
-04
May
-04
Jul-
04
Sep
-04
No
v-0
4Ja
n-0
5M
ar-0
5M
ay-0
5Ju
l-0
5Se
p-0
5N
ov-
05
Jan
-06
Mar
-06
May
-06
Jul-
06
Sep
-06
No
v-0
6Ja
n-0
7M
ar-0
7M
ay-0
7Ju
l-0
7Se
p-0
7N
ov-
07
Jan
-08
Mar
-08
May
-08
Jul-
08
Sep
-08
No
v-0
8Ja
n-0
9M
ar-0
9M
ay-0
9Ju
l-0
9Se
p-0
9N
ov-
09
Jan
-10
Mar
-10
May
-10
Jul-
10
Sep
-10
No
v-1
0Ja
n-1
1M
ar-1
1M
ay-1
1Ju
l-1
1Se
p-1
1N
ov-
11
Jan
-12
Mar
-12
May
-12
Jul-
12
Sep
-12
No
v-1
2Ja
n-1
3M
ar-1
3M
ay-1
3Ju
l-1
3Se
p-1
3N
ov-
13
Jan
-14
Mar
-14
May
-14
Jul-
14
Sep
-14
No
v-1
4
Ton
s
Pe
rce
nta
ge
In quota import in managed periods / total import (%) Imports during the prolongation of the non-administered period / total import (%)
Domestic production (t) Total imports (t)

Policy evaluation of Tariff Rate Quotas
58
Statistical tests
The volumes of total imports in the administered and in the non-administered periods (the latter including PoNMP) were found to be statistically different in mean (at a 1% significance level). The mean of total imports in the administered period is lower than in the non-administered period (see also Annex 7.6.3), consistently with the fact that a great amount of imports actually occurs during the PoNMP and during the non-managed period, when round tomatoes can be imported at the favourable in-quota tariff without quantitative restrictions (which instead apply within quota releases in the managed period).
Also the volumes of domestic production were found to be statistically different in mean between the two periods (at a 1% significance level). The mean of domestic production in the administered period is higher than in the non-administered period: this is consistent with the design of TRQ administration for tomatoes, which takes into account the seasonality of domestic production (two-phase system). Import quota releases are actually used to regulate imports when domestic production is being placed on the market (managed period), whereas imports at the favourable in-quota tariff are unlimited when domestic production is unavailable (non-managed period / PoNMP).
Results of the econometric model
The econometric model, including both policy and price indicators, is based on the following variables:
Domestic Production (in tons)
Policy Intensity indicator (as defined at § 3.3.1)
Total imports (in tons)
Domestic consumer price (in CHF/ton)
Import unit value (in CHF/ton)
Figure 4.18 summarizes the results of the Granger causality test and of the impulse response function for tomatoes; further details as well as the complete set of results are reported in Annex 7.6.4.
The direct causality between domestic production and policy intensity, and the inverse causality between the latter and total imports, is perfectly consistent with the two-phase TRQ administration: as domestic production increases, imports are limited through quota releases (the higher out-of-quota tariff is applied beyond these); when domestic production gets close to zero, unlimited imports at the favourable in-quota tariff are allowed (this is the period when the most part of tomato imports takes place).
According to the impulse response function’s results, an increase in total imports is followed by a decrease in Swiss consumer prices and vice-versa. This further proves that the TRQ is administered in a way to regulate imports and to avoid an oversupply of the domestic market especially in the period when the bulk of domestic production is marketed (further considerations on the effect of TRQ administration on domestic prices will be made in the reply to question 1.2).

Policy evaluation of Tariff Rate Quotas
59
Figure 4.18 – Summary of results from econometric models
Source: Areté elaboration
Imports of round tomatoes are strictly related to the TRQ administration: no out-of-quota imports are basically registered because of the height of the out of quota tariff. During the managed period (maximum policy intensity: regulation of imports through quota releases and a high out-of-quota tariff), imports are relatively limited, to allow more favourable conditions for domestic production being placed on the market. In the non-managed period and in its prolongation, unlimited imports at the favourable in-quota tariff are allowed, and the most part of imports actually takes place in this period.
The assessment showed once again that the administration of the TRQ (two-phase system; bi-weekly import quota releases are possible) is carefully tailored to the dynamics of domestic production and demand, rather than having an impact on them. The TRQ is actually administered in a way to limit imports during the domestic tomato campaign, with a view to avoiding oversupply of the domestic market.
4.1.1.5 Apples
The focus of the evaluation is on apples for direct consumption: apples for processing are outside the scope of the study.
Switzerland has an ample domestic supply of apples, with surpluses on the national demand. Imports of apples for direct consumption are mainly linked to seasonal variations and/or quality and variety reasons. The regulation of imports via TRQ administration is based on a two-phase system, as for other fresh fruit and vegetables. It has to be noted that storage of apples can last much longer than for other fresh fruit and vegetables covered in the evaluation, but also that storage possibilities depend very much on the specific variety. The “out of season period”, when the TRQ for apples is not managed, only lasts for one month each year (June 15th to July 14th): it can be extended in case of important shortages of stored apples or, more frequently, when domestic harvest starts later than the 15th of July. In such cases, the FOAG allows unlimited imports at the favourable in-quota tariff. According to interviewed experts, the process leading supply chain actors to request import quota releases to FOAG is again a coordinated, consensus-based one: the inter-branch association FZEAF (Fachzentrum für die Ein- und Ausfuhr von Früchten) c/o SWISSCOFEL is in charge of such process.
Visual inspection of graphical representations
For a correct interpretation of the graph at Figure 4.19, it is important to consider that estimates of the Swiss domestic production are made following each harvest, and that volumes of apples for processing / juice making (“Mostäpfel/pommes à cidre”) are not included in the total production of each year.
The graph shows a slightly declining trend of domestic production and imports (even with a certain annual variability). It is important to observe that the peak in 2004 imports is due to a low domestic harvest.
* For fruit and vegetables (Tomato, Strawberries and Apples), the two phase period administration result in an assumed inverse causation between policy intensity and total imports
Assumed causal chain
Domestic production
Policy intensity*
Total imports
Swiss consumer price
Import Unit Value
Granger causality test
Good
Good
Good
Good
Impulse response function
Direct caus.
Inverse caus.
Direct causation
Inverse caus.
Consistent with assumptions in the causal chain
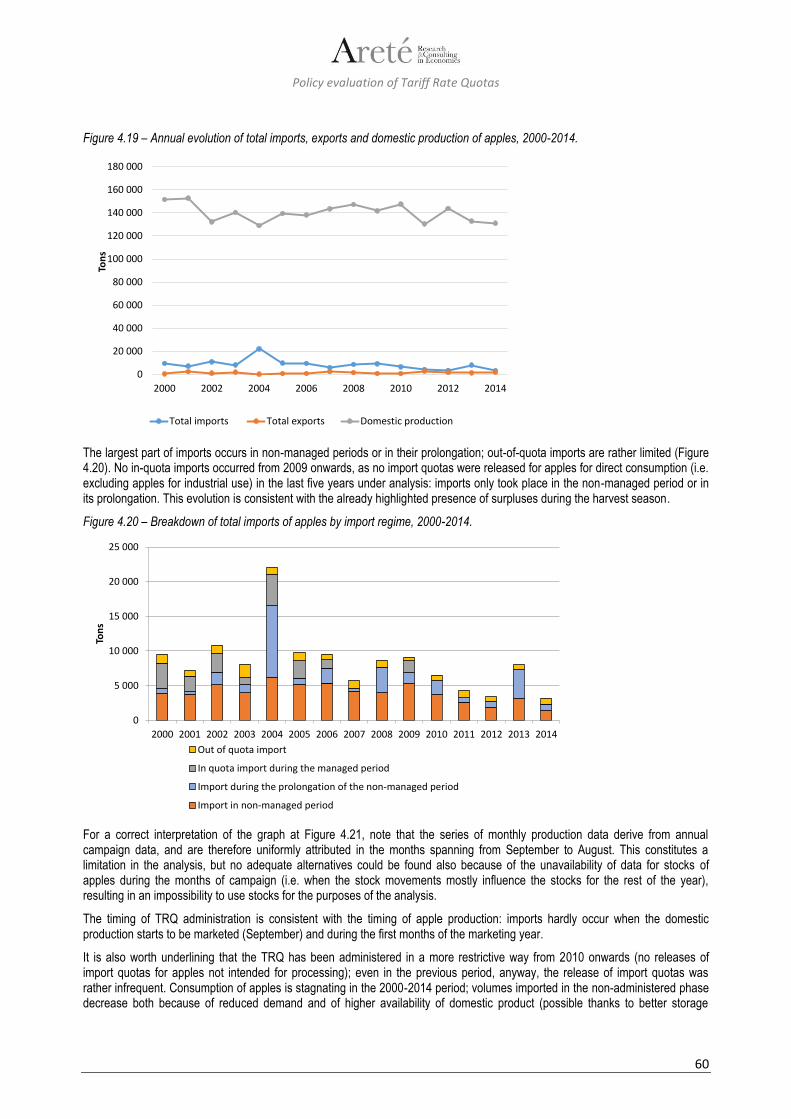
Policy evaluation of Tariff Rate Quotas
60
Figure 4.19 – Annual evolution of total imports, exports and domestic production of apples, 2000-2014.
The largest part of imports occurs in non-managed periods or in their prolongation; out-of-quota imports are rather limited (Figure 4.20). No in-quota imports occurred from 2009 onwards, as no import quotas were released for apples for direct consumption (i.e. excluding apples for industrial use) in the last five years under analysis: imports only took place in the non-managed period or in its prolongation. This evolution is consistent with the already highlighted presence of surpluses during the harvest season.
Figure 4.20 – Breakdown of total imports of apples by import regime, 2000-2014.
For a correct interpretation of the graph at Figure 4.21, note that the series of monthly production data derive from annual campaign data, and are therefore uniformly attributed in the months spanning from September to August. This constitutes a limitation in the analysis, but no adequate alternatives could be found also because of the unavailability of data for stocks of apples during the months of campaign (i.e. when the stock movements mostly influence the stocks for the rest of the year), resulting in an impossibility to use stocks for the purposes of the analysis.
The timing of TRQ administration is consistent with the timing of apple production: imports hardly occur when the domestic production starts to be marketed (September) and during the first months of the marketing year.
It is also worth underlining that the TRQ has been administered in a more restrictive way from 2010 onwards (no releases of import quotas for apples not intended for processing); even in the previous period, anyway, the release of import quotas was rather infrequent. Consumption of apples is stagnating in the 2000-2014 period; volumes imported in the non-administered phase decrease both because of reduced demand and of higher availability of domestic product (possible thanks to better storage
0
20 000
40 000
60 000
80 000
100 000
120 000
140 000
160 000
180 000
2000 2002 2004 2006 2008 2010 2012 2014
Ton
s
Total imports Total exports Domestic production
0
5 000
10 000
15 000
20 000
25 000
2000 2001 2002 2003 2004 2005 2006 2007 2008 2009 2010 2011 2012 2013 2014
Ton
s
Out of quota import
In quota import during the managed period
Import during the prolongation of the non-managed period
Import in non-managed period

Policy evaluation of Tariff Rate Quotas
61
possibilities); in addition, the non-negligible size of imports in the prolongation of the non-administered phase is the result of the use of this option (flexible and with limited administrative burdens) to fit imports with the precise quantities desired by importers. Finally note that, since the non-managed period starts and ends at the middle of the month, when monthly in quota imports or imports in the PoNMP are lower than 100%, this is due to imports occurring, within that month, in the non-managed period (see also Figure 4.43).
The rather reduced frequency of application of the relevant policy over the period considered for the assessment constitutes a challenge for its evaluation.
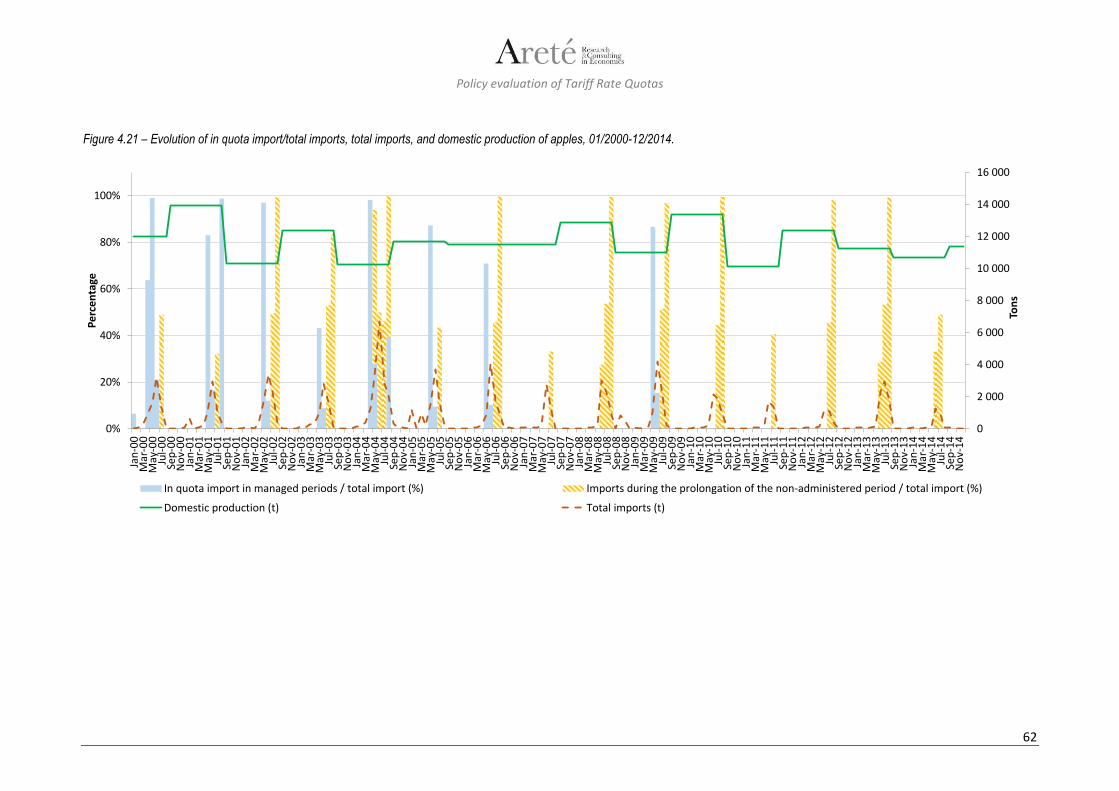
Policy evaluation of Tariff Rate Quotas
62
Figure 4.21 – Evolution of in quota import/total imports, total imports, and domestic production of apples, 01/2000-12/2014.
0
2 000
4 000
6 000
8 000
10 000
12 000
14 000
16 000
0%
20%
40%
60%
80%
100%
Jan
-00
Mar
-00
May
-00
Jul-
00
Sep
-00
No
v-0
0Ja
n-0
1M
ar-0
1M
ay-0
1Ju
l-0
1Se
p-0
1N
ov-
01
Jan
-02
Mar
-02
May
-02
Jul-
02
Sep
-02
No
v-0
2Ja
n-0
3M
ar-0
3M
ay-0
3Ju
l-0
3Se
p-0
3N
ov-
03
Jan
-04
Mar
-04
May
-04
Jul-
04
Sep
-04
No
v-0
4Ja
n-0
5M
ar-0
5M
ay-0
5Ju
l-0
5Se
p-0
5N
ov-
05
Jan
-06
Mar
-06
May
-06
Jul-
06
Sep
-06
No
v-0
6Ja
n-0
7M
ar-0
7M
ay-0
7Ju
l-0
7Se
p-0
7N
ov-
07
Jan
-08
Mar
-08
May
-08
Jul-
08
Sep
-08
No
v-0
8Ja
n-0
9M
ar-0
9M
ay-0
9Ju
l-0
9Se
p-0
9N
ov-
09
Jan
-10
Mar
-10
May
-10
Jul-
10
Sep
-10
No
v-1
0Ja
n-1
1M
ar-1
1M
ay-1
1Ju
l-1
1Se
p-1
1N
ov-
11
Jan
-12
Mar
-12
May
-12
Jul-
12
Sep
-12
No
v-1
2Ja
n-1
3M
ar-1
3M
ay-1
3Ju
l-1
3Se
p-1
3N
ov-
13
Jan
-14
Mar
-14
May
-14
Jul-
14
Sep
-14
No
v-1
4
Ton
s
Pe
rce
nta
ge
In quota import in managed periods / total import (%) Imports during the prolongation of the non-administered period / total import (%)
Domestic production (t) Total imports (t)
Policy evaluation of Tariff Rate Quotas
63
Statistical tests
The volumes of total imports are statistically different in mean (at a 1% significance level) between the managed and non-managed periods (the latter includes PoNMP). The mean of total imports in the administered period is lower than in the non-administered period. This is consistent with the fact that a great amount of imports occurs during non-managed periods or in the PoNMPs (see also Annex 7.7.3).
The volumes of domestic production are only available on a campaign-basis: no statistical tests on such data series could hence be performed.
Results of the econometric model
The econometric model used for apples was originally intended to combine both policy and price variables, more specifically:
Domestic Production
Policy Intensity indicator (as defined at § 3.3.1)
Total imports (in tons)
Domestic consumer price
Foreign producer price (as exogenous variable)
Despite this, the unavailability of monthly data for the domestic production, the fact that Swiss consumer price data series were found to be non-stationary58, and the foreign producer price included in the model as exogenous variable, allowed the analysis to provide only general indications on the relationship between the policy intensity indicator and total imports.
Figure 4.22 summarizes the results of the Granger causality test and of the impulse response function for apples; further details as well as the complete set of results are reported in Annex 7.7.4.
As already highlighted, the model used suffered from series of limitations, mainly due to the fact that non-administered period only lasts one month: the only tested causal relationship was the one between policy intensity and total imports, which resulted to be solid.
The impulse response function on the above relationship showed an inverse correlation at the first lag only, and a direct one at the third lag. This result can be deemed consistent with the timing of TRQ administration for apples. When the policy intensity decreases (PoNMP - usually of limited duration - before the start of the domestic harvest), imports made to “bridge” the gap before domestic production becomes available usually peak (inverse correlation at first lag between policy intensity and total imports). With the start of the domestic harvest season, the policy intensity immediately reaches its maximum: the TRQ starts to be managed, and imports are limited by quota releases (which haven’t even been made from 2010 onwards), and by the increasing availability of domestic production (at the third lag, the stocks of domestic apples are at their peak, and there is no need to import apples for direct consumption; direct correlation at third lag between policy intensity and total imports).
58 A stationary process is a stochastic process that, after temporary shocks, tends to drift towards its long-term mean (mean-reverting process).

Policy evaluation of Tariff Rate Quotas
64
Figure 4.22 – Summary of results from econometric models
Source: Areté elaboration In spite of the challenges posed by the rather infrequent administration of the TRQ in the period considered for the assessment, the evaluation highlighted that imports of apples for direct consumption strictly depend on TRQ administration. During the managed period (maximum policy intensity: regulation of imports through rather infrequent quota releases and a high out-of-quota tariff), imports are limited and mainly linked to quality / variety assortment reasons: in this way, TRQ administration helps the placement of domestic production on a somewhat oversupplied market. In each year, the two-phase TRQ administration system allows significant imports at the favourable in-quota tariff only in the short non-managed period and in its prolongation: this is usually made to “bridge the gap” whenever the Swiss apple harvest is late.
As for the impact of the TRQ on domestic production and consumption of apples, the assessment suffered from some limitations mainly due to the unavailability of monthly production data. This notwithstanding, information on the process leading to requests of import quota releases by supply chain actors, and the rather infrequent administration of the TRQ itself, suggest that the TRQ is managed in a way to adapt to domestic production and demand conditions (already ample availability of domestic apples; need of imports mainly linked to quality / variety assortment reasons), rather than having an impact on them. This conclusion is reinforced by the rather limited weight of imports against domestic production: imported apples can be significant on the Swiss market only when domestic harvest is late, and anyway only for a short period.
4.1.1.6 Strawberries
The focus of the evaluation is on strawberries for direct consumption: strawberries for processing are outside the scope of the study.
The main production period of domestic strawberries is only three and a half months long; this is the period when their TRQ is managed. Outside this period, unlimited imports at the in-quota tariff are allowed. Within the managed period, import quota releases can be made twice a week. The process leading the supply chain actors to request import quota releases to FOAG is – also in this case – a very coordinated one and (according to information sourced through interviews) it takes place in a cooperative environment easily allowing participants to find a consensus (differently from the late 1990s, when negotiations between producers, traders and retailers could be controversial mainly because of less trust between producers – who sometimes exaggerated about the prospect yields to reduce the quota opening – and traders – who were less available to adjust imports once domestic supply started to exceed demand). Decisions on the requested volumes are made bi-weekly within the reference association FZEAF (Fachzentrum für die Ein- und Ausfuhr von Früchten) c/o SWISSCOFEL, and are based on consumption data for the same week of the previous year and on up-to-date information on available production volumes. It is important to underline that strawberry consumption in Switzerland follows a seasonal pattern: it is very limited in autumn and winter, and it increases in spring to peak in May/June, when domestic production becomes available.
Granger causality test
Good
Impulse response function
Inverse // direct caus.***
* Domestic production data not available on a monthly basis and not included in the model** Exogenous variable*** Inverse causation identified at first lag only, direct causation identified at III lag, when policy intensity decreases but stocks from the Swiss campaign are also at their peak and there is no need to further import.
Assumed causal chain
Domestic production*
Policy intensity
Total imports
International producer price**
Swiss consumer price
not statistically significant
Direct caus.
Consistent with assumptions in the causal chain
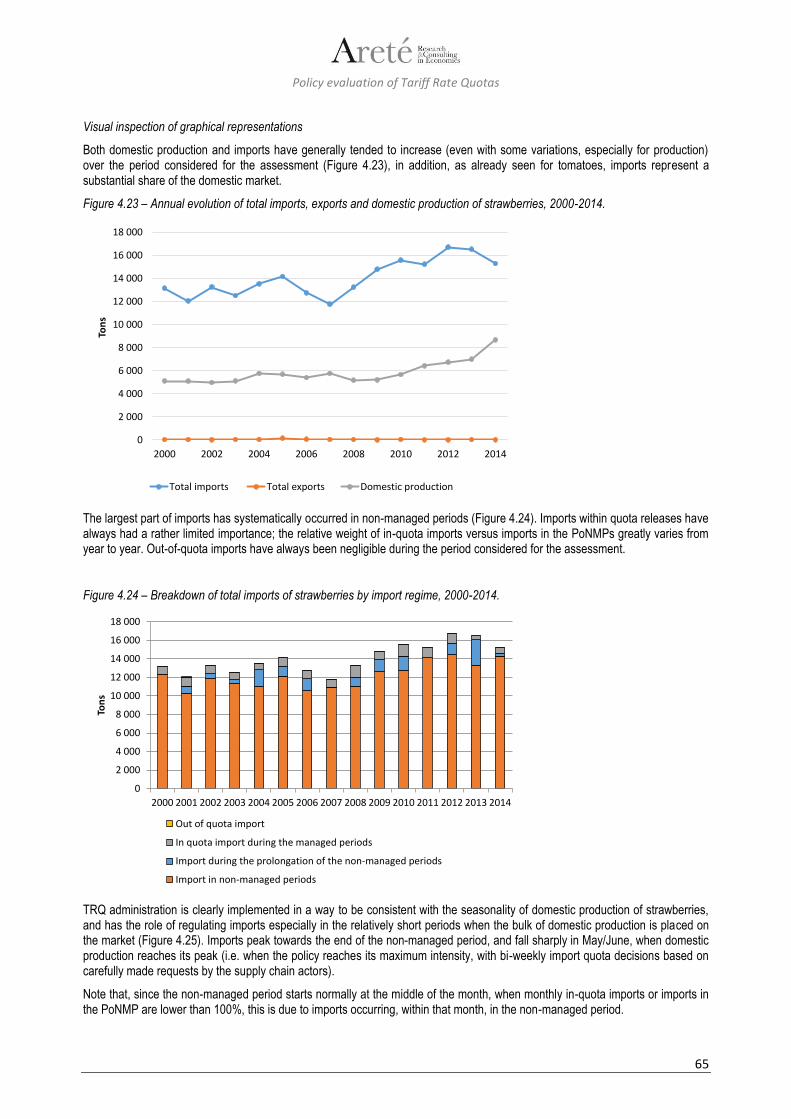
Policy evaluation of Tariff Rate Quotas
65
Visual inspection of graphical representations
Both domestic production and imports have generally tended to increase (even with some variations, especially for production) over the period considered for the assessment (Figure 4.23), in addition, as already seen for tomatoes, imports represent a substantial share of the domestic market.
Figure 4.23 – Annual evolution of total imports, exports and domestic production of strawberries, 2000-2014.
The largest part of imports has systematically occurred in non-managed periods (Figure 4.24). Imports within quota releases have always had a rather limited importance; the relative weight of in-quota imports versus imports in the PoNMPs greatly varies from year to year. Out-of-quota imports have always been negligible during the period considered for the assessment.
Figure 4.24 – Breakdown of total imports of strawberries by import regime, 2000-2014.
TRQ administration is clearly implemented in a way to be consistent with the seasonality of domestic production of strawberries, and has the role of regulating imports especially in the relatively short periods when the bulk of domestic production is placed on the market (Figure 4.25). Imports peak towards the end of the non-managed period, and fall sharply in May/June, when domestic production reaches its peak (i.e. when the policy reaches its maximum intensity, with bi-weekly import quota decisions based on carefully made requests by the supply chain actors).
Note that, since the non-managed period starts normally at the middle of the month, when monthly in-quota imports or imports in the PoNMP are lower than 100%, this is due to imports occurring, within that month, in the non-managed period.
0
2 000
4 000
6 000
8 000
10 000
12 000
14 000
16 000
18 000
2000 2002 2004 2006 2008 2010 2012 2014
Ton
s
Total imports Total exports Domestic production
0
2 000
4 000
6 000
8 000
10 000
12 000
14 000
16 000
18 000
2000 2001 2002 2003 2004 2005 2006 2007 2008 2009 2010 2011 2012 2013 2014
Ton
s
Out of quota import
In quota import during the managed periods
Import during the prolongation of the non-managed periods
Import in non-managed periods
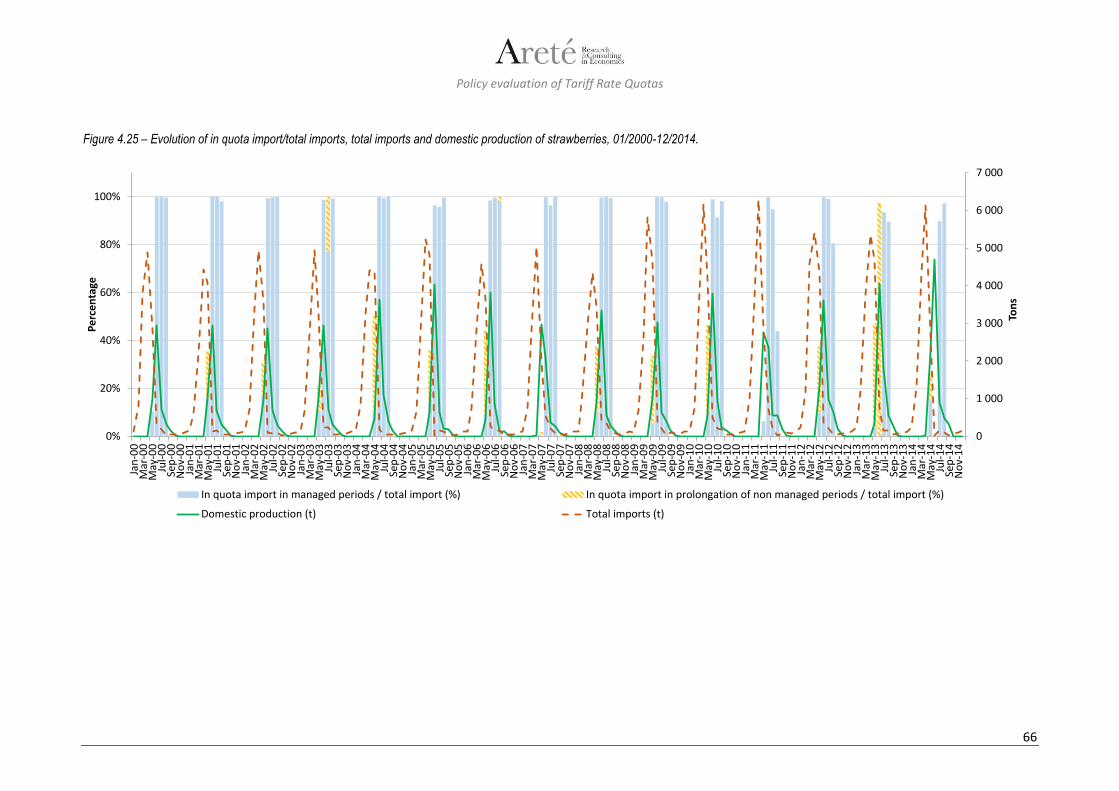
Policy evaluation of Tariff Rate Quotas
66
Figure 4.25 – Evolution of in quota import/total imports, total imports and domestic production of strawberries, 01/2000-12/2014.
0
1 000
2 000
3 000
4 000
5 000
6 000
7 000
0%
20%
40%
60%
80%
100%
Jan
-00
Mar
-00
May
-00
Jul-
00
Sep
-00
No
v-0
0Ja
n-0
1M
ar-0
1M
ay-0
1Ju
l-0
1Se
p-0
1N
ov-
01
Jan
-02
Mar
-02
May
-02
Jul-
02
Sep
-02
No
v-0
2Ja
n-0
3M
ar-0
3M
ay-0
3Ju
l-0
3Se
p-0
3N
ov-
03
Jan
-04
Mar
-04
May
-04
Jul-
04
Sep
-04
No
v-0
4Ja
n-0
5M
ar-0
5M
ay-0
5Ju
l-0
5Se
p-0
5N
ov-
05
Jan
-06
Mar
-06
May
-06
Jul-
06
Sep
-06
No
v-0
6Ja
n-0
7M
ar-0
7M
ay-0
7Ju
l-0
7Se
p-0
7N
ov-
07
Jan
-08
Mar
-08
May
-08
Jul-
08
Sep
-08
No
v-0
8Ja
n-0
9M
ar-0
9M
ay-0
9Ju
l-0
9Se
p-0
9N
ov-
09
Jan
-10
Mar
-10
May
-10
Jul-
10
Sep
-10
No
v-1
0Ja
n-1
1M
ar-1
1M
ay-1
1Ju
l-1
1Se
p-1
1N
ov-
11
Jan
-12
Mar
-12
May
-12
Jul-
12
Sep
-12
No
v-1
2Ja
n-1
3M
ar-1
3M
ay-1
3Ju
l-1
3Se
p-1
3N
ov-
13
Jan
-14
Mar
-14
May
-14
Jul-
14
Sep
-14
No
v-1
4
Ton
s
Pe
rce
nta
ge
In quota import in managed periods / total import (%) In quota import in prolongation of non managed periods / total import (%)
Domestic production (t) Total imports (t)
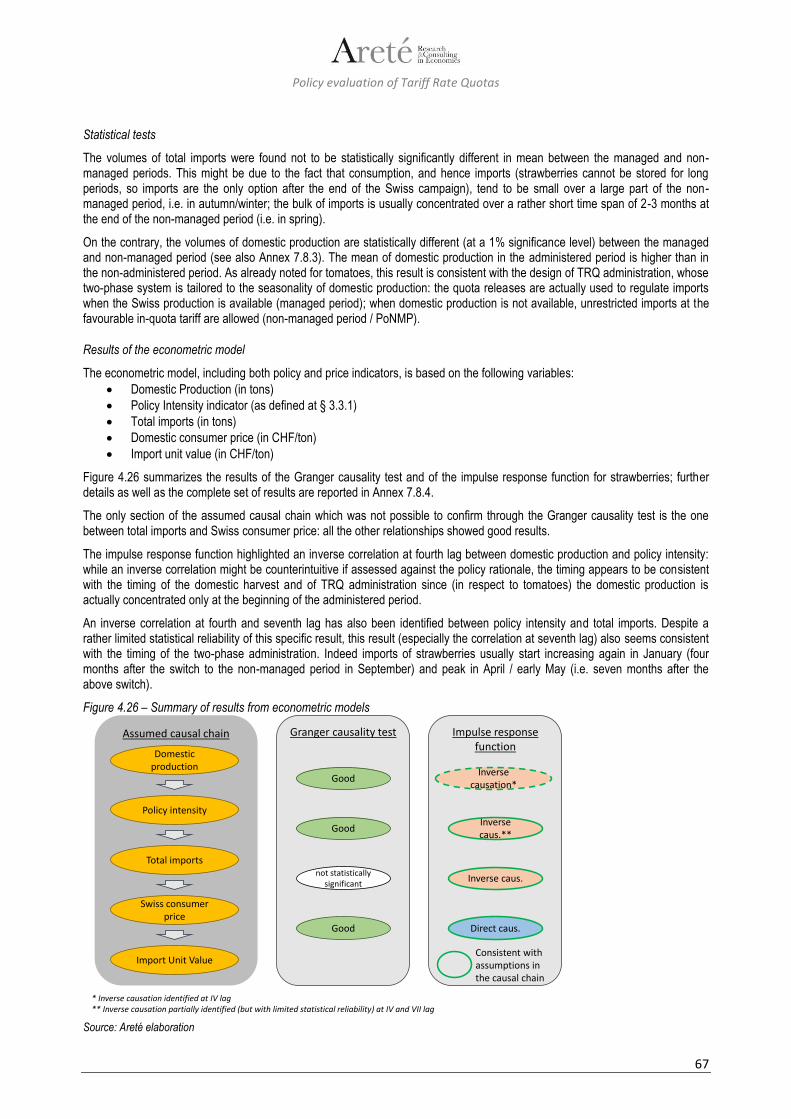
Policy evaluation of Tariff Rate Quotas
67
Statistical tests
The volumes of total imports were found not to be statistically significantly different in mean between the managed and non-managed periods. This might be due to the fact that consumption, and hence imports (strawberries cannot be stored for long periods, so imports are the only option after the end of the Swiss campaign), tend to be small over a large part of the non-managed period, i.e. in autumn/winter; the bulk of imports is usually concentrated over a rather short time span of 2-3 months at the end of the non-managed period (i.e. in spring).
On the contrary, the volumes of domestic production are statistically different (at a 1% significance level) between the managed and non-managed period (see also Annex 7.8.3). The mean of domestic production in the administered period is higher than in the non-administered period. As already noted for tomatoes, this result is consistent with the design of TRQ administration, whose two-phase system is tailored to the seasonality of domestic production: the quota releases are actually used to regulate imports when the Swiss production is available (managed period); when domestic production is not available, unrestricted imports at the favourable in-quota tariff are allowed (non-managed period / PoNMP).
Results of the econometric model
The econometric model, including both policy and price indicators, is based on the following variables:
Domestic Production (in tons)
Policy Intensity indicator (as defined at § 3.3.1)
Total imports (in tons)
Domestic consumer price (in CHF/ton)
Import unit value (in CHF/ton)
Figure 4.26 summarizes the results of the Granger causality test and of the impulse response function for strawberries; further details as well as the complete set of results are reported in Annex 7.8.4.
The only section of the assumed causal chain which was not possible to confirm through the Granger causality test is the one between total imports and Swiss consumer price: all the other relationships showed good results.
The impulse response function highlighted an inverse correlation at fourth lag between domestic production and policy intensity: while an inverse correlation might be counterintuitive if assessed against the policy rationale, the timing appears to be consistent with the timing of the domestic harvest and of TRQ administration since (in respect to tomatoes) the domestic production is actually concentrated only at the beginning of the administered period.
An inverse correlation at fourth and seventh lag has also been identified between policy intensity and total imports. Despite a rather limited statistical reliability of this specific result, this result (especially the correlation at seventh lag) also seems consistent with the timing of the two-phase administration. Indeed imports of strawberries usually start increasing again in January (four months after the switch to the non-managed period in September) and peak in April / early May (i.e. seven months after the above switch).
Figure 4.26 – Summary of results from econometric models
Source: Areté elaboration
Assumed causal chain
Domestic production
Policy intensity
Total imports
Swiss consumer price
Import Unit Value
Granger causality test
Good
Good
Good
Impulse response function
Direct caus.
Inverse caus.not statistically
significant
Inverse causation*
Inverse caus.**
* Inverse causation identified at IV lag** Inverse causation partially identified (but with limited statistical reliability) at IV and VII lag
Consistent with assumptions in the causal chain
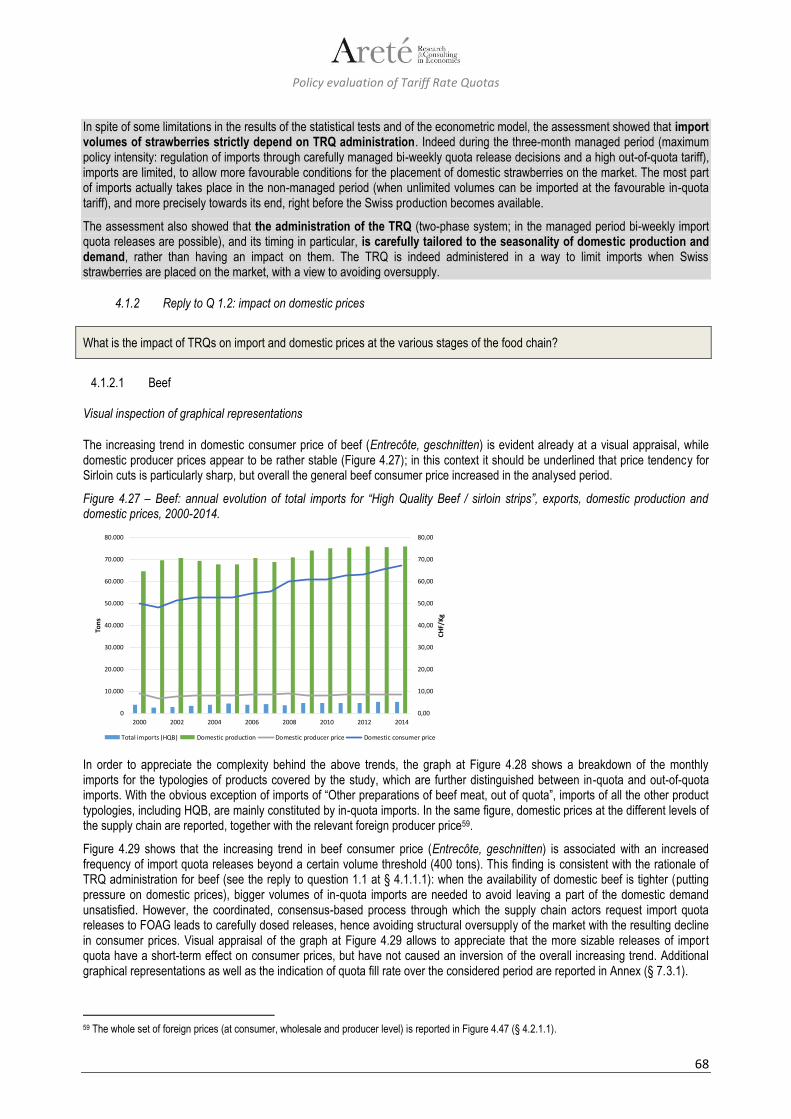
Policy evaluation of Tariff Rate Quotas
68
In spite of some limitations in the results of the statistical tests and of the econometric model, the assessment showed that import volumes of strawberries strictly depend on TRQ administration. Indeed during the three-month managed period (maximum policy intensity: regulation of imports through carefully managed bi-weekly quota release decisions and a high out-of-quota tariff), imports are limited, to allow more favourable conditions for the placement of domestic strawberries on the market. The most part of imports actually takes place in the non-managed period (when unlimited volumes can be imported at the favourable in-quota tariff), and more precisely towards its end, right before the Swiss production becomes available.
The assessment also showed that the administration of the TRQ (two-phase system; in the managed period bi-weekly import quota releases are possible), and its timing in particular, is carefully tailored to the seasonality of domestic production and demand, rather than having an impact on them. The TRQ is indeed administered in a way to limit imports when Swiss strawberries are placed on the market, with a view to avoiding oversupply.
4.1.2 Reply to Q 1.2: impact on domestic prices
What is the impact of TRQs on import and domestic prices at the various stages of the food chain?
4.1.2.1 Beef
Visual inspection of graphical representations
The increasing trend in domestic consumer price of beef (Entrecôte, geschnitten) is evident already at a visual appraisal, while domestic producer prices appear to be rather stable (Figure 4.27); in this context it should be underlined that price tendency for Sirloin cuts is particularly sharp, but overall the general beef consumer price increased in the analysed period.
Figure 4.27 – Beef: annual evolution of total imports for “High Quality Beef / sirloin strips”, exports, domestic production and domestic prices, 2000-2014.
In order to appreciate the complexity behind the above trends, the graph at Figure 4.28 shows a breakdown of the monthly imports for the typologies of products covered by the study, which are further distinguished between in-quota and out-of-quota imports. With the obvious exception of imports of “Other preparations of beef meat, out of quota”, imports of all the other product typologies, including HQB, are mainly constituted by in-quota imports. In the same figure, domestic prices at the different levels of the supply chain are reported, together with the relevant foreign producer price59.
Figure 4.29 shows that the increasing trend in beef consumer price (Entrecôte, geschnitten) is associated with an increased frequency of import quota releases beyond a certain volume threshold (400 tons). This finding is consistent with the rationale of TRQ administration for beef (see the reply to question 1.1 at § 4.1.1.1): when the availability of domestic beef is tighter (putting pressure on domestic prices), bigger volumes of in-quota imports are needed to avoid leaving a part of the domestic demand unsatisfied. However, the coordinated, consensus-based process through which the supply chain actors request import quota releases to FOAG leads to carefully dosed releases, hence avoiding structural oversupply of the market with the resulting decline in consumer prices. Visual appraisal of the graph at Figure 4.29 allows to appreciate that the more sizable releases of import quota have a short-term effect on consumer prices, but have not caused an inversion of the overall increasing trend. Additional graphical representations as well as the indication of quota fill rate over the considered period are reported in Annex (§ 7.3.1).
59 The whole set of foreign prices (at consumer, wholesale and producer level) is reported in Figure 4.47 (§ 4.2.1.1).
0,00
10,00
20,00
30,00
40,00
50,00
60,00
70,00
80,00
0
10.000
20.000
30.000
40.000
50.000
60.000
70.000
80.000
2000 2002 2004 2006 2008 2010 2012 2014
CH
F/K
g
Ton
s
Total imports (HQB) Domestic production Domestic producer price Domestic consumer price

Policy evaluation of Tariff Rate Quotas
69
Figure 4.28 – Beef: evolution of total in-quota and out-of-quota imports for different sub-products, domestic consumer price, import unit value and external wholesale price, 2000-2014.
03691215182124273033363942454851545760636669727578
0
500
1 000
1 500
2 000
2 500
3 000
Jan
-00
Mar
-00
May
-00
Jul-
00
Sep
-00
No
v-0
0Ja
n-0
1M
ar-0
1M
ay-0
1Ju
l-0
1Se
p-0
1N
ov-
01
Jan
-02
Mar
-02
May
-02
Jul-
02
Sep
-02
No
v-0
2Ja
n-0
3M
ar-0
3M
ay-0
3Ju
l-0
3Se
p-0
3N
ov-
03
Jan
-04
Mar
-04
May
-04
Jul-
04
Sep
-04
No
v-0
4Ja
n-0
5M
ar-0
5M
ay-0
5Ju
l-0
5Se
p-0
5N
ov-
05
Jan
-06
Mar
-06
May
-06
Jul-
06
Sep
-06
No
v-0
6Ja
n-0
7M
ar-0
7M
ay-0
7Ju
l-0
7Se
p-0
7N
ov-
07
Jan
-08
Mar
-08
May
-08
Jul-
08
Sep
-08
No
v-0
8Ja
n-0
9M
ar-0
9M
ay-0
9Ju
l-0
9Se
p-0
9N
ov-
09
Jan
-10
Mar
-10
May
-10
Jul-
10
Sep
-10
No
v-1
0Ja
n-1
1M
ar-1
1M
ay-1
1Ju
l-1
1Se
p-1
1N
ov-
11
Jan
-12
Mar
-12
May
-12
Jul-
12
Sep
-12
No
v-1
2Ja
n-1
3M
ar-1
3M
ay-1
3Ju
l-1
3Se
p-1
3N
ov-
13
Jan
-14
Mar
-14
May
-14
Jul-
14
Sep
-14
No
v-1
4
CH
F/K
g
Ton
s
In quota imports - High quality beef (t) Out of quota imports - High quality beef (t)In quota imports - Pistolas (t) Out of quota imports - Pistolas (t)In quota imports - MFP (t) Out of quota imports - MFP (t)In quota imports - CFP (t) Out of quota imports - CFP (t)In quota imports - Other beef (t) Out of quota imports - Other beef (t)Swiss consumer price (Entrecôte, geschnitten) (CHF/kg) Swiss wholesale price Rind+Muni Hinterviertel (CHF/Kg)Swiss producer price Muni QM (CHF/KG) Import unit value (HQB) (CHF/Kg)German wholesale price (Muni Filets o Kette) (CHF/Kg)
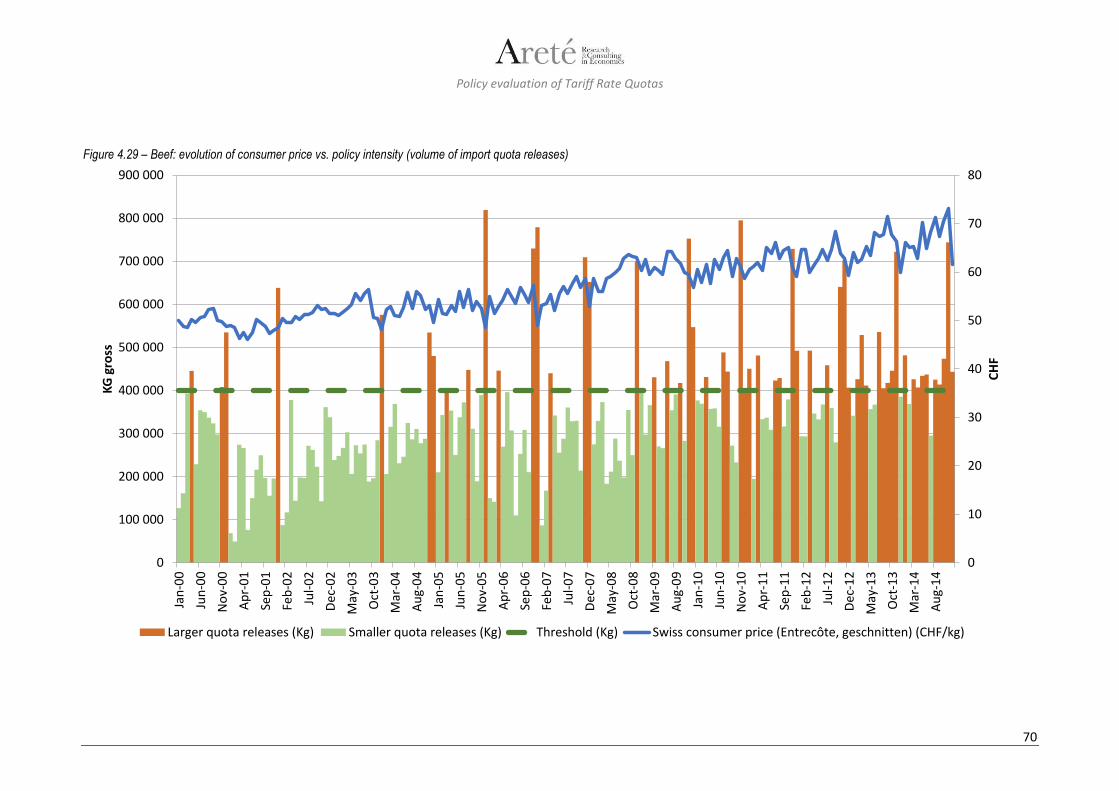
Policy evaluation of Tariff Rate Quotas
70
Figure 4.29 – Beef: evolution of consumer price vs. policy intensity (volume of import quota releases)
0
10
20
30
40
50
60
70
80
0
100 000
200 000
300 000
400 000
500 000
600 000
700 000
800 000
900 000Ja
n-0
0
Jun
-00
No
v-0
0
Ap
r-0
1
Sep
-01
Feb
-02
Jul-
02
Dec
-02
May
-03
Oct
-03
Mar
-04
Au
g-0
4
Jan
-05
Jun
-05
No
v-0
5
Ap
r-0
6
Sep
-06
Feb
-07
Jul-
07
Dec
-07
May
-08
Oct
-08
Mar
-09
Au
g-0
9
Jan
-10
Jun
-10
No
v-1
0
Ap
r-1
1
Sep
-11
Feb
-12
Jul-
12
Dec
-12
May
-13
Oct
-13
Mar
-14
Au
g-1
4
CH
F
KG
gro
ss
Larger quota releases (Kg) Smaller quota releases (Kg) Threshold (Kg) Swiss consumer price (Entrecôte, geschnitten) (CHF/kg)

Policy evaluation of Tariff Rate Quotas
71
Statistical tests
All the considered price series are significantly different in mean (at a 1% significance level, with the exception of domestic producer price, for which the test is significant at a 5% significance level) according to whether “small” or “large” quota releases are made. All the domestic prices, at all levels of the supply chain (consumer, wholesale, producer), show a higher mean when “large” quota releases are made than when “small” ones are made; this implies that TRQ releases are carefully made to avoid putting pressure on domestic prices and to grant products in presence of serious shortages of domestic supply. The same result applies to the import unit value (see also Annex 7.3.3). This further reinforces the elements emerged from visual appraisal of the graph at Figure 4.28, confirming the fact that the most sizable import quota releases are made to ease situations of tighter availability of domestic supply, which put pressure on domestic prices.
Additional statistical tests were performed on domestic prices at all the levels of the supply chain, with reference to pre-2007 and post-2007 period, in order to evaluate potential impacts of the switch to auctions: the difference in the series of (de-trended) domestic prices in the two periods was found to be not statistically significant.
Results of the econometric price transmission model
The “econometric price transmission model” was based on the following variables:
Domestic producer price (in CHF/ton)
Domestic wholesale price (in CHF/ton)
Domestic consumer price (in CHF/ton)
Total imports / Policy Intensity indicator60 (as defined at § 3.3.1)
Import unit value (in CHF/ton)
In the “policy model” for beef used for question 1.1 (see §4.1.1.1), the domestic consumer price was chosen as the most representative variable able to influence policy intensity; even if this choice is correct in principle, since it is presumable that operators look at domestic consumer price as a “synthetic indicator” of the market conditions, it is important to highlight that both literature review and insights from interviews indicated that the supply chain actors consider a wider combination of variables (domestic supply and demand, import volumes in the previous period, prices at other stages of the supply chain, etc.) when they have to decide (whether, when and) to what extent they need an import quota release. This element is well-confirmed by the Granger causality test, indicating good levels of causality (higher F value) also for cross-relationships between prices, and between policy intensity and prices, as reported in Annex 7.3.4. (Table 7.42).
Figure 4.30 summarizes the results of the Granger causality test and of the impulse response function for beef; further details as well as the complete set of results are reported in Annex 7.3.4.
In this context, the assumed causal chain underlines the overall high level of causality along the supply chain with specific reference to the vertical price transmission (VPT). The impulse response function shows a direct correlation between the different price variables, and an inverse correlation between total imports and import unit values. This indicates, on one hand, that prices are vertically transmitted along the supply chain (although less than proportionally, see next paragraph and Figure 4.31), and, on the other hand, that an increase in imports is usually accompanied by a decrease of the import unit value, mainly because of a lower weight of specialties/high quality products. Finally, no statistically significant causality emerged between the Swiss consumer price and total imports. In this context, it is anyway worth noting that econometric policy models presented in § 4.1.1.1 revealed a direct correlation between the same two variables; this relationship – consistent with the expected functioning of the TRQ system – is less evident once other price series are included in the model.
60 On the basis of how policy intensity was defined for HQB, total imports and the policy indicator systematically assume extremely similar values (due to negligible out-of-quota imports), and are hence considered as a single variable (only total imports were included in the econometric models).

Policy evaluation of Tariff Rate Quotas
72
Figure 4.30 – Summary of results from econometric price transmission model for beef
Source: Areté elaboration
The presence of asymmetrical price transmission within the Swiss beef supply chain was tested through an ad hoc switching regimes VAR model; the same causal chain used for the price transmission model was assumed, distinguishing between increases and decreases in prices. The analysis highlighted the presence of a generic less than proportional vertical price transmission between prices along the supply chain; however, vertical price transmission resulted to be asymmetrical as it was greater in presence of increases in producer price than in presence of decreases in such price, consistently with empirical evidence from other studies on asymmetric vertical price transmission in the food supply chains. In other words, when the producer price rose, the consequent increase of consumer price was found to be generally greater than the corresponding decrease in case of a drop in the producer price. In the specific Swiss context, it is worth to highlight the central role of vertically integrated retailers in the supply chain: the two main players at the retail stage are also among the top importers, traders and processors (see also § 4.3.1.1); the asymmetrical price transmission is therefore one of the expectable effects of this market structure whose influence on producer prices is indeed high.
Figure 4.31 – Summary of results from econometric asymmetrical price transmission models
Source: Areté elaboration
All the elements emerged from the assessment (visual inspection of graphical representations; statistical tests; results of econometric price transmission model) show internal coherence and are consistent with the expected functioning of the domestic market and with the rationale of TRQ administration for beef.
Assumed causal chain
Swiss producer price
Swiss wholesale price
Swiss consumer price
Total import
Import Unit Value
Granger causality test
Good
Good
Good
Good
* Direct causation identified at III and VII lag
Impulse response function
Direct causation
Direct caus.
Inverse caus.*
not statistically significant
Consistent with assumptions in the causal chain
Assumed causal chain
Swiss producer price
Swiss wholesale price
Swiss consumer price
Granger causality test
Good
Good
Asymmetric price transmission
Changes in producer price are transmitted less than proportionally to consumer price, but an increase in producer price is transmitted to consumer price more than a decrease on the former to the second.
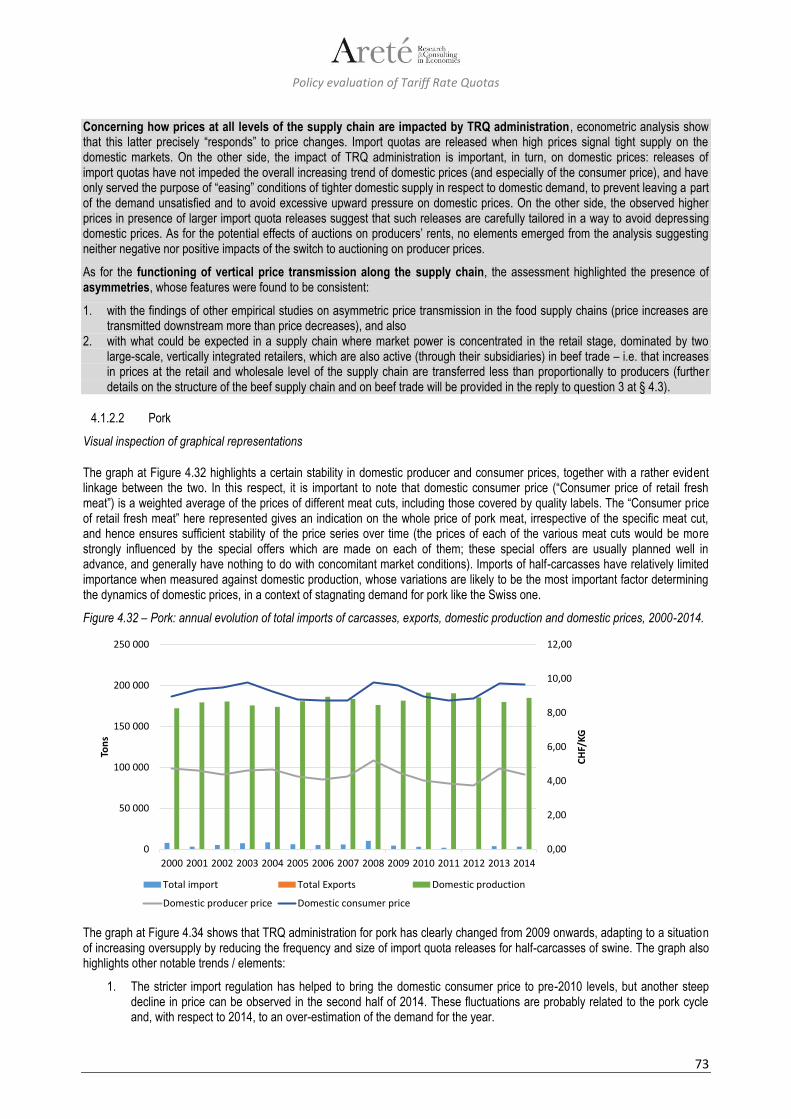
Policy evaluation of Tariff Rate Quotas
73
Concerning how prices at all levels of the supply chain are impacted by TRQ administration, econometric analysis show that this latter precisely “responds” to price changes. Import quotas are released when high prices signal tight supply on the domestic markets. On the other side, the impact of TRQ administration is important, in turn, on domestic prices: releases of import quotas have not impeded the overall increasing trend of domestic prices (and especially of the consumer price), and have only served the purpose of “easing” conditions of tighter domestic supply in respect to domestic demand, to prevent leaving a part of the demand unsatisfied and to avoid excessive upward pressure on domestic prices. On the other side, the observed higher prices in presence of larger import quota releases suggest that such releases are carefully tailored in a way to avoid depressing domestic prices. As for the potential effects of auctions on producers’ rents, no elements emerged from the analysis suggesting neither negative nor positive impacts of the switch to auctioning on producer prices.
As for the functioning of vertical price transmission along the supply chain, the assessment highlighted the presence of asymmetries, whose features were found to be consistent:
1. with the findings of other empirical studies on asymmetric price transmission in the food supply chains (price increases are transmitted downstream more than price decreases), and also
2. with what could be expected in a supply chain where market power is concentrated in the retail stage, dominated by two large-scale, vertically integrated retailers, which are also active (through their subsidiaries) in beef trade – i.e. that increases in prices at the retail and wholesale level of the supply chain are transferred less than proportionally to producers (further details on the structure of the beef supply chain and on beef trade will be provided in the reply to question 3 at § 4.3).
4.1.2.2 Pork
Visual inspection of graphical representations
The graph at Figure 4.32 highlights a certain stability in domestic producer and consumer prices, together with a rather evident linkage between the two. In this respect, it is important to note that domestic consumer price (“Consumer price of retail fresh meat”) is a weighted average of the prices of different meat cuts, including those covered by quality labels. The “Consumer price of retail fresh meat” here represented gives an indication on the whole price of pork meat, irrespective of the specific meat cut, and hence ensures sufficient stability of the price series over time (the prices of each of the various meat cuts would be more strongly influenced by the special offers which are made on each of them; these special offers are usually planned well in advance, and generally have nothing to do with concomitant market conditions). Imports of half-carcasses have relatively limited importance when measured against domestic production, whose variations are likely to be the most important factor determining the dynamics of domestic prices, in a context of stagnating demand for pork like the Swiss one.
Figure 4.32 – Pork: annual evolution of total imports of carcasses, exports, domestic production and domestic prices, 2000-2014.
The graph at Figure 4.34 shows that TRQ administration for pork has clearly changed from 2009 onwards, adapting to a situation of increasing oversupply by reducing the frequency and size of import quota releases for half-carcasses of swine. The graph also highlights other notable trends / elements:
1. The stricter import regulation has helped to bring the domestic consumer price to pre-2010 levels, but another steep decline in price can be observed in the second half of 2014. These fluctuations are probably related to the pork cycle and, with respect to 2014, to an over-estimation of the demand for the year.
0,00
2,00
4,00
6,00
8,00
10,00
12,00
0
50 000
100 000
150 000
200 000
250 000
2000 2001 2002 2003 2004 2005 2006 2007 2008 2009 2010 2011 2012 2013 2014
CH
F/K
G
Ton
s
Total import Total Exports Domestic production
Domestic producer price Domestic consumer price
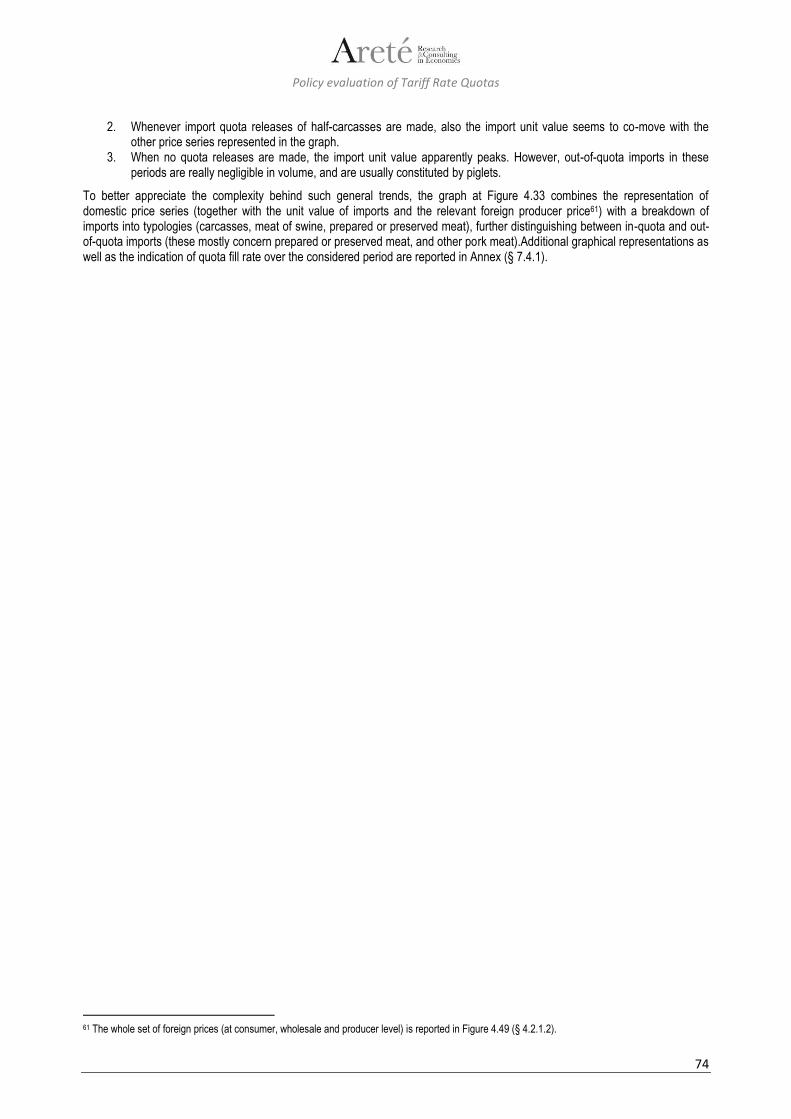
Policy evaluation of Tariff Rate Quotas
74
2. Whenever import quota releases of half-carcasses are made, also the import unit value seems to co-move with the other price series represented in the graph.
3. When no quota releases are made, the import unit value apparently peaks. However, out-of-quota imports in these periods are really negligible in volume, and are usually constituted by piglets.
To better appreciate the complexity behind such general trends, the graph at Figure 4.33 combines the representation of domestic price series (together with the unit value of imports and the relevant foreign producer price61) with a breakdown of imports into typologies (carcasses, meat of swine, prepared or preserved meat), further distinguishing between in-quota and out-of-quota imports (these mostly concern prepared or preserved meat, and other pork meat).Additional graphical representations as well as the indication of quota fill rate over the considered period are reported in Annex (§ 7.4.1).
61 The whole set of foreign prices (at consumer, wholesale and producer level) is reported in Figure 4.49 (§ 4.2.1.2).
Policy evaluation of Tariff Rate Quotas
75
Figure 4.33 – Pork: evolution of in-quota import and out-of-quota imports (of carcasses, meat of swine, prepared or preserved meat), domestic consumer price, import unit value and external producer price, 01/2000-12/201462.
62 Peaks in the Import unit value when in quota imports are not allowed refer to piglets. These imports are not comparable to those of carcasses and have not been considered in the visual inspection.
0
1
2
3
4
5
6
7
8
9
10
11
0
500
1 000
1 500
2 000
2 500
3 000
Jan
-00
Mar
-00
May
-00
Jul-
00
Sep
-00
No
v-0
0Ja
n-0
1M
ar-0
1M
ay-0
1Ju
l-0
1Se
p-0
1N
ov-
01
Jan
-02
Mar
-02
May
-02
Jul-
02
Sep
-02
No
v-0
2Ja
n-0
3M
ar-0
3M
ay-0
3Ju
l-0
3Se
p-0
3N
ov-
03
Jan
-04
Mar
-04
May
-04
Jul-
04
Sep
-04
No
v-0
4Ja
n-0
5M
ar-0
5M
ay-0
5Ju
l-0
5Se
p-0
5N
ov-
05
Jan
-06
Mar
-06
May
-06
Jul-
06
Sep
-06
No
v-0
6Ja
n-0
7M
ar-0
7M
ay-0
7Ju
l-0
7Se
p-0
7N
ov-
07
Jan
-08
Mar
-08
May
-08
Jul-
08
Sep
-08
No
v-0
8Ja
n-0
9M
ar-0
9M
ay-0
9Ju
l-0
9Se
p-0
9N
ov-
09
Jan
-10
Mar
-10
May
-10
Jul-
10
Sep
-10
No
v-1
0Ja
n-1
1M
ar-1
1M
ay-1
1Ju
l-1
1Se
p-1
1N
ov-
11
Jan
-12
Mar
-12
May
-12
Jul-
12
Sep
-12
No
v-1
2Ja
n-1
3M
ar-1
3M
ay-1
3Ju
l-1
3Se
p-1
3N
ov-
13
Jan
-14
Mar
-14
May
-14
Jul-
14
Sep
-14
No
v-1
4
CH
F/K
g
Ton
s
Import quota releases (t) Prepared or preserved meat - out of quota - total (t)
Out of quota import - carcasses or half carcasses, fresh or chilled (t) Meat of swine -other - fresh or chilled - out of quota
Swiss consumer price (CHF/Kg) Swiss wholesale price (Stotzen mit Schwarte QM) (CHF/Kg)
Swiss producer price (Schwein) (CHF/Kg) Import unit value (CHF/Kg)
German producer price (Schwein E) (CHF/Kg) French producer price (Schwein E) (CHF/Kg)

Policy evaluation of Tariff Rate Quotas
76
Figure 4.34 – Pork: evolution of in quota import/total imports of carcasses, domestic consumer price, import unit value and external producer price, 01/2000-12/2014.
0
1
2
3
4
5
6
7
8
9
10
11
0%
20%
40%
60%
80%
100%
Jan
-00
Mar
-00
May
-00
Jul-
00
Sep
-00
No
v-0
0Ja
n-0
1M
ar-0
1M
ay-0
1Ju
l-0
1Se
p-0
1N
ov-
01
Jan
-02
Mar
-02
May
-02
Jul-
02
Sep
-02
No
v-0
2Ja
n-0
3M
ar-0
3M
ay-0
3Ju
l-0
3Se
p-0
3N
ov-
03
Jan
-04
Mar
-04
May
-04
Jul-
04
Sep
-04
No
v-0
4Ja
n-0
5M
ar-0
5M
ay-0
5Ju
l-0
5Se
p-0
5N
ov-
05
Jan
-06
Mar
-06
May
-06
Jul-
06
Sep
-06
No
v-0
6Ja
n-0
7M
ar-0
7M
ay-0
7Ju
l-0
7Se
p-0
7N
ov-
07
Jan
-08
Mar
-08
May
-08
Jul-
08
Sep
-08
No
v-0
8Ja
n-0
9M
ar-0
9M
ay-0
9Ju
l-0
9Se
p-0
9N
ov-
09
Jan
-10
Mar
-10
May
-10
Jul-
10
Sep
-10
No
v-1
0Ja
n-1
1M
ar-1
1M
ay-1
1Ju
l-1
1Se
p-1
1N
ov-
11
Jan
-12
Mar
-12
May
-12
Jul-
12
Sep
-12
No
v-1
2Ja
n-1
3M
ar-1
3M
ay-1
3Ju
l-1
3Se
p-1
3N
ov-
13
Jan
-14
Mar
-14
May
-14
Jul-
14
Sep
-14
No
v-1
4
CH
F/K
g
Pe
rce
nta
ge
In quota import / total import (%) Swiss consumer price (CHF/Kg) Import unit value (CHF/Kg) German producer price (Schwein E) (CHF/Kg)
Policy evaluation of Tariff Rate Quotas
77
Statistical tests
The assessment was first conducted by making a distinction between the pre-2009 and post-2009 periods, as import quota releases have been less frequent in the latter period. The difference in the series of (de-trended) domestic prices and (de-trended) import unit value observed in the pre- and post-2009 periods was found not to be statistically significant (see also Annex 7.4.3).
As a second step of analysis, only the period from 2009 onwards was considered, and the difference in mean between periods with and without import quota releases was investigated for all the relevant variables. All the price series were found to be statistically different in mean (at a 1% significance level) according to whether import quota releases are made or not. All the domestic prices, at all levels of the supply chain (consumer, wholesale, producer), show a higher mean in periods with import quota releases than in periods without them. Higher prices during TRQ releases are consistent with the results of analogous tests made for question 1.1 (see § 4.1.2.2): the opening of quota releases from 2009 onwards seems to be concentrated in periods with tighter domestic supply and – more in general – TRQ releases are carefully made to avoid putting pressure on domestic prices. The mean of import unit value in periods with quota releases is lower than the one in periods without them. This result is explained by a totally different structure and volume of imports in the two periods:
1. when domestic supply is sufficient or even exceeds demand, no quota releases are made for half-carcasses; in these periods, no out-of-quota imports basically occur;
1. when domestic supply is insufficient, import quota releases are made, allowing the import of significant volumes of half-carcasses at the in-quota tariff to ease the tight market conditions.
Results of the econometric price transmission model
The “econometric price transmission model” was based on the following variables:
Domestic producer price (in CHF/ton)
Domestic wholesale price (in CHF/ton) (this time series was found to be non-stationary, and was not included in the final version of the model)
Domestic consumer price (in CHF/ton)
Total imports / Policy Intensity indicator63 (as defined at § 3.3.1)
Foreign wholesale price (in CHF/ton), included in the model as exogenous variable.
As already noted for beef (see § 4.1.2.1), also for the “econometric policy model” used for pork the assumed causal chain was based on the assumption that operators look at a combination of elements defining the conditions of supply and demand, simply identifying the domestic consumer price as a synthetic proxy of all those elements. In Annex 7.4.4 (Table 7.80) the results of the Granger causality test for selected variables of the price transmission model are reported; in this case, however, the bi-directional character of cross-relationships along the supply chain appears to be less evident than for beef, actually confirming that the assumed unidirectional causal chain is likely to be the most relevant from a statistical and economic standpoint.
Figure 4.35 summarizes the results of the Granger causality test and of the impulse response function for pork; further details as well as the complete set of results are reported in Annex 7.4.4.
63 On the basis of how policy intensity was defined for the Pork product, total imports and policy indicator are considered as the same variable and therefore total imports only were included in the econometric models.

Policy evaluation of Tariff Rate Quotas
78
Figure 4.35 – Summary of results from econometric price transmission model - pork
Source: Areté elaboration The Granger causality test shows a good relationship between Swiss producer price and Swiss consumer price, while its results are not statistically significant for the connection between the Swiss consumer price and total imports. Indeed, the coordinated process leading to requests of import quota releases by supply chain operators was found to look more at the evolution of supply and demand conditions, than at the dynamics of domestic consumer prices.
An additional relationship of interest here for pork concerns the causality and the relative impulse response function between total imports and domestic consumer prices64. The objective of this investigation is to further verify whether a correlation exists between these two variables, moving from the results of visual inspection of graphical representations and of the statistical tests. This assessment, however, can be performed directly on the policy model estimation where both variables were included and the respective causal relationship and IRFs were obtained. Those results indicate that a good causality between total imports and domestic consumer prices exists (see also Annex 7.4.4 – Table 7.78); the impulse response function revealed a direct correlation, which confirms that increased imports of half-carcasses through more sizable quota releases have been allowed only when the domestic supply was particularly tight, and therefore when domestic consumer prices were at their peak. However, in-quota imports of half-carcasses have always been allowed to an extent which prevented them from having a long-lasting depressing effect on domestic prices.
The above results are consistent with market dynamics which appear to be linked more to the variations of domestic supply against a stagnating demand (the weight of imports with respect to domestic production is in fact very limited), than to the relatively limited variations in imports determined by adaptations in the TRQ administration (releases of TRQs in fact do not prevent increases in prices). It is worth reminding that for half-carcasses, imports are entirely and strictly regulated through TRQ administration: out-of-quota imports are negligible and mostly constituted by piglets, so total imports are determined by policy intensity.
The presence of asymmetrical price transmission within the Swiss pork supply chain was tested through an ad hoc switching regimes VAR econometric model; the same causal chain used for the price transmission model was assumed, distinguishing between increases and decreases in prices. The analysis highlighted the presence of a generic less than proportional vertical price transmission between producer and consumer prices (even if the statistical significance of results was lower than for beef). Similarly to what observed for beef, vertical price transmission resulted to be asymmetrical as it was greater (although less than proportional) in presence of increases in producer price than in presence of decreases in such price. In other words, with rising producer prices, the consequent increase of consumer prices was found to be generally greater than the corresponding decrease with declining producer prices. Such result is consistent with empirical evidence from other studies on asymmetric vertical price transmission in the food supply chains. Also in this case similar consideration already reported for beef remain valid: the
64 More specifically, the impact of total imports on domestic consumer price was tested in the opposite direction of the assumed causal chain: because of the interdependence of different variables within the causal chain, it is useful to test their interrelation in both directions; in this specific case, the impact of total imports on consumer prices resulted more statistically significant than the inverse one.
Assumed causal chain
Swiss producer price
Swiss consumer price
Total import
International wholesale price*
* Exogenous variable
Swiss wholesale price
Granger causality test
Good
not statistically significant
Good
Impulse response function
not statistically significant
Direct causation
not statistically significant
Consistent with assumptions in the causal chain
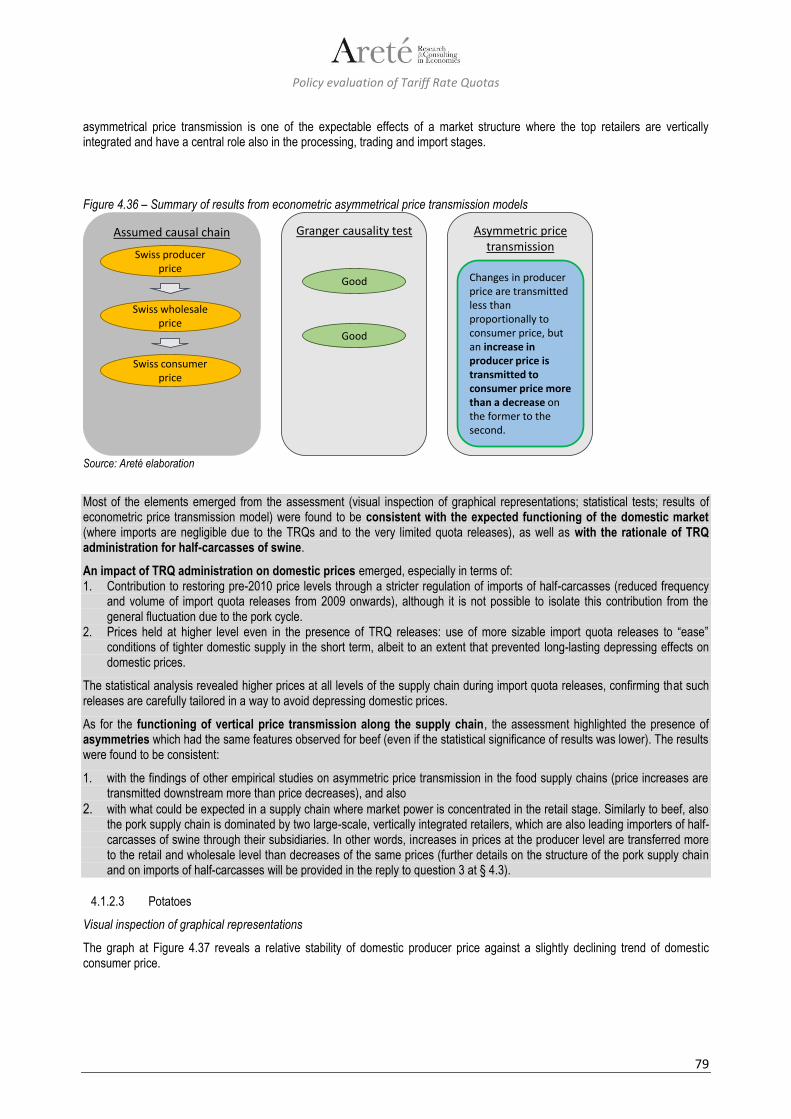
Policy evaluation of Tariff Rate Quotas
79
asymmetrical price transmission is one of the expectable effects of a market structure where the top retailers are vertically integrated and have a central role also in the processing, trading and import stages.
Figure 4.36 – Summary of results from econometric asymmetrical price transmission models
Source: Areté elaboration
Most of the elements emerged from the assessment (visual inspection of graphical representations; statistical tests; results of econometric price transmission model) were found to be consistent with the expected functioning of the domestic market (where imports are negligible due to the TRQs and to the very limited quota releases), as well as with the rationale of TRQ administration for half-carcasses of swine.
An impact of TRQ administration on domestic prices emerged, especially in terms of: 1. Contribution to restoring pre-2010 price levels through a stricter regulation of imports of half-carcasses (reduced frequency
and volume of import quota releases from 2009 onwards), although it is not possible to isolate this contribution from the general fluctuation due to the pork cycle.
2. Prices held at higher level even in the presence of TRQ releases: use of more sizable import quota releases to “ease” conditions of tighter domestic supply in the short term, albeit to an extent that prevented long-lasting depressing effects on domestic prices.
The statistical analysis revealed higher prices at all levels of the supply chain during import quota releases, confirming that such releases are carefully tailored in a way to avoid depressing domestic prices.
As for the functioning of vertical price transmission along the supply chain, the assessment highlighted the presence of asymmetries which had the same features observed for beef (even if the statistical significance of results was lower). The results were found to be consistent:
1. with the findings of other empirical studies on asymmetric price transmission in the food supply chains (price increases are transmitted downstream more than price decreases), and also
2. with what could be expected in a supply chain where market power is concentrated in the retail stage. Similarly to beef, also the pork supply chain is dominated by two large-scale, vertically integrated retailers, which are also leading importers of half-carcasses of swine through their subsidiaries. In other words, increases in prices at the producer level are transferred more to the retail and wholesale level than decreases of the same prices (further details on the structure of the pork supply chain and on imports of half-carcasses will be provided in the reply to question 3 at § 4.3).
4.1.2.3 Potatoes
Visual inspection of graphical representations
The graph at Figure 4.37 reveals a relative stability of domestic producer price against a slightly declining trend of domestic consumer price.
Assumed causal chain
Swiss producer price
Swiss wholesale price
Swiss consumer price
Granger causality test
Good
Good
Asymmetric price transmission
Changes in producer price are transmitted less than proportionally to consumer price, but an increase in producer price is transmitted to consumer price more than a decrease on the former to the second.

Policy evaluation of Tariff Rate Quotas
80
Figure 4.37 – Potatoes: annual evolution of total imports, exports, total domestic production for human consumption and supply of packed potatoes for retail only and domestic prices, 2005-2014.
The graph in Figure 4.38 shows a possible linkage between import unit value and domestic consumer price: however, the series for import unit value – referring to imports flows mostly constituted of “early potatoes” – are somewhat difficult to relate to the Swiss domestic prices of table potatoes. In the figure also the other domestic prices (at wholesale and producer level) are reported, together with the relevant foreign producer price65.
For potatoes, the price reporting system collects first domestic prices and, only when domestic products are not available, prices of the imported ones are considered; from one standpoint this switch might amplify the magnitude of price peaks, but on the other side, since for potatoes imports represent a small share of the domestic market, its impact is not severe.
A possible linkage between price dynamics and TRQ administration (timing of import quota releases, with specific reference to extensions of the opening of the base TRQ, whose opening is automatic; ratio between in-quota and total imports) emerges less clearly from the graph. Despite this, the general market dynamic as reported by FOAG is confirmed by the visual inspection: consumer prices tend to increase in the winter months because of storage costs; in June the domestic “early” production starts being marketed at relatively high prices, together with the last imports of early potatoes before the closing of TRQ; once the harvest arrives prices decreases again.
The graph highlights in a clearer way that peaks in the import unit value are always related to extremely small imports at very high prices. Additional graphical representations as well as the indication of quota fill rate over the considered period are reported in Annex (§ 7.5.1).
All in all, visual inspection of graphical representations did not reveal any clear element suggesting an evident influence of TRQ administration on domestic prices for potatoes.
65 The whole set of foreign prices (at consumer, wholesale and producer level) is reported in Figure 4.51 (§ 4.2.1.3).
0,00
0,20
0,40
0,60
0,80
1,00
1,20
1,40
1,60
1,80
2,00
0
20 000
40 000
60 000
80 000
100 000
120 000
140 000
160 000
180 000
200 000
2005 2007 2009 2011 2013
CH
F/K
g
Ton
s
Total imports Total exports
Supply (packed for retail only) Domestic production for human cons.
Domestic producer price Domestic consumer price (festkochend)
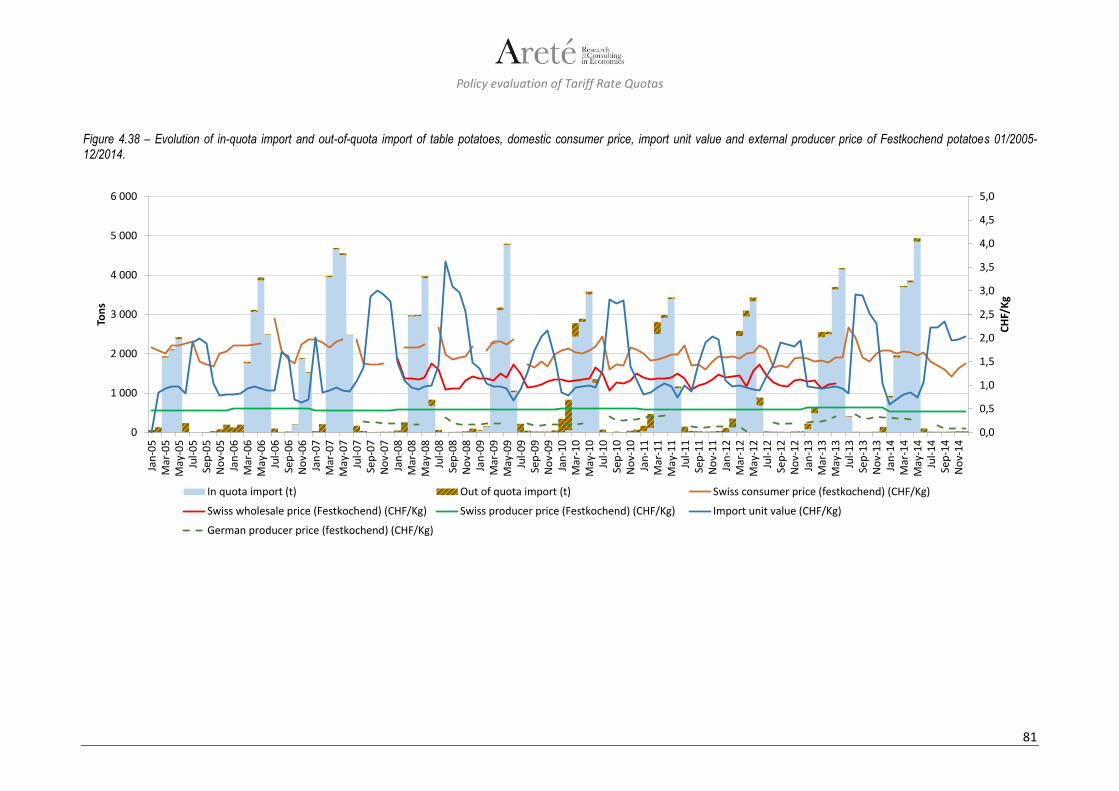
Policy evaluation of Tariff Rate Quotas
81
Figure 4.38 – Evolution of in-quota import and out-of-quota import of table potatoes, domestic consumer price, import unit value and external producer price of Festkochend potatoes 01/2005-12/2014.
0,0
0,5
1,0
1,5
2,0
2,5
3,0
3,5
4,0
4,5
5,0
0
1 000
2 000
3 000
4 000
5 000
6 000
Jan
-05
Mar
-05
May
-05
Jul-
05
Sep
-05
No
v-0
5Ja
n-0
6M
ar-0
6M
ay-0
6Ju
l-0
6Se
p-0
6N
ov-
06
Jan
-07
Mar
-07
May
-07
Jul-
07
Sep
-07
No
v-0
7Ja
n-0
8M
ar-0
8M
ay-0
8Ju
l-0
8Se
p-0
8N
ov-
08
Jan
-09
Mar
-09
May
-09
Jul-
09
Sep
-09
No
v-0
9Ja
n-1
0M
ar-1
0M
ay-1
0Ju
l-1
0Se
p-1
0N
ov-
10
Jan
-11
Mar
-11
May
-11
Jul-
11
Sep
-11
No
v-1
1Ja
n-1
2M
ar-1
2M
ay-1
2Ju
l-1
2Se
p-1
2N
ov-
12
Jan
-13
Mar
-13
May
-13
Jul-
13
Sep
-13
No
v-1
3Ja
n-1
4M
ar-1
4M
ay-1
4Ju
l-1
4Se
p-1
4N
ov-
14
CH
F/K
g
Ton
s
In quota import (t) Out of quota import (t) Swiss consumer price (festkochend) (CHF/Kg)
Swiss wholesale price (Festkochend) (CHF/Kg) Swiss producer price (Festkochend) (CHF/Kg) Import unit value (CHF/Kg)
German producer price (festkochend) (CHF/Kg)
Policy evaluation of Tariff Rate Quotas
82
Statistical tests
All the considered price series were found to be significantly different in mean according to whether quota releases are made or not (even if the significance level of the tests is different: 1% for domestic consumer prices and import unit value, 5% for domestic wholesale prices, 10% for domestic producer prices; see also Annex 7.5.3).
All the domestic prices, at all levels of the supply chain (consumer, wholesale, producer), show a higher mean in periods with quota releases than in periods without quota releases. However, being the opening of the TRQ automatic (ad hoc decisions are only taken by supply chain operators on extensions), the explanation of such result might differ from the one given for the same outcome in the case of pork (opening of quota releases in periods with reduced availability of domestic product). Indeed, higher prices in periods with import quota releases might also derive from increasing storage costs for maintaining stocks.
The mean of import unit value in periods when quota releases are made is lower than in periods without quota releases. Such phenomenon can be explained in terms of a different composition of imports (with reference to product typologies, quality or origins). In periods with sufficient availability of domestic table potatoes at packing centres, no quota releases are made, and the usually small volumes of out-of-quota imports are likely to derive from specific needs and/or to occur in non-ordinary conditions (“emergency” imports): hence their high unit value.
Results of the econometric price transmission model
No analysis of vertical price transmission along the supply chain could be performed, due to limitations in the available price series.
The only element emerged from the all-inclusive econometric model used for question 1.1 (see § 4.1.1.3) showed a direct correlation at third lag between total imports and Swiss consumer price. Such result could be explained by the market dynamic described above: the peak in imports – entirely referable to early potatoes – usually occur in the March-May period, in June these products are marketed together with the early domestic production at very high prices thus resulting in a direct correlation with a time lapse between imports and domestic consumer prices.
No findings from the analysis suggested in a clear way that TRQ administration has a straightforward impact on domestic prices of table potatoes. The elements emerged from the assessment were rather mixed, and in some cases not easy to relate to the actual functioning of the supply chain. The Swiss market is relatively self-sufficient. Imports represent a small share of total sales and, thus, do not influence domestic prices to large extent.
On the other side, domestic prices result directly impacted by TRQs: production prices would be almost certainly lower in the absence of border protection; the size of the quota releases is very small in comparison to the size of domestic market, therefore granting a high protection.
4.1.2.4 Tomatoes
Visual inspection of graphical representations
Visual inspection of the graph at Figure 4.39 did not reveal clear trends in domestic prices, other than a relative stability of domestic producer price (yearly variations are limited to a “corridor” between 1,50 and 2,00 CHF/Kg) and of domestic consumer price (hovering between 3,40 and 3,80 CHF in most years over the observed period). The drop in prices observed in 2011 was caused by the Escherichia coli outbreak. Domestic producer and consumer prices seem to co-move, even with some discrepancies.
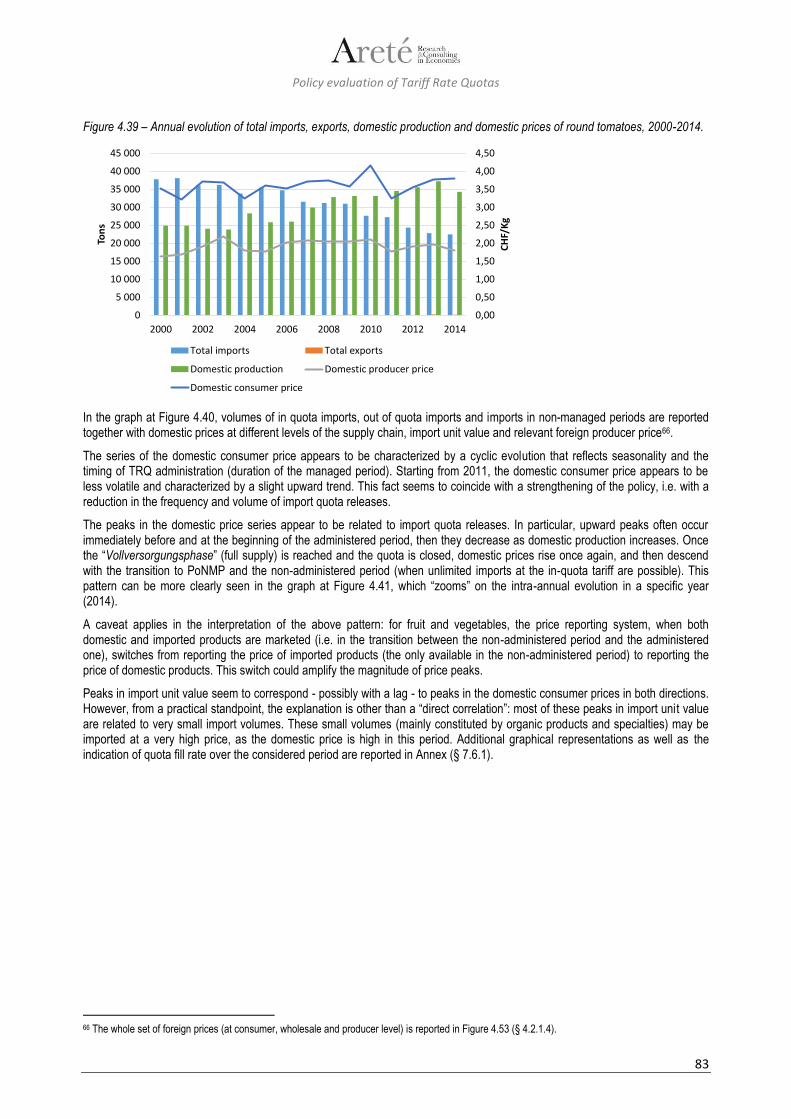
Policy evaluation of Tariff Rate Quotas
83
Figure 4.39 – Annual evolution of total imports, exports, domestic production and domestic prices of round tomatoes, 2000-2014.
In the graph at Figure 4.40, volumes of in quota imports, out of quota imports and imports in non-managed periods are reported together with domestic prices at different levels of the supply chain, import unit value and relevant foreign producer price66.
The series of the domestic consumer price appears to be characterized by a cyclic evolution that reflects seasonality and the timing of TRQ administration (duration of the managed period). Starting from 2011, the domestic consumer price appears to be less volatile and characterized by a slight upward trend. This fact seems to coincide with a strengthening of the policy, i.e. with a reduction in the frequency and volume of import quota releases.
The peaks in the domestic price series appear to be related to import quota releases. In particular, upward peaks often occur immediately before and at the beginning of the administered period, then they decrease as domestic production increases. Once the “Vollversorgungsphase” (full supply) is reached and the quota is closed, domestic prices rise once again, and then descend with the transition to PoNMP and the non-administered period (when unlimited imports at the in-quota tariff are possible). This pattern can be more clearly seen in the graph at Figure 4.41, which “zooms” on the intra-annual evolution in a specific year (2014).
A caveat applies in the interpretation of the above pattern: for fruit and vegetables, the price reporting system, when both domestic and imported products are marketed (i.e. in the transition between the non-administered period and the administered one), switches from reporting the price of imported products (the only available in the non-administered period) to reporting the price of domestic products. This switch could amplify the magnitude of price peaks.
Peaks in import unit value seem to correspond - possibly with a lag - to peaks in the domestic consumer prices in both directions. However, from a practical standpoint, the explanation is other than a “direct correlation”: most of these peaks in import unit value are related to very small import volumes. These small volumes (mainly constituted by organic products and specialties) may be imported at a very high price, as the domestic price is high in this period. Additional graphical representations as well as the indication of quota fill rate over the considered period are reported in Annex (§ 7.6.1).
66 The whole set of foreign prices (at consumer, wholesale and producer level) is reported in Figure 4.53 (§ 4.2.1.4).
0,00
0,50
1,00
1,50
2,00
2,50
3,00
3,50
4,00
4,50
0
5 000
10 000
15 000
20 000
25 000
30 000
35 000
40 000
45 000
2000 2002 2004 2006 2008 2010 2012 2014
CH
F/K
g
Ton
s
Total imports Total exports
Domestic production Domestic producer price
Domestic consumer price

Policy evaluation of Tariff Rate Quotas
84
Figure 4.40 – Tomatoes: evolution of in-quota import, out-of-quota import, imports in non-managed periods of round tomatoes, domestic consumer price, import unit value and external producer price, 01/2000-12/2014.
0,0
0,5
1,0
1,5
2,0
2,5
3,0
3,5
4,0
4,5
5,0
5,5
0
1 000
2 000
3 000
4 000
5 000
6 000
7 000
Jan
-00
Mar
-00
May
-00
Jul-
00
Sep
-00
No
v-0
0Ja
n-0
1M
ar-0
1M
ay-0
1Ju
l-0
1Se
p-0
1N
ov-
01
Jan
-02
Mar
-02
May
-02
Jul-
02
Sep
-02
No
v-0
2Ja
n-0
3M
ar-0
3M
ay-0
3Ju
l-0
3Se
p-0
3N
ov-
03
Jan
-04
Mar
-04
May
-04
Jul-
04
Sep
-04
No
v-0
4Ja
n-0
5M
ar-0
5M
ay-0
5Ju
l-0
5Se
p-0
5N
ov-
05
Jan
-06
Mar
-06
May
-06
Jul-
06
Sep
-06
No
v-0
6Ja
n-0
7M
ar-0
7M
ay-0
7Ju
l-0
7Se
p-0
7N
ov-
07
Jan
-08
Mar
-08
May
-08
Jul-
08
Sep
-08
No
v-0
8Ja
n-0
9M
ar-0
9M
ay-0
9Ju
l-0
9Se
p-0
9N
ov-
09
Jan
-10
Mar
-10
May
-10
Jul-
10
Sep
-10
No
v-1
0Ja
n-1
1M
ar-1
1M
ay-1
1Ju
l-1
1Se
p-1
1N
ov-
11
Jan
-12
Mar
-12
May
-12
Jul-
12
Sep
-12
No
v-1
2Ja
n-1
3M
ar-1
3M
ay-1
3Ju
l-1
3Se
p-1
3N
ov-
13
Jan
-14
Mar
-14
May
-14
Jul-
14
Sep
-14
No
v-1
4
CH
F/K
g
Ton
s
In quota import in managed periods (t) In quota import in prolongation of non-managed periods (t)Out of quota import in managed periods (t) Imports in non-managed periods (t)Swiss consumer price (CHF/kg) Swiss wholesale price (CHF/Kg)Swiss producer price (CHF/Kg) Import unit value (CHF/Kg)Italian producer price (CHF/Kg)
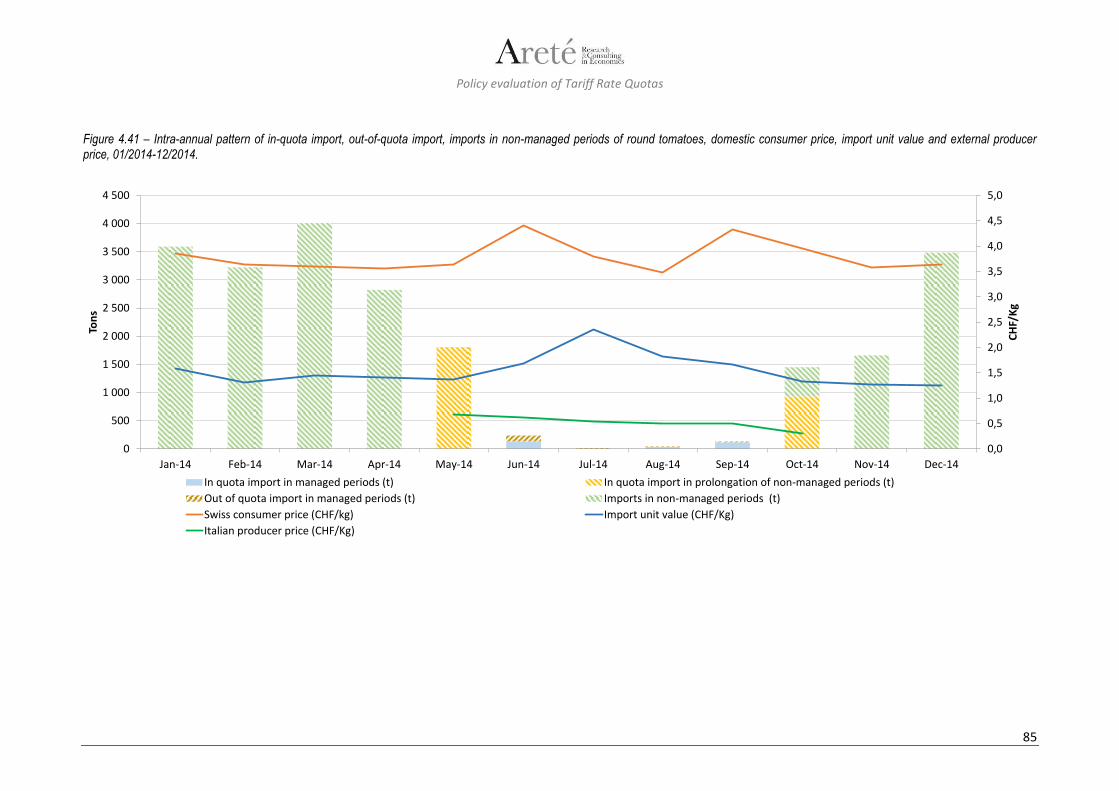
Policy evaluation of Tariff Rate Quotas
85
Figure 4.41 – Intra-annual pattern of in-quota import, out-of-quota import, imports in non-managed periods of round tomatoes, domestic consumer price, import unit value and external producer price, 01/2014-12/2014.
0,0
0,5
1,0
1,5
2,0
2,5
3,0
3,5
4,0
4,5
5,0
0
500
1 000
1 500
2 000
2 500
3 000
3 500
4 000
4 500
Jan-14 Feb-14 Mar-14 Apr-14 May-14 Jun-14 Jul-14 Aug-14 Sep-14 Oct-14 Nov-14 Dec-14
CH
F/K
g
Ton
s
In quota import in managed periods (t) In quota import in prolongation of non-managed periods (t)
Out of quota import in managed periods (t) Imports in non-managed periods (t)
Swiss consumer price (CHF/kg) Import unit value (CHF/Kg)
Italian producer price (CHF/Kg)
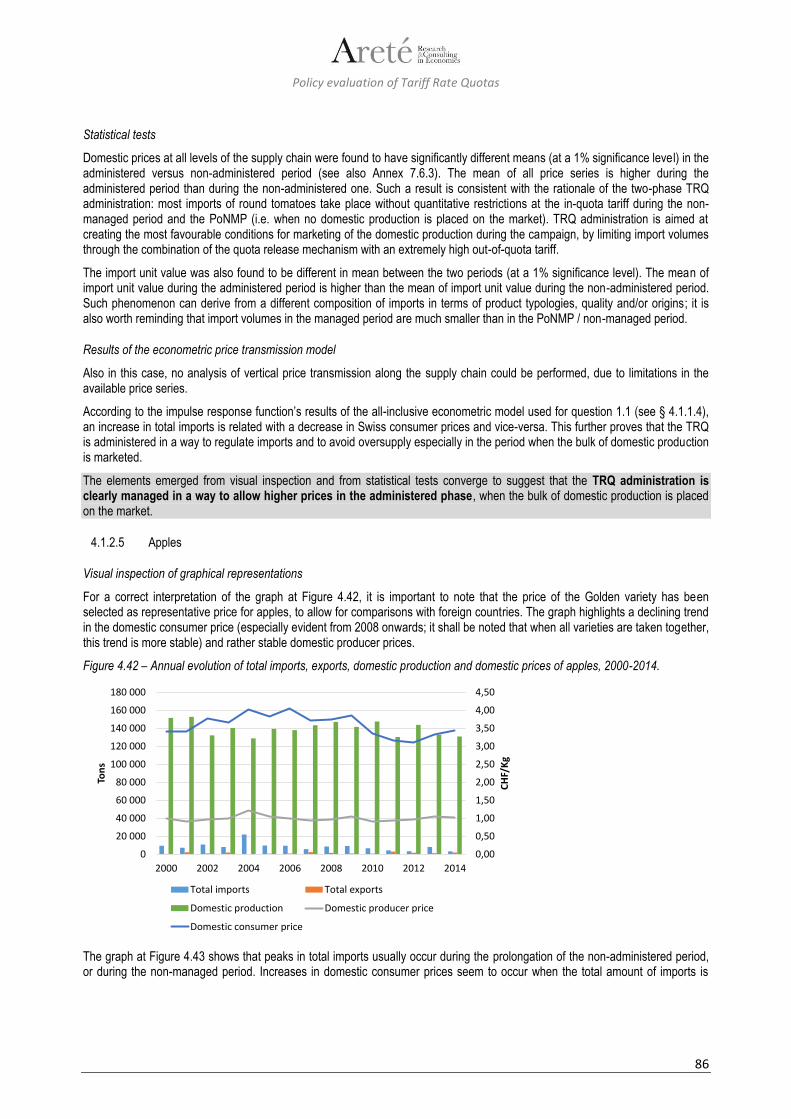
Policy evaluation of Tariff Rate Quotas
86
Statistical tests
Domestic prices at all levels of the supply chain were found to have significantly different means (at a 1% significance level) in the administered versus non-administered period (see also Annex 7.6.3). The mean of all price series is higher during the administered period than during the non-administered one. Such a result is consistent with the rationale of the two-phase TRQ administration: most imports of round tomatoes take place without quantitative restrictions at the in-quota tariff during the non-managed period and the PoNMP (i.e. when no domestic production is placed on the market). TRQ administration is aimed at creating the most favourable conditions for marketing of the domestic production during the campaign, by limiting import volumes through the combination of the quota release mechanism with an extremely high out-of-quota tariff.
The import unit value was also found to be different in mean between the two periods (at a 1% significance level). The mean of import unit value during the administered period is higher than the mean of import unit value during the non-administered period. Such phenomenon can derive from a different composition of imports in terms of product typologies, quality and/or origins; it is also worth reminding that import volumes in the managed period are much smaller than in the PoNMP / non-managed period.
Results of the econometric price transmission model
Also in this case, no analysis of vertical price transmission along the supply chain could be performed, due to limitations in the available price series.
According to the impulse response function’s results of the all-inclusive econometric model used for question 1.1 (see § 4.1.1.4), an increase in total imports is related with a decrease in Swiss consumer prices and vice-versa. This further proves that the TRQ is administered in a way to regulate imports and to avoid oversupply especially in the period when the bulk of domestic production is marketed.
The elements emerged from visual inspection and from statistical tests converge to suggest that the TRQ administration is clearly managed in a way to allow higher prices in the administered phase, when the bulk of domestic production is placed on the market.
4.1.2.5 Apples
Visual inspection of graphical representations
For a correct interpretation of the graph at Figure 4.42, it is important to note that the price of the Golden variety has been selected as representative price for apples, to allow for comparisons with foreign countries. The graph highlights a declining trend in the domestic consumer price (especially evident from 2008 onwards; it shall be noted that when all varieties are taken together, this trend is more stable) and rather stable domestic producer prices.
Figure 4.42 – Annual evolution of total imports, exports, domestic production and domestic prices of apples, 2000-2014.
The graph at Figure 4.43 shows that peaks in total imports usually occur during the prolongation of the non-administered period, or during the non-managed period. Increases in domestic consumer prices seem to occur when the total amount of imports is
0,00
0,50
1,00
1,50
2,00
2,50
3,00
3,50
4,00
4,50
0
20 000
40 000
60 000
80 000
100 000
120 000
140 000
160 000
180 000
2000 2002 2004 2006 2008 2010 2012 2014
CH
F/K
g
Ton
s
Total imports Total exports
Domestic production Domestic producer price
Domestic consumer price

Policy evaluation of Tariff Rate Quotas
87
close to zero (although this does not happen regularly); in the same figure also the domestic prices at other levels of the supply chain (wholesale and producer) are reported, together with the relevant foreign producer price67.
The import unit value is characterised by several peaks, mainly occurring in the month of December. Such peaks do not seem to be transmitted to the domestic consumer price: they actually derive from small amounts of out of quota imports at very high prices, which are irrelevant in the overall market equilibrium. Additional graphical representations as well as the indication of quota fill rate over the considered period are reported in Annex (§ 7.7.1).
Comparison of long term evolution of domestic prices at the different levels of the supply chain shows a relative stability of consumer and producer prices while at wholesale level a steady increase is recorded in the examined period (moving from around 1,55 CHF/Kg in 2000 to 2,31 CHF/Kg in 2014).
All in all, no clear elements suggesting an evident and straightforward relationship between TRQ administration and the dynamics of domestic prices at all stages emerged from visual inspection of graphical representations, however, prices would be almost certainly lower without border protection and therefore the real impact on them is due to the very existence of TRQs.
67 The whole set of foreign prices (at consumer, wholesale and producer level) is reported in Figure 4.55 (§ 4.2.1.5).
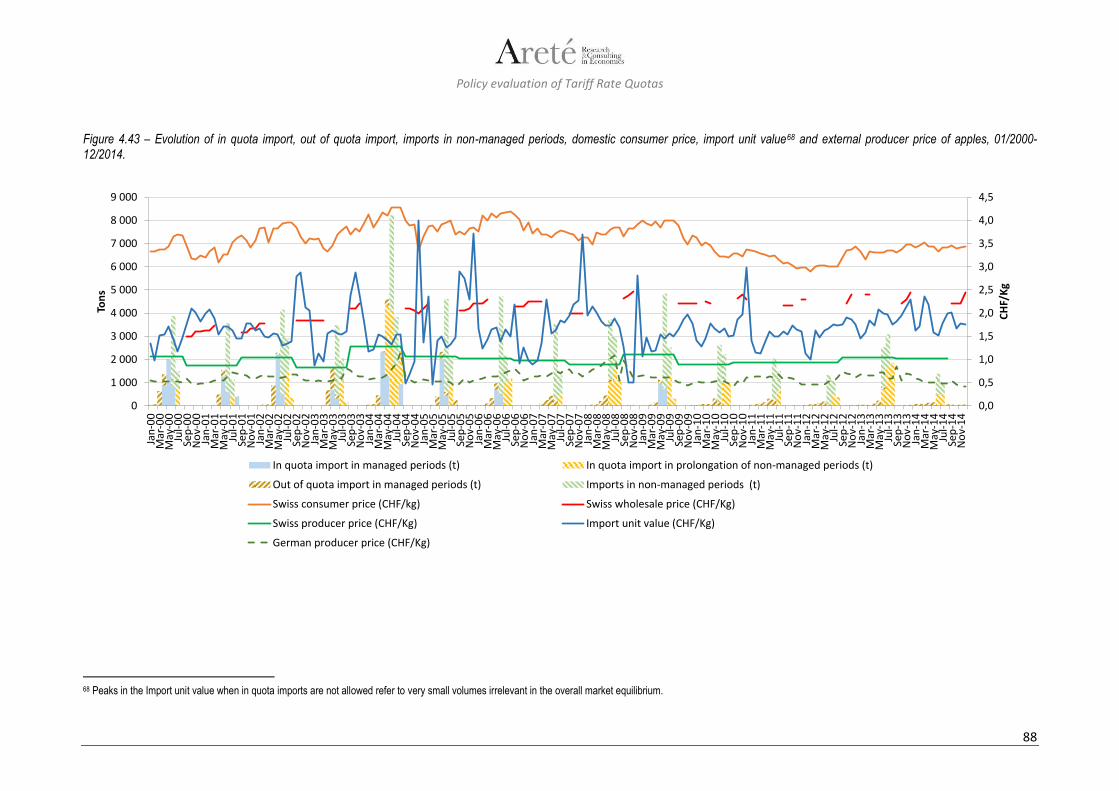
Policy evaluation of Tariff Rate Quotas
88
Figure 4.43 – Evolution of in quota import, out of quota import, imports in non-managed periods, domestic consumer price, import unit value68 and external producer price of apples, 01/2000-12/2014.
68 Peaks in the Import unit value when in quota imports are not allowed refer to very small volumes irrelevant in the overall market equilibrium.
0,0
0,5
1,0
1,5
2,0
2,5
3,0
3,5
4,0
4,5
0
1 000
2 000
3 000
4 000
5 000
6 000
7 000
8 000
9 000
Jan
-00
Mar
-00
May
-00
Jul-
00
Sep
-00
No
v-0
0Ja
n-0
1M
ar-0
1M
ay-0
1Ju
l-0
1Se
p-0
1N
ov-
01
Jan
-02
Mar
-02
May
-02
Jul-
02
Sep
-02
No
v-0
2Ja
n-0
3M
ar-0
3M
ay-0
3Ju
l-0
3Se
p-0
3N
ov-
03
Jan
-04
Mar
-04
May
-04
Jul-
04
Sep
-04
No
v-0
4Ja
n-0
5M
ar-0
5M
ay-0
5Ju
l-0
5Se
p-0
5N
ov-
05
Jan
-06
Mar
-06
May
-06
Jul-
06
Sep
-06
No
v-0
6Ja
n-0
7M
ar-0
7M
ay-0
7Ju
l-0
7Se
p-0
7N
ov-
07
Jan
-08
Mar
-08
May
-08
Jul-
08
Sep
-08
No
v-0
8Ja
n-0
9M
ar-0
9M
ay-0
9Ju
l-0
9Se
p-0
9N
ov-
09
Jan
-10
Mar
-10
May
-10
Jul-
10
Sep
-10
No
v-1
0Ja
n-1
1M
ar-1
1M
ay-1
1Ju
l-1
1Se
p-1
1N
ov-
11
Jan
-12
Mar
-12
May
-12
Jul-
12
Sep
-12
No
v-1
2Ja
n-1
3M
ar-1
3M
ay-1
3Ju
l-1
3Se
p-1
3N
ov-
13
Jan
-14
Mar
-14
May
-14
Jul-
14
Sep
-14
No
v-1
4
CH
F/K
g
Ton
s
In quota import in managed periods (t) In quota import in prolongation of non-managed periods (t)
Out of quota import in managed periods (t) Imports in non-managed periods (t)
Swiss consumer price (CHF/kg) Swiss wholesale price (CHF/Kg)
Swiss producer price (CHF/Kg) Import unit value (CHF/Kg)
German producer price (CHF/Kg)

Policy evaluation of Tariff Rate Quotas
89
Statistical tests
None of the considered price series was found to be significantly different in mean from a statistical viewpoint between the managed and non-managed periods (see also Annex 7.7.3).
Results of the econometric price transmission model
No analysis of vertical price transmission along the supply chain could be performed, due to limitations in the available price series. No results of the all-inclusive econometric model used for question 1.1 (see § 4.1.1.5) revealed significant causal relationships between the policy intensity and domestic prices.
For what concerns impact of TRQs, it can be argued that prices would be lower in the absence of border protection. On the other side, no elements emerged from the assessment clearly suggesting that TRQ administration has a straightforward and evident impact on domestic prices of apples for direct consumption: imports are very limited and the domestic market is more influenced by domestic supply and demand conditions.
4.1.2.6 Strawberries
Visual inspection of graphical representations
Visual inspection of the graph at Figure 4.44 revealed two rather evident trends:
1. a relative stability of domestic producer price (yearly variations are limited to a “corridor” between 6,03 and 6,44 CHF/Kg) and
2. a general increase of domestic consumer price from 2004, with two peaks in 2008 (13.8 CHF/Kg) and 2011 (13.3 CHF/Kg).
Figure 4.44 – Annual evolution of total imports, exports, domestic production and domestic prices of strawberries, 2000-2014.
In the graph at Figure 4.45, volumes of in quota imports, out of quota imports and imports in non-managed periods are reported together with domestic prices at different levels of the supply chain, import unit value and relevant foreign producer price69.
The series of domestic consumer price appears to be characterized by a cyclical evolution that reflects seasonality and the timing of TRQ administration (releases of import quotas). In this respect, it is worth reminding that the price reporting system, when both domestic and imported products are marketed (this typically happens with the transition from the non-administered period to the administered one), switches from reporting the price of imported products to reporting the price of domestic products. This switch could amplify the magnitude of price variations in those periods.
In the case of strawberries, seasonality applies to both production and consumption (also the latter is very low in winter months). The peaks in the domestic consumer price and in the import unit value actually occur more frequently in the middle of the non-administered period, when imports, supply and demand of strawberries are extremely limited: they are hence non-representative of “ordinary” market conditions.
69 The whole set of foreign prices (at consumer, wholesale and producer level) is reported in Figure 4.57 (§ 4.2.1.6).
0,00
2,00
4,00
6,00
8,00
10,00
12,00
14,00
16,00
0
2 000
4 000
6 000
8 000
10 000
12 000
14 000
16 000
18 000
2000 2002 2004 2006 2008 2010 2012 2014
CH
F/K
g
Ton
s
Total imports Total exports
Domestic production Domestic producer price
Domestic consumer price

Policy evaluation of Tariff Rate Quotas
90
After substantial imports have been made in the last months of the non-managed period and in the PoNMP, the switch to the administered phase marks a stop in the downward trend of consumer prices. Domestic prices always show an upward trend during the (rather short) administered phase. The end of the non-managed period usually coincides with the availability of large production volumes at low prices in Italy and in other countries: Swiss importers can hence profit from a favourable situation (falling purchase prices in Italy versus rising selling prices in Switzerland make for good margins), and also – due to the import quota allocation method, based on import purchases of the previous year - leverage on large import purchases to get even bigger quota allocations in the following year. The Italian producer price shows a declining trend during the administered phase, due to increasing supply as the campaign progresses: it is worth noting that price decreases in the Italian market are not transmitted to the Swiss market70.
Peaks in import unit value correspond to peaks in the domestic consumer prices in both directions. However, from a practical standpoint, the explanation is other than a “direct correlation”: at the beginning of the administered phase, consumer price rises due to import regulation via quota releases; the import unit value also rises, but this is actually not relevant, since only small volumes are imported. These small volumes (mainly constituted by organic products and specialties) may be imported at a very high price, as the domestic price is high in this period.
The above patterns can be clearly seen in the graph at Figure 4.46, which “zooms” on the intra-annual evolution in a specific year (2013). Additional graphical representations as well as the indication of quota fill rate over the considered period are reported in Annex (§ 7.8.1).
A comparison of the evolution of domestic prices at the different levels of the supply chain indicates an increase of consumer prices in the long term (moving from annual average of 9,9 CHF/Kg in 2000 to 13,1 CHF/Kg in 2014) with respect to much more stable producer prices (moving from 6 CHF/Kg in 2000 to 6.6 CHF/Kg in 2014).
70 Italy is the second exporter of strawberries to Switzerland after Spain, Italian price series were selected as representative both for quality reasons (much more similar quality to the Swiss ones) and since the Italian campaign is closer in time to the Swiss one.
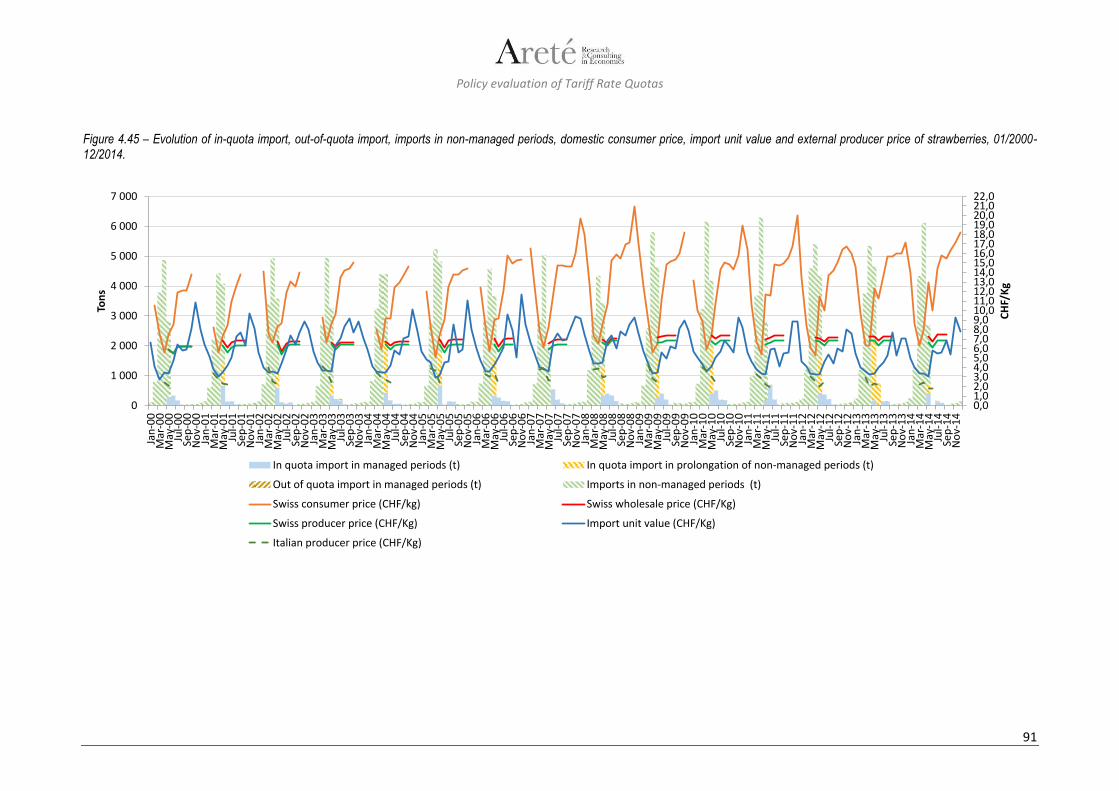
Policy evaluation of Tariff Rate Quotas
91
Figure 4.45 – Evolution of in-quota import, out-of-quota import, imports in non-managed periods, domestic consumer price, import unit value and external producer price of strawberries, 01/2000-12/2014.
0,01,02,03,04,05,06,07,08,09,010,011,012,013,014,015,016,017,018,019,020,021,022,0
0
1 000
2 000
3 000
4 000
5 000
6 000
7 000
Jan
-00
Mar
-00
May
-00
Jul-
00
Sep
-00
No
v-0
0Ja
n-0
1M
ar-0
1M
ay-0
1Ju
l-0
1Se
p-0
1N
ov-
01
Jan
-02
Mar
-02
May
-02
Jul-
02
Sep
-02
No
v-0
2Ja
n-0
3M
ar-0
3M
ay-0
3Ju
l-0
3Se
p-0
3N
ov-
03
Jan
-04
Mar
-04
May
-04
Jul-
04
Sep
-04
No
v-0
4Ja
n-0
5M
ar-0
5M
ay-0
5Ju
l-0
5Se
p-0
5N
ov-
05
Jan
-06
Mar
-06
May
-06
Jul-
06
Sep
-06
No
v-0
6Ja
n-0
7M
ar-0
7M
ay-0
7Ju
l-0
7Se
p-0
7N
ov-
07
Jan
-08
Mar
-08
May
-08
Jul-
08
Sep
-08
No
v-0
8Ja
n-0
9M
ar-0
9M
ay-0
9Ju
l-0
9Se
p-0
9N
ov-
09
Jan
-10
Mar
-10
May
-10
Jul-
10
Sep
-10
No
v-1
0Ja
n-1
1M
ar-1
1M
ay-1
1Ju
l-1
1Se
p-1
1N
ov-
11
Jan
-12
Mar
-12
May
-12
Jul-
12
Sep
-12
No
v-1
2Ja
n-1
3M
ar-1
3M
ay-1
3Ju
l-1
3Se
p-1
3N
ov-
13
Jan
-14
Mar
-14
May
-14
Jul-
14
Sep
-14
No
v-1
4
CH
F/K
g
Ton
s
In quota import in managed periods (t) In quota import in prolongation of non-managed periods (t)
Out of quota import in managed periods (t) Imports in non-managed periods (t)
Swiss consumer price (CHF/kg) Swiss wholesale price (CHF/Kg)
Swiss producer price (CHF/Kg) Import unit value (CHF/Kg)
Italian producer price (CHF/Kg)
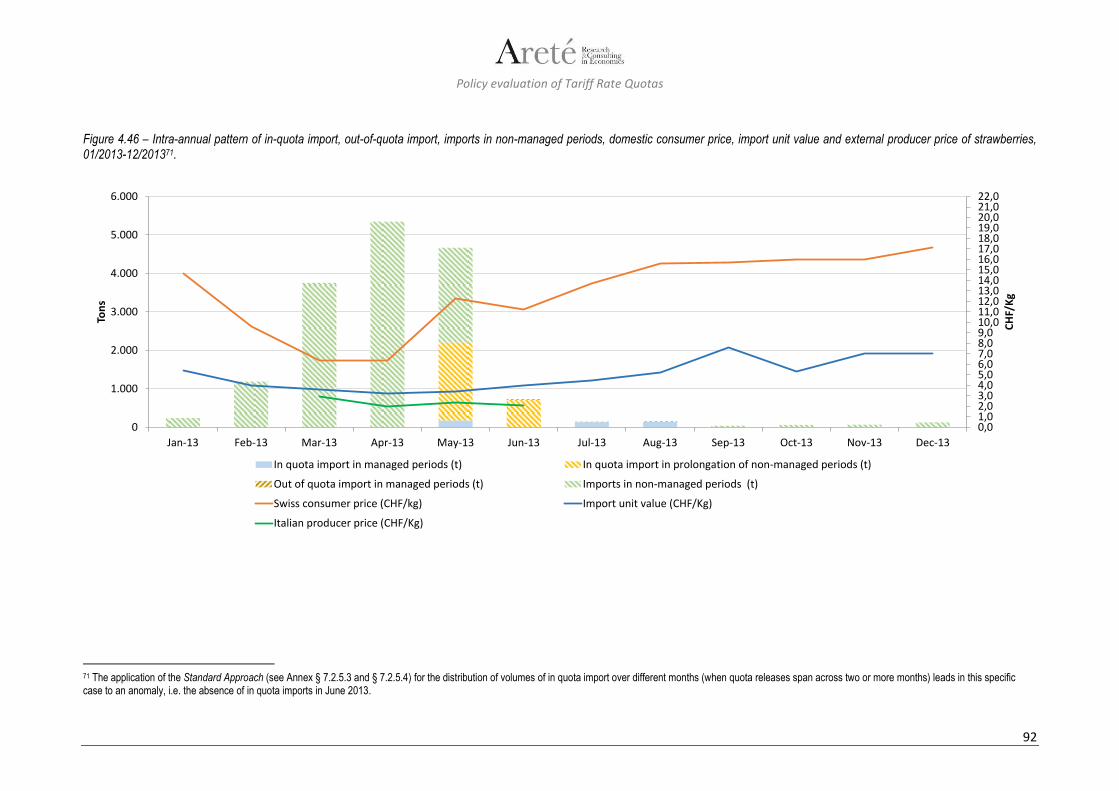
Policy evaluation of Tariff Rate Quotas
92
Figure 4.46 – Intra-annual pattern of in-quota import, out-of-quota import, imports in non-managed periods, domestic consumer price, import unit value and external producer price of strawberries, 01/2013-12/201371.
71 The application of the Standard Approach (see Annex § 7.2.5.3 and § 7.2.5.4) for the distribution of volumes of in quota import over different months (when quota releases span across two or more months) leads in this specific case to an anomaly, i.e. the absence of in quota imports in June 2013.
0,01,02,03,04,05,06,07,08,09,010,011,012,013,014,015,016,017,018,019,020,021,022,0
0
1.000
2.000
3.000
4.000
5.000
6.000
Jan-13 Feb-13 Mar-13 Apr-13 May-13 Jun-13 Jul-13 Aug-13 Sep-13 Oct-13 Nov-13 Dec-13
CH
F/K
g
Ton
s
In quota import in managed periods (t) In quota import in prolongation of non-managed periods (t)
Out of quota import in managed periods (t) Imports in non-managed periods (t)
Swiss consumer price (CHF/kg) Import unit value (CHF/Kg)
Italian producer price (CHF/Kg)

Policy evaluation of Tariff Rate Quotas
93
Statistical tests
The differences in the means of domestic prices observed during the administered period or the non-administered one were found not to be statistically significant (see also Annex 7.8.3). This result can probably be explained by the fact that in the case of strawberries, both production and consumption show a rather marked seasonality.
A difference in mean import unit value (significant at a 5% level) was found between the two periods. The mean of import unit value during the administered period is lower than the mean of import unit value during the non-administered period. This can be related to a different composition of import flows in terms of product typologies, quality or origin between the non-managed period (it is also worth noting that consumption of strawberries in winter is extremely limited) and the managed period (where import flows reflect the availability of ample supplies of low-priced products in Italy).
Results of the econometric price transmission model
No analysis of vertical price transmission along the supply chain could be performed, due to limitations in the available price series.
The results of the all-inclusive econometric model used for question 1.1 (see § 4.1.1.6), and in particular the impulse response function, highlighted an inverse correlation between total imports and Swiss consumer prices, which would be consistent with the rationale for TRQ administration (aiming at allowing higher prices through stricter import regulation in the administered phase, to help the placement on the market of domestic production). This result should however be considered with some prudence, because the Granger causality test did not provide statistically significant results for the relationship between the same variables.
Even if the elements emerged from the assessment are somewhat mixed, visual inspection of the graphical representations suggest that domestic prices are strictly related to the TRQ administration, being higher in the administered with respect to the non-managed period: stricter regulation of imports via quota releases and the application of an extremely high out-of-quota tariff contributes to higher domestic prices during the administered period, i.e. when domestic production is placed on the market.
4.2 Reply to questions on efficacy of TRQs
4.2.1 Reply to Q 2.1: impact on domestic – world price differentials
What is the contribution to existing price differentials between domestic and world prices? Is this difference lower than the out-of-quota tariff?
In the present section, results of an ad hoc analysis performed on different products to reply to question 2.1 are presented; in this context, it should be noted that the most significant elements for the reply derived from the assessment made for question 1.1, i.e. the absence or the negligible volume of out-of-quota imports for all the products under analysis and therefore the height of the out-of-quota tariff, which basically prevents arbitrage72. Starting from this evidence, since the price comparisons suffered from a number of limitations (see further in the text), it was possible to get specific additional indications either from visual inspection of graphical representations or from statistical tests only on a limited number of products (tomatoes and - to a lower extent - strawberries).
4.2.1.1 Beef
Visual inspection of graphical representations The graph in Figure 4.47 reports the price gaps between Swiss and external prices at different stages of the supply chain; more specifically, the considered prices – all expressed in CHF/Kg – are:
Swiss producer price (DPP) – Muni QM
Swiss wholesale price (DWP) – Rindsfiletsteak73
72 Arbitrage consists in buying an asset in one market and selling the same asset, or a similar one, in another market in order to make a profit from a sometimes momentary price difference. In the specific case, the term is used to indicate the possibility to import at the out of quota tariff and to sell on the Swiss market at a profit. In other words, the theoretical possibility for arbitrage exists when domestic consumer prices are higher than import prices (including the tariff) plus the additional logistic costs to put the products on the market. 73 While the Swiss wholesale price for Rind + Muni Hinterviertel was used in the econometric model presented in the previous sections, the Swiss wholesale price for Rindsfiletsteak was used in the figures presented in this section for visual inspection and in the statistical tests presented in section § 4.2.2.1, since it was more comparable – in absolute value and for a direct calculation of the price gap – with the German wholesale price for Muni Filets o Kette.
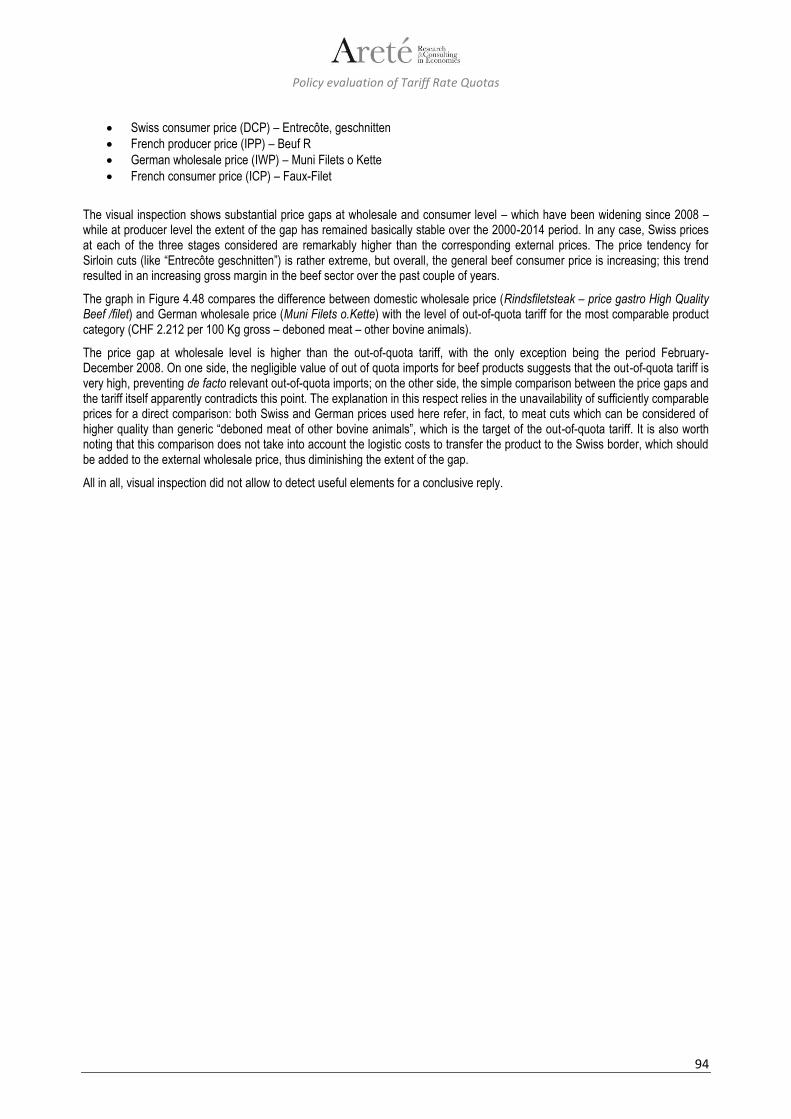
Policy evaluation of Tariff Rate Quotas
94
Swiss consumer price (DCP) – Entrecôte, geschnitten
French producer price (IPP) – Beuf R
German wholesale price (IWP) – Muni Filets o Kette
French consumer price (ICP) – Faux-Filet
The visual inspection shows substantial price gaps at wholesale and consumer level – which have been widening since 2008 – while at producer level the extent of the gap has remained basically stable over the 2000-2014 period. In any case, Swiss prices at each of the three stages considered are remarkably higher than the corresponding external prices. The price tendency for Sirloin cuts (like “Entrecôte geschnitten”) is rather extreme, but overall, the general beef consumer price is increasing; this trend resulted in an increasing gross margin in the beef sector over the past couple of years.
The graph in Figure 4.48 compares the difference between domestic wholesale price (Rindsfiletsteak – price gastro High Quality Beef /filet) and German wholesale price (Muni Filets o.Kette) with the level of out-of-quota tariff for the most comparable product category (CHF 2.212 per 100 Kg gross – deboned meat – other bovine animals).
The price gap at wholesale level is higher than the out-of-quota tariff, with the only exception being the period February-December 2008. On one side, the negligible value of out of quota imports for beef products suggests that the out-of-quota tariff is very high, preventing de facto relevant out-of-quota imports; on the other side, the simple comparison between the price gaps and the tariff itself apparently contradicts this point. The explanation in this respect relies in the unavailability of sufficiently comparable prices for a direct comparison: both Swiss and German prices used here refer, in fact, to meat cuts which can be considered of higher quality than generic “deboned meat of other bovine animals”, which is the target of the out-of-quota tariff. It is also worth noting that this comparison does not take into account the logistic costs to transfer the product to the Swiss border, which should be added to the external wholesale price, thus diminishing the extent of the gap.
All in all, visual inspection did not allow to detect useful elements for a conclusive reply.
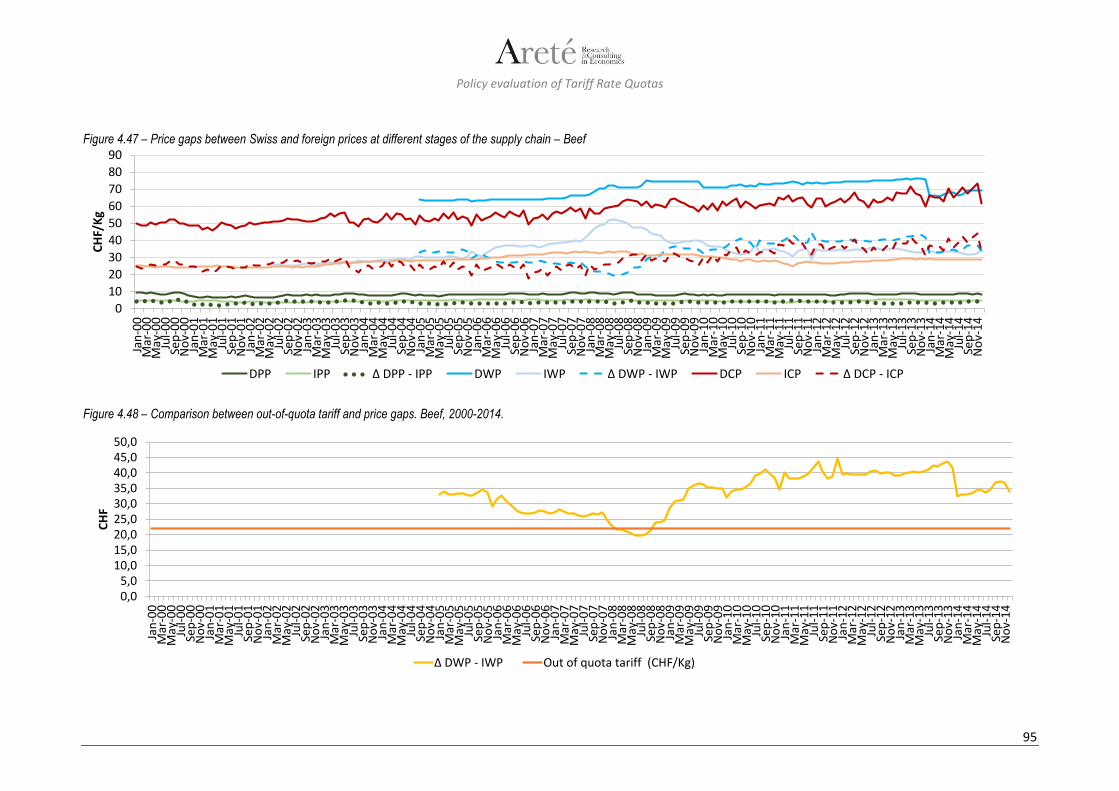
Policy evaluation of Tariff Rate Quotas
95
Figure 4.47 – Price gaps between Swiss and foreign prices at different stages of the supply chain – Beef
Figure 4.48 – Comparison between out-of-quota tariff and price gaps. Beef, 2000-2014.
0
10
20
30
40
50
60
70
80
90
Jan
-00
Mar
-00
May
-00
Jul-
00
Sep
-00
No
v-0
0Ja
n-0
1M
ar-0
1M
ay-0
1Ju
l-0
1Se
p-0
1N
ov-
01
Jan
-02
Mar
-02
May
-02
Jul-
02
Sep
-02
No
v-0
2Ja
n-0
3M
ar-0
3M
ay-0
3Ju
l-0
3Se
p-0
3N
ov-
03
Jan
-04
Mar
-04
May
-04
Jul-
04
Sep
-04
No
v-0
4Ja
n-0
5M
ar-0
5M
ay-0
5Ju
l-0
5Se
p-0
5N
ov-
05
Jan
-06
Mar
-06
May
-06
Jul-
06
Sep
-06
No
v-0
6Ja
n-0
7M
ar-0
7M
ay-0
7Ju
l-0
7Se
p-0
7N
ov-
07
Jan
-08
Mar
-08
May
-08
Jul-
08
Sep
-08
No
v-0
8Ja
n-0
9M
ar-0
9M
ay-0
9Ju
l-0
9Se
p-0
9N
ov-
09
Jan
-10
Mar
-10
May
-10
Jul-
10
Sep
-10
No
v-1
0Ja
n-1
1M
ar-1
1M
ay-1
1Ju
l-1
1Se
p-1
1N
ov-
11
Jan
-12
Mar
-12
May
-12
Jul-
12
Sep
-12
No
v-1
2Ja
n-1
3M
ar-1
3M
ay-1
3Ju
l-1
3Se
p-1
3N
ov-
13
Jan
-14
Mar
-14
May
-14
Jul-
14
Sep
-14
No
v-1
4
CH
F/K
g
DPP IPP Δ DPP - IPP DWP IWP Δ DWP - IWP DCP ICP Δ DCP - ICP
0,05,0
10,015,020,025,030,035,040,045,050,0
Jan
-00
Mar
-00
May
-00
Jul-
00
Sep
-00
No
v-0
0Ja
n-0
1M
ar-0
1M
ay-0
1Ju
l-0
1Se
p-0
1N
ov-
01
Jan
-02
Mar
-02
May
-02
Jul-
02
Sep
-02
No
v-0
2Ja
n-0
3M
ar-0
3M
ay-0
3Ju
l-0
3Se
p-0
3N
ov-
03
Jan
-04
Mar
-04
May
-04
Jul-
04
Sep
-04
No
v-0
4Ja
n-0
5M
ar-0
5M
ay-0
5Ju
l-0
5Se
p-0
5N
ov-
05
Jan
-06
Mar
-06
May
-06
Jul-
06
Sep
-06
No
v-0
6Ja
n-0
7M
ar-0
7M
ay-0
7Ju
l-0
7Se
p-0
7N
ov-
07
Jan
-08
Mar
-08
May
-08
Jul-
08
Sep
-08
No
v-0
8Ja
n-0
9M
ar-0
9M
ay-0
9Ju
l-0
9Se
p-0
9N
ov-
09
Jan
-10
Mar
-10
May
-10
Jul-
10
Sep
-10
No
v-1
0Ja
n-1
1M
ar-1
1M
ay-1
1Ju
l-1
1Se
p-1
1N
ov-
11
Jan
-12
Mar
-12
May
-12
Jul-
12
Sep
-12
No
v-1
2Ja
n-1
3M
ar-1
3M
ay-1
3Ju
l-1
3Se
p-1
3N
ov-
13
Jan
-14
Mar
-14
May
-14
Jul-
14
Sep
-14
No
v-1
4
CH
F
Δ DWP - IWP Out of quota tariff (CHF/Kg)
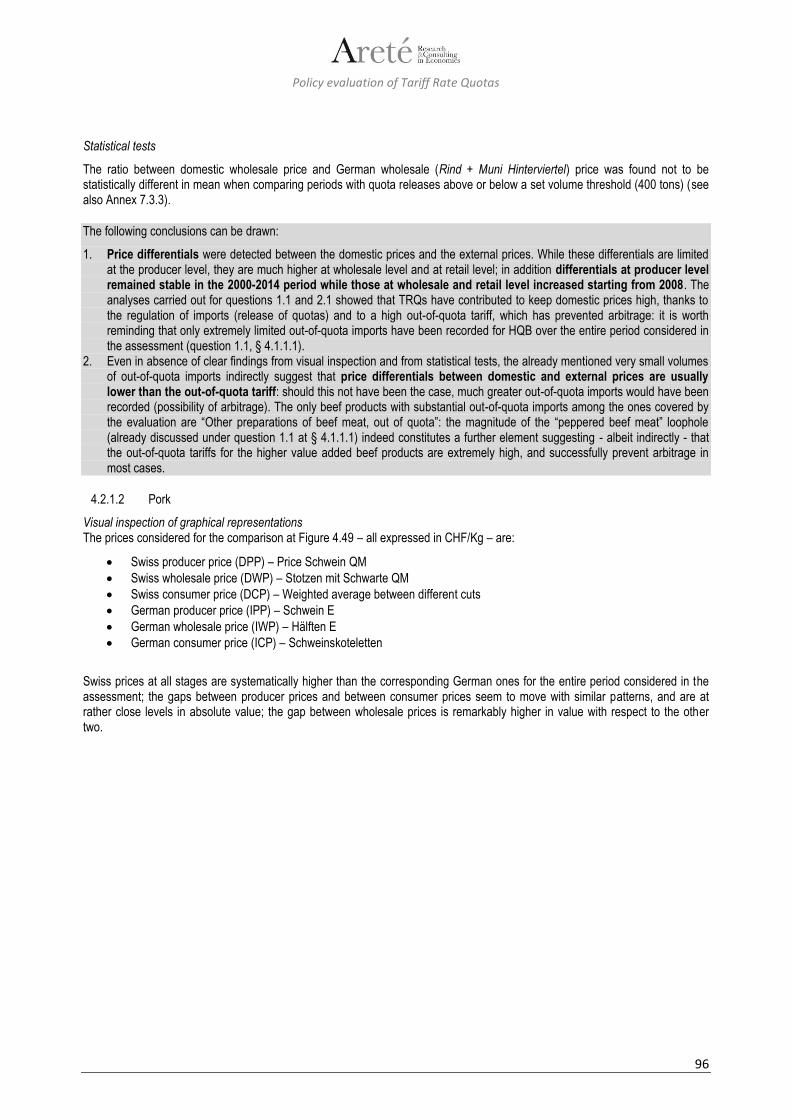
Policy evaluation of Tariff Rate Quotas
96
Statistical tests
The ratio between domestic wholesale price and German wholesale (Rind + Muni Hinterviertel) price was found not to be statistically different in mean when comparing periods with quota releases above or below a set volume threshold (400 tons) (see also Annex 7.3.3).
The following conclusions can be drawn:
1. Price differentials were detected between the domestic prices and the external prices. While these differentials are limited at the producer level, they are much higher at wholesale level and at retail level; in addition differentials at producer level remained stable in the 2000-2014 period while those at wholesale and retail level increased starting from 2008. The analyses carried out for questions 1.1 and 2.1 showed that TRQs have contributed to keep domestic prices high, thanks to the regulation of imports (release of quotas) and to a high out-of-quota tariff, which has prevented arbitrage: it is worth reminding that only extremely limited out-of-quota imports have been recorded for HQB over the entire period considered in the assessment (question 1.1, § 4.1.1.1).
2. Even in absence of clear findings from visual inspection and from statistical tests, the already mentioned very small volumes of out-of-quota imports indirectly suggest that price differentials between domestic and external prices are usually lower than the out-of-quota tariff: should this not have been the case, much greater out-of-quota imports would have been recorded (possibility of arbitrage). The only beef products with substantial out-of-quota imports among the ones covered by the evaluation are “Other preparations of beef meat, out of quota”: the magnitude of the “peppered beef meat” loophole (already discussed under question 1.1 at § 4.1.1.1) indeed constitutes a further element suggesting - albeit indirectly - that the out-of-quota tariffs for the higher value added beef products are extremely high, and successfully prevent arbitrage in most cases.
4.2.1.2 Pork
Visual inspection of graphical representations The prices considered for the comparison at Figure 4.49 – all expressed in CHF/Kg – are:
Swiss producer price (DPP) – Price Schwein QM
Swiss wholesale price (DWP) – Stotzen mit Schwarte QM
Swiss consumer price (DCP) – Weighted average between different cuts
German producer price (IPP) – Schwein E
German wholesale price (IWP) – Hälften E
German consumer price (ICP) – Schweinskoteletten
Swiss prices at all stages are systematically higher than the corresponding German ones for the entire period considered in the assessment; the gaps between producer prices and between consumer prices seem to move with similar patterns, and are at rather close levels in absolute value; the gap between wholesale prices is remarkably higher in value with respect to the other two.
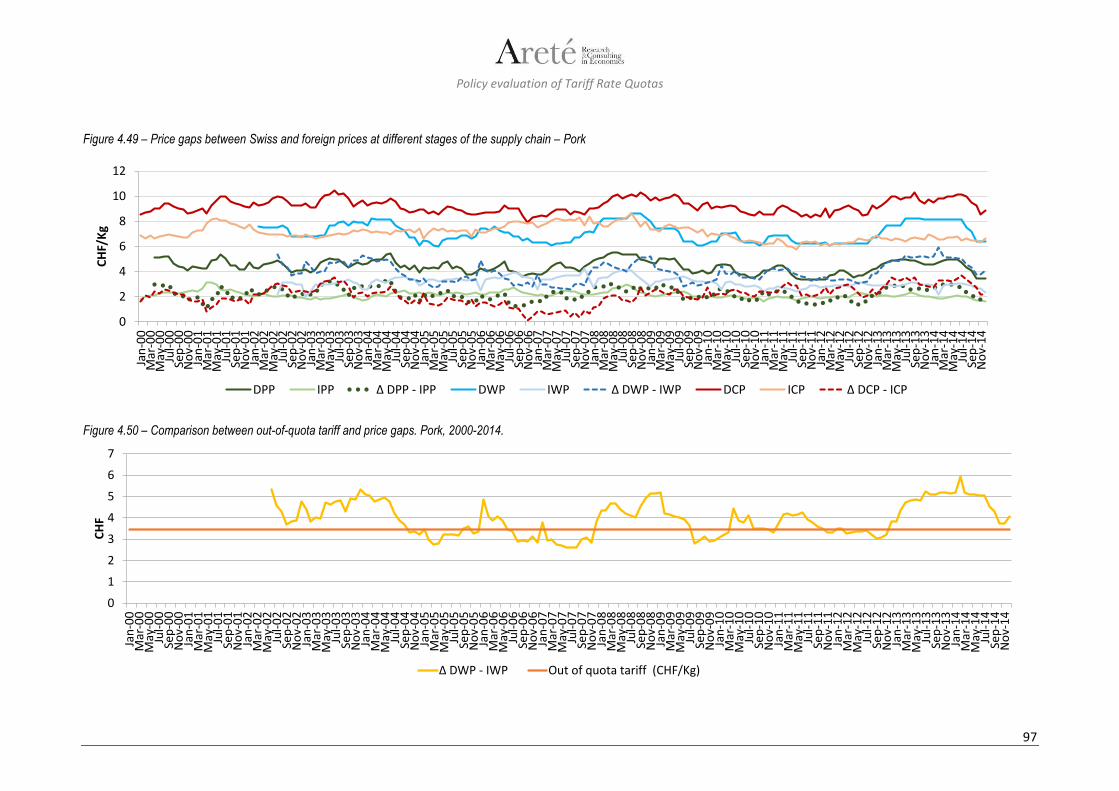
Policy evaluation of Tariff Rate Quotas
97
Figure 4.49 – Price gaps between Swiss and foreign prices at different stages of the supply chain – Pork
Figure 4.50 – Comparison between out-of-quota tariff and price gaps. Pork, 2000-2014.
0
2
4
6
8
10
12
Jan
-00
Mar
-00
May
-00
Jul-
00
Sep
-00
No
v-0
0Ja
n-0
1M
ar-0
1M
ay-0
1Ju
l-0
1Se
p-0
1N
ov-
01
Jan
-02
Mar
-02
May
-02
Jul-
02
Sep
-02
No
v-0
2Ja
n-0
3M
ar-0
3M
ay-0
3Ju
l-0
3Se
p-0
3N
ov-
03
Jan
-04
Mar
-04
May
-04
Jul-
04
Sep
-04
No
v-0
4Ja
n-0
5M
ar-0
5M
ay-0
5Ju
l-0
5Se
p-0
5N
ov-
05
Jan
-06
Mar
-06
May
-06
Jul-
06
Sep
-06
No
v-0
6Ja
n-0
7M
ar-0
7M
ay-0
7Ju
l-0
7Se
p-0
7N
ov-
07
Jan
-08
Mar
-08
May
-08
Jul-
08
Sep
-08
No
v-0
8Ja
n-0
9M
ar-0
9M
ay-0
9Ju
l-0
9Se
p-0
9N
ov-
09
Jan
-10
Mar
-10
May
-10
Jul-
10
Sep
-10
No
v-1
0Ja
n-1
1M
ar-1
1M
ay-1
1Ju
l-1
1Se
p-1
1N
ov-
11
Jan
-12
Mar
-12
May
-12
Jul-
12
Sep
-12
No
v-1
2Ja
n-1
3M
ar-1
3M
ay-1
3Ju
l-1
3Se
p-1
3N
ov-
13
Jan
-14
Mar
-14
May
-14
Jul-
14
Sep
-14
No
v-1
4
CH
F/K
g
DPP IPP Δ DPP - IPP DWP IWP Δ DWP - IWP DCP ICP Δ DCP - ICP
0
1
2
3
4
5
6
7
Jan
-00
Mar
-00
May
-00
Jul-
00
Sep
-00
No
v-0
0Ja
n-0
1M
ar-0
1M
ay-0
1Ju
l-0
1Se
p-0
1N
ov-
01
Jan
-02
Mar
-02
May
-02
Jul-
02
Sep
-02
No
v-0
2Ja
n-0
3M
ar-0
3M
ay-0
3Ju
l-0
3Se
p-0
3N
ov-
03
Jan
-04
Mar
-04
May
-04
Jul-
04
Sep
-04
No
v-0
4Ja
n-0
5M
ar-0
5M
ay-0
5Ju
l-0
5Se
p-0
5N
ov-
05
Jan
-06
Mar
-06
May
-06
Jul-
06
Sep
-06
No
v-0
6Ja
n-0
7M
ar-0
7M
ay-0
7Ju
l-0
7Se
p-0
7N
ov-
07
Jan
-08
Mar
-08
May
-08
Jul-
08
Sep
-08
No
v-0
8Ja
n-0
9M
ar-0
9M
ay-0
9Ju
l-0
9Se
p-0
9N
ov-
09
Jan
-10
Mar
-10
May
-10
Jul-
10
Sep
-10
No
v-1
0Ja
n-1
1M
ar-1
1M
ay-1
1Ju
l-1
1Se
p-1
1N
ov-
11
Jan
-12
Mar
-12
May
-12
Jul-
12
Sep
-12
No
v-1
2Ja
n-1
3M
ar-1
3M
ay-1
3Ju
l-1
3Se
p-1
3N
ov-
13
Jan
-14
Mar
-14
May
-14
Jul-
14
Sep
-14
No
v-1
4
CH
F
Δ DWP - IWP Out of quota tariff (CHF/Kg)
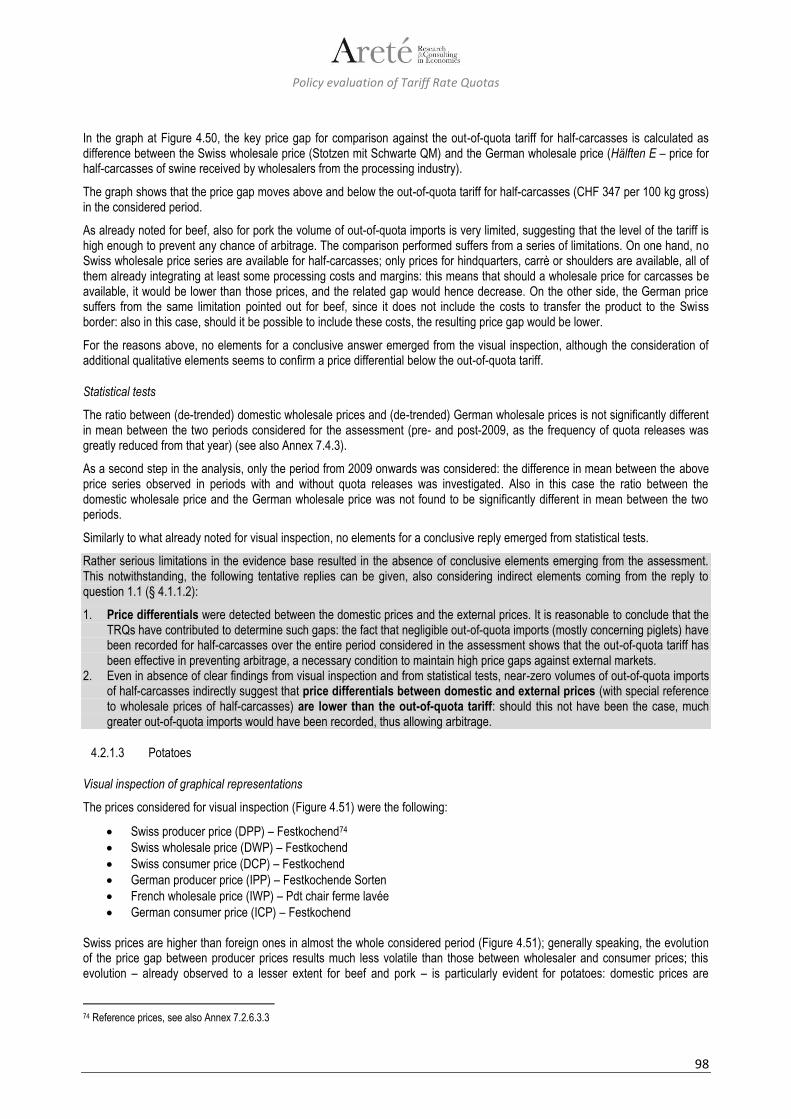
Policy evaluation of Tariff Rate Quotas
98
In the graph at Figure 4.50, the key price gap for comparison against the out-of-quota tariff for half-carcasses is calculated as difference between the Swiss wholesale price (Stotzen mit Schwarte QM) and the German wholesale price (Hälften E – price for half-carcasses of swine received by wholesalers from the processing industry).
The graph shows that the price gap moves above and below the out-of-quota tariff for half-carcasses (CHF 347 per 100 kg gross) in the considered period.
As already noted for beef, also for pork the volume of out-of-quota imports is very limited, suggesting that the level of the tariff is high enough to prevent any chance of arbitrage. The comparison performed suffers from a series of limitations. On one hand, no Swiss wholesale price series are available for half-carcasses; only prices for hindquarters, carrè or shoulders are available, all of them already integrating at least some processing costs and margins: this means that should a wholesale price for carcasses be available, it would be lower than those prices, and the related gap would hence decrease. On the other side, the German price suffers from the same limitation pointed out for beef, since it does not include the costs to transfer the product to the Swiss border: also in this case, should it be possible to include these costs, the resulting price gap would be lower.
For the reasons above, no elements for a conclusive answer emerged from the visual inspection, although the consideration of additional qualitative elements seems to confirm a price differential below the out-of-quota tariff.
Statistical tests
The ratio between (de-trended) domestic wholesale prices and (de-trended) German wholesale prices is not significantly different in mean between the two periods considered for the assessment (pre- and post-2009, as the frequency of quota releases was greatly reduced from that year) (see also Annex 7.4.3).
As a second step in the analysis, only the period from 2009 onwards was considered: the difference in mean between the above price series observed in periods with and without quota releases was investigated. Also in this case the ratio between the domestic wholesale price and the German wholesale price was not found to be significantly different in mean between the two periods.
Similarly to what already noted for visual inspection, no elements for a conclusive reply emerged from statistical tests.
Rather serious limitations in the evidence base resulted in the absence of conclusive elements emerging from the assessment. This notwithstanding, the following tentative replies can be given, also considering indirect elements coming from the reply to question 1.1 (§ 4.1.1.2):
1. Price differentials were detected between the domestic prices and the external prices. It is reasonable to conclude that the TRQs have contributed to determine such gaps: the fact that negligible out-of-quota imports (mostly concerning piglets) have been recorded for half-carcasses over the entire period considered in the assessment shows that the out-of-quota tariff has been effective in preventing arbitrage, a necessary condition to maintain high price gaps against external markets.
2. Even in absence of clear findings from visual inspection and from statistical tests, near-zero volumes of out-of-quota imports of half-carcasses indirectly suggest that price differentials between domestic and external prices (with special reference to wholesale prices of half-carcasses) are lower than the out-of-quota tariff: should this not have been the case, much greater out-of-quota imports would have been recorded, thus allowing arbitrage.
4.2.1.3 Potatoes
Visual inspection of graphical representations
The prices considered for visual inspection (Figure 4.51) were the following:
Swiss producer price (DPP) – Festkochend74
Swiss wholesale price (DWP) – Festkochend
Swiss consumer price (DCP) – Festkochend
German producer price (IPP) – Festkochende Sorten
French wholesale price (IWP) – Pdt chair ferme lavée
German consumer price (ICP) – Festkochend Swiss prices are higher than foreign ones in almost the whole considered period (Figure 4.51); generally speaking, the evolution of the price gap between producer prices results much less volatile than those between wholesaler and consumer prices; this evolution – already observed to a lesser extent for beef and pork – is particularly evident for potatoes: domestic prices are
74 Reference prices, see also Annex 7.2.6.3.3
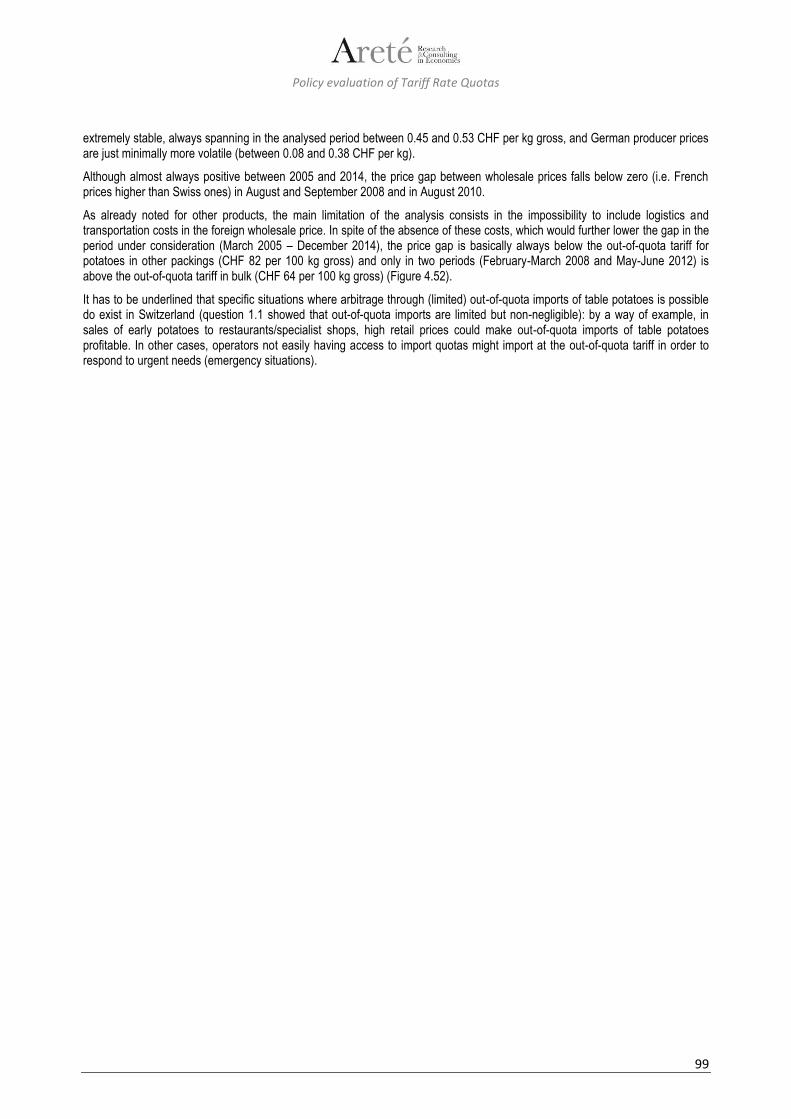
Policy evaluation of Tariff Rate Quotas
99
extremely stable, always spanning in the analysed period between 0.45 and 0.53 CHF per kg gross, and German producer prices are just minimally more volatile (between 0.08 and 0.38 CHF per kg).
Although almost always positive between 2005 and 2014, the price gap between wholesale prices falls below zero (i.e. French prices higher than Swiss ones) in August and September 2008 and in August 2010.
As already noted for other products, the main limitation of the analysis consists in the impossibility to include logistics and transportation costs in the foreign wholesale price. In spite of the absence of these costs, which would further lower the gap in the period under consideration (March 2005 – December 2014), the price gap is basically always below the out-of-quota tariff for potatoes in other packings (CHF 82 per 100 kg gross) and only in two periods (February-March 2008 and May-June 2012) is above the out-of-quota tariff in bulk (CHF 64 per 100 kg gross) (Figure 4.52).
It has to be underlined that specific situations where arbitrage through (limited) out-of-quota imports of table potatoes is possible do exist in Switzerland (question 1.1 showed that out-of-quota imports are limited but non-negligible): by a way of example, in sales of early potatoes to restaurants/specialist shops, high retail prices could make out-of-quota imports of table potatoes profitable. In other cases, operators not easily having access to import quotas might import at the out-of-quota tariff in order to respond to urgent needs (emergency situations).
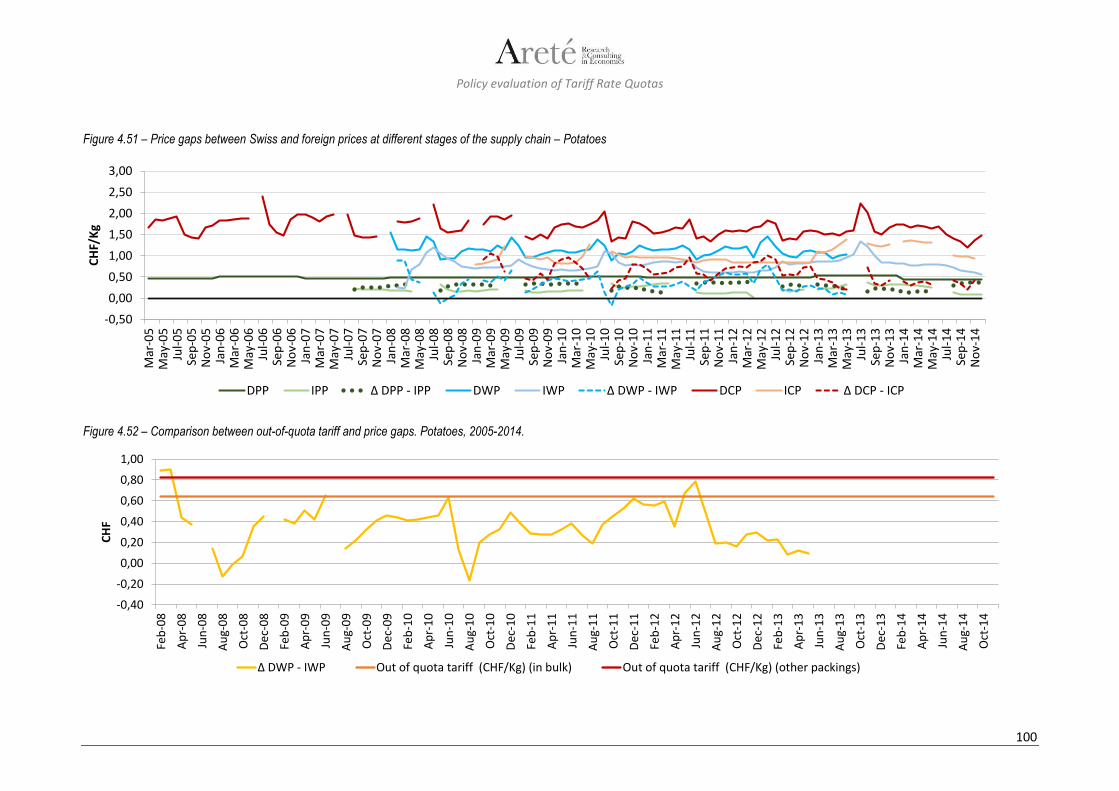
Policy evaluation of Tariff Rate Quotas
100
Figure 4.51 – Price gaps between Swiss and foreign prices at different stages of the supply chain – Potatoes
Figure 4.52 – Comparison between out-of-quota tariff and price gaps. Potatoes, 2005-2014.
-0,50
0,00
0,50
1,00
1,50
2,00
2,50
3,00
Mar
-05
May
-05
Jul-
05
Sep
-05
No
v-0
5Ja
n-0
6M
ar-0
6M
ay-0
6Ju
l-0
6Se
p-0
6N
ov-
06
Jan
-07
Mar
-07
May
-07
Jul-
07
Sep
-07
No
v-0
7Ja
n-0
8M
ar-0
8M
ay-0
8Ju
l-0
8Se
p-0
8N
ov-
08
Jan
-09
Mar
-09
May
-09
Jul-
09
Sep
-09
No
v-0
9Ja
n-1
0M
ar-1
0M
ay-1
0Ju
l-1
0Se
p-1
0N
ov-
10
Jan
-11
Mar
-11
May
-11
Jul-
11
Sep
-11
No
v-1
1Ja
n-1
2M
ar-1
2M
ay-1
2Ju
l-1
2Se
p-1
2N
ov-
12
Jan
-13
Mar
-13
May
-13
Jul-
13
Sep
-13
No
v-1
3Ja
n-1
4M
ar-1
4M
ay-1
4Ju
l-1
4Se
p-1
4N
ov-
14
CH
F/K
g
DPP IPP Δ DPP - IPP DWP IWP Δ DWP - IWP DCP ICP Δ DCP - ICP
-0,40
-0,20
0,00
0,20
0,40
0,60
0,80
1,00
Feb
-08
Ap
r-0
8
Jun
-08
Au
g-0
8
Oct
-08
Dec
-08
Feb
-09
Ap
r-0
9
Jun
-09
Au
g-0
9
Oct
-09
Dec
-09
Feb
-10
Ap
r-1
0
Jun
-10
Au
g-1
0
Oct
-10
Dec
-10
Feb
-11
Ap
r-1
1
Jun
-11
Au
g-1
1
Oct
-11
Dec
-11
Feb
-12
Ap
r-1
2
Jun
-12
Au
g-1
2
Oct
-12
Dec
-12
Feb
-13
Ap
r-1
3
Jun
-13
Au
g-1
3
Oct
-13
Dec
-13
Feb
-14
Ap
r-1
4
Jun
-14
Au
g-1
4
Oct
-14
CH
F
Δ DWP - IWP Out of quota tariff (CHF/Kg) (in bulk) Out of quota tariff (CHF/Kg) (other packings)
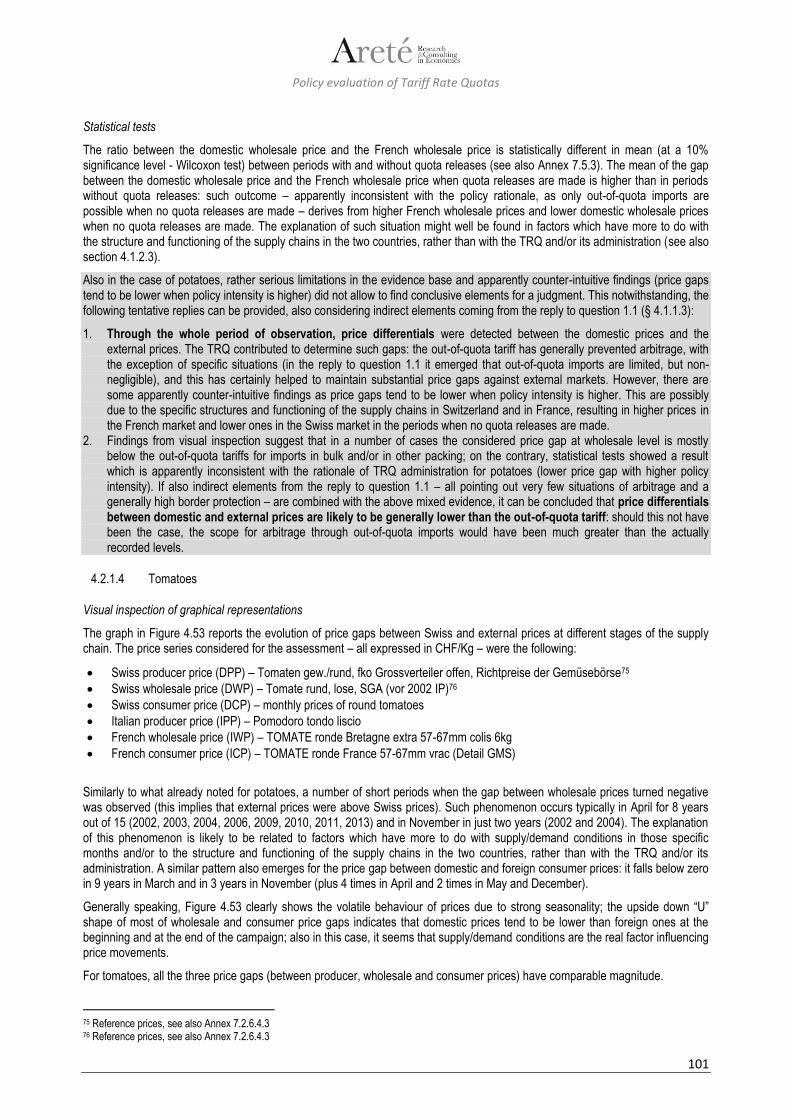
Policy evaluation of Tariff Rate Quotas
101
Statistical tests
The ratio between the domestic wholesale price and the French wholesale price is statistically different in mean (at a 10% significance level - Wilcoxon test) between periods with and without quota releases (see also Annex 7.5.3). The mean of the gap between the domestic wholesale price and the French wholesale price when quota releases are made is higher than in periods without quota releases: such outcome – apparently inconsistent with the policy rationale, as only out-of-quota imports are possible when no quota releases are made – derives from higher French wholesale prices and lower domestic wholesale prices when no quota releases are made. The explanation of such situation might well be found in factors which have more to do with the structure and functioning of the supply chains in the two countries, rather than with the TRQ and/or its administration (see also section 4.1.2.3).
Also in the case of potatoes, rather serious limitations in the evidence base and apparently counter-intuitive findings (price gaps tend to be lower when policy intensity is higher) did not allow to find conclusive elements for a judgment. This notwithstanding, the following tentative replies can be provided, also considering indirect elements coming from the reply to question 1.1 (§ 4.1.1.3):
1. Through the whole period of observation, price differentials were detected between the domestic prices and the external prices. The TRQ contributed to determine such gaps: the out-of-quota tariff has generally prevented arbitrage, with the exception of specific situations (in the reply to question 1.1 it emerged that out-of-quota imports are limited, but non-negligible), and this has certainly helped to maintain substantial price gaps against external markets. However, there are some apparently counter-intuitive findings as price gaps tend to be lower when policy intensity is higher. This are possibly due to the specific structures and functioning of the supply chains in Switzerland and in France, resulting in higher prices in the French market and lower ones in the Swiss market in the periods when no quota releases are made.
2. Findings from visual inspection suggest that in a number of cases the considered price gap at wholesale level is mostly below the out-of-quota tariffs for imports in bulk and/or in other packing; on the contrary, statistical tests showed a result which is apparently inconsistent with the rationale of TRQ administration for potatoes (lower price gap with higher policy intensity). If also indirect elements from the reply to question 1.1 – all pointing out very few situations of arbitrage and a generally high border protection – are combined with the above mixed evidence, it can be concluded that price differentials between domestic and external prices are likely to be generally lower than the out-of-quota tariff: should this not have been the case, the scope for arbitrage through out-of-quota imports would have been much greater than the actually recorded levels.
4.2.1.4 Tomatoes
Visual inspection of graphical representations
The graph in Figure 4.53 reports the evolution of price gaps between Swiss and external prices at different stages of the supply chain. The price series considered for the assessment – all expressed in CHF/Kg – were the following:
Swiss producer price (DPP) – Tomaten gew./rund, fko Grossverteiler offen, Richtpreise der Gemüsebörse75
Swiss wholesale price (DWP) – Tomate rund, lose, SGA (vor 2002 IP)76
Swiss consumer price (DCP) – monthly prices of round tomatoes
Italian producer price (IPP) – Pomodoro tondo liscio
French wholesale price (IWP) – TOMATE ronde Bretagne extra 57-67mm colis 6kg
French consumer price (ICP) – TOMATE ronde France 57-67mm vrac (Detail GMS)
Similarly to what already noted for potatoes, a number of short periods when the gap between wholesale prices turned negative was observed (this implies that external prices were above Swiss prices). Such phenomenon occurs typically in April for 8 years out of 15 (2002, 2003, 2004, 2006, 2009, 2010, 2011, 2013) and in November in just two years (2002 and 2004). The explanation of this phenomenon is likely to be related to factors which have more to do with supply/demand conditions in those specific months and/or to the structure and functioning of the supply chains in the two countries, rather than with the TRQ and/or its administration. A similar pattern also emerges for the price gap between domestic and foreign consumer prices: it falls below zero in 9 years in March and in 3 years in November (plus 4 times in April and 2 times in May and December).
Generally speaking, Figure 4.53 clearly shows the volatile behaviour of prices due to strong seasonality; the upside down “U” shape of most of wholesale and consumer price gaps indicates that domestic prices tend to be lower than foreign ones at the beginning and at the end of the campaign; also in this case, it seems that supply/demand conditions are the real factor influencing price movements.
For tomatoes, all the three price gaps (between producer, wholesale and consumer prices) have comparable magnitude.
75 Reference prices, see also Annex 7.2.6.4.3 76 Reference prices, see also Annex 7.2.6.4.3

Policy evaluation of Tariff Rate Quotas
102
Figure 4.53 – Price gaps between Swiss and foreign prices at different stages of the supply chain – Tomatoes
Figure 4.54 – Comparison between out-of-quota tariff and price gaps. Tomato, 2000-2014.
-2,0
-1,0
0,0
1,0
2,0
3,0
4,0
5,0
6,0
Jan
-00
Mar
-00
May
-00
Jul-
00
Sep
-00
No
v-0
0Ja
n-0
1M
ar-0
1M
ay-0
1Ju
l-0
1Se
p-0
1N
ov-
01
Jan
-02
Mar
-02
May
-02
Jul-
02
Sep
-02
No
v-0
2Ja
n-0
3M
ar-0
3M
ay-0
3Ju
l-0
3Se
p-0
3N
ov-
03
Jan
-04
Mar
-04
May
-04
Jul-
04
Sep
-04
No
v-0
4Ja
n-0
5M
ar-0
5M
ay-0
5Ju
l-0
5Se
p-0
5N
ov-
05
Jan
-06
Mar
-06
May
-06
Jul-
06
Sep
-06
No
v-0
6Ja
n-0
7M
ar-0
7M
ay-0
7Ju
l-0
7Se
p-0
7N
ov-
07
Jan
-08
Mar
-08
May
-08
Jul-
08
Sep
-08
No
v-0
8Ja
n-0
9M
ar-0
9M
ay-0
9Ju
l-0
9Se
p-0
9N
ov-
09
Jan
-10
Mar
-10
May
-10
Jul-
10
Sep
-10
No
v-1
0Ja
n-1
1M
ar-1
1M
ay-1
1Ju
l-1
1Se
p-1
1N
ov-
11
Jan
-12
Mar
-12
May
-12
Jul-
12
Sep
-12
No
v-1
2Ja
n-1
3M
ar-1
3M
ay-1
3Ju
l-1
3Se
p-1
3N
ov-
13
Jan
-14
Mar
-14
May
-14
Jul-
14
Sep
-14
No
v-1
4
CH
F/K
g
DPP IPP Δ DPP - IPP DWP IWP Δ DWP - IWP DCP ICP Δ DCP - ICP
-1,0
-0,5
0,0
0,5
1,0
1,5
2,0
2,5
3,0
Mar
-01
Jul-
01
No
v-0
1
Mar
-02
Jul-
02
No
v-0
2
Mar
-03
Jul-
03
No
v-0
3
Mar
-04
Jul-
04
No
v-0
4
Mar
-05
Jul-
05
No
v-0
5
Mar
-06
Jul-
06
No
v-0
6
Mar
-07
Jul-
07
No
v-0
7
Mar
-08
Jul-
08
No
v-0
8
Mar
-09
Jul-
09
No
v-0
9
Mar
-10
Jul-
10
No
v-1
0
Mar
-11
Jul-
11
No
v-1
1
Mar
-12
Jul-
12
No
v-1
2
Mar
-13
Jul-
13
No
v-1
3
Mar
-14
Jul-
14
No
v-1
4
CH
F
Δ DWP - IWP Out of quota tariff (CHF/Kg)

Policy evaluation of Tariff Rate Quotas
103
The graph in Figure 4.54 compares the difference between the domestic wholesale price of round tomatoes and the French wholesale price (tomate ronde Bretagne extra 57-67mm colis 6kg) with the full out-of-quota tariff in the managed period (CHF 264 per 100 Kg gross).
The same caveats already made for potatoes (the non-factoring of logistic costs and of washing / selection / packing costs into the external wholesale price inflates the gap to some extent) also apply to tomatoes. It is also essential to underline that a comparison of price gaps for tomatoes against the out-of-quota tariff must be limited to the administered periods in each year, which span from May 1st to October 20th.
The price gap between domestic and foreign wholesale prices is below the out-of-quota tariff for the whole analysed period. This suggests that the out-of-quota tariff is high enough to prevent arbitrage during the domestic harvest season, also considering the negligible out-of-quota imports emerged from the assessment under question 1.1.
A caveat applies in the interpretation of the above pattern: for fruit and vegetables, the price reporting system, when both domestic and imported products are marketed (i.e. in the transition between the non-administered period and the administered one), switches from reporting the price of imported products (the only available in the non-administered period) to reporting the price of domestic products. This switch could amplify the magnitude of price peaks.
Statistical tests
The ratio between the domestic wholesale price and the French wholesale price is statistically different in mean (at a 1% significance level) between the administered and non-administered periods (see also Annex 7.6.3). The mean of the gap between the domestic wholesale price and the French wholesale price during the administered period is higher than during the non-administered period (this derives from lower French wholesale prices and higher domestic wholesale prices during the administered period, compared to the non-administered one). This result is consistent with the rationale of the two-phase TRQ administration model applied to fresh fruit and vegetables, which is aimed at creating the most favourable conditions (i.e. higher price gaps) for the domestic supply chain against the external competitors in the administered period, i.e. when domestic production is harvested and placed on the market.
In spite of some limitations (mainly related to inflation of price gaps due to non-factoring of logistic / washing / selection / packing costs), the findings of the assessment are solid enough to provide conclusive replies, also considering indirect elements coming from the reply to question 1.1 (§ 4.1.1.4):
1. Price gaps – albeit very volatile due to strong seasonality of the product – were detected between the domestic prices and the foreign prices. The TRQ and its administration have certainly contributed to determine such gaps, especially in the administered period: the out-of-quota tariff has systematically prevented arbitrage (in the reply to question 1.1 it emerged that out-of-quota imports are negligible), and this has certainly helped to maintain substantial price gaps against external markets. Also the results of the statistical tests were perfectly consistent with the rationale of the two-phase TRQ administration model applied to fresh fruit and vegetables (higher price gaps with higher policy intensity in the administered period): this further demonstrates the role played by TRQ administration in maintaining price differentials against external markets.
2. Visual inspection showed that the considered price gap at wholesale level stays below the out-of-quota tariff during the administered period, coinciding with the core of the domestic campaign. Findings from question 1.1 - showing that out-of-quota imports of round tomatoes are negligible - prove that observed price gaps above the out-of-quota tariff at the beginning and at the end of the administered period have no practical implication whatsoever. It can hence be concluded that price differentials between domestic and external prices are generally lower than the out-of-quota tariff, which is high enough to prevent arbitrage (out-of-quota imports have always been negligible in the period considered for the assessment).
4.2.1.5 Apples
Visual inspection of graphical representations
The graph in Figure 4.55 reports the price gaps between Swiss and external prices at different stages of the supply chain considered for the assessment (all expressed in CHF/Kg):
Swiss producer price (DPP) – Pommes de table: prix indicatifs définitifs nationaux - Golden Delicious class 177
Swiss wholesale price (DWP) – Äpfel Golden (12,5 vrac)78
Swiss consumer price (DCP) – Äpfel Golden I
German producer price (IPP) – Golden Delicious Kl. Extra und Kl. I
Italian wholesale price (IWP) – Mele Golden Delicious
French consumer price (ICP) – Golden France +170g vrac
77 Reference prices, see also Annex 7.2.6.5.3 78 Reference prices, see also Annex 7.2.6.5.3

Policy evaluation of Tariff Rate Quotas
104
Price gaps at the different stages of the supply chain move with rather different patterns.
The gap between producer prices is relatively limited (it generally falls in the 0-0,5 CHF/Kg range) and rather stable over the 15 years considered in the assessment; it becomes negative (domestic producer price < external producer price) only between May and July 2008.
The gap between wholesale prices can be calculated for an extremely limited number of short periods: it is hence difficult to identify any kind of trend (in the few months between 2011 and 2014 for which the two prices are available, the gap oscillates above and below 0 CHF/kg). Finally, the gap between consumer prices is on average the highest but also the most irregular; it becomes negative only twice (in August 2008 and in August/September 2013).
The results of the assessment for apples should be read taking into due account the following limitations:
1. Once again, costs related to logistics, washing, selection and packing are not factored into the analysis of price gaps, which are hence inflated.
2. The administered period for apples spans between July 15th and June 14th: whenever no releases of import quotas are made in this eleven-month period, only imports at the out-of-quota tariffs are possible.
Due to limitations in the available series of external wholesale prices, the comparison between the domestic wholesale price (Äpfel Golden) and foreign wholesale price (Mele Golden Delicious) is only possible for the period August 2011 – December 2014 and – within this period – for a limited number of months (17 in total in the four year period). In this timeframe, such price gap is always below the out-of-quota tariff, and in seven months (October 2012, October-November 2013 and September-December 2014) it falls below zero, thus indicating that the Italian wholesale prices are higher than the Swiss ones.
All in all, due to the extremely limited available price series, no solid enough elements for a conclusive answer emerged from the assessment.
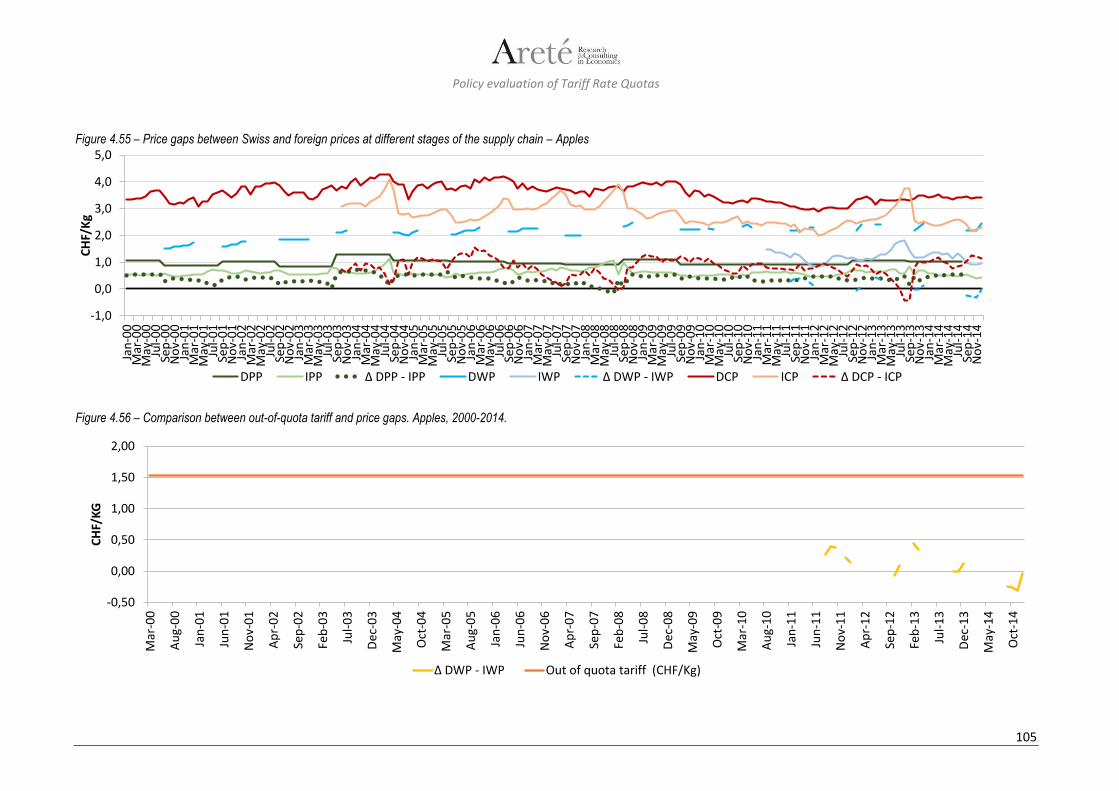
Policy evaluation of Tariff Rate Quotas
105
Figure 4.55 – Price gaps between Swiss and foreign prices at different stages of the supply chain – Apples
Figure 4.56 – Comparison between out-of-quota tariff and price gaps. Apples, 2000-2014.
-1,0
0,0
1,0
2,0
3,0
4,0
5,0
Jan
-00
Mar
-00
May
-00
Jul-
00
Sep
-00
No
v-0
0Ja
n-0
1M
ar-0
1M
ay-0
1Ju
l-0
1Se
p-0
1N
ov-
01
Jan
-02
Mar
-02
May
-02
Jul-
02
Sep
-02
No
v-0
2Ja
n-0
3M
ar-0
3M
ay-0
3Ju
l-0
3Se
p-0
3N
ov-
03
Jan
-04
Mar
-04
May
-04
Jul-
04
Sep
-04
No
v-0
4Ja
n-0
5M
ar-0
5M
ay-0
5Ju
l-0
5Se
p-0
5N
ov-
05
Jan
-06
Mar
-06
May
-06
Jul-
06
Sep
-06
No
v-0
6Ja
n-0
7M
ar-0
7M
ay-0
7Ju
l-0
7Se
p-0
7N
ov-
07
Jan
-08
Mar
-08
May
-08
Jul-
08
Sep
-08
No
v-0
8Ja
n-0
9M
ar-0
9M
ay-0
9Ju
l-0
9Se
p-0
9N
ov-
09
Jan
-10
Mar
-10
May
-10
Jul-
10
Sep
-10
No
v-1
0Ja
n-1
1M
ar-1
1M
ay-1
1Ju
l-1
1Se
p-1
1N
ov-
11
Jan
-12
Mar
-12
May
-12
Jul-
12
Sep
-12
No
v-1
2Ja
n-1
3M
ar-1
3M
ay-1
3Ju
l-1
3Se
p-1
3N
ov-
13
Jan
-14
Mar
-14
May
-14
Jul-
14
Sep
-14
No
v-1
4
CH
F/K
g
DPP IPP Δ DPP - IPP DWP IWP Δ DWP - IWP DCP ICP Δ DCP - ICP
-0,50
0,00
0,50
1,00
1,50
2,00
Mar
-00
Au
g-0
0
Jan
-01
Jun
-01
No
v-0
1
Ap
r-0
2
Sep
-02
Feb
-03
Jul-
03
Dec
-03
May
-04
Oct
-04
Mar
-05
Au
g-0
5
Jan
-06
Jun
-06
No
v-0
6
Ap
r-0
7
Sep
-07
Feb
-08
Jul-
08
Dec
-08
May
-09
Oct
-09
Mar
-10
Au
g-1
0
Jan
-11
Jun
-11
No
v-1
1
Ap
r-1
2
Sep
-12
Feb
-13
Jul-
13
Dec
-13
May
-14
Oct
-14
CH
F/K
G
Δ DWP - IWP Out of quota tariff (CHF/Kg)

Policy evaluation of Tariff Rate Quotas
106
Statistical tests
Testing the statistical significance of the difference in mean of the ratio between domestic wholesale price and the Italian wholesale price during the administered and the non-administered period was not possible, because of the lack of data for domestic wholesale prices during the non-managed period.
In the case of apples, rather serious limitations in the evidence base did not allow to find conclusive elements for a judgment from visual inspection of graphical representations and from statistical tests. On the other hand, taking into account indirect elements coming from the reply to question 1.1, the following elements can be highlighted:
1. Gaps ranging from -0.4 to +1.5 CHF/kg at producer level, from -0.3 to +0.4 CHF/kg at wholesale level and from -0.2 to 0.7 CHF/kg at consumer level were detected between the domestic prices and the external prices. A number of elements suggests that the TRQ has contributed to determine such gaps. The out-of-quota tariff has prevented massive arbitrage, limiting out-of-quota imports to specific situations: the reply to question 1.1 highlighted that out-of-quota imports of apples are relatively limited, but non-negligible, and mainly derive from quality/assortment-related needs.
2. As for the assessment of price gaps against the level of the out-of-quota tariff, various limitations in the evidence base did not allow to draw elements for a conclusive reply from visual inspection of graphical representations. However, if also indirect elements from the reply to question 1.1 are taken into account, it is reasonable to conclude that gaps between domestic and external prices are likely to be generally lower than the out-of-quota tariff: should this not have been the case, the scope for arbitrage through out-of-quota imports would have been much greater than the actually recorded levels.
4.2.1.6 Strawberries
Visual inspection of graphical representations
The graph in Figure 4.57 describes the evolution of price gaps between Swiss and external prices at different stages of the supply chain. The prices considered in the assessment – all expressed in CHF/Kg – were the following:
Swiss producer price (DPP) – Erdbeeren Produzentenrichtpreis79
Swiss wholesale price (DWP) – Prix indicatif au départ centre de ramassage reconstructed on the basis of the Swiss producer price80
Swiss consumer price (DCP) – Erdbeeren
Italian producer price (IPP) – Fragole
French wholesale price (IWP) – Fraise standard France cat.I barq.500g (marché: Lyon)
Italian consumer price (ICP) – Fragole
The gap between producer prices is lower than the one between consumer prices, and higher than the one at wholesale level; it has remained rather stable across the whole period considered in the assessment (although only punctual comparisons could be made, due to the limited number of observations available: this derives from seasonality of strawberry production, and from the rather short duration of the campaign).
The gap between wholesale prices is the lowest of the three and very volatile, spanning from -1.58 CHF (September 2003) to 3.35 CHF in August 2013; in twelve months out of the total 62 for which both price series are available, the gap falls below zero (Oct 2000, Oct 2002, Jun-Oct 2003, Oct 2004, Aug 2005, Aug 2006, Jul 2007 and Jul 2008) indicating lower prices on the Swiss markets with respect to the French one.
As for the gap between consumer prices, the time span covered by available data is much shorter (2011 – 2014); moreover, this gap seems to suffer from serious limitations related to the seasonality of both production and consumption of strawberries (especially for what concerns prices recorded during off-season months). For these reasons, there is great volatility in the extent of the gap; however, the Swiss consumer price falls below the Italian one in two periods only: March-April 2011 and April 2012.
79 Reference prices, see also Annex 7.2.6.6.3 80 Reference prices, see also Annex 7.2.6.6.3

Policy evaluation of Tariff Rate Quotas
107
Figure 4.57 – Price gaps between Swiss and foreign prices at different stages of the supply chain – Strawberries
Figure 4.58 – Comparison between out-of-quota tariff and price gaps. Strawberries, 2000-2014.
-5,0
0,0
5,0
10,0
15,0
20,0
25,0M
ay-0
0Ju
l-0
0Se
p-0
0N
ov-
00
Jan
-01
Mar
-01
May
-01
Jul-
01
Sep
-01
No
v-0
1Ja
n-0
2M
ar-0
2M
ay-0
2Ju
l-0
2Se
p-0
2N
ov-
02
Jan
-03
Mar
-03
May
-03
Jul-
03
Sep
-03
No
v-0
3Ja
n-0
4M
ar-0
4M
ay-0
4Ju
l-0
4Se
p-0
4N
ov-
04
Jan
-05
Mar
-05
May
-05
Jul-
05
Sep
-05
No
v-0
5Ja
n-0
6M
ar-0
6M
ay-0
6Ju
l-0
6Se
p-0
6N
ov-
06
Jan
-07
Mar
-07
May
-07
Jul-
07
Sep
-07
No
v-0
7Ja
n-0
8M
ar-0
8M
ay-0
8Ju
l-0
8Se
p-0
8N
ov-
08
Jan
-09
Mar
-09
May
-09
Jul-
09
Sep
-09
No
v-0
9Ja
n-1
0M
ar-1
0M
ay-1
0Ju
l-1
0Se
p-1
0N
ov-
10
Jan
-11
Mar
-11
May
-11
Jul-
11
Sep
-11
No
v-1
1Ja
n-1
2M
ar-1
2M
ay-1
2Ju
l-1
2Se
p-1
2N
ov-
12
Jan
-13
Mar
-13
May
-13
Jul-
13
Sep
-13
No
v-1
3Ja
n-1
4M
ar-1
4M
ay-1
4Ju
l-1
4Se
p-1
4N
ov-
14
CH
F/K
g
DPP IPP Δ DPP - IPP DWP IWP Δ DWP - IWP DCP ICP Δ DCP - ICP
-2,00
-1,00
0,00
1,00
2,00
3,00
4,00
5,00
6,00
Jan
-00
Mar
-00
May
-00
Jul-
00
Sep
-00
No
v-0
0Ja
n-0
1M
ar-0
1M
ay-0
1Ju
l-0
1Se
p-0
1N
ov-
01
Jan
-02
Mar
-02
May
-02
Jul-
02
Sep
-02
No
v-0
2Ja
n-0
3M
ar-0
3M
ay-0
3Ju
l-0
3Se
p-0
3N
ov-
03
Jan
-04
Mar
-04
May
-04
Jul-
04
Sep
-04
No
v-0
4Ja
n-0
5M
ar-0
5M
ay-0
5Ju
l-0
5Se
p-0
5N
ov-
05
Jan
-06
Mar
-06
May
-06
Jul-
06
Sep
-06
No
v-0
6Ja
n-0
7M
ar-0
7M
ay-0
7Ju
l-0
7Se
p-0
7N
ov-
07
Jan
-08
Mar
-08
May
-08
Jul-
08
Sep
-08
No
v-0
8Ja
n-0
9M
ar-0
9M
ay-0
9Ju
l-0
9Se
p-0
9N
ov-
09
Jan
-10
Mar
-10
May
-10
Jul-
10
Sep
-10
No
v-1
0Ja
n-1
1M
ar-1
1M
ay-1
1Ju
l-1
1Se
p-1
1N
ov-
11
Jan
-12
Mar
-12
May
-12
Jul-
12
Sep
-12
No
v-1
2Ja
n-1
3M
ar-1
3M
ay-1
3Ju
l-1
3Se
p-1
3N
ov-
13
Jan
-14
Mar
-14
May
-14
Jul-
14
Sep
-14
No
v-1
4
CH
F
Δ DWP - IWP Δ DWP - IWP 2 Out of quota tariff (CHF/Kg)

Policy evaluation of Tariff Rate Quotas
108
The results of the assessment should once again be read taking into due account that costs related to logistics, washing, selection and packing of strawberries are not factored into the analysis of price gaps, which are hence inflated. When interpreting the graph, it also has to be kept in mind that the reporting method of retail prices of strawberries on the Swiss market when both domestic and imported products are present, always reflects first the domestic good, and then the imported one. This practice can further amplify the effect on retail prices of the switch from the non-administered phase to the administered one.
The graph in Figure 4.58 reports the price gaps between domestic wholesale price and the French wholesale price and between domestic wholesale price and Italian wholesale price (Fragole – IWP 2).
Over the whole examined period, the difference between the Swiss wholesale price and the French one is below the out-of-quota tariff; as already noted, the gap often falls below zero in October (until 2004) and in July-August (2005-2008): this might be explained by differences in the quality of products available on the two markets in that specific period.
As for the price gap between domestic wholesale price and Italian wholesale price, data are available only in the 2011-2014 period (due to unavailability of Italian prices for the previous years); this gap stays below the out-of-quota tariff during the whole period.
Taking into account all the above elements, and applying due prudence, it can be concluded that the analysed price gaps – albeit limited by the availability of continuous price series – are below the out-of-quota tariff; this conclusion is reinforced by the fact that out-of-quota imports of strawberries have always been negligible over the entire period considered in the assessment (see the reply to question 1.1 at § 4.1.1.6).
Statistical tests
The ratio between the domestic wholesale price and the French wholesale price is statistically different in mean (at a 1% significance level) between the managed and non-managed periods (see also Annex 7.8.3). The mean of such gap during the administered period is higher than during the non-administered period (due to lower French wholesale price and higher domestic wholesale price in the administered period compared to the non-administered one). Once again, this result is consistent with the rationale of the two-phase TRQ administration model applied to strawberries, which is aimed at creating the most favourable conditions for the domestic supply chain against the external competitors in the administered period, coinciding with the duration of the domestic harvest season.
Rather serious limitations in the evidence base for strawberries (especially the short length of some external price series) did not allow to find conclusive elements for a judgment already from visual inspection of graphical representations. On the other hand, results from statistical tests were once again consistent with the rationale of the two-phase TRQ administration model applied to strawberries; taking into account also indirect elements coming from the reply to question 1.1 (§ 4.1.1.6), it can hence be concluded that:
1. Gaps ranging from 3.0 to 4.9 CHF/kg at producer level, from -1.6 to 3.4 CHF/kg at wholesale level and from -1.0 to 13.4 CHF/kg at consumer level, show a marked volatility. A number of elements suggests that the TRQs have greatly contributed to determine such gaps. The out-of-quota tariff has systematically impeded arbitrage: the reply to question 1.1 highlighted that out-of-quota imports of strawberries have been negligible over the entire period considered in the assessment. Moreover, the results of the statistical tests were consistent with the rationale of the two-phase TRQ administration model adopted for strawberries (higher price gaps with higher policy intensity in the administered period): this further proves the role played by TRQ administration in maintaining price differentials against external markets.
2. As for the assessment of price gaps against the level of the out-of-quota tariff, although the availability of price series limited the possibility of complete comparisons, visual inspection of graphical representations indicated that price differentials at wholesale level stay below the out-of-quota tariff. If also indirect elements from the reply to question 1.1 are taken into account, it can safely be concluded that gaps between domestic and external prices have generally been lower than the out-of-quota tariff: this is demonstrated by the negligible volumes of out-of-quota imports.
4.2.2 Reply to Q 2.2: impact on price stability
What is the contribution to stable domestic prices?
The reply to this question is mainly based on the results of a set of statistical tests (analysis of coefficients of variation and of variance) on the concerned price series. The results are synthetically presented for each of the six products covered by the evaluation; a synoptic reply is then provided, highlighting the product specificities which emerged from the assessment.
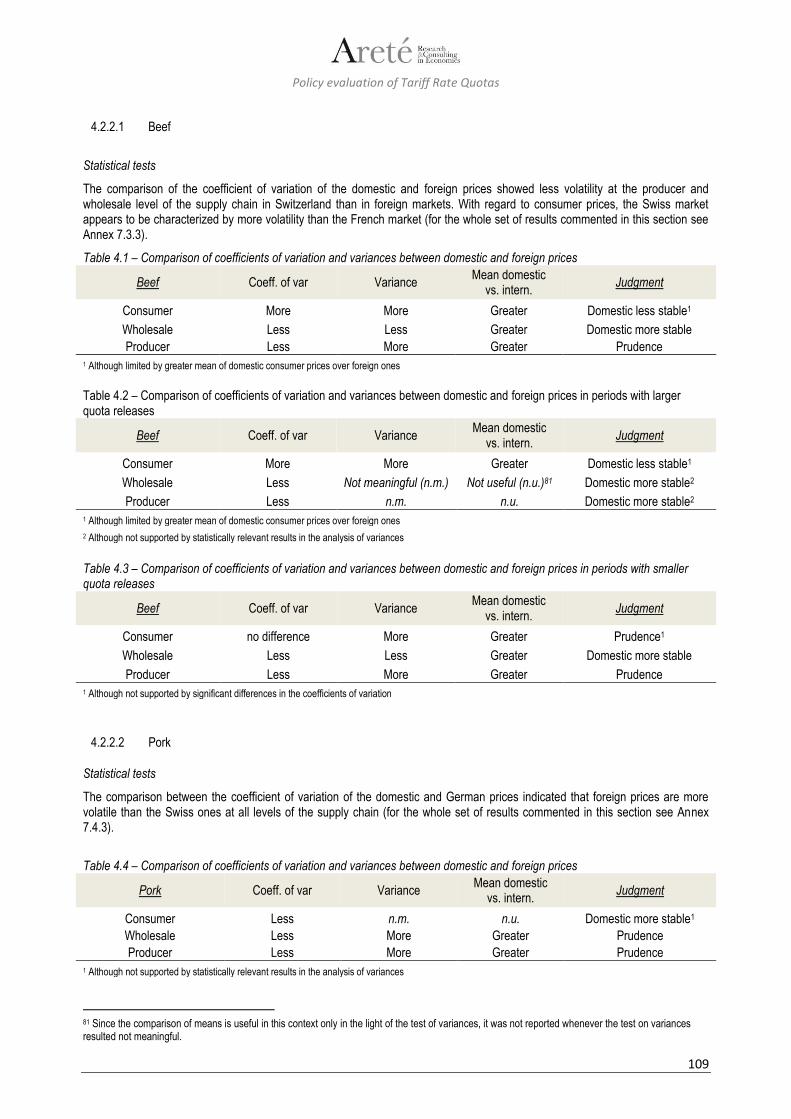
Policy evaluation of Tariff Rate Quotas
109
4.2.2.1 Beef
Statistical tests
The comparison of the coefficient of variation of the domestic and foreign prices showed less volatility at the producer and wholesale level of the supply chain in Switzerland than in foreign markets. With regard to consumer prices, the Swiss market appears to be characterized by more volatility than the French market (for the whole set of results commented in this section see Annex 7.3.3).
Table 4.1 – Comparison of coefficients of variation and variances between domestic and foreign prices
Beef Coeff. of var Variance Mean domestic
vs. intern. Judgment
Consumer More More Greater Domestic less stable1
Wholesale Less Less Greater Domestic more stable
Producer Less More Greater Prudence 1 Although limited by greater mean of domestic consumer prices over foreign ones
Table 4.2 – Comparison of coefficients of variation and variances between domestic and foreign prices in periods with larger quota releases
Beef Coeff. of var Variance Mean domestic
vs. intern. Judgment
Consumer More More Greater Domestic less stable1
Wholesale Less Not meaningful (n.m.) Not useful (n.u.)81 Domestic more stable2
Producer Less n.m. n.u. Domestic more stable2
1 Although limited by greater mean of domestic consumer prices over foreign ones
2 Although not supported by statistically relevant results in the analysis of variances
Table 4.3 – Comparison of coefficients of variation and variances between domestic and foreign prices in periods with smaller quota releases
Beef Coeff. of var Variance Mean domestic
vs. intern. Judgment
Consumer no difference More Greater Prudence1
Wholesale Less Less Greater Domestic more stable
Producer Less More Greater Prudence 1 Although not supported by significant differences in the coefficients of variation
4.2.2.2 Pork
Statistical tests
The comparison between the coefficient of variation of the domestic and German prices indicated that foreign prices are more volatile than the Swiss ones at all levels of the supply chain (for the whole set of results commented in this section see Annex 7.4.3).
Table 4.4 – Comparison of coefficients of variation and variances between domestic and foreign prices
Pork Coeff. of var Variance Mean domestic
vs. intern. Judgment
Consumer Less n.m. n.u. Domestic more stable1
Wholesale Less More Greater Prudence
Producer Less More Greater Prudence
1 Although not supported by statistically relevant results in the analysis of variances
81 Since the comparison of means is useful in this context only in the light of the test of variances, it was not reported whenever the test on variances resulted not meaningful.
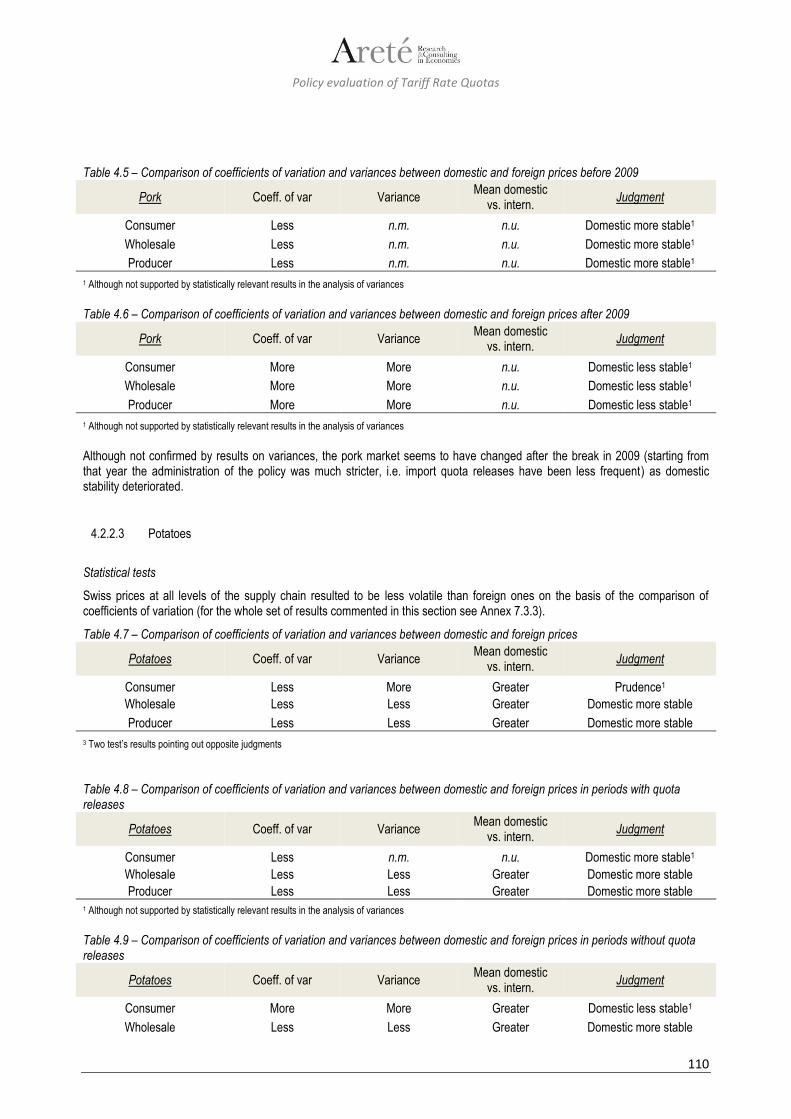
Policy evaluation of Tariff Rate Quotas
110
Table 4.5 – Comparison of coefficients of variation and variances between domestic and foreign prices before 2009
Pork Coeff. of var Variance Mean domestic
vs. intern. Judgment
Consumer Less n.m. n.u. Domestic more stable1
Wholesale Less n.m. n.u. Domestic more stable1
Producer Less n.m. n.u. Domestic more stable1
1 Although not supported by statistically relevant results in the analysis of variances
Table 4.6 – Comparison of coefficients of variation and variances between domestic and foreign prices after 2009
Pork Coeff. of var Variance Mean domestic
vs. intern. Judgment
Consumer More More n.u. Domestic less stable1
Wholesale More More n.u. Domestic less stable1
Producer More More n.u. Domestic less stable1
1 Although not supported by statistically relevant results in the analysis of variances
Although not confirmed by results on variances, the pork market seems to have changed after the break in 2009 (starting from that year the administration of the policy was much stricter, i.e. import quota releases have been less frequent) as domestic stability deteriorated.
4.2.2.3 Potatoes
Statistical tests
Swiss prices at all levels of the supply chain resulted to be less volatile than foreign ones on the basis of the comparison of coefficients of variation (for the whole set of results commented in this section see Annex 7.3.3).
Table 4.7 – Comparison of coefficients of variation and variances between domestic and foreign prices
Potatoes Coeff. of var Variance Mean domestic
vs. intern. Judgment
Consumer Less More Greater Prudence1
Wholesale Less Less Greater Domestic more stable
Producer Less Less Greater Domestic more stable
3 Two test’s results pointing out opposite judgments
Table 4.8 – Comparison of coefficients of variation and variances between domestic and foreign prices in periods with quota releases
Potatoes Coeff. of var Variance Mean domestic
vs. intern. Judgment
Consumer Less n.m. n.u. Domestic more stable1
Wholesale Less Less Greater Domestic more stable
Producer Less Less Greater Domestic more stable 1 Although not supported by statistically relevant results in the analysis of variances
Table 4.9 – Comparison of coefficients of variation and variances between domestic and foreign prices in periods without quota releases
Potatoes Coeff. of var Variance Mean domestic
vs. intern. Judgment
Consumer More More Greater Domestic less stable1
Wholesale Less Less Greater Domestic more stable
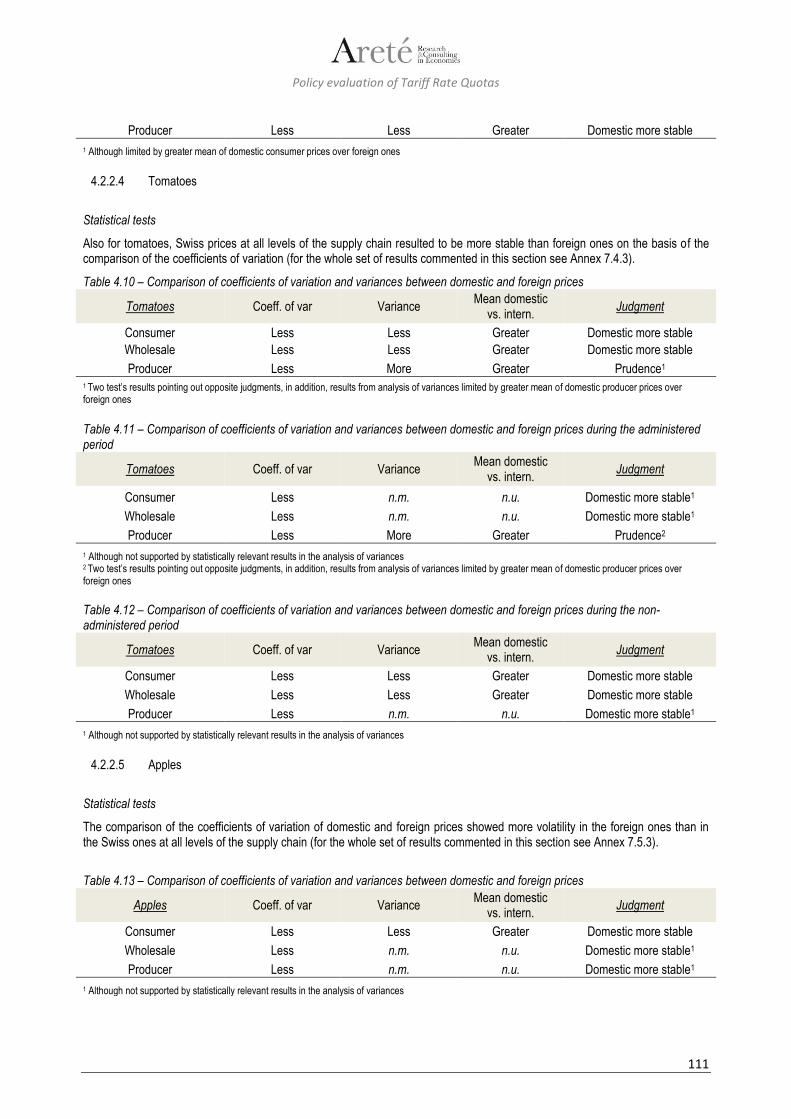
Policy evaluation of Tariff Rate Quotas
111
Producer Less Less Greater Domestic more stable
1 Although limited by greater mean of domestic consumer prices over foreign ones
4.2.2.4 Tomatoes
Statistical tests
Also for tomatoes, Swiss prices at all levels of the supply chain resulted to be more stable than foreign ones on the basis of the comparison of the coefficients of variation (for the whole set of results commented in this section see Annex 7.4.3).
Table 4.10 – Comparison of coefficients of variation and variances between domestic and foreign prices
Tomatoes Coeff. of var Variance Mean domestic
vs. intern. Judgment
Consumer Less Less Greater Domestic more stable
Wholesale Less Less Greater Domestic more stable
Producer Less More Greater Prudence1
1 Two test’s results pointing out opposite judgments, in addition, results from analysis of variances limited by greater mean of domestic producer prices over foreign ones
Table 4.11 – Comparison of coefficients of variation and variances between domestic and foreign prices during the administered period
Tomatoes Coeff. of var Variance Mean domestic
vs. intern. Judgment
Consumer Less n.m. n.u. Domestic more stable1
Wholesale Less n.m. n.u. Domestic more stable1
Producer Less More Greater Prudence2
1 Although not supported by statistically relevant results in the analysis of variances 2 Two test’s results pointing out opposite judgments, in addition, results from analysis of variances limited by greater mean of domestic producer prices over foreign ones
Table 4.12 – Comparison of coefficients of variation and variances between domestic and foreign prices during the non-administered period
Tomatoes Coeff. of var Variance Mean domestic
vs. intern. Judgment
Consumer Less Less Greater Domestic more stable
Wholesale Less Less Greater Domestic more stable
Producer Less n.m. n.u. Domestic more stable1
1 Although not supported by statistically relevant results in the analysis of variances
4.2.2.5 Apples
Statistical tests
The comparison of the coefficients of variation of domestic and foreign prices showed more volatility in the foreign ones than in the Swiss ones at all levels of the supply chain (for the whole set of results commented in this section see Annex 7.5.3).
Table 4.13 – Comparison of coefficients of variation and variances between domestic and foreign prices
Apples Coeff. of var Variance Mean domestic
vs. intern. Judgment
Consumer Less Less Greater Domestic more stable
Wholesale Less n.m. n.u. Domestic more stable1
Producer Less n.m. n.u. Domestic more stable1
1 Although not supported by statistically relevant results in the analysis of variances

Policy evaluation of Tariff Rate Quotas
112
Table 4.14 – Comparison of coefficients of variation and variances between domestic and foreign prices during the administered period
Apples Coeff. of var Variance Mean domestic
vs. intern. Judgment
Consumer Less Less Greater Domestic more stable
Wholesale Less More Greater Prudence1
Producer Less n.m. n.u. Domestic more stable2
1 Two test’s results pointing out opposite judgments, in addition, results from analysis of variances limited by greater mean of domestic producer prices over foreign ones
2 Although not supported by statistically relevant results in the analysis of variances
Table 4.15 – Comparison of coefficients of variation and variances between domestic and foreign prices during the non-administered period
Apples Coeff. of var Variance Mean domestic
vs. intern. Judgment
Consumer Less n.m. n.u. Domestic more stable1
Wholesale Less Less Greater Domestic more stable
Producer Less Less Greater Domestic more stable
1 Although not supported by statistically relevant results in the analysis of variances
4.2.2.6 Strawberries
Statistical tests
The comparison between the coefficients of variation of the domestic and foreign prices showed more volatility in the foreign ones than in the Swiss ones at the producer and wholesale level of the supply chain, while Swiss consumer prices appear to be characterized by more variability than Italian ones (for the whole set of results commented in this section see Annex 7.6.3).
Table 4.16 – Comparison of coefficients of variation and variances between domestic and foreign prices
Strawberries Coeff. of var Variance Mean domestic
vs. intern. Judgment
Consumer More More Greater Domestic less stable1
Wholesale Less Less Greater Domestic more stable
Producer Less Less Greater Domestic more stable
1 Although limited by greater mean of domestic consumer prices over foreign ones
Table 4.17 – Comparison of coefficients of variation and variances between domestic and foreign prices during the administered period
Strawberries Coeff. of var Variance Mean domestic
vs. intern. Judgment
Consumer More More Greater Domestic more stable1
Wholesale Less Less Greater Domestic more stable
Producer Less n.m. n.u. Domestic more stable2
1 Although limited by greater mean of domestic consumer prices over foreign ones
2 Although not supported by statistically relevant results in the analysis of variances

Policy evaluation of Tariff Rate Quotas
113
Table 4.18 – Comparison of coefficients of variation and variances between domestic and foreign prices during the non-administered period
Strawberries (non-administered period)
Coeff. of var Variance Mean domestic
vs. intern. Judgment
Consumer More More Greater Domestic less stable1
Wholesale Less Less Comparable Domestic more stable
Producer Less Less Greater Domestic more stable 1 Although limited by greater mean of domestic consumer prices over foreign ones
4.2.2.1 Main findings
Table 4.19 below provides a synopsis of the results of the comparison of coefficients of variation (and of their consistency with the F-test on equality of variances) for the six products covered by the evaluation at the three main levels of the supply chain (producer prices, wholesale prices and consumer prices). With the only exception of consumer prices for beef and strawberries, for all products and at all the levels of the supply chain Swiss prices results more stable, in terms of coefficient of variation, than the foreign ones. At wholesale level, this result is often confirmed by the analysis of variances. Table 4.19 – Synopsis of the comparison of coefficients of variation for the different products/levels of the supply chain
Levels of the supply chain Products
Beef Pork Potatoes Tomatoes Apples Strawberries
Consumer MORE* LESS LESS LESS* LESS* MORE*
Wholesale LESS* LESS LESS* LESS* LESS LESS*
Producer LESS LESS LESS* LESS LESS LESS*
Domestic price CV > foreign price CV = MORE
Domestic price CV < foreign price CV = LESS
Domestic price CV and Variance < foreign price CV and Variance = LESS*
Generally speaking, Swiss prices resulted to be more stable than the corresponding foreign prices for all products and at all the levels of the supply chain, taking into account the comparison of coefficients of variation; these results were often confirmed by the analysis of variances. Starting from an observed stability of Swiss prices with respect to those of selected countries, it is reasonable to assume a role of TRQs in this respect, although not directly measurable.
4.2.3 Reply to Q 2.3: impact on adequate provision
What is the contribution to allow an adequate provision of domestic markets?
The reply to this question is based on a combination of elements defining a working concept of “adequate provision”, as emerged from i) a comparison of the frequency of price peaks in Switzerland and in neighbouring countries, ii) an analysis of the origin composition of imports and iii) an additional investigation on conditions which could suggest the threat of market rationing by importers (performed for potatoes and tomatoes only). For all investigated products, the analysis conducted on price peaks did not bring to any statistically significant result. The analysis on the origin of imports was performed for each product on two representative years among those selected in the context of question 3.182.
82 For an overview of the selected years for each product please refer to the following section § 4.3.1.
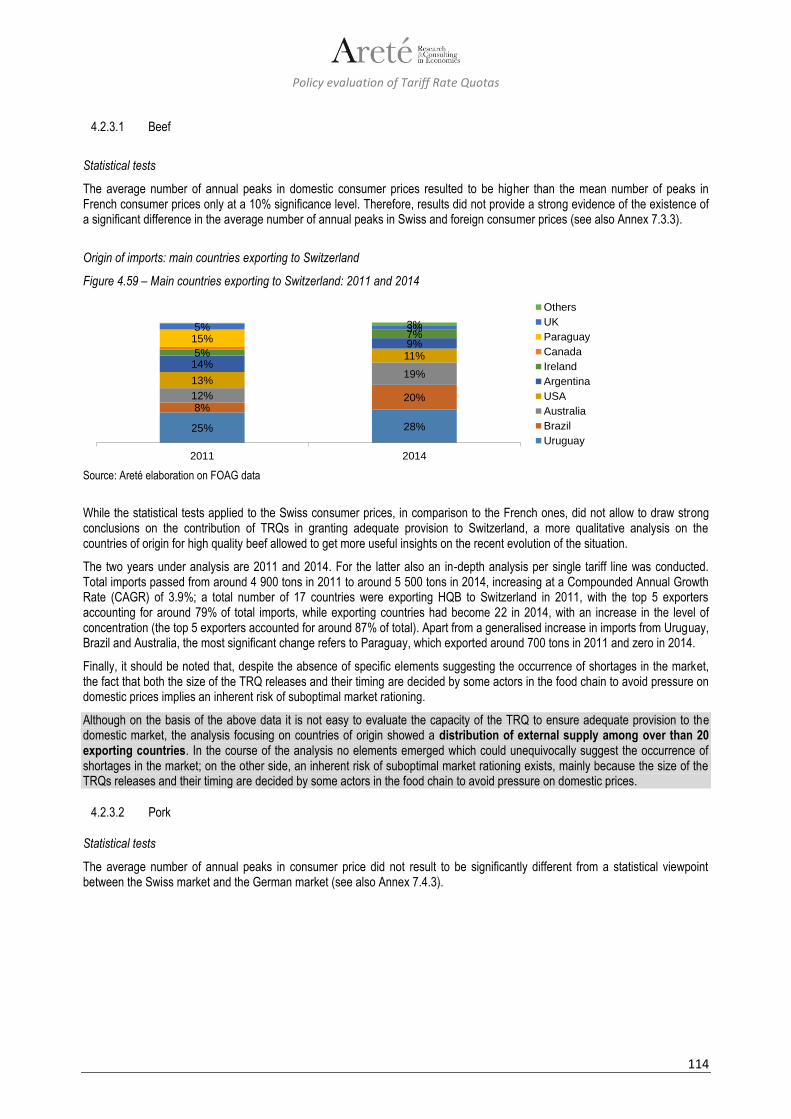
Policy evaluation of Tariff Rate Quotas
114
4.2.3.1 Beef
Statistical tests
The average number of annual peaks in domestic consumer prices resulted to be higher than the mean number of peaks in French consumer prices only at a 10% significance level. Therefore, results did not provide a strong evidence of the existence of a significant difference in the average number of annual peaks in Swiss and foreign consumer prices (see also Annex 7.3.3).
Origin of imports: main countries exporting to Switzerland
Figure 4.59 – Main countries exporting to Switzerland: 2011 and 2014
Source: Areté elaboration on FOAG data
While the statistical tests applied to the Swiss consumer prices, in comparison to the French ones, did not allow to draw strong conclusions on the contribution of TRQs in granting adequate provision to Switzerland, a more qualitative analysis on the countries of origin for high quality beef allowed to get more useful insights on the recent evolution of the situation.
The two years under analysis are 2011 and 2014. For the latter also an in-depth analysis per single tariff line was conducted. Total imports passed from around 4 900 tons in 2011 to around 5 500 tons in 2014, increasing at a Compounded Annual Growth Rate (CAGR) of 3.9%; a total number of 17 countries were exporting HQB to Switzerland in 2011, with the top 5 exporters accounting for around 79% of total imports, while exporting countries had become 22 in 2014, with an increase in the level of concentration (the top 5 exporters accounted for around 87% of total). Apart from a generalised increase in imports from Uruguay, Brazil and Australia, the most significant change refers to Paraguay, which exported around 700 tons in 2011 and zero in 2014.
Finally, it should be noted that, despite the absence of specific elements suggesting the occurrence of shortages in the market, the fact that both the size of the TRQ releases and their timing are decided by some actors in the food chain to avoid pressure on domestic prices implies an inherent risk of suboptimal market rationing.
Although on the basis of the above data it is not easy to evaluate the capacity of the TRQ to ensure adequate provision to the domestic market, the analysis focusing on countries of origin showed a distribution of external supply among over than 20 exporting countries. In the course of the analysis no elements emerged which could unequivocally suggest the occurrence of shortages in the market; on the other side, an inherent risk of suboptimal market rationing exists, mainly because the size of the TRQs releases and their timing are decided by some actors in the food chain to avoid pressure on domestic prices.
4.2.3.2 Pork
Statistical tests
The average number of annual peaks in consumer price did not result to be significantly different from a statistical viewpoint between the Swiss market and the German market (see also Annex 7.4.3).
25% 28%
8%20%12%
19%13%
11%14%
9%5%
7%15%5% 3%3%
2011 2014
Others
UK
Paraguay
Canada
Ireland
Argentina
USA
Australia
Brazil
Uruguay

Policy evaluation of Tariff Rate Quotas
115
Origin of imports: main countries exporting to Switzerland
Figure 4.60 – Main countries exporting to Switzerland: 2007 and 2014
Source: Areté elaboration on FOAG data
As for the analysis on countries of origin, this clearly showed that imports of half-carcasses of swine mainly come from Germany, regardless both year of analysis and tariff line.
As already noted for beef, the fact that both the size of the TRQ releases and their timing are decided by some actors in the food chain in a way to avoid pressure on domestic prices implies an inherent risk of suboptimal market rationing.
Although the absence of differentiation in the origins of imports might underline potential risks for sub-optimal market provision, elements collected through both interviews and literature review highlighted a situation of structural oversupply for the Swiss pork market in the last four/five years where imports play a minor role in supplying the domestic market. In the course of the analysis no elements emerged which could unequivocally suggest the occurrence of shortages in the market; on the other side, an inherent risk of suboptimal market rationing exists, mainly because the size of the TRQs releases and their timing are decided by some actors in the food chain to avoid pressure on domestic prices.
4.2.3.3 Potatoes
Statistical tests
With respect to potatoes, the average number of annual peaks in consumer price resulted to be not significantly different from a statistical viewpoint between the Swiss and the German market (see also Annex 7.5.3).
Origin of imports: main countries exporting to Switzerland
Figure 4.61 – Main countries exporting to Switzerland: 2007 and 2012
Source: Areté elaboration on FOAG data
Similarly to pork, the analysis of the evolution of the concentration of import origins (comparison between 2007 and 2012) showed a further increase in the already strong polarisation towards Israel, accompanied by a reduction of import flows.
Additional cross-analysis
In the case of potatoes it was possible to conduct a cross-analysis for the two selected years, comparing:
Quota fill rate of the main gainers of import quotas through quota trade.
Amount of trade of import quotas for the same players, distinguishing between inward and outward transfers.
69%
97%
17%
3%14%
2007 2014
Others
Austria
Germany
60%76%
18%
12%5%2%
3%4%10% 6%
2007 2012
Others
Italy
Tunisia
Netherlands
Morocco
France
Israel
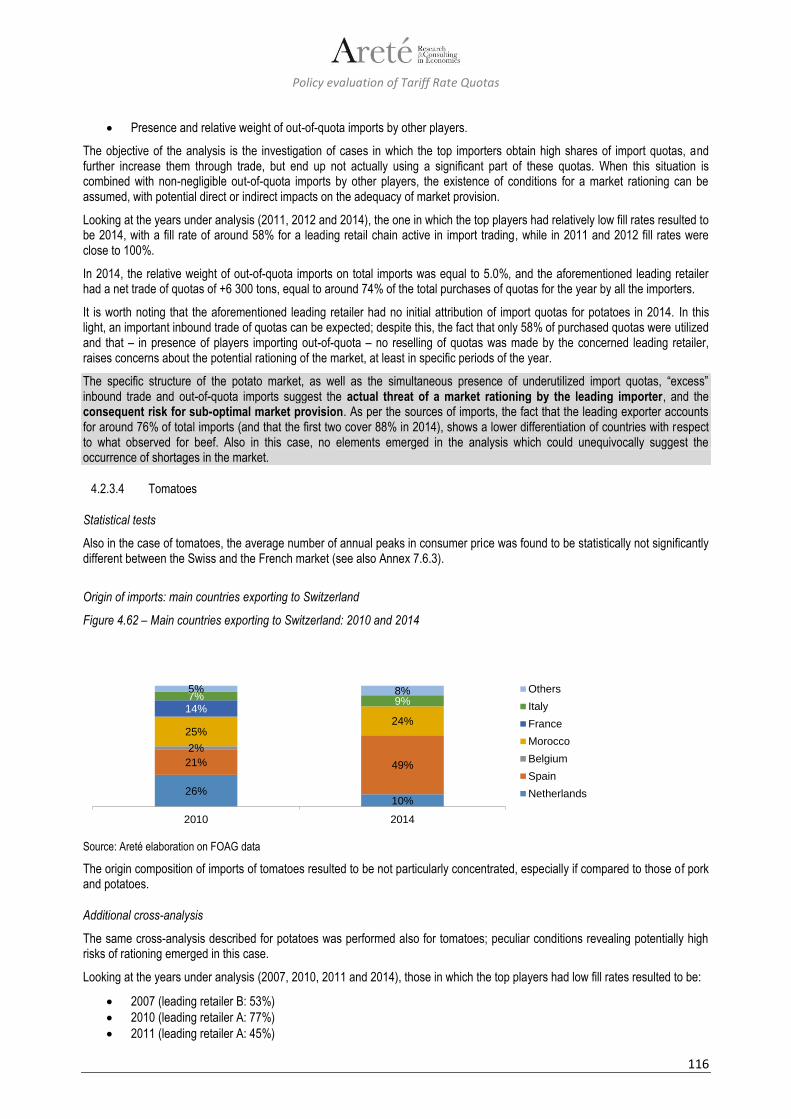
Policy evaluation of Tariff Rate Quotas
116
Presence and relative weight of out-of-quota imports by other players.
The objective of the analysis is the investigation of cases in which the top importers obtain high shares of import quotas, and further increase them through trade, but end up not actually using a significant part of these quotas. When this situation is combined with non-negligible out-of-quota imports by other players, the existence of conditions for a market rationing can be assumed, with potential direct or indirect impacts on the adequacy of market provision.
Looking at the years under analysis (2011, 2012 and 2014), the one in which the top players had relatively low fill rates resulted to be 2014, with a fill rate of around 58% for a leading retail chain active in import trading, while in 2011 and 2012 fill rates were close to 100%.
In 2014, the relative weight of out-of-quota imports on total imports was equal to 5.0%, and the aforementioned leading retailer had a net trade of quotas of +6 300 tons, equal to around 74% of the total purchases of quotas for the year by all the importers.
It is worth noting that the aforementioned leading retailer had no initial attribution of import quotas for potatoes in 2014. In this light, an important inbound trade of quotas can be expected; despite this, the fact that only 58% of purchased quotas were utilized and that – in presence of players importing out-of-quota – no reselling of quotas was made by the concerned leading retailer, raises concerns about the potential rationing of the market, at least in specific periods of the year.
The specific structure of the potato market, as well as the simultaneous presence of underutilized import quotas, “excess” inbound trade and out-of-quota imports suggest the actual threat of a market rationing by the leading importer, and the consequent risk for sub-optimal market provision. As per the sources of imports, the fact that the leading exporter accounts for around 76% of total imports (and that the first two cover 88% in 2014), shows a lower differentiation of countries with respect to what observed for beef. Also in this case, no elements emerged in the analysis which could unequivocally suggest the occurrence of shortages in the market.
4.2.3.4 Tomatoes
Statistical tests
Also in the case of tomatoes, the average number of annual peaks in consumer price was found to be statistically not significantly different between the Swiss and the French market (see also Annex 7.6.3).
Origin of imports: main countries exporting to Switzerland
Figure 4.62 – Main countries exporting to Switzerland: 2010 and 2014
Source: Areté elaboration on FOAG data
The origin composition of imports of tomatoes resulted to be not particularly concentrated, especially if compared to those of pork and potatoes.
Additional cross-analysis
The same cross-analysis described for potatoes was performed also for tomatoes; peculiar conditions revealing potentially high risks of rationing emerged in this case.
Looking at the years under analysis (2007, 2010, 2011 and 2014), those in which the top players had low fill rates resulted to be:
2007 (leading retailer B: 53%)
2010 (leading retailer A: 77%)
2011 (leading retailer A: 45%)
26%10%
21% 49%
2%
25%24%
14%7% 9%5% 8%
2010 2014
Others
Italy
France
Morocco
Belgium
Spain
Netherlands

Policy evaluation of Tariff Rate Quotas
117
2014 (leading retailer A: 19% and leading retailer B: 74%)
Differently from potatoes, low fill rates by leading importers seems to be more frequent in for the tomatoes, with relatively low fill rates at least for one player in each of the years under analysis. Despite this, the availability of data on quota trades was only limited to years 2010 and 2014 and therefore the rest of the analysis was conducted only on these two years.
In the case of tomatoes, the relative weight of out-of-quota imports was calculated on total imports (in quota + out of quota) during the administered period (i.e. excluding imports in the non-administered period); for the two years those weights were:
2010: 1.4%
2014: 5.3%
Looking at the trade behaviour of top quota assignees, in 2010 the net traded (inbound) amounts were around 195 tons for leading retailer A and around 280 tons for leading retailer B. In 2014 both leading retailers had a positive net trade of around 65 tons and 59 tons, respectively.
However, while in 2010 leading retailer B used the vast majority of the import rights (both originally attributed and purchased) with a quota fill rate of around 96%, in all the other cases (for leading retailer A in 2010, and for both players in 2014) it was difficult to explain the observed conduct (low fill rates and inbound net trades) without presuming some rationing strategy behind it.
Similarly to what already observed for potatoes, and with even clearer evidence, the import market for tomatoes presents the coexistence of different signals of potential market rationing, with the consequent risk of sub-optimal market provision, this situation is only in part balanced by a larger number of importers with respect to the other products and a generally lower concentration of imports (as detailed in § 4.3.1.4 in the following). As per the differentiation of import origins, it is less concentrated than that for pork and potatoes, despite this, in 2014 top three exporters accounted for 83% of total imports. Also for tomatoes, no elements emerged in the analysis which could unequivocally suggest the occurrence of shortages in the market.
4.2.3.5 Apples
Statistical tests
As for apples, the average number of annual peaks in consumer price resulted to be significantly different between the domestic and the foreign market (at a 10% significance level). However, the number of price peaks in the Swiss market is not higher than in the French market: it is rather the contrary (see also Annex 7.7.3).
Origin of imports: main countries exporting to Switzerland
Figure 4.63 – Main countries exporting to Switzerland: 2003 and 2009
Source: Areté elaboration on FOAG data
Imports of apples seem to be well distributed among a sufficient number of supplying countries, especially if compared with that of other products (e.g. pork and potatoes); however, it shall be recalled that imports play a minor role in supplying the domestic market. On the other side, an inherent risk of suboptimal market rationing exists, mainly because the size of the TRQs releases and their timing are decided by some actors in the food chain to avoid pressure on domestic prices.
28% 34%
20%27%
27%11%
5% 9%3%9%8%3%9% 6%
2003 2009
Others
Chile
Germany
Italy
South Africa
Netherlands
New Zealand

Policy evaluation of Tariff Rate Quotas
118
4.2.3.6 Strawberries
Statistical tests
The average number of annual peaks in consumer price was found not to be significantly different from a statistical standpoint between the Swiss and the Italian market (see also Annex 7.8.3). It is also important to note that the small number of observations available poses some limitations to the validity of this type of analysis.
Origin of imports: main countries exporting to Switzerland
Figure 4.64 – Main countries exporting to Switzerland: 2007 and 2013
Source: Areté elaboration on FOAG data
The countries exporting strawberries to Switzerland resulted to be relatively few and concentrated in the two years considered for the analysis, and especially in 2013 (with a clear polarisation towards a single origin). However, this single element and the limited results of the statistical tests do not allow drawing solid conclusions on the capacity of the TRQ to allow an adequate provision of the market. On the other side, an inherent risk of suboptimal market rationing exists, mainly because the size of the TRQs releases and their timing are decided by some actors in the food chain to avoid pressure on domestic prices.
4.3 Reply to questions on efficiency of TRQs
4.3.1 Reply to Q 3.1: rent and rent distribution
Which costs and benefits result for the various actors involved (economic welfare of producers, importers, processors, distributors, retailers, consumers, government), taking into account the relevant characteristics of world and domestic markets? In particular, what can be said about the impact on farmers vs the impact on the downstream industry? Which rents arise, and how are they distributed?
[The product-specific TRQ-administration methods and changes therein over the years shall be taken into account:
- Beef : changes in the administration method (auctioning, domestic purchases); release of the TRQ only for specific tariff lines - Pork : auctioning; release of the TRQ only for carcasses - Potatoes : domestic purchases; opening of the TRQ limited in time (only a few months)
- Apples : two-period system, with short “out-of-season period”
- Tomatoes, strawberries: two-period system; TRQ release with weekly frequency]
Replies to this question always start with an illustration of the relevant features of the supply chain structure; relevant elements from previous study questions are then highlighted; finally, conclusions are drawn on the grounds of the findings of the assessment of the available evidence base.
According both to data availability and to the existence or not in different years of the elements necessary for the assessment (in particular, sufficient number of quota releases for pork and apples), different years were analysed for different products. In particular, the years considered for the analyses were83:
83 With the only exception of apples, the lack of availability of detailed data in electronic format for the different importers, forced to limit the in-depth analysis to the 2007-2014 period. Within this timeframe, single years were selected in order to cover the beginning, the middle part and the end of the considered period. This general principle was integrated with ad hoc considerations for specific F&V products: for potatoes, 2011 and 2012 were
33%20%
26%72%
5%2%
28%
3%6% 5%
2007 2013
Others
France
Germany
Netherlands
Spain
Italy
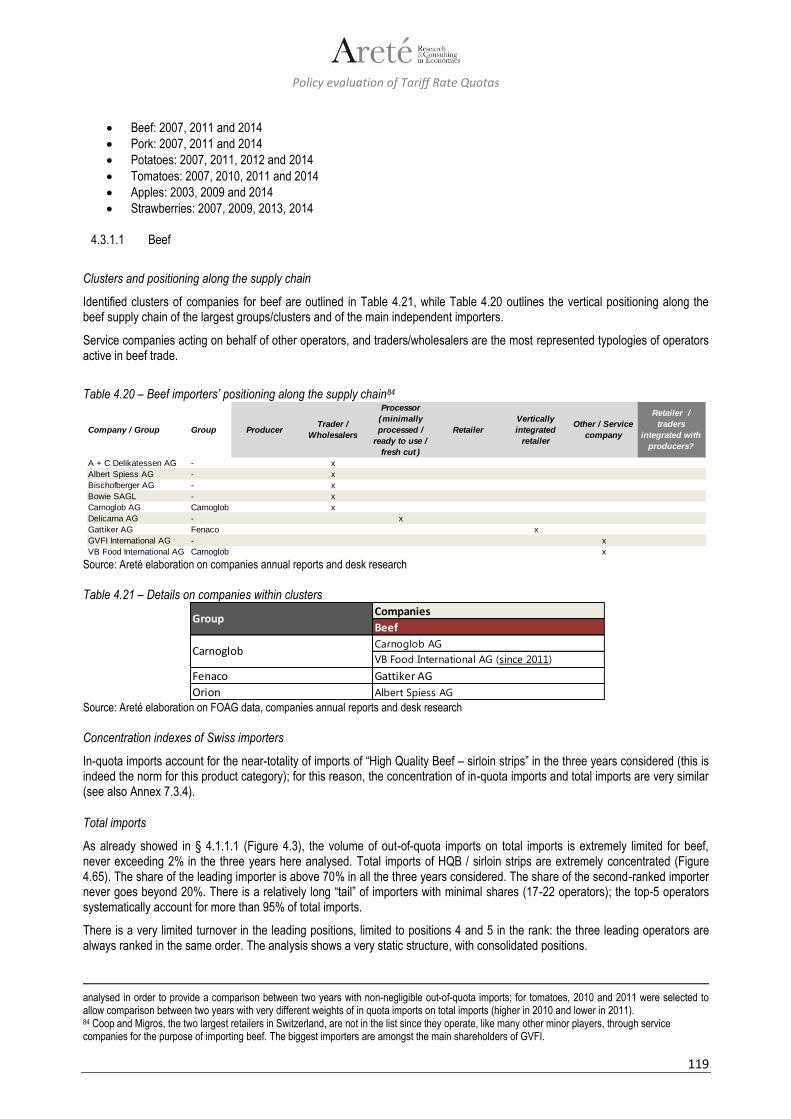
Policy evaluation of Tariff Rate Quotas
119
Beef: 2007, 2011 and 2014
Pork: 2007, 2011 and 2014
Potatoes: 2007, 2011, 2012 and 2014
Tomatoes: 2007, 2010, 2011 and 2014
Apples: 2003, 2009 and 2014
Strawberries: 2007, 2009, 2013, 2014
4.3.1.1 Beef
Clusters and positioning along the supply chain
Identified clusters of companies for beef are outlined in Table 4.21, while Table 4.20 outlines the vertical positioning along the beef supply chain of the largest groups/clusters and of the main independent importers.
Service companies acting on behalf of other operators, and traders/wholesalers are the most represented typologies of operators active in beef trade.
Table 4.20 – Beef importers’ positioning along the supply chain84
Source: Areté elaboration on companies annual reports and desk research
Table 4.21 – Details on companies within clusters
Source: Areté elaboration on FOAG data, companies annual reports and desk research
Concentration indexes of Swiss importers
In-quota imports account for the near-totality of imports of “High Quality Beef – sirloin strips” in the three years considered (this is indeed the norm for this product category); for this reason, the concentration of in-quota imports and total imports are very similar (see also Annex 7.3.4).
Total imports
As already showed in § 4.1.1.1 (Figure 4.3), the volume of out-of-quota imports on total imports is extremely limited for beef, never exceeding 2% in the three years here analysed. Total imports of HQB / sirloin strips are extremely concentrated (Figure 4.65). The share of the leading importer is above 70% in all the three years considered. The share of the second-ranked importer never goes beyond 20%. There is a relatively long “tail” of importers with minimal shares (17-22 operators); the top-5 operators systematically account for more than 95% of total imports.
There is a very limited turnover in the leading positions, limited to positions 4 and 5 in the rank: the three leading operators are always ranked in the same order. The analysis shows a very static structure, with consolidated positions.
analysed in order to provide a comparison between two years with non-negligible out-of-quota imports; for tomatoes, 2010 and 2011 were selected to allow comparison between two years with very different weights of in quota imports on total imports (higher in 2010 and lower in 2011). 84 Coop and Migros, the two largest retailers in Switzerland, are not in the list since they operate, like many other minor players, through service companies for the purpose of importing beef. The biggest importers are amongst the main shareholders of GVFI.
Company / Group Group ProducerTrader /
Wholesalers
Processor
(minimally
processed /
ready to use /
fresh cut )
Retailer
Vertically
integrated
retailer
Other / Service
company
Retailer /
traders
integrated with
producers?
A + C Delikatessen AG - x
Albert Spiess AG - x
Bischofberger AG - x
Bowie SAGL - x
Carnoglob AG Carnoglob x
Delicarna AG - x
Gattiker AG Fenaco x
GVFI International AG - x
VB Food International AG Carnoglob x
Companies
Beef
Carnoglob AG
VB Food International AG (since 2011)
Fenaco Gattiker AG
Orion Albert Spiess AG
Carnoglob
Group
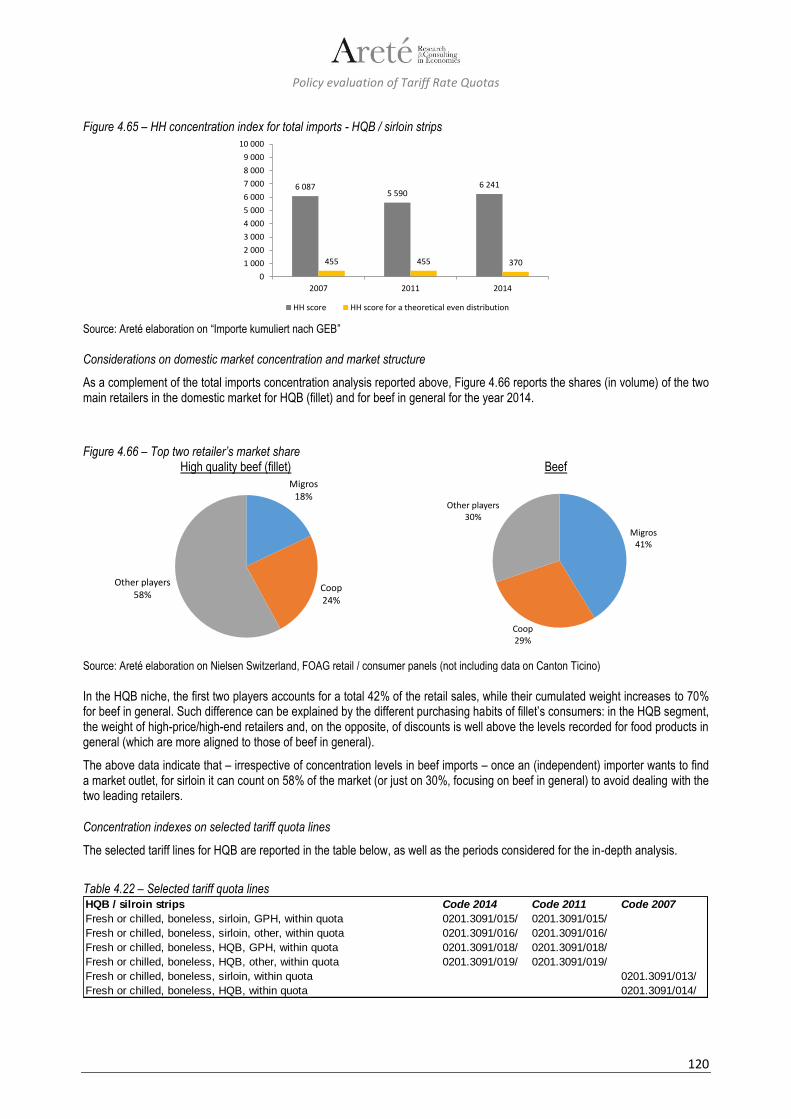
Policy evaluation of Tariff Rate Quotas
120
Figure 4.65 – HH concentration index for total imports - HQB / sirloin strips
Source: Areté elaboration on “Importe kumuliert nach GEB”
Considerations on domestic market concentration and market structure
As a complement of the total imports concentration analysis reported above, Figure 4.66 reports the shares (in volume) of the two main retailers in the domestic market for HQB (fillet) and for beef in general for the year 2014.
Figure 4.66 – Top two retailer’s market share
High quality beef (fillet) Beef
Source: Areté elaboration on Nielsen Switzerland, FOAG retail / consumer panels (not including data on Canton Ticino) In the HQB niche, the first two players accounts for a total 42% of the retail sales, while their cumulated weight increases to 70% for beef in general. Such difference can be explained by the different purchasing habits of fillet’s consumers: in the HQB segment, the weight of high-price/high-end retailers and, on the opposite, of discounts is well above the levels recorded for food products in general (which are more aligned to those of beef in general).
The above data indicate that – irrespective of concentration levels in beef imports – once an (independent) importer wants to find a market outlet, for sirloin it can count on 58% of the market (or just on 30%, focusing on beef in general) to avoid dealing with the two leading retailers.
Concentration indexes on selected tariff quota lines
The selected tariff lines for HQB are reported in the table below, as well as the periods considered for the in-depth analysis.
Table 4.22 – Selected tariff quota lines
6 0875 590
6 241
455 455 370
0
1 000
2 000
3 000
4 000
5 000
6 000
7 000
8 000
9 000
10 000
2007 2011 2014
HH score HH score for a theoretical even distribution
Migros18%
Coop24%
Other players58%
Migros41%
Coop29%
Other players30%
HQB / silroin strips Code 2014 Code 2011 Code 2007
Fresh or chilled, boneless, sirloin, GPH, within quota 0201.3091/015/ 0201.3091/015/
Fresh or chilled, boneless, sirloin, other, within quota 0201.3091/016/ 0201.3091/016/
Fresh or chilled, boneless, HQB, GPH, within quota 0201.3091/018/ 0201.3091/018/
Fresh or chilled, boneless, HQB, other, within quota 0201.3091/019/ 0201.3091/019/
Fresh or chilled, boneless, sirloin, within quota 0201.3091/013/
Fresh or chilled, boneless, HQB, within quota 0201.3091/014/
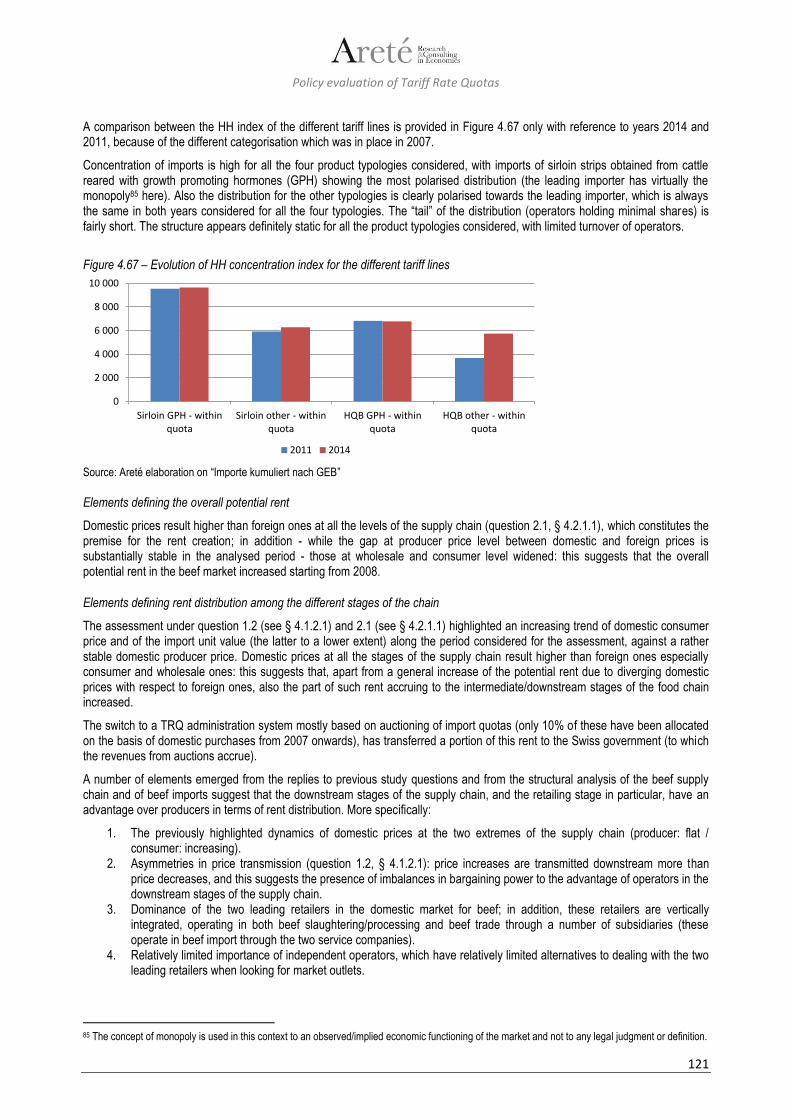
Policy evaluation of Tariff Rate Quotas
121
A comparison between the HH index of the different tariff lines is provided in Figure 4.67 only with reference to years 2014 and 2011, because of the different categorisation which was in place in 2007.
Concentration of imports is high for all the four product typologies considered, with imports of sirloin strips obtained from cattle reared with growth promoting hormones (GPH) showing the most polarised distribution (the leading importer has virtually the monopoly85 here). Also the distribution for the other typologies is clearly polarised towards the leading importer, which is always the same in both years considered for all the four typologies. The “tail” of the distribution (operators holding minimal shares) is fairly short. The structure appears definitely static for all the product typologies considered, with limited turnover of operators.
Figure 4.67 – Evolution of HH concentration index for the different tariff lines
Source: Areté elaboration on “Importe kumuliert nach GEB”
Elements defining the overall potential rent
Domestic prices result higher than foreign ones at all the levels of the supply chain (question 2.1, § 4.2.1.1), which constitutes the premise for the rent creation; in addition - while the gap at producer price level between domestic and foreign prices is substantially stable in the analysed period - those at wholesale and consumer level widened: this suggests that the overall potential rent in the beef market increased starting from 2008.
Elements defining rent distribution among the different stages of the chain
The assessment under question 1.2 (see § 4.1.2.1) and 2.1 (see § 4.2.1.1) highlighted an increasing trend of domestic consumer price and of the import unit value (the latter to a lower extent) along the period considered for the assessment, against a rather stable domestic producer price. Domestic prices at all the stages of the supply chain result higher than foreign ones especially consumer and wholesale ones: this suggests that, apart from a general increase of the potential rent due to diverging domestic prices with respect to foreign ones, also the part of such rent accruing to the intermediate/downstream stages of the food chain increased.
The switch to a TRQ administration system mostly based on auctioning of import quotas (only 10% of these have been allocated on the basis of domestic purchases from 2007 onwards), has transferred a portion of this rent to the Swiss government (to which the revenues from auctions accrue).
A number of elements emerged from the replies to previous study questions and from the structural analysis of the beef supply chain and of beef imports suggest that the downstream stages of the supply chain, and the retailing stage in particular, have an advantage over producers in terms of rent distribution. More specifically:
1. The previously highlighted dynamics of domestic prices at the two extremes of the supply chain (producer: flat / consumer: increasing).
2. Asymmetries in price transmission (question 1.2, § 4.1.2.1): price increases are transmitted downstream more than price decreases, and this suggests the presence of imbalances in bargaining power to the advantage of operators in the downstream stages of the supply chain.
3. Dominance of the two leading retailers in the domestic market for beef; in addition, these retailers are vertically integrated, operating in both beef slaughtering/processing and beef trade through a number of subsidiaries (these operate in beef import through the two service companies).
4. Relatively limited importance of independent operators, which have relatively limited alternatives to dealing with the two leading retailers when looking for market outlets.
85 The concept of monopoly is used in this context to an observed/implied economic functioning of the market and not to any legal judgment or definition.
0
2 000
4 000
6 000
8 000
10 000
Sirloin GPH - withinquota
Sirloin other - withinquota
HQB GPH - withinquota
HQB other - withinquota
2011 2014
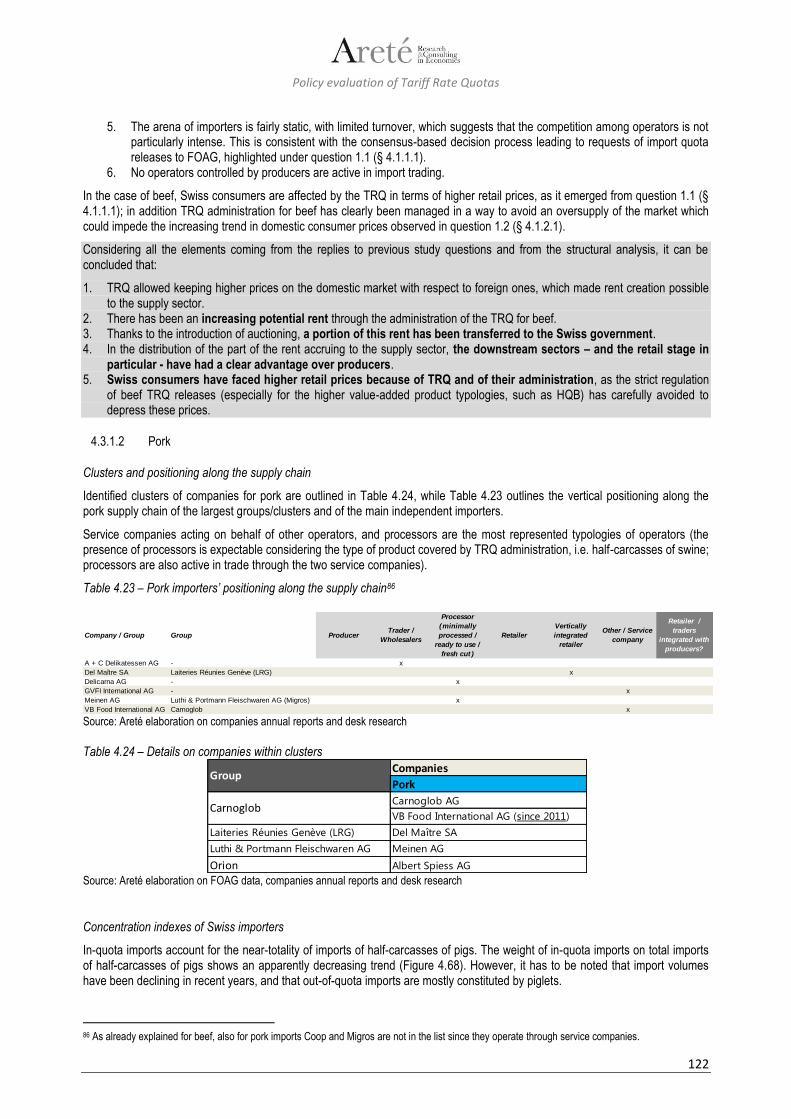
Policy evaluation of Tariff Rate Quotas
122
5. The arena of importers is fairly static, with limited turnover, which suggests that the competition among operators is not particularly intense. This is consistent with the consensus-based decision process leading to requests of import quota releases to FOAG, highlighted under question 1.1 (§ 4.1.1.1).
6. No operators controlled by producers are active in import trading.
In the case of beef, Swiss consumers are affected by the TRQ in terms of higher retail prices, as it emerged from question 1.1 (§ 4.1.1.1); in addition TRQ administration for beef has clearly been managed in a way to avoid an oversupply of the market which could impede the increasing trend in domestic consumer prices observed in question 1.2 (§ 4.1.2.1).
Considering all the elements coming from the replies to previous study questions and from the structural analysis, it can be concluded that:
1. TRQ allowed keeping higher prices on the domestic market with respect to foreign ones, which made rent creation possible to the supply sector.
2. There has been an increasing potential rent through the administration of the TRQ for beef. 3. Thanks to the introduction of auctioning, a portion of this rent has been transferred to the Swiss government. 4. In the distribution of the part of the rent accruing to the supply sector, the downstream sectors – and the retail stage in
particular - have had a clear advantage over producers. 5. Swiss consumers have faced higher retail prices because of TRQ and of their administration, as the strict regulation
of beef TRQ releases (especially for the higher value-added product typologies, such as HQB) has carefully avoided to depress these prices.
4.3.1.2 Pork
Clusters and positioning along the supply chain
Identified clusters of companies for pork are outlined in Table 4.24, while Table 4.23 outlines the vertical positioning along the pork supply chain of the largest groups/clusters and of the main independent importers.
Service companies acting on behalf of other operators, and processors are the most represented typologies of operators (the presence of processors is expectable considering the type of product covered by TRQ administration, i.e. half-carcasses of swine; processors are also active in trade through the two service companies).
Table 4.23 – Pork importers’ positioning along the supply chain86
Source: Areté elaboration on companies annual reports and desk research
Table 4.24 – Details on companies within clusters
Source: Areté elaboration on FOAG data, companies annual reports and desk research
Concentration indexes of Swiss importers
In-quota imports account for the near-totality of imports of half-carcasses of pigs. The weight of in-quota imports on total imports of half-carcasses of pigs shows an apparently decreasing trend (Figure 4.68). However, it has to be noted that import volumes have been declining in recent years, and that out-of-quota imports are mostly constituted by piglets.
86 As already explained for beef, also for pork imports Coop and Migros are not in the list since they operate through service companies.
Company / Group Group ProducerTrader /
Wholesalers
Processor
(minimally
processed /
ready to use /
fresh cut )
Retailer
Vertically
integrated
retailer
Other / Service
company
Retailer /
traders
integrated with
producers?
A + C Delikatessen AG - x
Del Maître SA Laiteries Réunies Genève (LRG) x
Delicarna AG - x
GVFI International AG - x
Meinen AG Luthi & Portmann Fleischwaren AG (Migros) x
VB Food International AG Carnoglob x
Companies
Pork
Carnoglob AG
VB Food International AG (since 2011)
Laiteries Réunies Genève (LRG) Del Maître SA
Luthi & Portmann Fleischwaren AG Meinen AG
Orion Albert Spiess AG
Carnoglob
Group
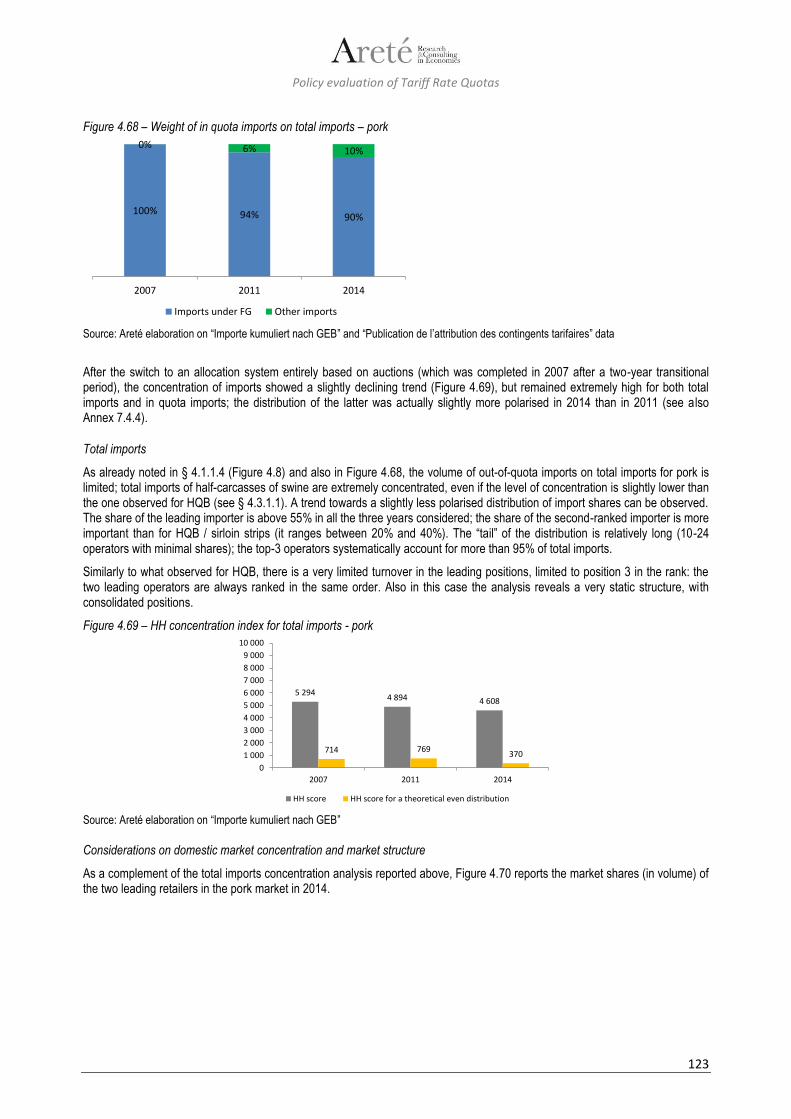
Policy evaluation of Tariff Rate Quotas
123
Figure 4.68 – Weight of in quota imports on total imports – pork
Source: Areté elaboration on “Importe kumuliert nach GEB” and “Publication de l’attribution des contingents tarifaires” data
After the switch to an allocation system entirely based on auctions (which was completed in 2007 after a two-year transitional period), the concentration of imports showed a slightly declining trend (Figure 4.69), but remained extremely high for both total imports and in quota imports; the distribution of the latter was actually slightly more polarised in 2014 than in 2011 (see also Annex 7.4.4).
Total imports
As already noted in § 4.1.1.4 (Figure 4.8) and also in Figure 4.68, the volume of out-of-quota imports on total imports for pork is limited; total imports of half-carcasses of swine are extremely concentrated, even if the level of concentration is slightly lower than the one observed for HQB (see § 4.3.1.1). A trend towards a slightly less polarised distribution of import shares can be observed. The share of the leading importer is above 55% in all the three years considered; the share of the second-ranked importer is more important than for HQB / sirloin strips (it ranges between 20% and 40%). The “tail” of the distribution is relatively long (10-24 operators with minimal shares); the top-3 operators systematically account for more than 95% of total imports.
Similarly to what observed for HQB, there is a very limited turnover in the leading positions, limited to position 3 in the rank: the two leading operators are always ranked in the same order. Also in this case the analysis reveals a very static structure, with consolidated positions.
Figure 4.69 – HH concentration index for total imports - pork
Source: Areté elaboration on “Importe kumuliert nach GEB”
Considerations on domestic market concentration and market structure
As a complement of the total imports concentration analysis reported above, Figure 4.70 reports the market shares (in volume) of the two leading retailers in the pork market in 2014.
100% 94% 90%
0% 6% 10%
2007 2011 2014
Imports under FG Other imports
5 2944 894 4 608
714 769370
0
1 000
2 000
3 000
4 000
5 000
6 000
7 000
8 000
9 000
10 000
2007 2011 2014
HH score HH score for a theoretical even distribution
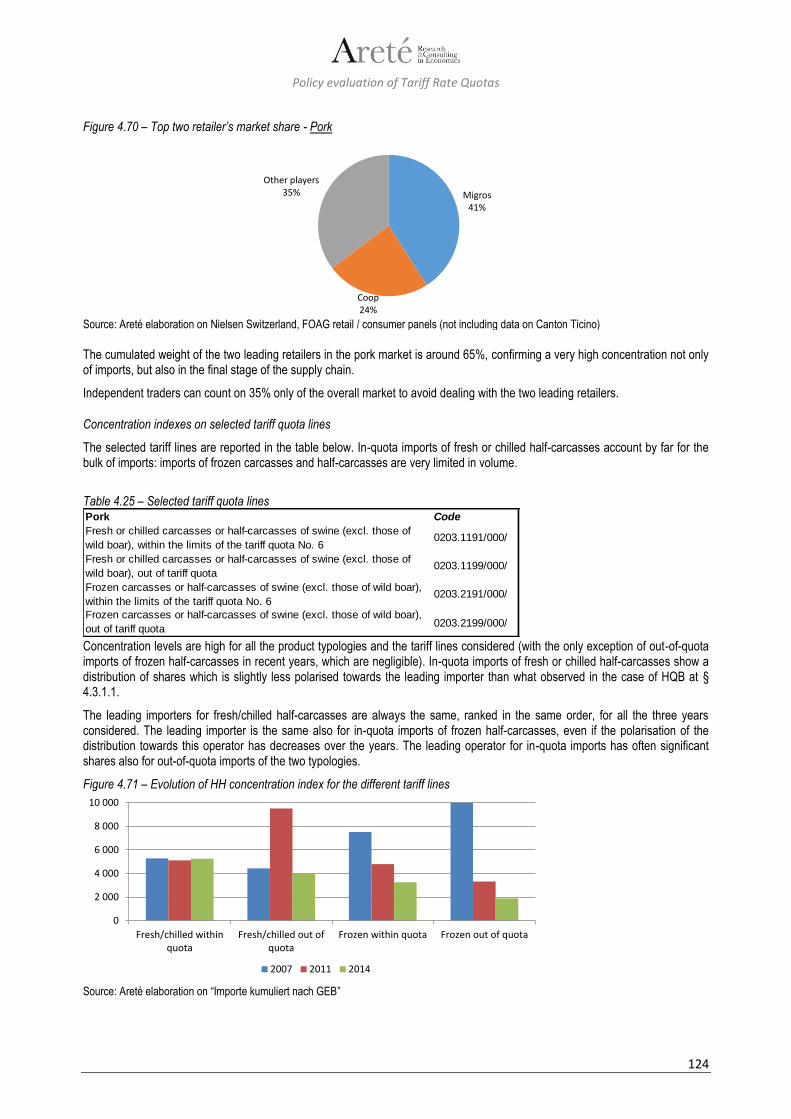
Policy evaluation of Tariff Rate Quotas
124
Figure 4.70 – Top two retailer’s market share - Pork
Source: Areté elaboration on Nielsen Switzerland, FOAG retail / consumer panels (not including data on Canton Ticino)
The cumulated weight of the two leading retailers in the pork market is around 65%, confirming a very high concentration not only of imports, but also in the final stage of the supply chain.
Independent traders can count on 35% only of the overall market to avoid dealing with the two leading retailers.
Concentration indexes on selected tariff quota lines
The selected tariff lines are reported in the table below. In-quota imports of fresh or chilled half-carcasses account by far for the bulk of imports: imports of frozen carcasses and half-carcasses are very limited in volume.
Table 4.25 – Selected tariff quota lines
Concentration levels are high for all the product typologies and the tariff lines considered (with the only exception of out-of-quota imports of frozen half-carcasses in recent years, which are negligible). In-quota imports of fresh or chilled half-carcasses show a distribution of shares which is slightly less polarised towards the leading importer than what observed in the case of HQB at § 4.3.1.1.
The leading importers for fresh/chilled half-carcasses are always the same, ranked in the same order, for all the three years considered. The leading importer is the same also for in-quota imports of frozen half-carcasses, even if the polarisation of the distribution towards this operator has decreases over the years. The leading operator for in-quota imports has often significant shares also for out-of-quota imports of the two typologies.
Figure 4.71 – Evolution of HH concentration index for the different tariff lines
Source: Areté elaboration on “Importe kumuliert nach GEB”
Migros41%
Coop24%
Other players35%
Pork Code
Fresh or chilled carcasses or half-carcasses of swine (excl. those of
wild boar), within the limits of the tariff quota No. 60203.1191/000/
Fresh or chilled carcasses or half-carcasses of swine (excl. those of
wild boar), out of tariff quota0203.1199/000/
Frozen carcasses or half-carcasses of swine (excl. those of wild boar),
within the limits of the tariff quota No. 60203.2191/000/
Frozen carcasses or half-carcasses of swine (excl. those of wild boar),
out of tariff quota0203.2199/000/
0
2 000
4 000
6 000
8 000
10 000
Fresh/chilled withinquota
Fresh/chilled out ofquota
Frozen within quota Frozen out of quota
2007 2011 2014
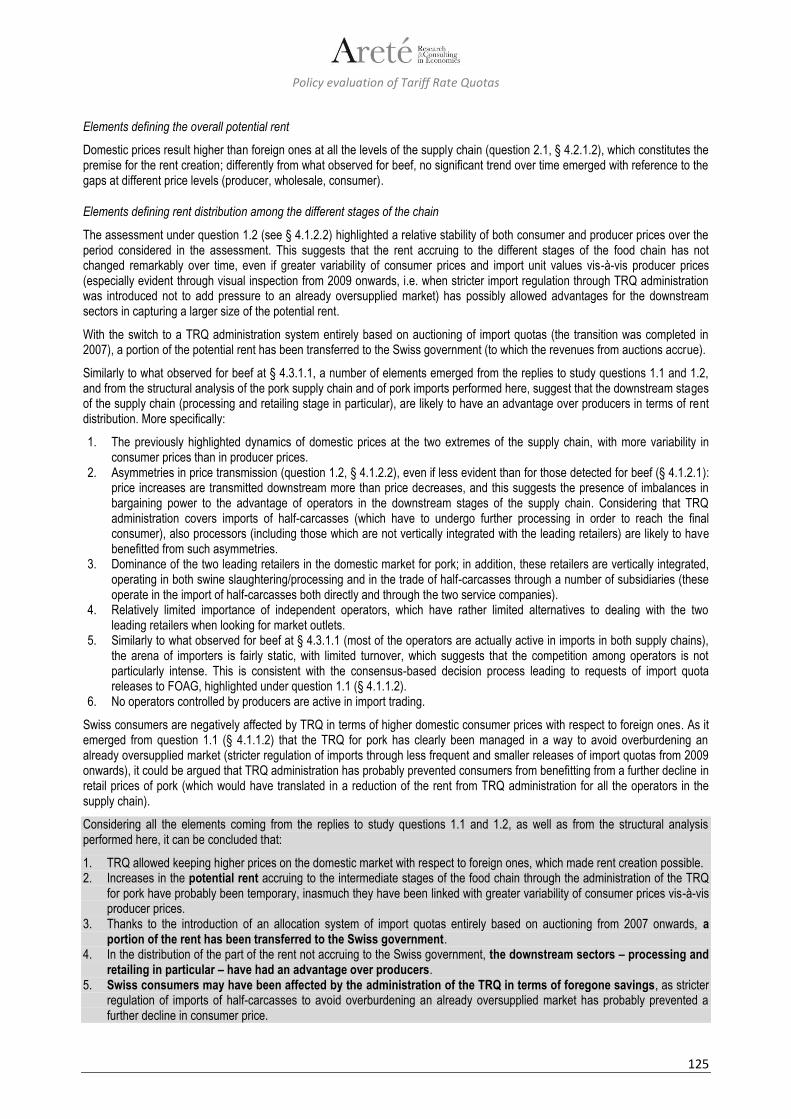
Policy evaluation of Tariff Rate Quotas
125
Elements defining the overall potential rent
Domestic prices result higher than foreign ones at all the levels of the supply chain (question 2.1, § 4.2.1.2), which constitutes the premise for the rent creation; differently from what observed for beef, no significant trend over time emerged with reference to the gaps at different price levels (producer, wholesale, consumer).
Elements defining rent distribution among the different stages of the chain
The assessment under question 1.2 (see § 4.1.2.2) highlighted a relative stability of both consumer and producer prices over the period considered in the assessment. This suggests that the rent accruing to the different stages of the food chain has not changed remarkably over time, even if greater variability of consumer prices and import unit values vis-à-vis producer prices (especially evident through visual inspection from 2009 onwards, i.e. when stricter import regulation through TRQ administration was introduced not to add pressure to an already oversupplied market) has possibly allowed advantages for the downstream sectors in capturing a larger size of the potential rent.
With the switch to a TRQ administration system entirely based on auctioning of import quotas (the transition was completed in 2007), a portion of the potential rent has been transferred to the Swiss government (to which the revenues from auctions accrue).
Similarly to what observed for beef at § 4.3.1.1, a number of elements emerged from the replies to study questions 1.1 and 1.2, and from the structural analysis of the pork supply chain and of pork imports performed here, suggest that the downstream stages of the supply chain (processing and retailing stage in particular), are likely to have an advantage over producers in terms of rent distribution. More specifically:
1. The previously highlighted dynamics of domestic prices at the two extremes of the supply chain, with more variability in consumer prices than in producer prices.
2. Asymmetries in price transmission (question 1.2, § 4.1.2.2), even if less evident than for those detected for beef (§ 4.1.2.1): price increases are transmitted downstream more than price decreases, and this suggests the presence of imbalances in bargaining power to the advantage of operators in the downstream stages of the supply chain. Considering that TRQ administration covers imports of half-carcasses (which have to undergo further processing in order to reach the final consumer), also processors (including those which are not vertically integrated with the leading retailers) are likely to have benefitted from such asymmetries.
3. Dominance of the two leading retailers in the domestic market for pork; in addition, these retailers are vertically integrated, operating in both swine slaughtering/processing and in the trade of half-carcasses through a number of subsidiaries (these operate in the import of half-carcasses both directly and through the two service companies).
4. Relatively limited importance of independent operators, which have rather limited alternatives to dealing with the two leading retailers when looking for market outlets.
5. Similarly to what observed for beef at § 4.3.1.1 (most of the operators are actually active in imports in both supply chains), the arena of importers is fairly static, with limited turnover, which suggests that the competition among operators is not particularly intense. This is consistent with the consensus-based decision process leading to requests of import quota releases to FOAG, highlighted under question 1.1 (§ 4.1.1.2).
6. No operators controlled by producers are active in import trading.
Swiss consumers are negatively affected by TRQ in terms of higher domestic consumer prices with respect to foreign ones. As it emerged from question 1.1 (§ 4.1.1.2) that the TRQ for pork has clearly been managed in a way to avoid overburdening an already oversupplied market (stricter regulation of imports through less frequent and smaller releases of import quotas from 2009 onwards), it could be argued that TRQ administration has probably prevented consumers from benefitting from a further decline in retail prices of pork (which would have translated in a reduction of the rent from TRQ administration for all the operators in the supply chain).
Considering all the elements coming from the replies to study questions 1.1 and 1.2, as well as from the structural analysis performed here, it can be concluded that:
1. TRQ allowed keeping higher prices on the domestic market with respect to foreign ones, which made rent creation possible. 2. Increases in the potential rent accruing to the intermediate stages of the food chain through the administration of the TRQ
for pork have probably been temporary, inasmuch they have been linked with greater variability of consumer prices vis-à-vis producer prices.
3. Thanks to the introduction of an allocation system of import quotas entirely based on auctioning from 2007 onwards, a portion of the rent has been transferred to the Swiss government.
4. In the distribution of the part of the rent not accruing to the Swiss government, the downstream sectors – processing and retailing in particular – have had an advantage over producers.
5. Swiss consumers may have been affected by the administration of the TRQ in terms of foregone savings, as stricter regulation of imports of half-carcasses to avoid overburdening an already oversupplied market has probably prevented a further decline in consumer price.

Policy evaluation of Tariff Rate Quotas
126
4.3.1.3 Potatoes
Clusters and positioning along the supply chain
Identified clusters of companies for table potatoes are outlined in Table 4.27, while Table 4.26 outlines the vertical positioning along the supply chain of the largest groups/clusters and of the main independent importers.
Differently from beef and pork, the arena of importers sees the presence of producers (including some with downstream vertical integration towards retailing).
Table 4.26 – Potatoes importers’ positioning along the supply chain
Source: Areté elaboration on companies annual reports and desk research
Table 4.27 – Details on companies within clusters
Source: Areté elaboration on FOAG data, companies annual reports and desk research
Concentration indexes of Swiss importers
In-quota imports account for the bulk of total imports (Figure 4.72).
Company / Group Group ProducerTrader /
Wholesalers
Processor
(minimally
processed /
ready to use /
fresh cut )
Retailer
Vertically
integrated
retailer
Other / Service
company
Retailer /
traders
integrated with
producers?
Bio Groupe AG / Terraviva - x x
Biscotte Fruits et Légumes SA - x xBrunner KA-GE AG - x x x
E. Hermann AG x
Egger Gemüsebau AG - x xEmil Knopf AG - x
Feldhof Gemüse AG - x x
fenaco Genossenschaft, Bern Fenaco x x
Frilog Frisch-Logistik AG (now Terraviva AG) - x x
Geiser + Schwarz AG - x
Geiser agro.com ag Geiser x
Gerber - ?
Green Pack SA - x
Greybin SA - x
GVS Landi AG, Schaffhausen Fenaco x x
Kartoffelzentrale Amt Burgdorf Geiser x
Kellenberger - x
Lagerhaus Lohn Maison Virchaux AG - x
Landw. Genossenschaftsverband Fenaco x x
Mehadrin Central Europe AG - x x
Migros-Genossenschafts-Bund Migros x
Owiamo GmbH - x
Primserres SA - x x
Schwab-Guillod AG - x
Schwarz E. - x ?
Schwarz viva AG - x x
Steffen-Ris, Frauenfeld Fenaco x x
Steffen-Ris, Utzenstorf Fenaco x x
Terralog AG Geiser x
Terraviva AG - x x
Companies
Potatoes
Fenaco
GVS Landi AG
LV St. Gallen
Steffen-Ris AG (sice 2008)
Geiser agro.com ag
Kartoffelzentrale Amt
Terralog AG
Migros Migros-Genossenschafts-Bund
Group
Fenaco
Geiser
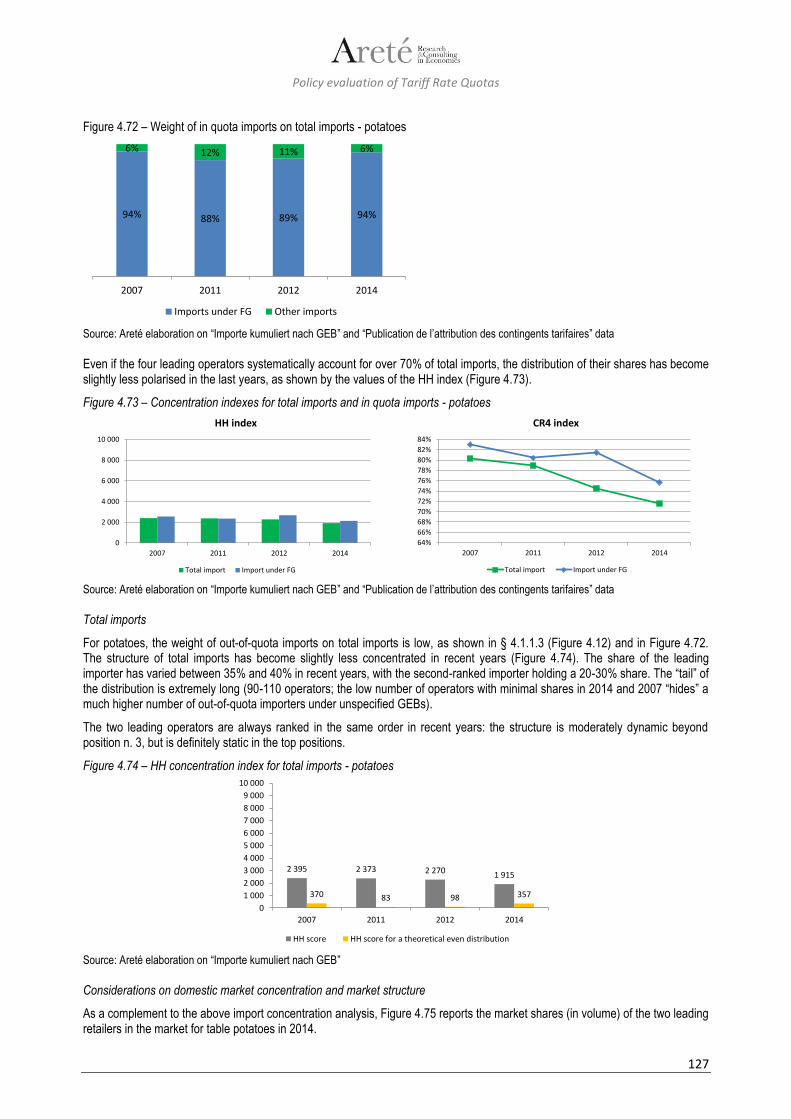
Policy evaluation of Tariff Rate Quotas
127
Figure 4.72 – Weight of in quota imports on total imports - potatoes
Source: Areté elaboration on “Importe kumuliert nach GEB” and “Publication de l’attribution des contingents tarifaires” data
Even if the four leading operators systematically account for over 70% of total imports, the distribution of their shares has become slightly less polarised in the last years, as shown by the values of the HH index (Figure 4.73).
Figure 4.73 – Concentration indexes for total imports and in quota imports - potatoes
Source: Areté elaboration on “Importe kumuliert nach GEB” and “Publication de l’attribution des contingents tarifaires” data
Total imports
For potatoes, the weight of out-of-quota imports on total imports is low, as shown in § 4.1.1.3 (Figure 4.12) and in Figure 4.72. The structure of total imports has become slightly less concentrated in recent years (Figure 4.74). The share of the leading importer has varied between 35% and 40% in recent years, with the second-ranked importer holding a 20-30% share. The “tail” of the distribution is extremely long (90-110 operators; the low number of operators with minimal shares in 2014 and 2007 “hides” a much higher number of out-of-quota importers under unspecified GEBs).
The two leading operators are always ranked in the same order in recent years: the structure is moderately dynamic beyond position n. 3, but is definitely static in the top positions.
Figure 4.74 – HH concentration index for total imports - potatoes
Source: Areté elaboration on “Importe kumuliert nach GEB”
Considerations on domestic market concentration and market structure
As a complement to the above import concentration analysis, Figure 4.75 reports the market shares (in volume) of the two leading retailers in the market for table potatoes in 2014.
94% 88% 89% 94%
6% 12% 11% 6%
2007 2011 2012 2014
Imports under FG Other imports
0
2 000
4 000
6 000
8 000
10 000
2007 2011 2012 2014
HH index
Total import Import under FG
64%
66%
68%
70%
72%
74%
76%
78%
80%
82%
84%
2007 2011 2012 2014
CR4 index
Total import Import under FG
2 395 2 373 2 270 1 915
370 83 98 357
0
1 000
2 000
3 000
4 000
5 000
6 000
7 000
8 000
9 000
10 000
2007 2011 2012 2014
HH score HH score for a theoretical even distribution
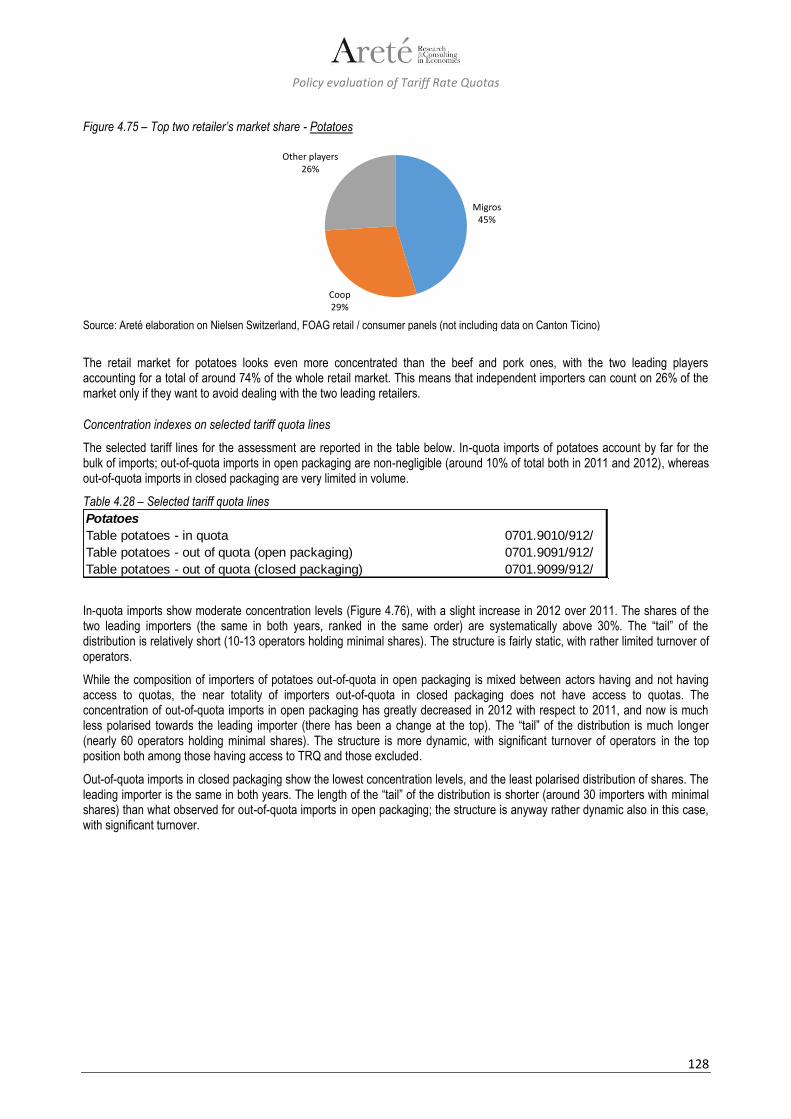
Policy evaluation of Tariff Rate Quotas
128
Figure 4.75 – Top two retailer’s market share - Potatoes
Source: Areté elaboration on Nielsen Switzerland, FOAG retail / consumer panels (not including data on Canton Ticino)
The retail market for potatoes looks even more concentrated than the beef and pork ones, with the two leading players accounting for a total of around 74% of the whole retail market. This means that independent importers can count on 26% of the market only if they want to avoid dealing with the two leading retailers.
Concentration indexes on selected tariff quota lines
The selected tariff lines for the assessment are reported in the table below. In-quota imports of potatoes account by far for the bulk of imports; out-of-quota imports in open packaging are non-negligible (around 10% of total both in 2011 and 2012), whereas out-of-quota imports in closed packaging are very limited in volume.
Table 4.28 – Selected tariff quota lines
In-quota imports show moderate concentration levels (Figure 4.76), with a slight increase in 2012 over 2011. The shares of the two leading importers (the same in both years, ranked in the same order) are systematically above 30%. The “tail” of the distribution is relatively short (10-13 operators holding minimal shares). The structure is fairly static, with rather limited turnover of operators.
While the composition of importers of potatoes out-of-quota in open packaging is mixed between actors having and not having access to quotas, the near totality of importers out-of-quota in closed packaging does not have access to quotas. The concentration of out-of-quota imports in open packaging has greatly decreased in 2012 with respect to 2011, and now is much less polarised towards the leading importer (there has been a change at the top). The “tail” of the distribution is much longer (nearly 60 operators holding minimal shares). The structure is more dynamic, with significant turnover of operators in the top position both among those having access to TRQ and those excluded.
Out-of-quota imports in closed packaging show the lowest concentration levels, and the least polarised distribution of shares. The leading importer is the same in both years. The length of the “tail” of the distribution is shorter (around 30 importers with minimal shares) than what observed for out-of-quota imports in open packaging; the structure is anyway rather dynamic also in this case, with significant turnover.
Migros45%
Coop29%
Other players26%
Potatoes
Table potatoes - in quota 0701.9010/912/
Table potatoes - out of quota (open packaging) 0701.9091/912/
Table potatoes - out of quota (closed packaging) 0701.9099/912/
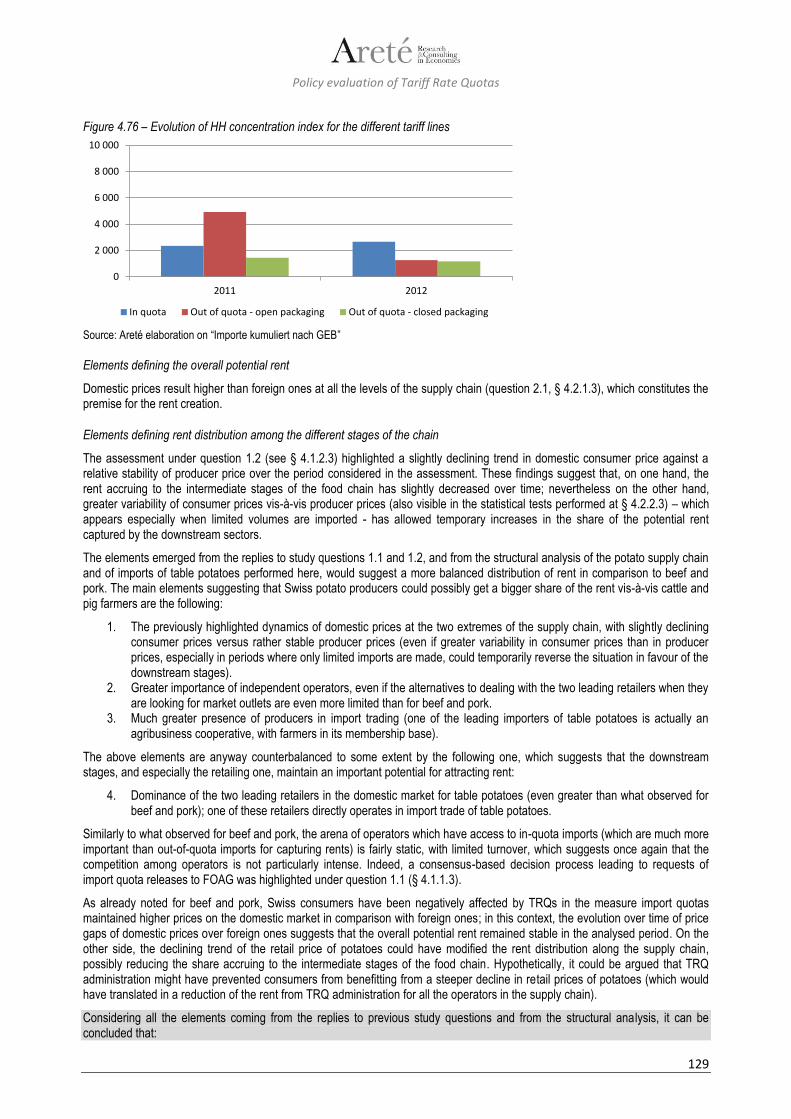
Policy evaluation of Tariff Rate Quotas
129
Figure 4.76 – Evolution of HH concentration index for the different tariff lines
Source: Areté elaboration on “Importe kumuliert nach GEB”
Elements defining the overall potential rent
Domestic prices result higher than foreign ones at all the levels of the supply chain (question 2.1, § 4.2.1.3), which constitutes the premise for the rent creation.
Elements defining rent distribution among the different stages of the chain
The assessment under question 1.2 (see § 4.1.2.3) highlighted a slightly declining trend in domestic consumer price against a relative stability of producer price over the period considered in the assessment. These findings suggest that, on one hand, the rent accruing to the intermediate stages of the food chain has slightly decreased over time; nevertheless on the other hand, greater variability of consumer prices vis-à-vis producer prices (also visible in the statistical tests performed at § 4.2.2.3) – which appears especially when limited volumes are imported - has allowed temporary increases in the share of the potential rent captured by the downstream sectors.
The elements emerged from the replies to study questions 1.1 and 1.2, and from the structural analysis of the potato supply chain and of imports of table potatoes performed here, would suggest a more balanced distribution of rent in comparison to beef and pork. The main elements suggesting that Swiss potato producers could possibly get a bigger share of the rent vis-à-vis cattle and pig farmers are the following:
1. The previously highlighted dynamics of domestic prices at the two extremes of the supply chain, with slightly declining consumer prices versus rather stable producer prices (even if greater variability in consumer prices than in producer prices, especially in periods where only limited imports are made, could temporarily reverse the situation in favour of the downstream stages).
2. Greater importance of independent operators, even if the alternatives to dealing with the two leading retailers when they are looking for market outlets are even more limited than for beef and pork.
3. Much greater presence of producers in import trading (one of the leading importers of table potatoes is actually an agribusiness cooperative, with farmers in its membership base).
The above elements are anyway counterbalanced to some extent by the following one, which suggests that the downstream stages, and especially the retailing one, maintain an important potential for attracting rent:
4. Dominance of the two leading retailers in the domestic market for table potatoes (even greater than what observed for beef and pork); one of these retailers directly operates in import trade of table potatoes.
Similarly to what observed for beef and pork, the arena of operators which have access to in-quota imports (which are much more important than out-of-quota imports for capturing rents) is fairly static, with limited turnover, which suggests once again that the competition among operators is not particularly intense. Indeed, a consensus-based decision process leading to requests of import quota releases to FOAG was highlighted under question 1.1 (§ 4.1.1.3).
As already noted for beef and pork, Swiss consumers have been negatively affected by TRQs in the measure import quotas maintained higher prices on the domestic market in comparison with foreign ones; in this context, the evolution over time of price gaps of domestic prices over foreign ones suggests that the overall potential rent remained stable in the analysed period. On the other side, the declining trend of the retail price of potatoes could have modified the rent distribution along the supply chain, possibly reducing the share accruing to the intermediate stages of the food chain. Hypothetically, it could be argued that TRQ administration might have prevented consumers from benefitting from a steeper decline in retail prices of potatoes (which would have translated in a reduction of the rent from TRQ administration for all the operators in the supply chain).
Considering all the elements coming from the replies to previous study questions and from the structural analysis, it can be concluded that:
0
2 000
4 000
6 000
8 000
10 000
2011 2012
In quota Out of quota - open packaging Out of quota - closed packaging
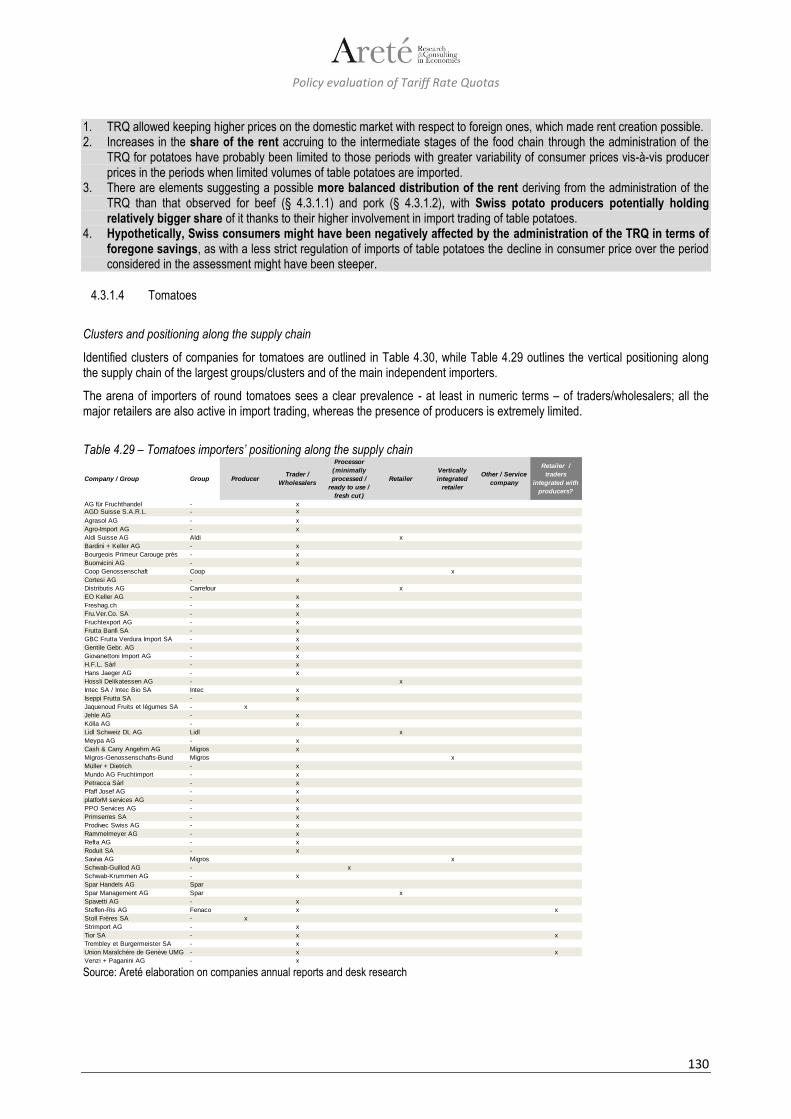
Policy evaluation of Tariff Rate Quotas
130
1. TRQ allowed keeping higher prices on the domestic market with respect to foreign ones, which made rent creation possible. 2. Increases in the share of the rent accruing to the intermediate stages of the food chain through the administration of the
TRQ for potatoes have probably been limited to those periods with greater variability of consumer prices vis-à-vis producer prices in the periods when limited volumes of table potatoes are imported.
3. There are elements suggesting a possible more balanced distribution of the rent deriving from the administration of the TRQ than that observed for beef (§ 4.3.1.1) and pork (§ 4.3.1.2), with Swiss potato producers potentially holding relatively bigger share of it thanks to their higher involvement in import trading of table potatoes.
4. Hypothetically, Swiss consumers might have been negatively affected by the administration of the TRQ in terms of foregone savings, as with a less strict regulation of imports of table potatoes the decline in consumer price over the period considered in the assessment might have been steeper.
4.3.1.4 Tomatoes
Clusters and positioning along the supply chain
Identified clusters of companies for tomatoes are outlined in Table 4.30, while Table 4.29 outlines the vertical positioning along the supply chain of the largest groups/clusters and of the main independent importers.
The arena of importers of round tomatoes sees a clear prevalence - at least in numeric terms – of traders/wholesalers; all the major retailers are also active in import trading, whereas the presence of producers is extremely limited.
Table 4.29 – Tomatoes importers’ positioning along the supply chain
Source: Areté elaboration on companies annual reports and desk research
Company / Group Group ProducerTrader /
Wholesalers
Processor
(minimally
processed /
ready to use /
fresh cut )
Retailer
Vertically
integrated
retailer
Other / Service
company
Retailer /
traders
integrated with
producers?
AG für Fruchthandel - xAGD Suisse S.A.R.L. - x
Agrasol AG - x
Agro-Import AG - x
Aldi Suisse AG Aldi x
Bardini + Keller AG - x
Bourgeois Primeur Carouge près - x
Buonvicini AG - x
Coop Genossenschaft Coop x
Cortesi AG - x
Distributis AG Carrefour x
EO Keller AG - x
Freshag.ch - x
Fru.Ver.Co. SA - x
Fruchtexport AG - x
Frutta Banfi SA - x
GBC Frutta Verdura Import SA - x
Gentile Gebr. AG - x
Giovanettoni Import AG - x
H.F.L. Sàrl - x
Hans Jaeger AG - x
Hossli Delikatessen AG - x
Intec SA / Intec Bio SA Intec x
Iseppi Frutta SA - x
Jaquenoud Fruits et légumes SA - x
Jehle AG - x
Kölla AG - x
Lidl Schweiz DL AG Lidl x
Meypa AG - x
Cash & Carry Angehrn AG Migros x
Migros-Genossenschafts-Bund Migros x
Müller + Dietrich - x
Mundo AG Fruchtimport - x
Petracca Sàrl - x
Pfaff Josef AG - x
platforM services AG - x
PPO Services AG - x
Primserres SA - x
Prodivec Swiss AG - x
Rammelmeyer AG - x
Refta AG - x
Roduit SA - x
Saviva AG Migros x
Schwab-Guillod AG - x
Schwab-Krummen AG - x
Spar Handels AG Spar
Spar Management AG Spar x
Spavetti AG - x
Steffen-Ris AG Fenaco x x
Stoll Frères SA - x
Strimport AG - x
Tior SA - x x
Trembley et Burgermeister SA - x
Union Maraîchère de Genève UMG - x x
Venzi + Paganini AG - x
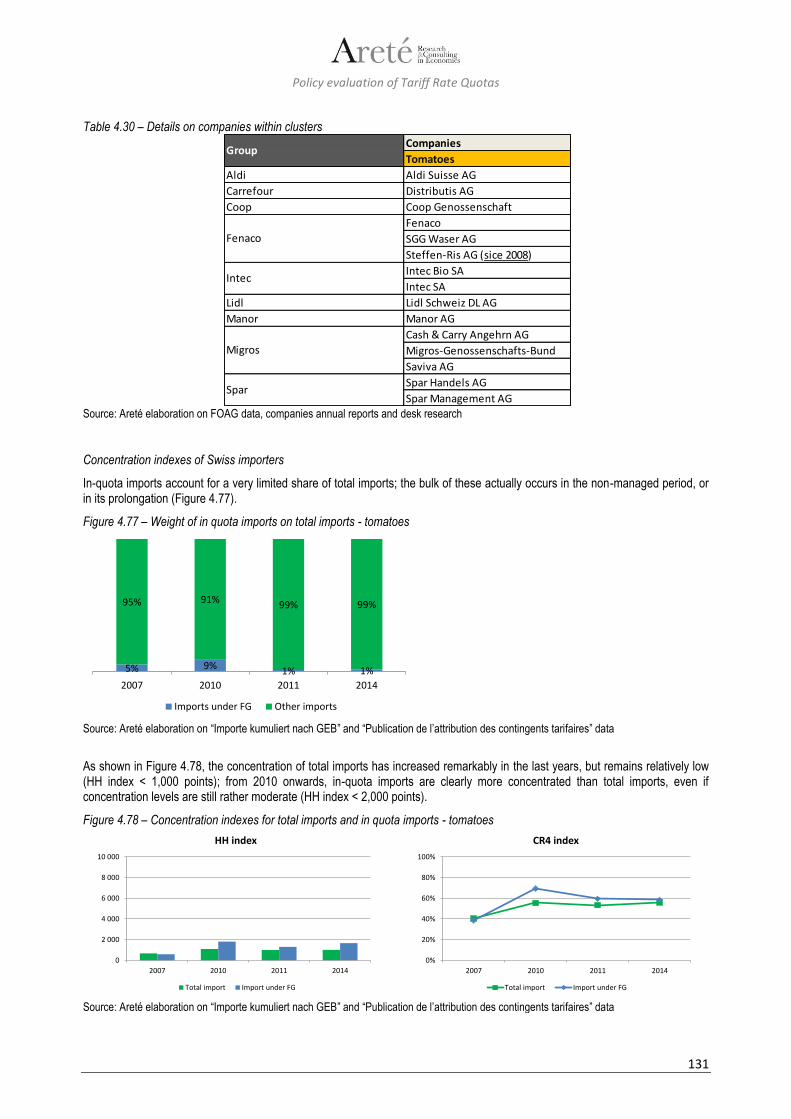
Policy evaluation of Tariff Rate Quotas
131
Table 4.30 – Details on companies within clusters
Source: Areté elaboration on FOAG data, companies annual reports and desk research
Concentration indexes of Swiss importers
In-quota imports account for a very limited share of total imports; the bulk of these actually occurs in the non-managed period, or in its prolongation (Figure 4.77).
Figure 4.77 – Weight of in quota imports on total imports - tomatoes
Source: Areté elaboration on “Importe kumuliert nach GEB” and “Publication de l’attribution des contingents tarifaires” data
As shown in Figure 4.78, the concentration of total imports has increased remarkably in the last years, but remains relatively low (HH index < 1,000 points); from 2010 onwards, in-quota imports are clearly more concentrated than total imports, even if concentration levels are still rather moderate (HH index < 2,000 points).
Figure 4.78 – Concentration indexes for total imports and in quota imports - tomatoes
Source: Areté elaboration on “Importe kumuliert nach GEB” and “Publication de l’attribution des contingents tarifaires” data
Companies
Tomatoes
Aldi Aldi Suisse AG
Carrefour Distributis AG
Coop Coop Genossenschaft
Fenaco
SGG Waser AG
Steffen-Ris AG (sice 2008)
Intec Bio SA
Intec SA
Lidl Lidl Schweiz DL AG
Manor Manor AG
Cash & Carry Angehrn AG
Migros-Genossenschafts-Bund
Saviva AG
Spar Handels AG
Spar Management AG
Intec
Spar
Group
Migros
Fenaco
5% 9% 1% 1%
95% 91% 99% 99%
2007 2010 2011 2014
Imports under FG Other imports
0
2 000
4 000
6 000
8 000
10 000
2007 2010 2011 2014
HH index
Total import Import under FG
0%
20%
40%
60%
80%
100%
2007 2010 2011 2014
CR4 index
Total import Import under FG
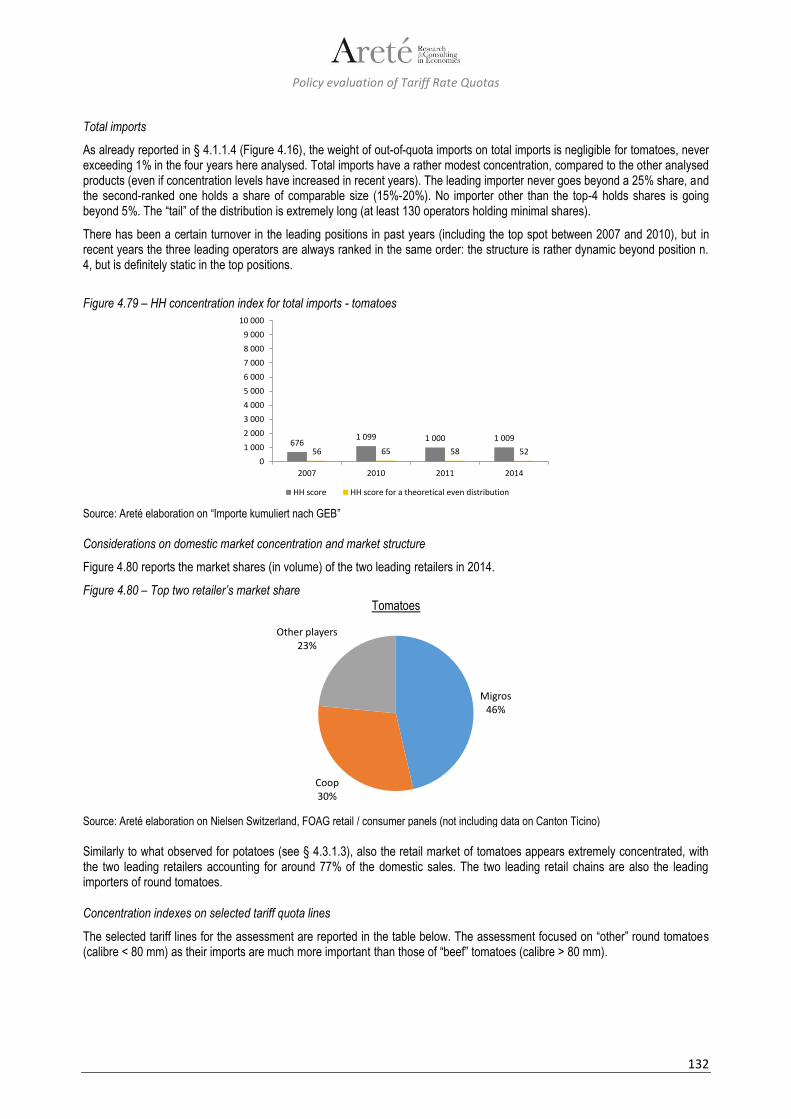
Policy evaluation of Tariff Rate Quotas
132
Total imports
As already reported in § 4.1.1.4 (Figure 4.16), the weight of out-of-quota imports on total imports is negligible for tomatoes, never exceeding 1% in the four years here analysed. Total imports have a rather modest concentration, compared to the other analysed products (even if concentration levels have increased in recent years). The leading importer never goes beyond a 25% share, and the second-ranked one holds a share of comparable size (15%-20%). No importer other than the top-4 holds shares is going beyond 5%. The “tail” of the distribution is extremely long (at least 130 operators holding minimal shares).
There has been a certain turnover in the leading positions in past years (including the top spot between 2007 and 2010), but in recent years the three leading operators are always ranked in the same order: the structure is rather dynamic beyond position n. 4, but is definitely static in the top positions.
Figure 4.79 – HH concentration index for total imports - tomatoes
Source: Areté elaboration on “Importe kumuliert nach GEB”
Considerations on domestic market concentration and market structure
Figure 4.80 reports the market shares (in volume) of the two leading retailers in 2014.
Figure 4.80 – Top two retailer’s market share Tomatoes
Source: Areté elaboration on Nielsen Switzerland, FOAG retail / consumer panels (not including data on Canton Ticino) Similarly to what observed for potatoes (see § 4.3.1.3), also the retail market of tomatoes appears extremely concentrated, with the two leading retailers accounting for around 77% of the domestic sales. The two leading retail chains are also the leading importers of round tomatoes.
Concentration indexes on selected tariff quota lines
The selected tariff lines for the assessment are reported in the table below. The assessment focused on “other” round tomatoes (calibre < 80 mm) as their imports are much more important than those of “beef” tomatoes (calibre > 80 mm).
6761 099 1 000 1 009
56 65 58 520
1 000
2 000
3 000
4 000
5 000
6 000
7 000
8 000
9 000
10 000
2007 2010 2011 2014
HH score HH score for a theoretical even distribution
Migros46%
Coop30%
Other players23%
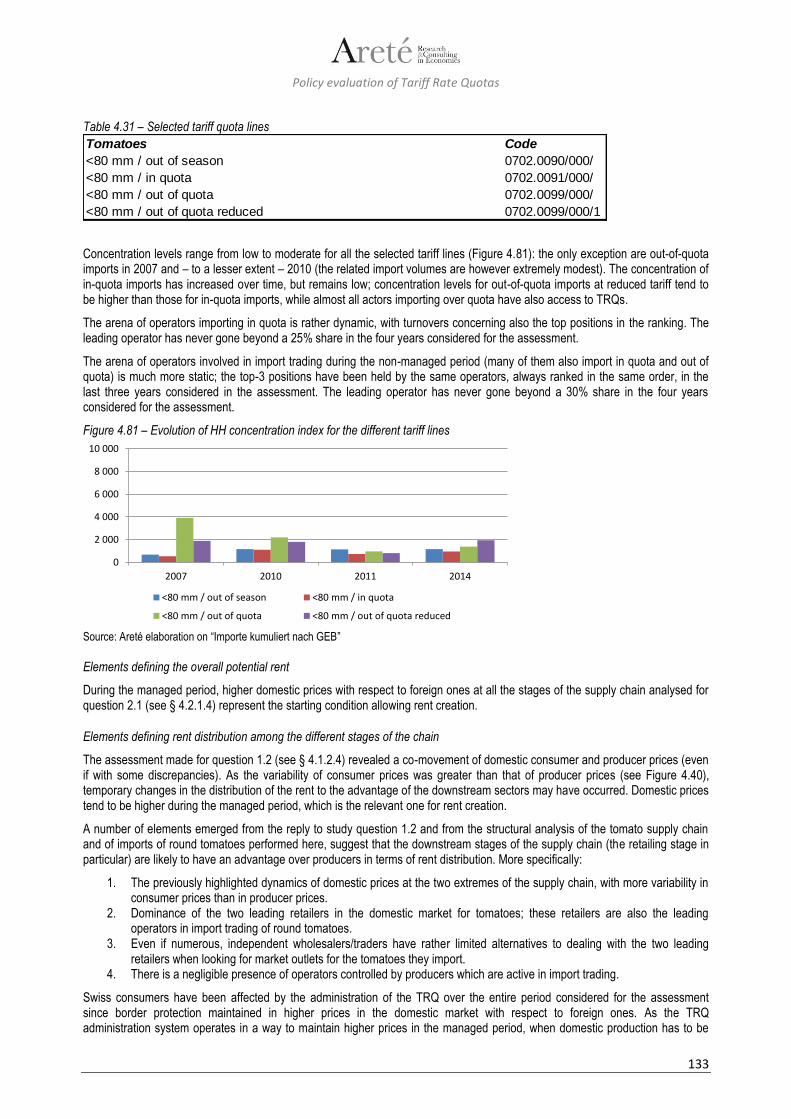
Policy evaluation of Tariff Rate Quotas
133
Table 4.31 – Selected tariff quota lines
Concentration levels range from low to moderate for all the selected tariff lines (Figure 4.81): the only exception are out-of-quota imports in 2007 and – to a lesser extent – 2010 (the related import volumes are however extremely modest). The concentration of in-quota imports has increased over time, but remains low; concentration levels for out-of-quota imports at reduced tariff tend to be higher than those for in-quota imports, while almost all actors importing over quota have also access to TRQs.
The arena of operators importing in quota is rather dynamic, with turnovers concerning also the top positions in the ranking. The leading operator has never gone beyond a 25% share in the four years considered for the assessment.
The arena of operators involved in import trading during the non-managed period (many of them also import in quota and out of quota) is much more static; the top-3 positions have been held by the same operators, always ranked in the same order, in the last three years considered in the assessment. The leading operator has never gone beyond a 30% share in the four years considered for the assessment.
Figure 4.81 – Evolution of HH concentration index for the different tariff lines
Source: Areté elaboration on “Importe kumuliert nach GEB”
Elements defining the overall potential rent
During the managed period, higher domestic prices with respect to foreign ones at all the stages of the supply chain analysed for question 2.1 (see § 4.2.1.4) represent the starting condition allowing rent creation.
Elements defining rent distribution among the different stages of the chain
The assessment made for question 1.2 (see § 4.1.2.4) revealed a co-movement of domestic consumer and producer prices (even if with some discrepancies). As the variability of consumer prices was greater than that of producer prices (see Figure 4.40), temporary changes in the distribution of the rent to the advantage of the downstream sectors may have occurred. Domestic prices tend to be higher during the managed period, which is the relevant one for rent creation.
A number of elements emerged from the reply to study question 1.2 and from the structural analysis of the tomato supply chain and of imports of round tomatoes performed here, suggest that the downstream stages of the supply chain (the retailing stage in particular) are likely to have an advantage over producers in terms of rent distribution. More specifically:
1. The previously highlighted dynamics of domestic prices at the two extremes of the supply chain, with more variability in consumer prices than in producer prices.
2. Dominance of the two leading retailers in the domestic market for tomatoes; these retailers are also the leading operators in import trading of round tomatoes.
3. Even if numerous, independent wholesalers/traders have rather limited alternatives to dealing with the two leading retailers when looking for market outlets for the tomatoes they import.
4. There is a negligible presence of operators controlled by producers which are active in import trading.
Swiss consumers have been affected by the administration of the TRQ over the entire period considered for the assessment since border protection maintained in higher prices in the domestic market with respect to foreign ones. As the TRQ administration system operates in a way to maintain higher prices in the managed period, when domestic production has to be
Tomatoes Code
<80 mm / out of season 0702.0090/000/
<80 mm / in quota 0702.0091/000/
<80 mm / out of quota 0702.0099/000/
<80 mm / out of quota reduced 0702.0099/000/1
0
2 000
4 000
6 000
8 000
10 000
2007 2010 2011 2014
<80 mm / out of season <80 mm / in quota
<80 mm / out of quota <80 mm / out of quota reduced

Policy evaluation of Tariff Rate Quotas
134
marketed, consumers are negatively affected by TRQ administration in this part of the year (with a less strict regulation of imports, retail prices of tomatoes would be lower also in this period).
Considering all the elements coming from the replies to study question 1.2, 2.1 and from the structural analysis performed here, it can be concluded that:
1. TRQ allowed keeping higher prices on the domestic market with respect to foreign ones during the managed period, which made rent creation possible; the overall size of the potential rent has presumably remained stable over the analysed period.
2. Increases in the share of the rent accruing to the intermediate stages of the food chain through the administration of the TRQ for tomatoes have been temporary (i.e. limited to the managed period), inasmuch they have been linked with greater variability of consumer prices vis-à-vis producer prices in the managed period, which is also the period when retail prices of tomatoes tend to peak, thanks to stricter regulation of imports via TRQ administration.
3. The downstream sectors – and retailing in particular – are likely to have an advantage over producers in capturing greater shares of the rent deriving from TRQ administration.
4. Swiss consumers are negatively affected by the administration of the TRQ in the administered period, as strict import regulation via TRQ administration determines higher retail prices.
4.3.1.5 Apples
Clusters and positioning along the supply chain
Identified clusters of companies for apples are outlined in Table 4.33, while Table 4.32 outlines the vertical positioning along the supply chain of the largest groups/clusters and of the main independent importers.
Similarly to what observed for tomatoes (see § 4.3.1.4), the arena of importers of apples for direct consumption sees a clear prevalence - at least in numeric terms – of traders/wholesalers; the major retailers are also active in import trading, whereas the presence of producers is limited.
Table 4.32 – Apples importers’ positioning along the supply chain
Source: Areté elaboration on companies annual reports and desk research
Company / Group Group ProducerTrader /
Wholesalers
Processor
(minimally
processed /
ready to use /
fresh cut )
Retailer
Vertically
integrated
retailer
Other / Service
company
Retailer /
traders
integrated with
producers?
AG für Fruchthandel - xAldi Suisse AG Aldi x
Bamert Früchte AG - xBardini + Keller AG - x
Charles Füglister AG / Tobi Seeobst AG Tobi xCoop Genossenschaft Coop x
Fenaco Genossenschaft Fenaco x x
GBC Frutta Verdura Import SA - x
Geiser agro.com ag Geiser x
Gentile Gebr. AG - x
Gerber - ?
Iseppi Frutta SA - x xLidl Schweiz DL AG Lidl x
Migros-Genossenschafts-Bund / Saviva AG Migros x
Owiamo GmbH - x
PAGANINI Frutta SA - x x
Petracca Sàrl - x
PPO Services AG - x
Schwab-Guillod AG - xSpar Management AG Spar x
Steffen-Ris, Utzenstorf Fenaco x x
Union-Fruits, Charrat Fenaco x
Strimport AG - x
Tobi Seeobst AG - x xUsego AG - x
Venzi + Paganini AG - x
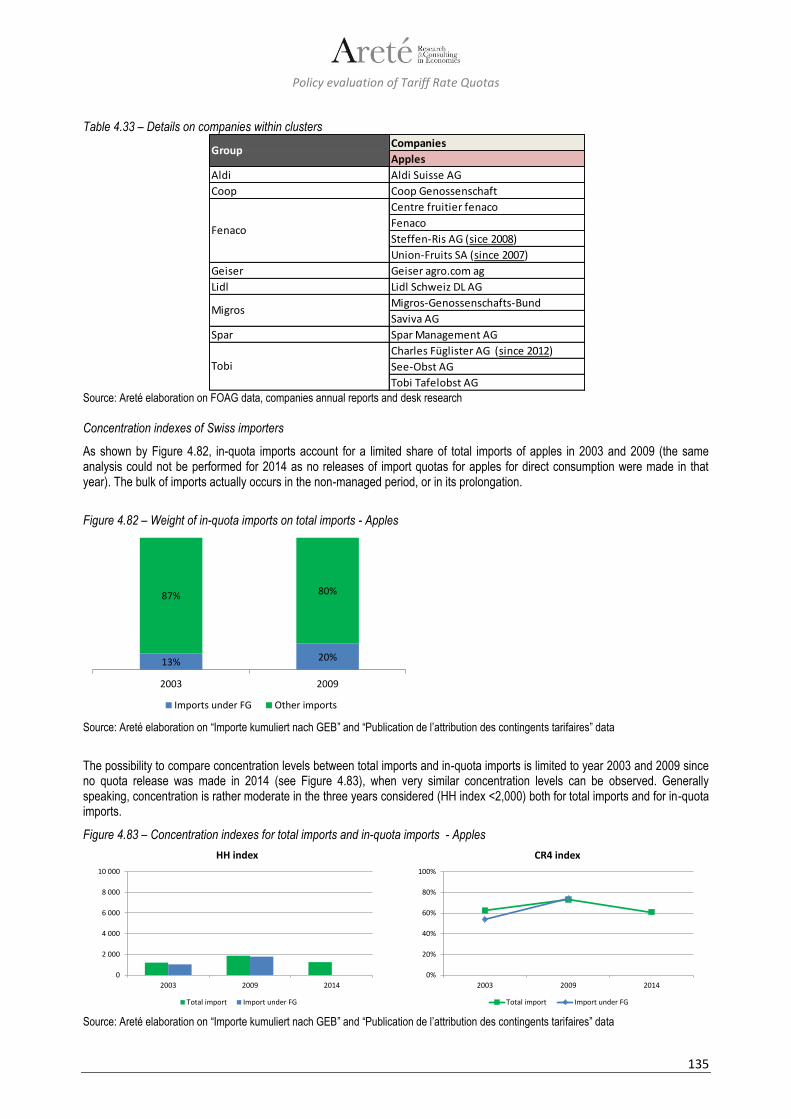
Policy evaluation of Tariff Rate Quotas
135
Table 4.33 – Details on companies within clusters
Source: Areté elaboration on FOAG data, companies annual reports and desk research
Concentration indexes of Swiss importers
As shown by Figure 4.82, in-quota imports account for a limited share of total imports of apples in 2003 and 2009 (the same analysis could not be performed for 2014 as no releases of import quotas for apples for direct consumption were made in that year). The bulk of imports actually occurs in the non-managed period, or in its prolongation.
Figure 4.82 – Weight of in-quota imports on total imports - Apples
Source: Areté elaboration on “Importe kumuliert nach GEB” and “Publication de l’attribution des contingents tarifaires” data
The possibility to compare concentration levels between total imports and in-quota imports is limited to year 2003 and 2009 since no quota release was made in 2014 (see Figure 4.83), when very similar concentration levels can be observed. Generally speaking, concentration is rather moderate in the three years considered (HH index <2,000) both for total imports and for in-quota imports.
Figure 4.83 – Concentration indexes for total imports and in-quota imports - Apples
Source: Areté elaboration on “Importe kumuliert nach GEB” and “Publication de l’attribution des contingents tarifaires” data
Companies
Apples
Aldi Aldi Suisse AG
Coop Coop Genossenschaft
Centre fruitier fenaco
Fenaco
Steffen-Ris AG (sice 2008)
Union-Fruits SA (since 2007)
Geiser Geiser agro.com ag
Lidl Lidl Schweiz DL AG
Migros-Genossenschafts-Bund
Saviva AG
Spar Spar Management AG
Charles Füglister AG (since 2012)
See-Obst AG
Tobi Tafelobst AG
Group
Migros
Tobi
Fenaco
13% 20%
87% 80%
2003 2009
Imports under FG Other imports
0
2 000
4 000
6 000
8 000
10 000
2003 2009 2014
HH index
Total import Import under FG
0%
20%
40%
60%
80%
100%
2003 2009 2014
CR4 index
Total import Import under FG
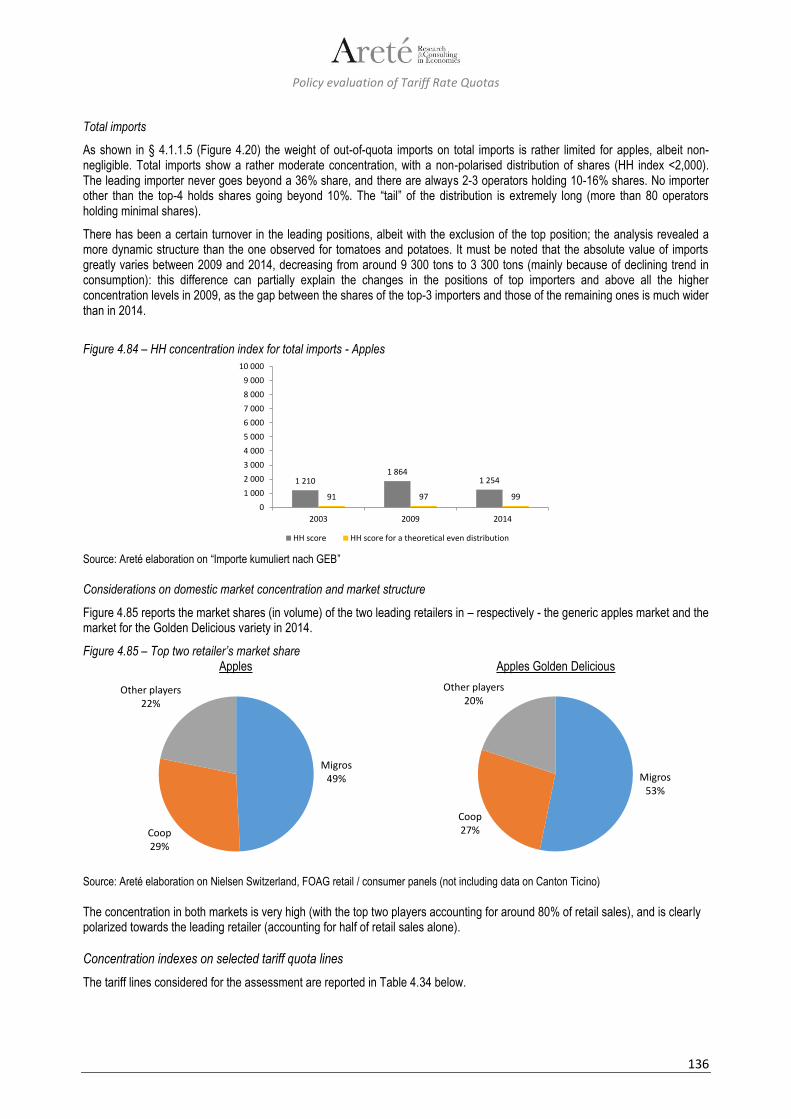
Policy evaluation of Tariff Rate Quotas
136
Total imports
As shown in § 4.1.1.5 (Figure 4.20) the weight of out-of-quota imports on total imports is rather limited for apples, albeit non-negligible. Total imports show a rather moderate concentration, with a non-polarised distribution of shares (HH index <2,000). The leading importer never goes beyond a 36% share, and there are always 2-3 operators holding 10-16% shares. No importer other than the top-4 holds shares going beyond 10%. The “tail” of the distribution is extremely long (more than 80 operators holding minimal shares).
There has been a certain turnover in the leading positions, albeit with the exclusion of the top position; the analysis revealed a more dynamic structure than the one observed for tomatoes and potatoes. It must be noted that the absolute value of imports greatly varies between 2009 and 2014, decreasing from around 9 300 tons to 3 300 tons (mainly because of declining trend in consumption): this difference can partially explain the changes in the positions of top importers and above all the higher concentration levels in 2009, as the gap between the shares of the top-3 importers and those of the remaining ones is much wider than in 2014.
Figure 4.84 – HH concentration index for total imports - Apples
Source: Areté elaboration on “Importe kumuliert nach GEB”
Considerations on domestic market concentration and market structure
Figure 4.85 reports the market shares (in volume) of the two leading retailers in – respectively - the generic apples market and the market for the Golden Delicious variety in 2014.
Figure 4.85 – Top two retailer’s market share Apples Apples Golden Delicious
Source: Areté elaboration on Nielsen Switzerland, FOAG retail / consumer panels (not including data on Canton Ticino) The concentration in both markets is very high (with the top two players accounting for around 80% of retail sales), and is clearly polarized towards the leading retailer (accounting for half of retail sales alone).
Concentration indexes on selected tariff quota lines
The tariff lines considered for the assessment are reported in Table 4.34 below.
1 2101 864
1 254
91 97 990
1 000
2 000
3 000
4 000
5 000
6 000
7 000
8 000
9 000
10 000
2003 2009 2014
HH score HH score for a theoretical even distribution
Migros49%
Coop29%
Other players22%
Migros53%
Coop27%
Other players20%
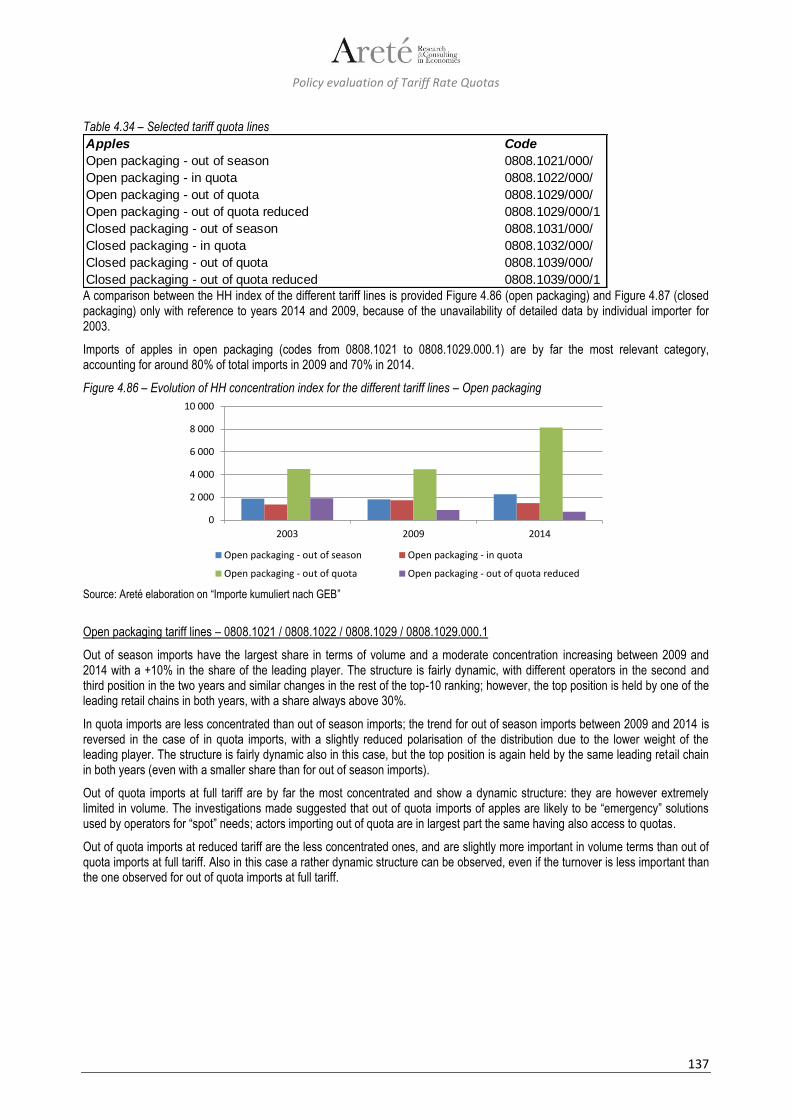
Policy evaluation of Tariff Rate Quotas
137
Table 4.34 – Selected tariff quota lines
A comparison between the HH index of the different tariff lines is provided Figure 4.86 (open packaging) and Figure 4.87 (closed packaging) only with reference to years 2014 and 2009, because of the unavailability of detailed data by individual importer for 2003.
Imports of apples in open packaging (codes from 0808.1021 to 0808.1029.000.1) are by far the most relevant category, accounting for around 80% of total imports in 2009 and 70% in 2014.
Figure 4.86 – Evolution of HH concentration index for the different tariff lines – Open packaging
Source: Areté elaboration on “Importe kumuliert nach GEB”
Open packaging tariff lines – 0808.1021 / 0808.1022 / 0808.1029 / 0808.1029.000.1
Out of season imports have the largest share in terms of volume and a moderate concentration increasing between 2009 and 2014 with a +10% in the share of the leading player. The structure is fairly dynamic, with different operators in the second and third position in the two years and similar changes in the rest of the top-10 ranking; however, the top position is held by one of the leading retail chains in both years, with a share always above 30%.
In quota imports are less concentrated than out of season imports; the trend for out of season imports between 2009 and 2014 is reversed in the case of in quota imports, with a slightly reduced polarisation of the distribution due to the lower weight of the leading player. The structure is fairly dynamic also in this case, but the top position is again held by the same leading retail chain in both years (even with a smaller share than for out of season imports).
Out of quota imports at full tariff are by far the most concentrated and show a dynamic structure: they are however extremely limited in volume. The investigations made suggested that out of quota imports of apples are likely to be “emergency” solutions used by operators for “spot” needs; actors importing out of quota are in largest part the same having also access to quotas.
Out of quota imports at reduced tariff are the less concentrated ones, and are slightly more important in volume terms than out of quota imports at full tariff. Also in this case a rather dynamic structure can be observed, even if the turnover is less important than the one observed for out of quota imports at full tariff.
Apples Code
Open packaging - out of season 0808.1021/000/
Open packaging - in quota 0808.1022/000/
Open packaging - out of quota 0808.1029/000/
Open packaging - out of quota reduced 0808.1029/000/1
Closed packaging - out of season 0808.1031/000/
Closed packaging - in quota 0808.1032/000/
Closed packaging - out of quota 0808.1039/000/
Closed packaging - out of quota reduced 0808.1039/000/1
0
2 000
4 000
6 000
8 000
10 000
2003 2009 2014
Open packaging - out of season Open packaging - in quota
Open packaging - out of quota Open packaging - out of quota reduced
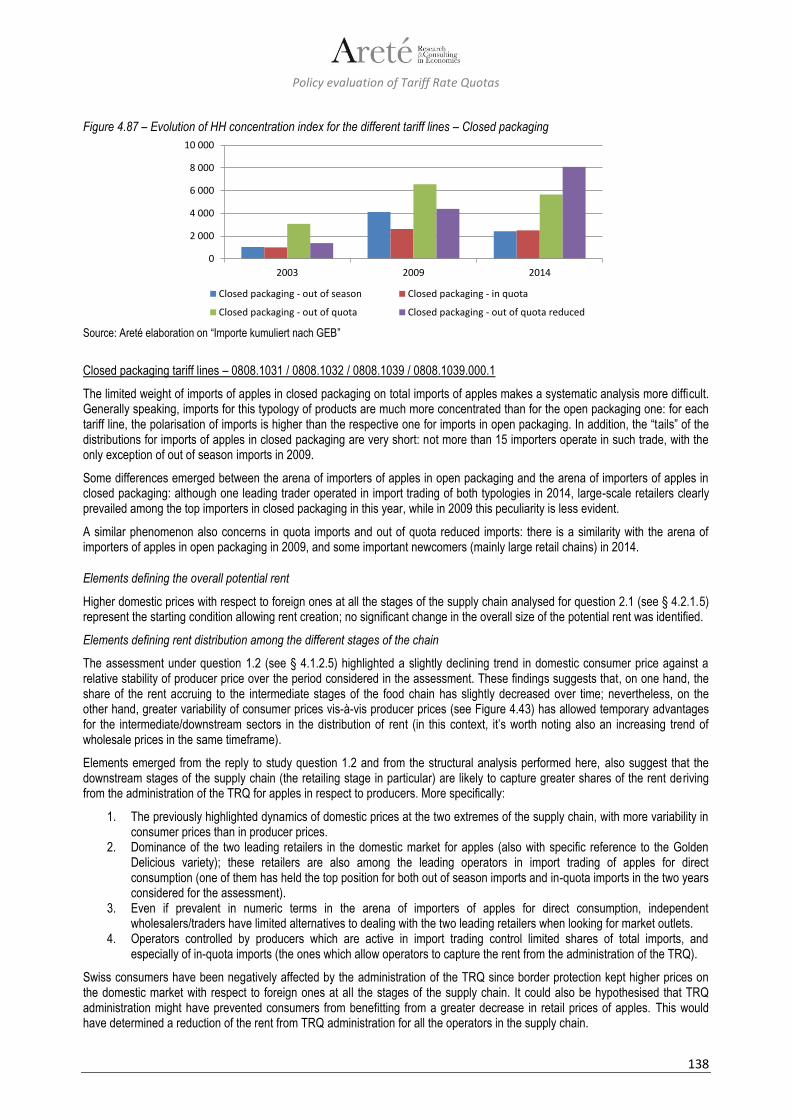
Policy evaluation of Tariff Rate Quotas
138
Figure 4.87 – Evolution of HH concentration index for the different tariff lines – Closed packaging
Source: Areté elaboration on “Importe kumuliert nach GEB”
Closed packaging tariff lines – 0808.1031 / 0808.1032 / 0808.1039 / 0808.1039.000.1
The limited weight of imports of apples in closed packaging on total imports of apples makes a systematic analysis more difficult. Generally speaking, imports for this typology of products are much more concentrated than for the open packaging one: for each tariff line, the polarisation of imports is higher than the respective one for imports in open packaging. In addition, the “tails” of the distributions for imports of apples in closed packaging are very short: not more than 15 importers operate in such trade, with the only exception of out of season imports in 2009.
Some differences emerged between the arena of importers of apples in open packaging and the arena of importers of apples in closed packaging: although one leading trader operated in import trading of both typologies in 2014, large-scale retailers clearly prevailed among the top importers in closed packaging in this year, while in 2009 this peculiarity is less evident.
A similar phenomenon also concerns in quota imports and out of quota reduced imports: there is a similarity with the arena of importers of apples in open packaging in 2009, and some important newcomers (mainly large retail chains) in 2014.
Elements defining the overall potential rent
Higher domestic prices with respect to foreign ones at all the stages of the supply chain analysed for question 2.1 (see § 4.2.1.5) represent the starting condition allowing rent creation; no significant change in the overall size of the potential rent was identified.
Elements defining rent distribution among the different stages of the chain
The assessment under question 1.2 (see § 4.1.2.5) highlighted a slightly declining trend in domestic consumer price against a relative stability of producer price over the period considered in the assessment. These findings suggests that, on one hand, the share of the rent accruing to the intermediate stages of the food chain has slightly decreased over time; nevertheless, on the other hand, greater variability of consumer prices vis-à-vis producer prices (see Figure 4.43) has allowed temporary advantages for the intermediate/downstream sectors in the distribution of rent (in this context, it’s worth noting also an increasing trend of wholesale prices in the same timeframe).
Elements emerged from the reply to study question 1.2 and from the structural analysis performed here, also suggest that the downstream stages of the supply chain (the retailing stage in particular) are likely to capture greater shares of the rent deriving from the administration of the TRQ for apples in respect to producers. More specifically:
1. The previously highlighted dynamics of domestic prices at the two extremes of the supply chain, with more variability in consumer prices than in producer prices.
2. Dominance of the two leading retailers in the domestic market for apples (also with specific reference to the Golden Delicious variety); these retailers are also among the leading operators in import trading of apples for direct consumption (one of them has held the top position for both out of season imports and in-quota imports in the two years considered for the assessment).
3. Even if prevalent in numeric terms in the arena of importers of apples for direct consumption, independent wholesalers/traders have limited alternatives to dealing with the two leading retailers when looking for market outlets.
4. Operators controlled by producers which are active in import trading control limited shares of total imports, and especially of in-quota imports (the ones which allow operators to capture the rent from the administration of the TRQ).
Swiss consumers have been negatively affected by the administration of the TRQ since border protection kept higher prices on the domestic market with respect to foreign ones at all the stages of the supply chain. It could also be hypothesised that TRQ administration might have prevented consumers from benefitting from a greater decrease in retail prices of apples. This would have determined a reduction of the rent from TRQ administration for all the operators in the supply chain.
0
2 000
4 000
6 000
8 000
10 000
2003 2009 2014
Closed packaging - out of season Closed packaging - in quota
Closed packaging - out of quota Closed packaging - out of quota reduced
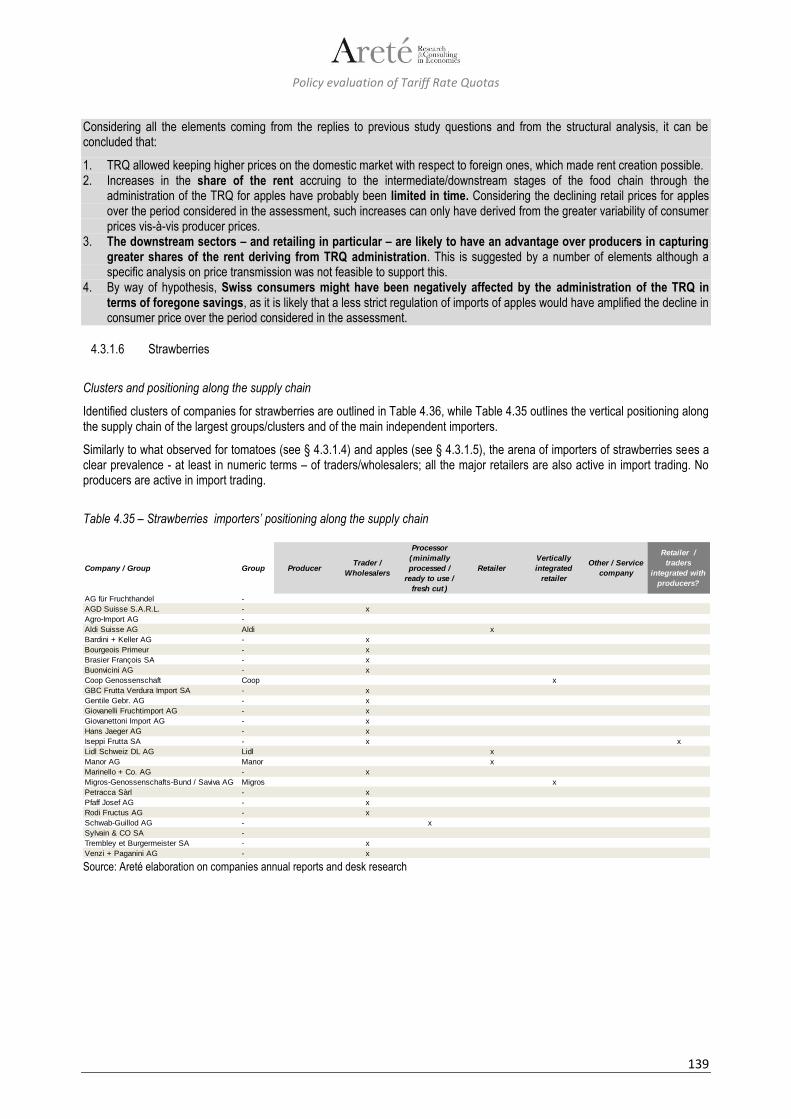
Policy evaluation of Tariff Rate Quotas
139
Considering all the elements coming from the replies to previous study questions and from the structural analysis, it can be concluded that:
1. TRQ allowed keeping higher prices on the domestic market with respect to foreign ones, which made rent creation possible. 2. Increases in the share of the rent accruing to the intermediate/downstream stages of the food chain through the
administration of the TRQ for apples have probably been limited in time. Considering the declining retail prices for apples over the period considered in the assessment, such increases can only have derived from the greater variability of consumer prices vis-à-vis producer prices.
3. The downstream sectors – and retailing in particular – are likely to have an advantage over producers in capturing greater shares of the rent deriving from TRQ administration. This is suggested by a number of elements although a specific analysis on price transmission was not feasible to support this.
4. By way of hypothesis, Swiss consumers might have been negatively affected by the administration of the TRQ in terms of foregone savings, as it is likely that a less strict regulation of imports of apples would have amplified the decline in consumer price over the period considered in the assessment.
4.3.1.6 Strawberries
Clusters and positioning along the supply chain
Identified clusters of companies for strawberries are outlined in Table 4.36, while Table 4.35 outlines the vertical positioning along the supply chain of the largest groups/clusters and of the main independent importers.
Similarly to what observed for tomatoes (see § 4.3.1.4) and apples (see § 4.3.1.5), the arena of importers of strawberries sees a clear prevalence - at least in numeric terms – of traders/wholesalers; all the major retailers are also active in import trading. No producers are active in import trading.
Table 4.35 – Strawberries importers’ positioning along the supply chain
Source: Areté elaboration on companies annual reports and desk research
Company / Group Group ProducerTrader /
Wholesalers
Processor
(minimally
processed /
ready to use /
fresh cut )
Retailer
Vertically
integrated
retailer
Other / Service
company
Retailer /
traders
integrated with
producers?
AG für Fruchthandel -
AGD Suisse S.A.R.L. - x
Agro-Import AG -
Aldi Suisse AG Aldi x
Bardini + Keller AG - x
Bourgeois Primeur - x
Brasier François SA - x
Buonvicini AG - x
Coop Genossenschaft Coop x
GBC Frutta Verdura Import SA - x
Gentile Gebr. AG - x
Giovanelli Fruchtimport AG - x
Giovanettoni Import AG - x
Hans Jaeger AG - x
Iseppi Frutta SA - x x
Lidl Schweiz DL AG Lidl x
Manor AG Manor x
Marinello + Co. AG - x
Migros-Genossenschafts-Bund / Saviva AG Migros x
Petracca Sàrl - x
Pfaff Josef AG - x
Rodi Fructus AG - x
Schwab-Guillod AG - x
Sylvain & CO SA -
Trembley et Burgermeister SA - x
Venzi + Paganini AG - x
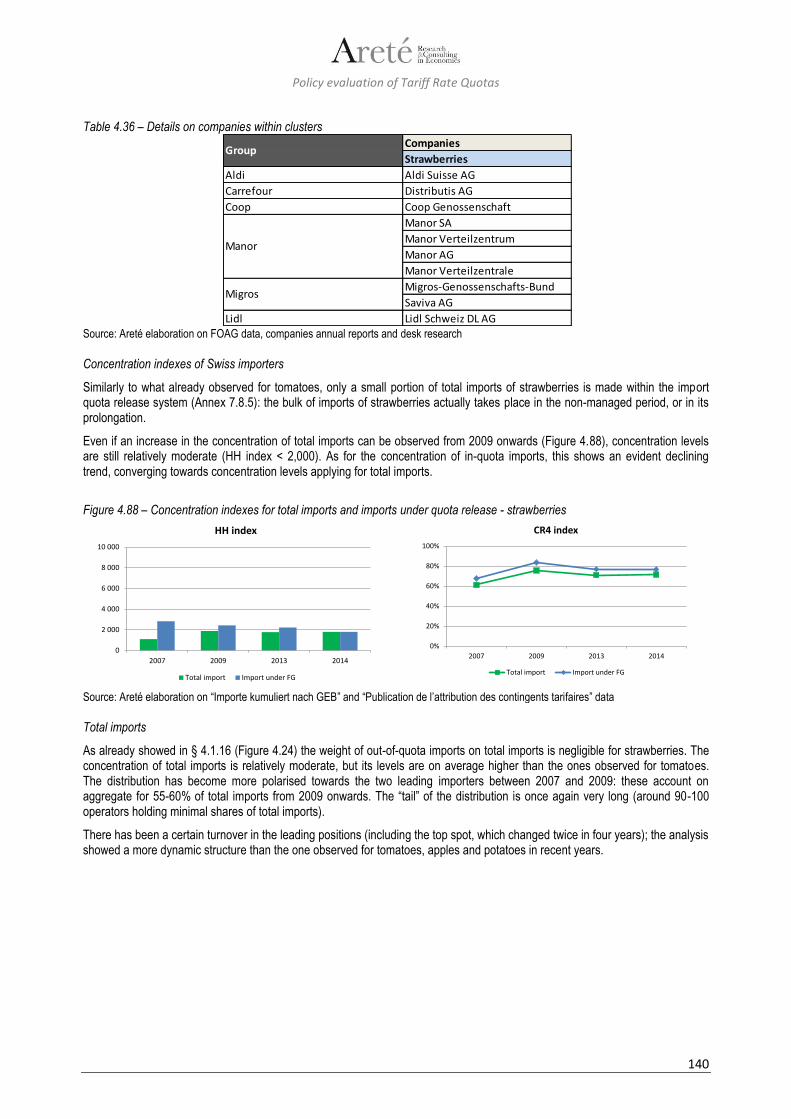
Policy evaluation of Tariff Rate Quotas
140
Table 4.36 – Details on companies within clusters
Source: Areté elaboration on FOAG data, companies annual reports and desk research
Concentration indexes of Swiss importers
Similarly to what already observed for tomatoes, only a small portion of total imports of strawberries is made within the import quota release system (Annex 7.8.5): the bulk of imports of strawberries actually takes place in the non-managed period, or in its prolongation.
Even if an increase in the concentration of total imports can be observed from 2009 onwards (Figure 4.88), concentration levels are still relatively moderate (HH index < 2,000). As for the concentration of in-quota imports, this shows an evident declining trend, converging towards concentration levels applying for total imports.
Figure 4.88 – Concentration indexes for total imports and imports under quota release - strawberries
Source: Areté elaboration on “Importe kumuliert nach GEB” and “Publication de l’attribution des contingents tarifaires” data
Total imports
As already showed in § 4.1.16 (Figure 4.24) the weight of out-of-quota imports on total imports is negligible for strawberries. The concentration of total imports is relatively moderate, but its levels are on average higher than the ones observed for tomatoes. The distribution has become more polarised towards the two leading importers between 2007 and 2009: these account on aggregate for 55-60% of total imports from 2009 onwards. The “tail” of the distribution is once again very long (around 90-100 operators holding minimal shares of total imports).
There has been a certain turnover in the leading positions (including the top spot, which changed twice in four years); the analysis showed a more dynamic structure than the one observed for tomatoes, apples and potatoes in recent years.
Companies
Strawberries
Aldi Aldi Suisse AG
Carrefour Distributis AG
Coop Coop Genossenschaft
Manor SA
Manor Verteilzentrum
Manor AG
Manor Verteilzentrale
Migros-Genossenschafts-Bund
Saviva AG
Lidl Lidl Schweiz DL AG
Group
Migros
Manor
0
2 000
4 000
6 000
8 000
10 000
2007 2009 2013 2014
HH index
Total import Import under FG
0%
20%
40%
60%
80%
100%
2007 2009 2013 2014
CR4 index
Total import Import under FG

Policy evaluation of Tariff Rate Quotas
141
Figure 4.89 – HH concentration index for total imports - strawberries
Source: Areté elaboration on “Importe kumuliert nach GEB”
Considerations on domestic market concentration and market structure
As a complement to the structural analysis of imports, Figure 4.90 reports the market shares (in volume) of the two leading retail chains in the strawberries market in 2014.
Figure 4.90 – Top two retailer’s market share - Strawberries
Source: Areté elaboration on Nielsen Switzerland, FOAG retail / consumer panels (not including data on Canton Ticino)
Similarly to what already observed for potatoes, tomatoes and apples (see § 4.3.1.3, 4.3.1.4 and 4.3.1.5), the retail market of strawberries is extremely concentrated, with the two leading retailers accounting for around 75% of the domestic sales. The two leading retail chains have been among the leading importers of strawberries in most of the years considered for the assessment.
Concentration indexes on selected tariff quota lines
The tariff lines considered for the assessment are reported in Table 4.37 below.
Table 4.37 – Selected tariff quota lines
Figure 4.91 reveals that the concentration levels for out of season imports have tended to increase (even if they remain relatively moderate – HH index < 2,000 points), whereas concentration levels for in-quota imports have tended to decrease (also in this case, concentration is rather moderate). There has been a remarkable decrease in the concentration of out-of-quota imports, which anyway concern limited volumes, while concentration in out-of-quota reduced imports have remained stable in the 2007 and 2013 (the presence of a single importer in 2009 – HH index equal to 10,000 – is an exception) and decreased in 2014.
In the last three years considered for the assessment, the structure of the arena of operators active in out-of-season import trading has been fairly static in the top positions: the two leading retail chains have always accounted for a combined share of at least 50%.
1 0941 875 1 772 1 787
88 102 99 950
1 000
2 000
3 000
4 000
5 000
6 000
7 000
8 000
9 000
10 000
2007 2009 2013 2014
HH score HH score for a theoretical even distribution
Migros41%
Coop34%
Other players25%
Strawberries Code
Out of season 0810.1010/014/
In quota 0810.1011/014/
Out of quota 0810.1019/014/
Out of quota reduced 0810.1019/014/1
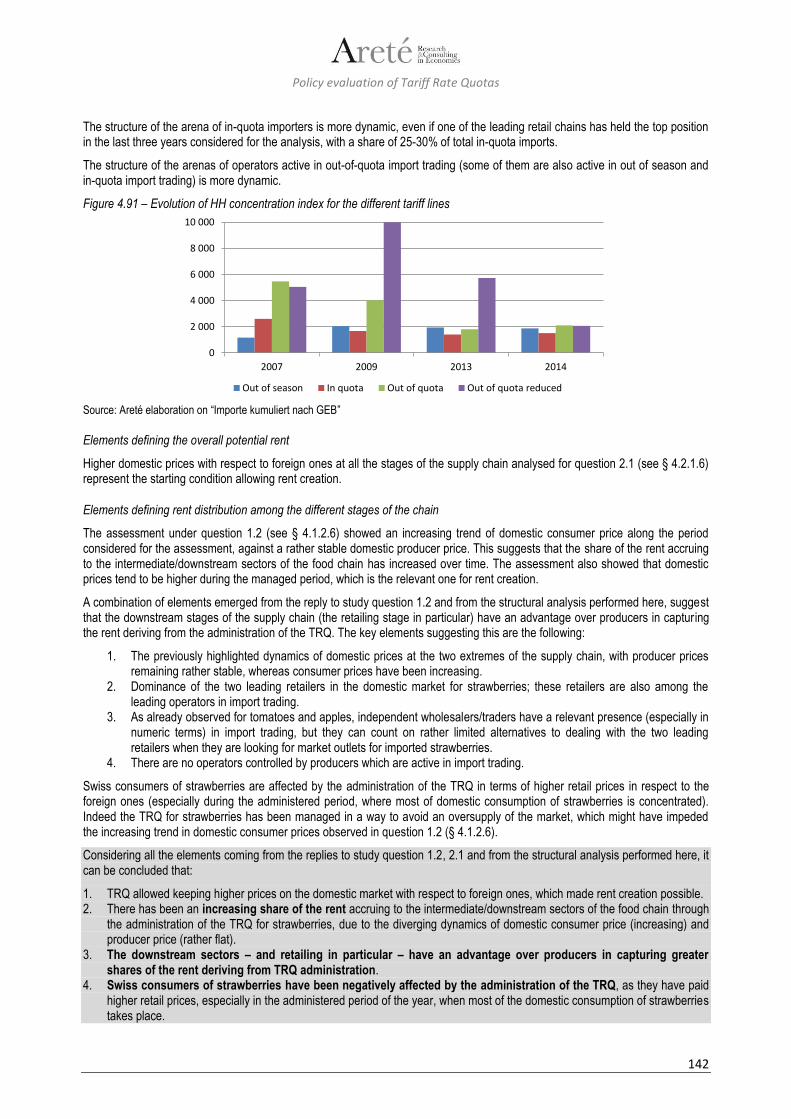
Policy evaluation of Tariff Rate Quotas
142
The structure of the arena of in-quota importers is more dynamic, even if one of the leading retail chains has held the top position in the last three years considered for the analysis, with a share of 25-30% of total in-quota imports.
The structure of the arenas of operators active in out-of-quota import trading (some of them are also active in out of season and in-quota import trading) is more dynamic.
Figure 4.91 – Evolution of HH concentration index for the different tariff lines
Source: Areté elaboration on “Importe kumuliert nach GEB”
Elements defining the overall potential rent
Higher domestic prices with respect to foreign ones at all the stages of the supply chain analysed for question 2.1 (see § 4.2.1.6) represent the starting condition allowing rent creation.
Elements defining rent distribution among the different stages of the chain
The assessment under question 1.2 (see § 4.1.2.6) showed an increasing trend of domestic consumer price along the period considered for the assessment, against a rather stable domestic producer price. This suggests that the share of the rent accruing to the intermediate/downstream sectors of the food chain has increased over time. The assessment also showed that domestic prices tend to be higher during the managed period, which is the relevant one for rent creation.
A combination of elements emerged from the reply to study question 1.2 and from the structural analysis performed here, suggest that the downstream stages of the supply chain (the retailing stage in particular) have an advantage over producers in capturing the rent deriving from the administration of the TRQ. The key elements suggesting this are the following:
1. The previously highlighted dynamics of domestic prices at the two extremes of the supply chain, with producer prices remaining rather stable, whereas consumer prices have been increasing.
2. Dominance of the two leading retailers in the domestic market for strawberries; these retailers are also among the leading operators in import trading.
3. As already observed for tomatoes and apples, independent wholesalers/traders have a relevant presence (especially in numeric terms) in import trading, but they can count on rather limited alternatives to dealing with the two leading retailers when they are looking for market outlets for imported strawberries.
4. There are no operators controlled by producers which are active in import trading.
Swiss consumers of strawberries are affected by the administration of the TRQ in terms of higher retail prices in respect to the foreign ones (especially during the administered period, where most of domestic consumption of strawberries is concentrated). Indeed the TRQ for strawberries has been managed in a way to avoid an oversupply of the market, which might have impeded the increasing trend in domestic consumer prices observed in question 1.2 (§ 4.1.2.6).
Considering all the elements coming from the replies to study question 1.2, 2.1 and from the structural analysis performed here, it can be concluded that:
1. TRQ allowed keeping higher prices on the domestic market with respect to foreign ones, which made rent creation possible. 2. There has been an increasing share of the rent accruing to the intermediate/downstream sectors of the food chain through
the administration of the TRQ for strawberries, due to the diverging dynamics of domestic consumer price (increasing) and producer price (rather flat).
3. The downstream sectors – and retailing in particular – have an advantage over producers in capturing greater shares of the rent deriving from TRQ administration.
4. Swiss consumers of strawberries have been negatively affected by the administration of the TRQ, as they have paid higher retail prices, especially in the administered period of the year, when most of the domestic consumption of strawberries takes place.
0
2 000
4 000
6 000
8 000
10 000
2007 2009 2013 2014
Out of season In quota Out of quota Out of quota reduced

Policy evaluation of Tariff Rate Quotas
143
4.3.2 Reply to Q 3.2: impact on import composition
Which is the impact of TRQs and of their administration method on the structure of imports (effect on the price and volume composition of shipments, structure of importers)?
Replies to this question for individual products are structured as follows:
1. The results of an in-depth assessment of the impact of TRQ administration methods on the structure of imports and of the operators active in import trading are illustrated.
2. A synthetic overview of the key findings from other questions which are relevant for answering to question 3.2 is provided.
3. Conclusions drawn from the elements at points 1 and 2 above are elaborated.
4.3.2.1 Beef
Comparison among concentration indexes at the attribution of quotas, after trade of quotas and actual in-quota imports
The final allocation of import quotas for HQB is extremely polarised towards the leading operator (a service company operating on behalf of other companies, which include traders/wholesalers, processors, and the two leading retail chains, which are vertically integrated towards slaughtering/meat processing through some of their subsidiaries). The leading operator is the same in all the three years considered, and gets at least a 70% share of the total allocated volumes. Also the second-ranked operator (another service company with similar features) is always the same. The structure is very static, with extremely limited turnover in the top positions. All the leading assignees use 100% of the allocated quotas. The amount of traded quotas – also considering transfers to service companies – is around 3 700 Tons in 2011 (equal to approximately 84% of total quotas for the year).
Figure 4.92 – Comparison of HH concentration index and percentage of traded quotas
HH indexes: quotas allocation / quotas after trade / actual in quota imports
Percentage of traded quotas: 2011
Source: Areté elaboration on FOAG data
As shown in Figure 4.92 and Table 4.38, the final allocation is actually the result of a rather complex process87:
1. An initial quota allocation, which from 2005 onwards is partly made through auctions (90%) and partly based on domestic purchases in the previous year (10%). Service companies are usually not involved in this initial allocation, or they are only to a limited extent.
2. Import quotas from the initial allocation are then traded between operators. In the case of beef, most of these quotas are transferred to the two service companies (Table 4.38). This process leads to a substantial increase in the observable concentration levels (Figure 4.92). Very limited (if any) information is publicly available on the way in which quotas are traded, as well as on the way in which the two service companies operate on behalf of the companies which have transferred quotas to them (in particular, about the way in which imported beef could possibly also be re-allocated among the companies which have transferred the quotas). In many respects, being these services’ companies private entities, it is not possible to analyse how they operate in respect to their clients.
87 Comparison between concentration of quota allocation, quotas after trade and actual imports was conducted on three years: 2007, 2011 and 2014; on the other side, due to its complexity and length, the analysis on one-to-one trading quotas was performed on 2011 only and showed that around 84% of total allocated quotas was exchanged in that year.
340 596 827
6 1795 675
6 3306 1805 679
6 332
0
2 000
4 000
6 000
8 000
10 000
2007 2011 2014
HH index
Quota allocation Quotas after trade Actual in quota importsTraded quotas
84%
other quotas16%
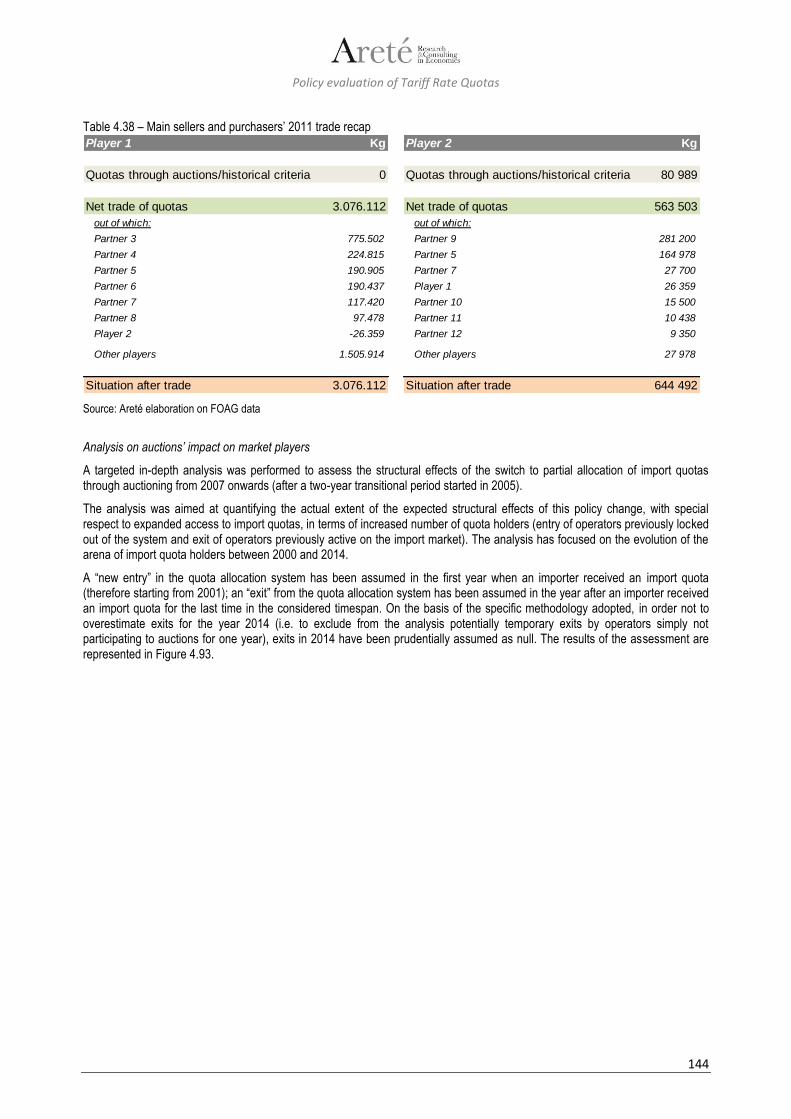
Policy evaluation of Tariff Rate Quotas
144
Table 4.38 – Main sellers and purchasers’ 2011 trade recap
Source: Areté elaboration on FOAG data
Analysis on auctions’ impact on market players
A targeted in-depth analysis was performed to assess the structural effects of the switch to partial allocation of import quotas through auctioning from 2007 onwards (after a two-year transitional period started in 2005).
The analysis was aimed at quantifying the actual extent of the expected structural effects of this policy change, with special respect to expanded access to import quotas, in terms of increased number of quota holders (entry of operators previously locked out of the system and exit of operators previously active on the import market). The analysis has focused on the evolution of the arena of import quota holders between 2000 and 2014.
A “new entry” in the quota allocation system has been assumed in the first year when an importer received an import quota (therefore starting from 2001); an “exit” from the quota allocation system has been assumed in the year after an importer received an import quota for the last time in the considered timespan. On the basis of the specific methodology adopted, in order not to overestimate exits for the year 2014 (i.e. to exclude from the analysis potentially temporary exits by operators simply not participating to auctions for one year), exits in 2014 have been prudentially assumed as null. The results of the assessment are represented in Figure 4.93.
Player 1 Kg
Quotas through auctions/historical criteria 0
Net trade of quotas 3.076.112
out of which:
Partner 3 775.502
Partner 4 224.815
Partner 5 190.905
Partner 6 190.437
Partner 7 117.420
Partner 8 97.478
Player 2 -26.359
Other players 1.505.914
Situation after trade 3.076.112
Player 2 Kg
Quotas through auctions/historical criteria 80 989
Net trade of quotas 563 503
out of which:
Partner 9 281 200
Partner 5 164 978
Partner 7 27 700
Player 1 26 359
Partner 10 15 500
Partner 11 10 438
Partner 12 9 350
Other players 27 978
Situation after trade 644 492
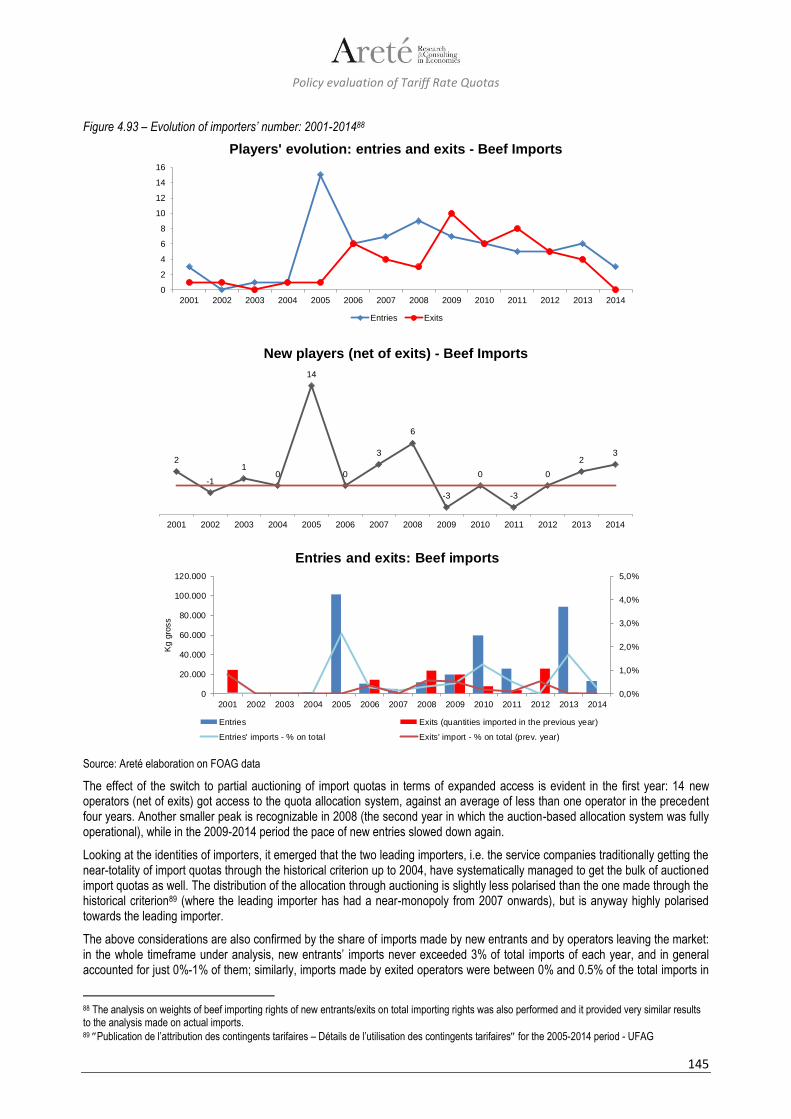
Policy evaluation of Tariff Rate Quotas
145
Figure 4.93 – Evolution of importers’ number: 2001-201488
Source: Areté elaboration on FOAG data
The effect of the switch to partial auctioning of import quotas in terms of expanded access is evident in the first year: 14 new operators (net of exits) got access to the quota allocation system, against an average of less than one operator in the precedent four years. Another smaller peak is recognizable in 2008 (the second year in which the auction-based allocation system was fully operational), while in the 2009-2014 period the pace of new entries slowed down again.
Looking at the identities of importers, it emerged that the two leading importers, i.e. the service companies traditionally getting the near-totality of import quotas through the historical criterion up to 2004, have systematically managed to get the bulk of auctioned import quotas as well. The distribution of the allocation through auctioning is slightly less polarised than the one made through the historical criterion89 (where the leading importer has had a near-monopoly from 2007 onwards), but is anyway highly polarised towards the leading importer.
The above considerations are also confirmed by the share of imports made by new entrants and by operators leaving the market: in the whole timeframe under analysis, new entrants’ imports never exceeded 3% of total imports of each year, and in general accounted for just 0%-1% of them; similarly, imports made by exited operators were between 0% and 0.5% of the total imports in
88 The analysis on weights of beef importing rights of new entrants/exits on total importing rights was also performed and it provided very similar results to the analysis made on actual imports. 89 Publication de l’attribution des contingents tarifaires – Détails de l’utilisation des contingents tarifaires for the 2005-2014 period - UFAG
0
2
4
6
8
10
12
14
16
2001 2002 2003 2004 2005 2006 2007 2008 2009 2010 2011 2012 2013 2014
Players' evolution: entries and exits - Beef Imports
Entries Exits
2
-1
10
14
0
3
6
-3
0
-3
0
23
2001 2002 2003 2004 2005 2006 2007 2008 2009 2010 2011 2012 2013 2014
New players (net of exits) - Beef Imports
0,0%
1,0%
2,0%
3,0%
4,0%
5,0%
0
20.000
40.000
60.000
80.000
100.000
120.000
2001 2002 2003 2004 2005 2006 2007 2008 2009 2010 2011 2012 2013 2014
Kg g
ross
Entries and exits: Beef imports
Entries Exits (quantities imported in the previous year)
Entries' imports - % on total Exits' import - % on total (prev. year)
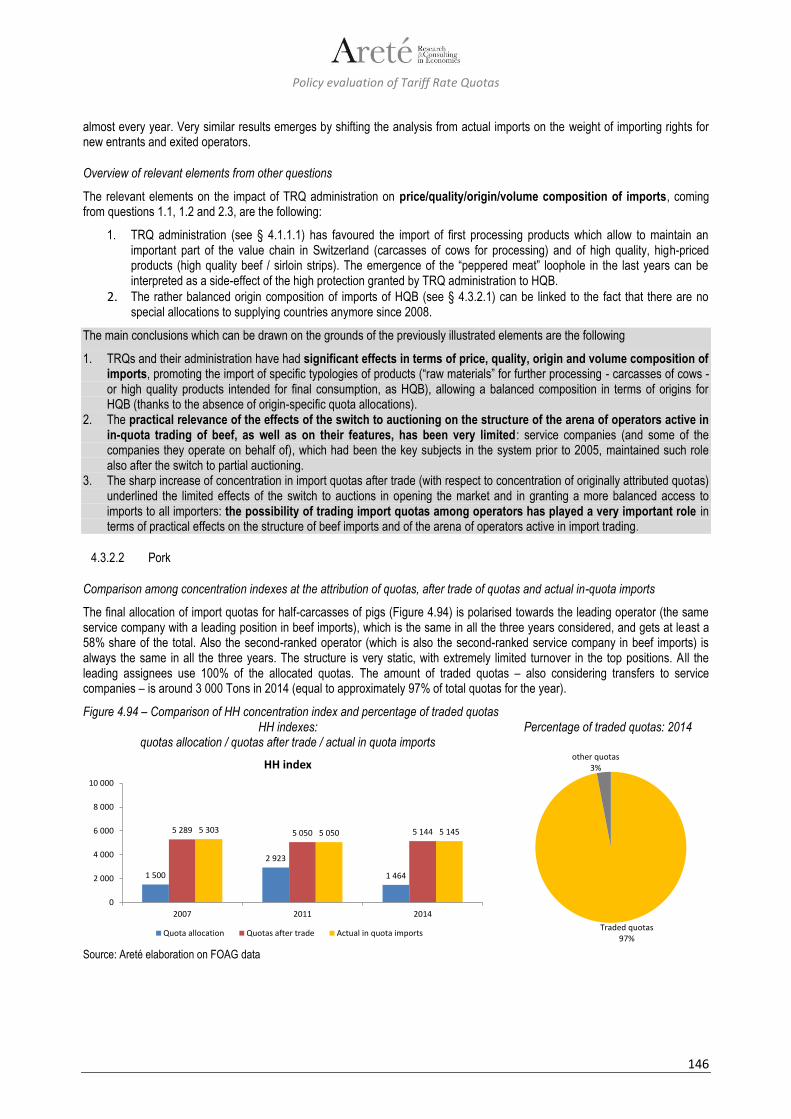
Policy evaluation of Tariff Rate Quotas
146
almost every year. Very similar results emerges by shifting the analysis from actual imports on the weight of importing rights for new entrants and exited operators.
Overview of relevant elements from other questions
The relevant elements on the impact of TRQ administration on price/quality/origin/volume composition of imports, coming from questions 1.1, 1.2 and 2.3, are the following:
1. TRQ administration (see § 4.1.1.1) has favoured the import of first processing products which allow to maintain an important part of the value chain in Switzerland (carcasses of cows for processing) and of high quality, high-priced products (high quality beef / sirloin strips). The emergence of the “peppered meat” loophole in the last years can be interpreted as a side-effect of the high protection granted by TRQ administration to HQB.
2. The rather balanced origin composition of imports of HQB (see § 4.3.2.1) can be linked to the fact that there are no special allocations to supplying countries anymore since 2008.
The main conclusions which can be drawn on the grounds of the previously illustrated elements are the following
1. TRQs and their administration have had significant effects in terms of price, quality, origin and volume composition of imports, promoting the import of specific typologies of products (“raw materials” for further processing - carcasses of cows - or high quality products intended for final consumption, as HQB), allowing a balanced composition in terms of origins for HQB (thanks to the absence of origin-specific quota allocations).
2. The practical relevance of the effects of the switch to auctioning on the structure of the arena of operators active in in-quota trading of beef, as well as on their features, has been very limited: service companies (and some of the companies they operate on behalf of), which had been the key subjects in the system prior to 2005, maintained such role also after the switch to partial auctioning.
3. The sharp increase of concentration in import quotas after trade (with respect to concentration of originally attributed quotas) underlined the limited effects of the switch to auctions in opening the market and in granting a more balanced access to imports to all importers: the possibility of trading import quotas among operators has played a very important role in terms of practical effects on the structure of beef imports and of the arena of operators active in import trading.
4.3.2.2 Pork
Comparison among concentration indexes at the attribution of quotas, after trade of quotas and actual in-quota imports
The final allocation of import quotas for half-carcasses of pigs (Figure 4.94) is polarised towards the leading operator (the same service company with a leading position in beef imports), which is the same in all the three years considered, and gets at least a 58% share of the total. Also the second-ranked operator (which is also the second-ranked service company in beef imports) is always the same in all the three years. The structure is very static, with extremely limited turnover in the top positions. All the leading assignees use 100% of the allocated quotas. The amount of traded quotas – also considering transfers to service companies – is around 3 000 Tons in 2014 (equal to approximately 97% of total quotas for the year).
Figure 4.94 – Comparison of HH concentration index and percentage of traded quotas HH indexes:
quotas allocation / quotas after trade / actual in quota imports Percentage of traded quotas: 2014
Source: Areté elaboration on FOAG data
1 500
2 923
1 464
5 289 5 050 5 1445 303 5 050 5 145
0
2 000
4 000
6 000
8 000
10 000
2007 2011 2014
HH index
Quota allocation Quotas after trade Actual in quota importsTraded quotas
97%
other quotas3%
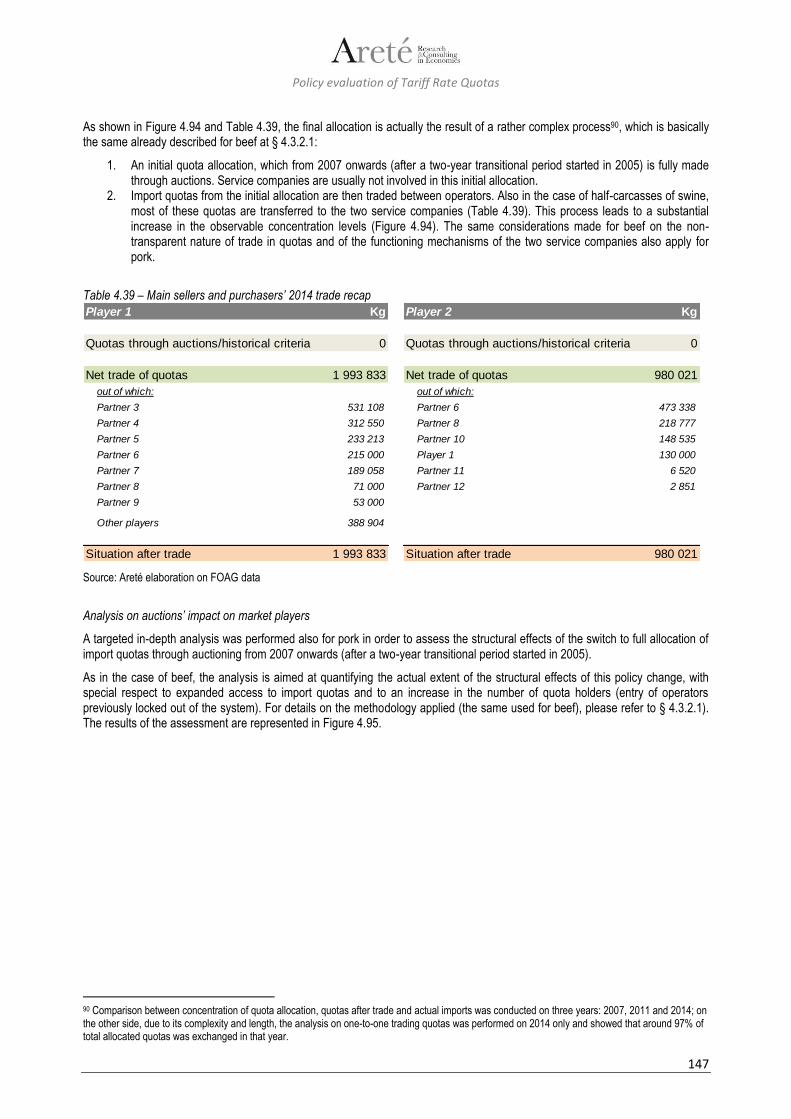
Policy evaluation of Tariff Rate Quotas
147
As shown in Figure 4.94 and Table 4.39, the final allocation is actually the result of a rather complex process90, which is basically the same already described for beef at § 4.3.2.1:
1. An initial quota allocation, which from 2007 onwards (after a two-year transitional period started in 2005) is fully made through auctions. Service companies are usually not involved in this initial allocation.
2. Import quotas from the initial allocation are then traded between operators. Also in the case of half-carcasses of swine, most of these quotas are transferred to the two service companies (Table 4.39). This process leads to a substantial increase in the observable concentration levels (Figure 4.94). The same considerations made for beef on the non-transparent nature of trade in quotas and of the functioning mechanisms of the two service companies also apply for pork.
Table 4.39 – Main sellers and purchasers’ 2014 trade recap
Source: Areté elaboration on FOAG data
Analysis on auctions’ impact on market players
A targeted in-depth analysis was performed also for pork in order to assess the structural effects of the switch to full allocation of import quotas through auctioning from 2007 onwards (after a two-year transitional period started in 2005).
As in the case of beef, the analysis is aimed at quantifying the actual extent of the structural effects of this policy change, with special respect to expanded access to import quotas and to an increase in the number of quota holders (entry of operators previously locked out of the system). For details on the methodology applied (the same used for beef), please refer to § 4.3.2.1). The results of the assessment are represented in Figure 4.95.
90 Comparison between concentration of quota allocation, quotas after trade and actual imports was conducted on three years: 2007, 2011 and 2014; on the other side, due to its complexity and length, the analysis on one-to-one trading quotas was performed on 2014 only and showed that around 97% of total allocated quotas was exchanged in that year.
Player 1 Kg
Quotas through auctions/historical criteria 0
Net trade of quotas 1 993 833
out of which:
Partner 3 531 108
Partner 4 312 550
Partner 5 233 213
Partner 6 215 000
Partner 7 189 058
Partner 8 71 000
Partner 9 53 000
Other players 388 904
Situation after trade 1 993 833
Player 2 Kg
Quotas through auctions/historical criteria 0
Net trade of quotas 980 021
out of which:
Partner 6 473 338
Partner 8 218 777
Partner 10 148 535
Player 1 130 000
Partner 11 6 520
Partner 12 2 851
Situation after trade 980 021

Policy evaluation of Tariff Rate Quotas
148
Figure 4.95 – Evolution of importers’ number: 2001-201491
Source: Areté elaboration on FOAG data
The assessment revealed clear similarities with the beef case, but also some differences.
The effect of the switch to partial auctioning of import quotas in terms of expanded access is again evident in the first year: 5 new operators (net of exits) got access to the quota allocation system, against an average of less than one operator in the precedent four years. Another smaller peak is recognizable in 2007 (the first year in which the auction-based allocation system was fully operational), while in the 2008-2013 period the pace of new entries slowed down again (the “peak” of 2014 should not be considered, in the light of the methodology applied).
Looking at the identities of importers, also in the case of pork it emerged that the two leading importers (the same service companies operating also in beef trade), have systematically managed to get the bulk of auctioned import quotas, just like they used to do in the pre-auctioning period. The distribution of the allocation through auctioning has tended to be slightly less polarised than in the pre-auctioning period, but is anyway highly polarised towards the leading importer in most years.
91 The analysis on weights of pork importing rights of new entrants/exits on total of rights was also performed and it provided very similar results to the analysis made on actual imports.
0
1
2
3
4
5
6
7
2001 2002 2003 2004 2005 2006 2007 2008 2009 2010 2011 2012 2013 2014
Players' evolution: entries and exits - Pork Imports
Entries Exits
1
0 0 0
5
1
3
-2
-3
-1 -1 -1
1
5
2001 2002 2003 2004 2005 2006 2007 2008 2009 2010 2011 2012 2013 2014
New players (net of exits) - Pork Imports
0,0%
1,0%
2,0%
3,0%
4,0%
5,0%
0
50.000
100.000
150.000
200.000
250.000
2001 2002 2003 2004 2005 2006 2007 2008 2009 2010 2011 2012 2013 2014
Kg g
ross
Entries and exits: Pork imports
Entries Exits (quantities imported in the previous year)
Entries' imports - % on total Exits' import - % on total (prev. year)
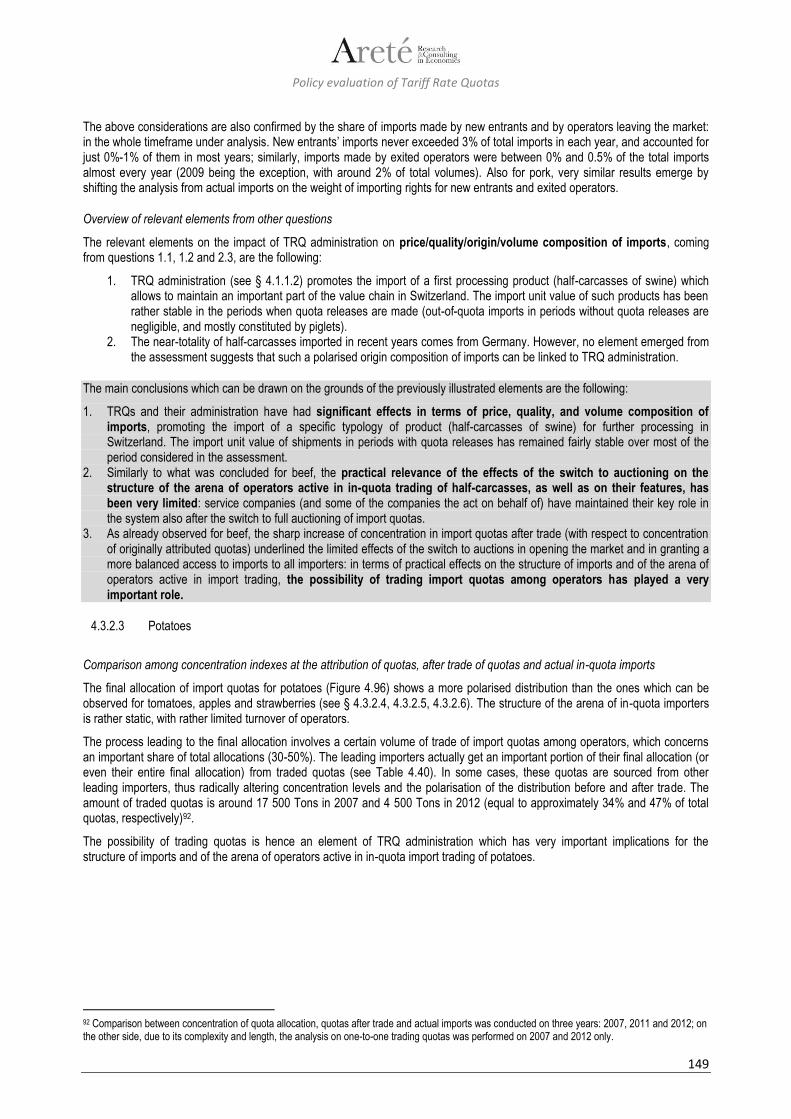
Policy evaluation of Tariff Rate Quotas
149
The above considerations are also confirmed by the share of imports made by new entrants and by operators leaving the market: in the whole timeframe under analysis. New entrants’ imports never exceeded 3% of total imports in each year, and accounted for just 0%-1% of them in most years; similarly, imports made by exited operators were between 0% and 0.5% of the total imports almost every year (2009 being the exception, with around 2% of total volumes). Also for pork, very similar results emerge by shifting the analysis from actual imports on the weight of importing rights for new entrants and exited operators.
Overview of relevant elements from other questions
The relevant elements on the impact of TRQ administration on price/quality/origin/volume composition of imports, coming from questions 1.1, 1.2 and 2.3, are the following:
1. TRQ administration (see § 4.1.1.2) promotes the import of a first processing product (half-carcasses of swine) which allows to maintain an important part of the value chain in Switzerland. The import unit value of such products has been rather stable in the periods when quota releases are made (out-of-quota imports in periods without quota releases are negligible, and mostly constituted by piglets).
2. The near-totality of half-carcasses imported in recent years comes from Germany. However, no element emerged from the assessment suggests that such a polarised origin composition of imports can be linked to TRQ administration.
The main conclusions which can be drawn on the grounds of the previously illustrated elements are the following:
1. TRQs and their administration have had significant effects in terms of price, quality, and volume composition of imports, promoting the import of a specific typology of product (half-carcasses of swine) for further processing in Switzerland. The import unit value of shipments in periods with quota releases has remained fairly stable over most of the period considered in the assessment.
2. Similarly to what was concluded for beef, the practical relevance of the effects of the switch to auctioning on the structure of the arena of operators active in in-quota trading of half-carcasses, as well as on their features, has been very limited: service companies (and some of the companies the act on behalf of) have maintained their key role in the system also after the switch to full auctioning of import quotas.
3. As already observed for beef, the sharp increase of concentration in import quotas after trade (with respect to concentration of originally attributed quotas) underlined the limited effects of the switch to auctions in opening the market and in granting a more balanced access to imports to all importers: in terms of practical effects on the structure of imports and of the arena of operators active in import trading, the possibility of trading import quotas among operators has played a very important role.
4.3.2.3 Potatoes
Comparison among concentration indexes at the attribution of quotas, after trade of quotas and actual in-quota imports
The final allocation of import quotas for potatoes (Figure 4.96) shows a more polarised distribution than the ones which can be observed for tomatoes, apples and strawberries (see § 4.3.2.4, 4.3.2.5, 4.3.2.6). The structure of the arena of in-quota importers is rather static, with rather limited turnover of operators.
The process leading to the final allocation involves a certain volume of trade of import quotas among operators, which concerns an important share of total allocations (30-50%). The leading importers actually get an important portion of their final allocation (or even their entire final allocation) from traded quotas (see Table 4.40). In some cases, these quotas are sourced from other leading importers, thus radically altering concentration levels and the polarisation of the distribution before and after trade. The amount of traded quotas is around 17 500 Tons in 2007 and 4 500 Tons in 2012 (equal to approximately 34% and 47% of total quotas, respectively)92.
The possibility of trading quotas is hence an element of TRQ administration which has very important implications for the structure of imports and of the arena of operators active in in-quota import trading of potatoes.
92 Comparison between concentration of quota allocation, quotas after trade and actual imports was conducted on three years: 2007, 2011 and 2012; on the other side, due to its complexity and length, the analysis on one-to-one trading quotas was performed on 2007 and 2012 only.
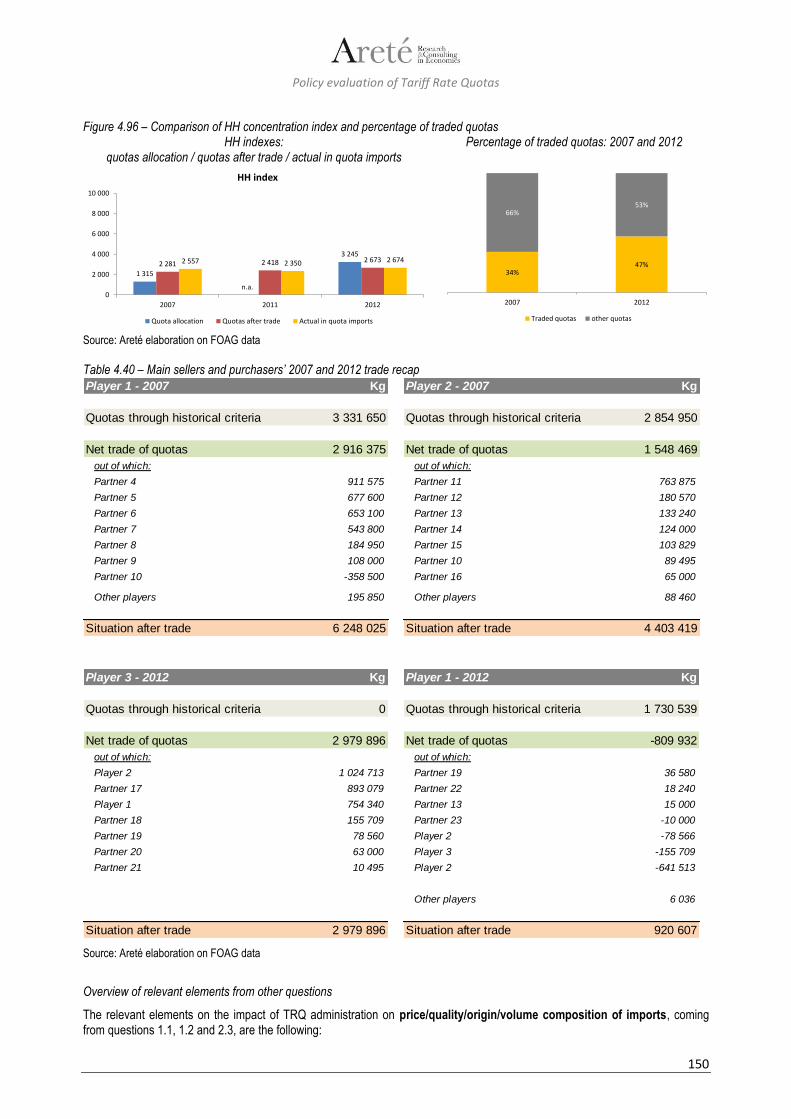
Policy evaluation of Tariff Rate Quotas
150
Figure 4.96 – Comparison of HH concentration index and percentage of traded quotas HH indexes:
quotas allocation / quotas after trade / actual in quota imports Percentage of traded quotas: 2007 and 2012
Source: Areté elaboration on FOAG data
Table 4.40 – Main sellers and purchasers’ 2007 and 2012 trade recap
Source: Areté elaboration on FOAG data
Overview of relevant elements from other questions
The relevant elements on the impact of TRQ administration on price/quality/origin/volume composition of imports, coming from questions 1.1, 1.2 and 2.3, are the following:
1 315
n.a.
3 245
2 281 2 418 2 6732 557 2 350 2 674
0
2 000
4 000
6 000
8 000
10 000
2007 2011 2012
HH index
Quota allocation Quotas after trade Actual in quota imports
34%47%
66%53%
2007 2012
Traded quotas other quotas
Player 1 - 2007 Kg
Quotas through historical criteria 3 331 650
Net trade of quotas 2 916 375
out of which:
Partner 4 911 575
Partner 5 677 600
Partner 6 653 100
Partner 7 543 800
Partner 8 184 950
Partner 9 108 000
Partner 10 -358 500
Other players 195 850
Situation after trade 6 248 025
Player 2 - 2007 Kg
Quotas through historical criteria 2 854 950
Net trade of quotas 1 548 469
out of which:
Partner 11 763 875
Partner 12 180 570
Partner 13 133 240
Partner 14 124 000
Partner 15 103 829
Partner 10 89 495
Partner 16 65 000
Other players 88 460
Situation after trade 4 403 419
Player 3 - 2012 Kg
Quotas through historical criteria 0
Net trade of quotas 2 979 896
out of which:
Player 2 1 024 713
Partner 17 893 079
Player 1 754 340
Partner 18 155 709
Partner 19 78 560
Partner 20 63 000
Partner 21 10 495
Situation after trade 2 979 896
Player 1 - 2012 Kg
Quotas through historical criteria 1 730 539
Net trade of quotas -809 932
out of which:
Partner 19 36 580
Partner 22 18 240
Partner 13 15 000
Partner 23 -10 000
Player 2 -78 566
Player 3 -155 709
Player 2 -641 513
Other players 6 036
Situation after trade 920 607

Policy evaluation of Tariff Rate Quotas
151
1. The import unit value of table potatoes in the periods when quota releases are made (out-of-quota imports in periods without quota releases are non-negligible, but relatively limited) has been rather stable during the period considered for the assessment (around 1 CHF/kg).
2. Most of the in-quota imports of table potatoes in recent years comes from Israel and refer to early potatoes imported for quality reasons. However, as the only country-specific quota allocations for table potatoes concern Tunisia (this quota is usually not filled) and Egypt (this quota has not been used at all in recent years), it can be concluded that this polarisation in the origin distribution of imports cannot be related to TRQ administration.
The main conclusions which can be drawn on the grounds of the previously illustrated elements are the following:
1. TRQs and their administration have had significant effects especially in terms of price composition of imports: since the only actual imports refer to early potatoes in spring (whose price is relatively stable across the years), the import unit value of shipments in periods with quota releases has remained fairly stable over most of the period considered in the assessment.
2. The feature of the TRQ administration system which was found to have the most important implications on the structure of imports of table potatoes and of the arena of operators active in import trading is the possibility of trading import quotas between operators: this practice was found to concern substantial volumes, and when applied by leading importers can radically change concentration levels and the polarisation of the distribution of import quotas.
4.3.2.4 Tomatoes
Comparison among concentration indexes at the attribution of quotas, after trade of quotas and actual in-quota imports
The final allocation of import quotas for tomatoes (Figure 4.97) shows a less polarised distribution than the ones which can be observed for potatoes, apples and strawberries (see § 4.3.2.3, 4.3.2.5, 4.3.2.6). The arena of operators importing in quota is rather dynamic, with turnovers concerning also the top positions in the ranking.
The process leading to the final allocation involves a certain volume of trade of import quotas among operators, which concerns a significant share of total allocations (30-35%). For tomatoes, apples and strawberries, import quotas are traded in two rounds: usually the first round of trade (in % on the assigned quotas) concerns net purchases of quotas by big players from medium-small ones; the second round of trade (in kg) goes in the opposite direction. As already observed for potatoes at § 4.3.2.3, leading importers actually get an important portion of their final allocation (or even the most part of it) from traded quotas (see Table 4.41). In some cases, these quotas are sourced from other leading importers, thus radically altering concentration levels and the polarisation of the distribution before and after trade. Percentages of traded quotas reported in Figure 4.97 refer to a situation where both trade in % (in the first round) and trade in kg (second round) have taken place, which actually underestimates the overall volume of traded licenses (licences are often traded more than once, back and forth); the amount of traded quotas is around 900 Tons in 2010 and 200 Tons in 2014 (equal to approximately 30% and 34% of total quotas, respectively)93.
Also for tomatoes, the possibility of trading quotas emerged as an element of TRQ administration, which has very important implications for the structure of imports and of the arena of operators active in in-quota import trading.
Figure 4.97 – Comparison of HH concentration index and percentage of traded quotas HH indexes:
quotas allocation / quotas after trade / actual in quota imports Percentage of traded quotas: 2010 and 2014
Source: Areté elaboration on FOAG data Percentages only reflect the net trade, not considering the double sense of trade between first (in %) and second (in Kgs) round.
93 Comparison between concentration of quota allocation, quotas after trade and actual imports was conducted on four years: 2007, 2010, 2011 and 2014; on the other side, due to its complexity and length, the analysis on one-to-one trading quotas was performed on 2010 and 2014 only.
491943 878 609368
1 6121 184 1 150
486
1 8071 313 1 670
0
2 000
4 000
6 000
8 000
10 000
2007 2010 2011 2014
HH index
Quota allocation Quotas after trade Actual in quota imports
30% 34%
70% 66%
2010 2014
Traded quotas other quotas

Policy evaluation of Tariff Rate Quotas
152
Table 4.41 – Main sellers and purchasers’ 2010 and 2014 trade recap
Source: Areté elaboration on FOAG data
Overview of relevant elements from other questions
The relevant elements on the impact of TRQ administration on price/quality/origin/volume composition of imports, coming from questions 1.1, 1.2 and 2.3, are the following:
1. No significant effects of TRQ administration in terms of quality/volume composition emerged from the assessment94. 2. The import unit value of tomatoes tends to peak in the managed periods, when quota releases are made: this clearly
derives from the stricter import regulation provided by TRQ administration in those periods (most of these peaks in
94 Elements from interviews hinted at the switch to a single group including beef tomatoes, round tomatoes and tomatoes on the vine in FOAG classification as having some implications for the composition of imports and also for prices, as operators still tend to refer to the previous classification system.
Player 1 - 2010 Kg
Quotas through historical criteria 639 888
Net trade of quotas - I round (% trade) 302 142
out of which:
Partner 3 56 683
Partner 4 53 534
Partner 5 53 534
Partner 6 34 640
Partner 7 18 894
Partner 8 12 596
Partner 9 12 596
Other players 59 665
Net trade of quotas - II round (Kg trade) -21 976
out of which:
Parner 10 -21 976
Situation after trade 920 054
Player 2 - 2010 Kg
Quotas through historical criteria 581 945
Net trade of quotas - I round (% trade) 195 475
out of which:
Partner 6 62 981
Partner 3 53 534
Partner 17 34 640
Partner 18 18 894
Partner 19 12 596
Partner 20 12 596
Other players 233
Net trade of quotas - II round (Kg trade) -200
out of which:
Parner 10 -200
Situation after trade 777 220
Player 1 - 2014 Kg
Quotas through historical criteria 102 170
Net trade of quotas - I round (% trade) 70 210
out of which:
Partner 3 10 319
Partner 11 9 179
Partner 4 7 919
Partner 12 6 239
Partner 13 4 860
Partner 5 4 740
Partner 14 3 540
Other players 23 415
Net trade of quotas - II round (Kg trade) -11 207
out of which:
Partner 11 -5 000
Partner 15 -3 657
Partner 16 -3 000
Other players 450
Situation after trade 161 173
Player 2 - 2014 Kg
Quotas through historical criteria 43 376
Net trade of quotas - I round (% trade) 74 284
out of which:
Partner 13 13 679
Partner 3 12 839
Partner 21 12 779
Partner 12 11 999
Partner 22 5 699
Partner 17 4 380
Partner 23 3 180
Other players 9 731
Net trade of quotas - II round (Kg trade) -8 900
out of which:
Partner 24 -8 900
Situation after trade 108 760
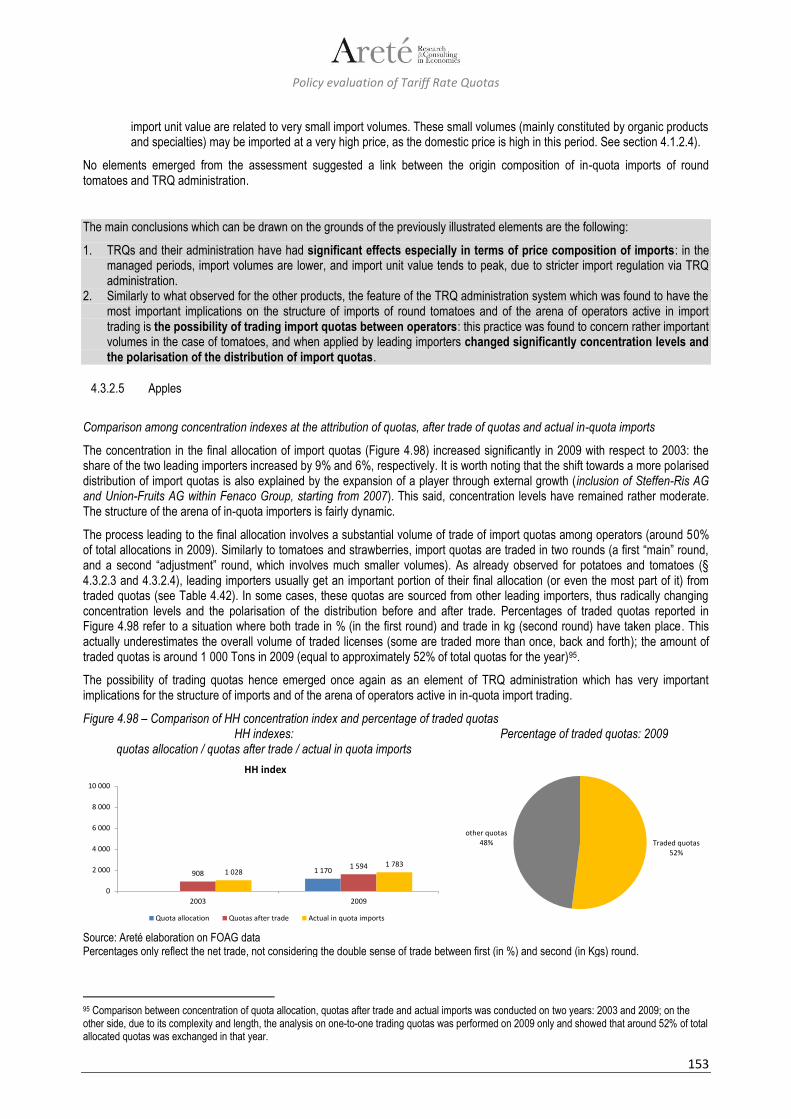
Policy evaluation of Tariff Rate Quotas
153
import unit value are related to very small import volumes. These small volumes (mainly constituted by organic products and specialties) may be imported at a very high price, as the domestic price is high in this period. See section 4.1.2.4).
No elements emerged from the assessment suggested a link between the origin composition of in-quota imports of round tomatoes and TRQ administration.
The main conclusions which can be drawn on the grounds of the previously illustrated elements are the following:
1. TRQs and their administration have had significant effects especially in terms of price composition of imports: in the managed periods, import volumes are lower, and import unit value tends to peak, due to stricter import regulation via TRQ administration.
2. Similarly to what observed for the other products, the feature of the TRQ administration system which was found to have the most important implications on the structure of imports of round tomatoes and of the arena of operators active in import trading is the possibility of trading import quotas between operators: this practice was found to concern rather important volumes in the case of tomatoes, and when applied by leading importers changed significantly concentration levels and the polarisation of the distribution of import quotas.
4.3.2.5 Apples
Comparison among concentration indexes at the attribution of quotas, after trade of quotas and actual in-quota imports
The concentration in the final allocation of import quotas (Figure 4.98) increased significantly in 2009 with respect to 2003: the share of the two leading importers increased by 9% and 6%, respectively. It is worth noting that the shift towards a more polarised distribution of import quotas is also explained by the expansion of a player through external growth (inclusion of Steffen-Ris AG and Union-Fruits AG within Fenaco Group, starting from 2007). This said, concentration levels have remained rather moderate. The structure of the arena of in-quota importers is fairly dynamic.
The process leading to the final allocation involves a substantial volume of trade of import quotas among operators (around 50% of total allocations in 2009). Similarly to tomatoes and strawberries, import quotas are traded in two rounds (a first “main” round, and a second “adjustment” round, which involves much smaller volumes). As already observed for potatoes and tomatoes (§ 4.3.2.3 and 4.3.2.4), leading importers usually get an important portion of their final allocation (or even the most part of it) from traded quotas (see Table 4.42). In some cases, these quotas are sourced from other leading importers, thus radically changing concentration levels and the polarisation of the distribution before and after trade. Percentages of traded quotas reported in Figure 4.98 refer to a situation where both trade in % (in the first round) and trade in kg (second round) have taken place. This actually underestimates the overall volume of traded licenses (some are traded more than once, back and forth); the amount of traded quotas is around 1 000 Tons in 2009 (equal to approximately 52% of total quotas for the year)95.
The possibility of trading quotas hence emerged once again as an element of TRQ administration which has very important implications for the structure of imports and of the arena of operators active in in-quota import trading.
Figure 4.98 – Comparison of HH concentration index and percentage of traded quotas HH indexes:
quotas allocation / quotas after trade / actual in quota imports Percentage of traded quotas: 2009
Source: Areté elaboration on FOAG data Percentages only reflect the net trade, not considering the double sense of trade between first (in %) and second (in Kgs) round.
95 Comparison between concentration of quota allocation, quotas after trade and actual imports was conducted on two years: 2003 and 2009; on the other side, due to its complexity and length, the analysis on one-to-one trading quotas was performed on 2009 only and showed that around 52% of total allocated quotas was exchanged in that year.
1 1709081 594
1 0281 783
0
2 000
4 000
6 000
8 000
10 000
2003 2009
HH index
Quota allocation Quotas after trade Actual in quota imports
Traded quotas52%
other quotas48%
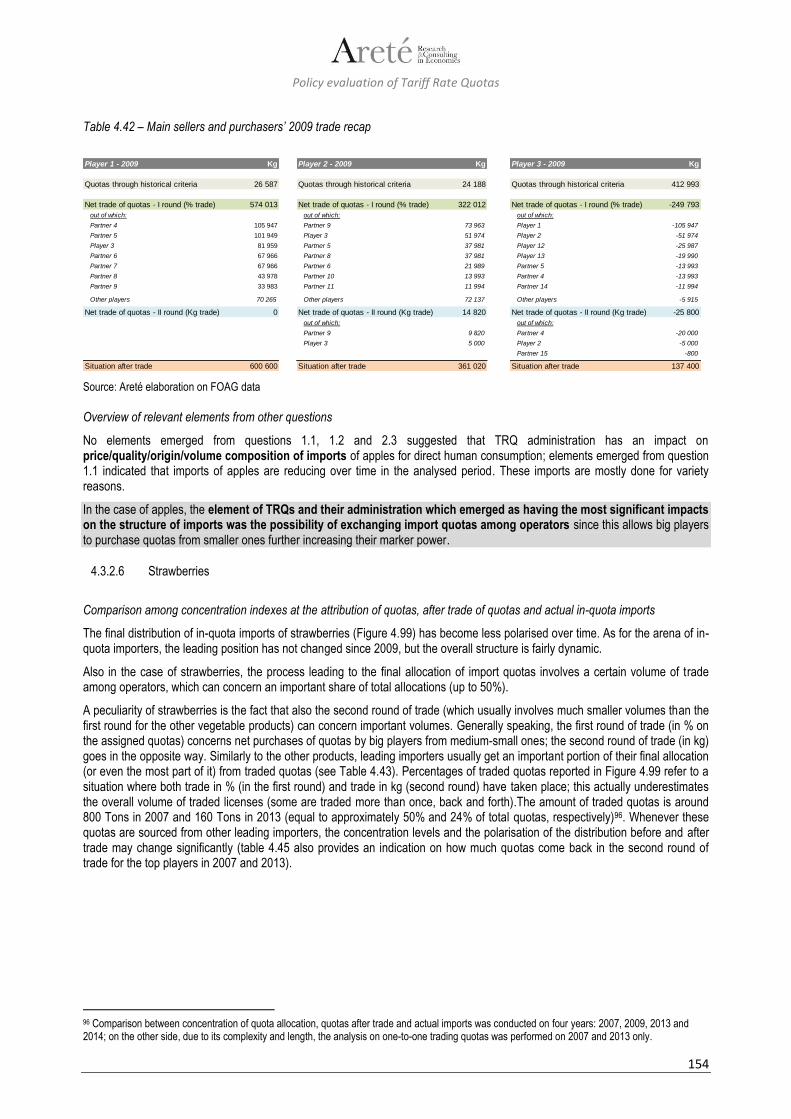
Policy evaluation of Tariff Rate Quotas
154
Table 4.42 – Main sellers and purchasers’ 2009 trade recap
Source: Areté elaboration on FOAG data
Overview of relevant elements from other questions
No elements emerged from questions 1.1, 1.2 and 2.3 suggested that TRQ administration has an impact on price/quality/origin/volume composition of imports of apples for direct human consumption; elements emerged from question 1.1 indicated that imports of apples are reducing over time in the analysed period. These imports are mostly done for variety reasons.
In the case of apples, the element of TRQs and their administration which emerged as having the most significant impacts on the structure of imports was the possibility of exchanging import quotas among operators since this allows big players to purchase quotas from smaller ones further increasing their marker power.
4.3.2.6 Strawberries
Comparison among concentration indexes at the attribution of quotas, after trade of quotas and actual in-quota imports
The final distribution of in-quota imports of strawberries (Figure 4.99) has become less polarised over time. As for the arena of in-quota importers, the leading position has not changed since 2009, but the overall structure is fairly dynamic.
Also in the case of strawberries, the process leading to the final allocation of import quotas involves a certain volume of trade among operators, which can concern an important share of total allocations (up to 50%).
A peculiarity of strawberries is the fact that also the second round of trade (which usually involves much smaller volumes than the first round for the other vegetable products) can concern important volumes. Generally speaking, the first round of trade (in % on the assigned quotas) concerns net purchases of quotas by big players from medium-small ones; the second round of trade (in kg) goes in the opposite way. Similarly to the other products, leading importers usually get an important portion of their final allocation (or even the most part of it) from traded quotas (see Table 4.43). Percentages of traded quotas reported in Figure 4.99 refer to a situation where both trade in % (in the first round) and trade in kg (second round) have taken place; this actually underestimates the overall volume of traded licenses (some are traded more than once, back and forth).The amount of traded quotas is around 800 Tons in 2007 and 160 Tons in 2013 (equal to approximately 50% and 24% of total quotas, respectively)96. Whenever these quotas are sourced from other leading importers, the concentration levels and the polarisation of the distribution before and after trade may change significantly (table 4.45 also provides an indication on how much quotas come back in the second round of trade for the top players in 2007 and 2013).
96 Comparison between concentration of quota allocation, quotas after trade and actual imports was conducted on four years: 2007, 2009, 2013 and 2014; on the other side, due to its complexity and length, the analysis on one-to-one trading quotas was performed on 2007 and 2013 only.
Player 1 - 2009 Kg
Quotas through historical criteria 26 587
Net trade of quotas - I round (% trade) 574 013
out of which:
Partner 4 105 947
Partner 5 101 949
Player 3 81 959
Partner 6 67 966
Partner 7 67 966
Partner 8 43 978
Partner 9 33 983
Other players 70 265
Net trade of quotas - II round (Kg trade) 0
Situation after trade 600 600
Player 2 - 2009 Kg
Quotas through historical criteria 24 188
Net trade of quotas - I round (% trade) 322 012
out of which:
Partner 9 73 963
Player 3 51 974
Partner 5 37 981
Partner 8 37 981
Partner 6 21 989
Partner 10 13 993
Partner 11 11 994
Other players 72 137
Net trade of quotas - II round (Kg trade) 14 820
out of which:
Partner 9 9 820
Player 3 5 000
Situation after trade 361 020
Player 3 - 2009 Kg
Quotas through historical criteria 412 993
Net trade of quotas - I round (% trade) -249 793
out of which:
Player 1 -105 947
Player 2 -51 974
Player 12 -25 987
Player 13 -19 990
Partner 5 -13 993
Partner 4 -13 993
Partner 14 -11 994
Other players -5 915
Net trade of quotas - II round (Kg trade) -25 800
out of which:
Partner 4 -20 000
Player 2 -5 000
Partner 15 -800
Situation after trade 137 400

Policy evaluation of Tariff Rate Quotas
155
Figure 4.99 – Comparison of HH concentration index and percentage of traded quotas HH indexes:
quotas allocation / quotas after trade / actual in quota imports Percentage of traded quotas: 2007 and 2013
Source: Areté elaboration on FOAG data Percentages only reflect the net trade, not considering the double sense of trade between first (in %) and second (in Kgs) round.
Table 4.43 – Main sellers and purchasers’ 2007 and 2013 trade recap
Source: Areté elaboration on FOAG data
Once again, the possibility of trading quotas emerged as an element of TRQ administration with very important implications for the structure of imports and of the arena of operators active in in-quota import trading.
Overview of relevant elements from other questions
The relevant elements on the impact of TRQ administration on price/quality/origin/volume composition of imports, coming from questions 1.1, 1.2 and 2.3, are the following:
1. The import unit value of strawberries tends to peak in the managed periods, when quota releases are made: this clearly derives from the stricter import regulation provided by TRQ administration in those periods (most of these peaks in import unit value are related to very small import volumes. These small volumes (mainly constituted by organic products and specialties) may be imported at a very high price, as the domestic price is high in this period. See section 4.1.2.6).
1 1111 879 1 764 1 768
1 0271 807 1 578 1 568
2 8212 423 2 220
1 802
0
2 000
4 000
6 000
8 000
10 000
2007 2009 2013 2014
HH index
Quota allocation Quotas after trade Actual in quota imports
50%
24%
50%
76%
2007 2013
Traded quotas other quotas
Player 1 - 2007 Kg
Quotas through historical criteria 28 750
Net trade of quotas - I round (% trade) 337 100
out of which:
Player 24 105 906
Player 4 94 394
Player 3 63 313
Partner 5 29 930
Partner 6 10 360
Partner 7 6 907
Partner 8 6 907
Other Partners 19 383
Net trade of quotas - II round (Kg trade) -342 700
out of which:
Player 3 -183 200
Partner 9 -54 300
Player 10 -32 050
Player 11 -30 250
Other Partners -42 900
Situation after trade 23 150
Player 2 - 2007 Kg
Quotas through historical criteria 179 400
Net trade of quotas - I round (% trade) 64 550
out of which:
Partner 5 63 313
Player 12 1 151
Other Partners 86
Net trade of quotas - II round (Kg trade) -159 150
out of which:
Player 3 -157 850
Situation after trade 84 800
Player 3 - 2007 Kg
Quotas through historical criteria 208 150
Net trade of quotas - I round (% trade) -64 400
out of which:
Player 1 -26 476
Player 2 -25 325
Player 13 -1 151
Other Partners -11 447
Net trade of quotas - II round (Kg trade) 354 150
out of which:
Player 1 183 200
Player 2 157 850
Player 14 3 800
Player 4 3 200
Other Partners 6 100
Situation after trade 497 900
Player 4 - 2007 Kg
Quotas through historical criteria 184 000
Net trade of quotas - I round (% trade) -110 300
out of which:
Player 1 -94 394
Partner 7 -6 907
Partner 6 -5 756
Player 15 -4 605
Player 16 -1 151
Partner 9 2 302
Other Partners 210
Net trade of quotas - II round (Kg trade) -23 950
out of which:
Player 17 -15 700
Player 18 -9 900
Player 3 -3 200
Player 1 4 150
Other Partners 700
Situation after trade 49 750
Player 1 - 2013 Kg
Quotas through historical criteria 203 737
Net trade of quotas - I round (% trade) 12 164
out of which:
Partner 5 6 209
Player 19 2 829
Player 10 2 346
Other Partners 781
Net trade of quotas - II round (Kg trade) -1 000
out of which:
Player 11 -1 000
Situation after trade 214 901
Player 2 - 2013 Kg
Quotas through historical criteria 183 522
Net trade of quotas - I round (% trade) -113 722
out of which:
Player 5 -99 580
Player 3 -13 660
Other Partners -482
Net trade of quotas - II round (Kg trade) 0
Situation after trade 69 800
Player 5 - 2013 Kg
Quotas through historical criteria 23 251
Net trade of quotas - I round (% trade) -8 347
out of which:
Player 15 -1 794
Player 21 -1 794
Player 22 -1 035
Partner 6 -897
Other Partners -2 827
Net trade of quotas - II round (Kg trade) 108 932
out of which:
Player 2 99 580
Player 15 5 115
Player 23 1 830
Partner 6 1 725
Other Partners 682
Situation after trade 123 836
Policy evaluation of Tariff Rate Quotas
156
2. In-quota imports of strawberries mainly come from EU countries. Surely logistics are an obvious explanation for such origin composition, but it is worth noting that also the setting of a preferential quota of 200 tons for strawberry imports from EU member states (No. 141, see SR 632.421.0) during the managed period is likely to play a role in this respect.
The main conclusions which can be drawn on the grounds of the previously illustrated elements are the following:
1. TRQs and their administration have had significant effects especially in terms of price composition of imports: in the managed periods, import volumes are lower, and the import unit value tends to peak, due to stricter import regulation via TRQ administration. Also the setting of a preferential quota of 200 tons for strawberry imports from EU countries has had implications in terms of origin composition of imports.
2. Also for strawberries, the element of TRQ administration which emerged as having the most significant impacts on the structure of imports was the possibility of exchanging import quotas among operators since it allows big players to further increase their shares in import quotas.
4.3.3 Reply to Q 3.3: impact of market structure on rent distribution
Does the Swiss market structure (not perfect competition) influence the distribution of costs, benefits, rents?
Replies to question 3.3 are mainly based on the findings of the analysis performed in the context of previous questions (in particular questions 1.2, 2.1, 2.3, 3.1 and 3.2); some elements presented in previous sections will therefore be recalled to provide elements on the relationship between the market structure for different products and the observed and/or presumed distribution of costs, benefits and rents along the different supply chains.
4.3.3.1 Beef
Asymmetrical price transmission
Results emerging from the analysis on asymmetrical price transmission for beef (§ 4.1.2.1) show that domestic producer prices are asymmetrically transmitted from the production stage to the retail stage of the supply chain; more specifically, an increase in the Swiss producer price results to be transmitted to the consumer level “better” than a decrease.
Price differentials
The analysis presented in § 4.2.1.1 pointed out to the presence of wide price gaps between Swiss prices and German and French prices, especially at wholesale and retail levels, with Swiss prices always being above the foreign ones; in addition the same analysis showed increasing gaps over time for prices at consumer and wholesale level while price gap at producer level remained stable over the analysed period.
Market structure and trade of quotas
The analysis presented at § 4.3.1.1 on the beef market structure and on the concentration of importers, and at § 4.3.2.1 on the trade of quotas, indicated a very high level of concentration and a substantial trade of import quotas. To this element it should be added the specific role played by service companies in the management of imports on behalf of Swiss traders, and the resulting lack of transparency on the final beneficiary of quotas. Finally, the combined market share of the two leading retailers (Figure 4.66) is of central importance to appreciate the double influence exerted by these players:
1. On one hand, the two top retailers are vertically integrated and play a central role also in import trading. 2. On the other hand the same retailers have combined market shares of over 70% for beef, basically controlling the
vast majority of the retail market and reducing the possibility to place products on the market bypassing them.
Considering all the elements coming from the replies to previous study questions, it can be concluded that:
1. TRQs contribute to maintain higher prices for Switzerland with respect to other countries, especially at wholesale and retail level.
2. The observed asymmetric price transmission reflects a distribution of benefits and rents deriving from TRQs which well reflects the different dimensions of players operating at different stages of the supply chain.
The two elements above point out to a direct impact of market structure in the distribution of rents and benefits from the TRQs system, with large vertically integrated retailers playing a central role at different stages of the supply chain and being the natural recipient of these rents thanks to their favourable position.
Policy evaluation of Tariff Rate Quotas
157
4.3.3.2 Pork
Asymmetrical price transmission
The results of the analysis on asymmetrical price transmission for pork (§ 4.1.2.2) shows that domestic producer prices are asymmetrically transmitted from the production stage to the retail stage of the supply chain in a way similar to that described for beef.
Price differentials
The analysis presented in § 4.2.1.2 showed price gaps between Swiss prices and German prices at all levels of the supply chain, with Swiss prices always above the German ones.
Market structure and trade of quotas
The analysis presented at § 4.3.1.2 on the pork market structure and on the concentration of imports, and at § 4.3.2.2 on the trade of quotas, indicated very similar results to those presented in the previous § 4.3.3.1 for beef. The same findings are therefore valid also for pork.
Elements deriving from the other study questions converge on the indication of an influence of the market structure in the distribution of benefits and rents from TRQs, with large vertically integrated retailers being a well-positioned party to take the largest part of these surpluses.
4.3.3.3 Potatoes
Price differentials
The analysis presented at § 4.2.1.3 showed gaps between Swiss prices and German and French prices, with Swiss prices almost always above the foreign ones (with only very few exceptions for the wholesale price).
Traded quotas and impact on adequate provision
The ad-hoc analysis presented in § 4.2.3.3 provided useful elements to detect the risk of market rationing – at least in some cases – for table potatoes.
Market structure and trade of quotas
The analysis presented at § 4.3.1.3 on the potato market structure and on the concentration of imports, and at § 4.3.2.3 on the trade of import quotas, indicated an overall high concentration of imports and, once again, very high combined shares for the two leading retailers in the market of table potatoes (Figure 4.75).
A number of elements from other study questions converge on the indication of an influence of the market structure in the distribution of benefits and rents of TRQs, with the leading retailers being well-positioned to take the largest part of these surpluses. In addition, specific behaviours adopted by some vertically integrated retailers indicate precise corporate strategies to maximise these rents and the possibility to get the largest part of them through market rationing.
4.3.3.4 Tomatoes
Price differentials
The analysis presented in § 4.2.1.4 showed differentials between Swiss prices and Italian and French prices, with Swiss prices almost always above the foreign ones (with only very few exceptions for the wholesale price).
Traded quotas and impact on adequate provision
The ad-hoc analysis presented in § 4.2.3.4 provided useful elements to detect the risk of market rationing in more than one year for tomatoes.
Market structure and trade of quotas
The analysis presented at § 4.3.1.4 on the tomato market structure and on the concentration of imports, and at § 4.3.2.4 on the trade of import quotas, indicated a medium concentration of imports and a very high combined share for the two leading retailers on the tomato market (Figure 4.80).
Policy evaluation of Tariff Rate Quotas
158
Elements deriving from previous analysis converge on the indication of an influence of the market structure in the distribution of benefits and rents of TRQs, with the leading retailers being in the best position to take the largest part of these surpluses. In addition, specific conducts adopted in more than one year by the same players indicate precise corporate strategies to maximise these rents and the possibility to get the largest part of them through market rationing.
4.3.3.5 Apples
Price differentials
The analysis presented in § 4.2.1.5 showed gaps between Swiss prices and German and French prices, with Swiss prices often above the foreign ones (with exceptions for the wholesale price).
Market structure and trade of quotas
The analysis presented at § 4.3.1.5 on the apple market structure and on the concentration of imports, and at § 4.3.2.5 on the trade of import quotas, indicated an overall moderate concentration of imports and very high combined market shares for the two leading retailers (Figure 4.85).
Elements deriving from other study questions converge on the indication of an influence of the market structure in the distribution of benefits and rents of TRQs, with the leading retailers being well-positioned to take the largest part of these surpluses.
4.3.3.6 Strawberries
Price differentials
Also in the case of strawberries, the analysis presented in § 4.2.1.6 showed differentials between Swiss prices and Italian prices, with Swiss prices almost always above the external ones.
Market structure and trade of quotas
The analysis presented at § 4.3.1.6 on the strawberry market structure and on the concentration of imports, and at § 4.3.2.6 on the trade of quotas, indicated an overall moderate concentration of imports and very high combined shares for the two leading retailers (Figure 4.90).
Elements deriving from previous analysis converge on the indication of an influence of the market structure in the distribution of benefits and rents of TRQs, with the leading retailers being – once again – in the best position to capture most of these surpluses.
4.3.4 Reply to Q 3.4: impact of TRQs on market structure
What is the impact of TRQs on the development of the market structure of the food chain / on the vertical chain of production? Do they promote the formation of non-competitive market structures? To which extent?
The main elements for replying to question 3.4 are presented in the previous sections and in particular are strictly similar to those reported in § 4.3.3 for the reply to question 3.3. In this context, findings of question 3.3 can be considered valid also for an indication of the impact of TRQs in the development of specific market structures.
Although an univocal definition of non-competitive market structure is not available, in the present situation it is reasonable to identify these structures with those limiting competition and restricting the market dynamism. The market structures analysed in the previous sections present similar features, in particular:
1. Different degrees of concentration at different stages of the supply chain, as observed across all the six products under analysis especially with reference to the concentration at retailing stage in comparison with that at wholesale and (even more) producer one.
2. Vertically integrated companies operating at specific stages of the supply chain, as observed across all the six products under analysis with reference to vertically integrated retailers, covering also the processing, trading and import phases. On the opposite, very few examples of vertical integration at other stages of the supply chain have been detected in the course of the analysis (see also Tables 4.20, 4.23, 4.26, 4.29, 4.32 and 4.35).

Policy evaluation of Tariff Rate Quotas
159
3. Presence, in particular in the meat sector, of service companies collecting import quotas among their shareholders and other importers and centralising import activities. These entities obviously may play an important role, especially for medium-sized importers, in reducing the administrative burden and transaction costs; on the other side, their presence represents an obstacle to the transparency of the market.
The above elements should be analysed together with the Swiss TRQ administration system, which formally encourages exchange and cooperation among players within the concerned sectors, in the framework of a basically self-regulated mechanism. This kind of background almost certainly fosters more or less formalised alliances and partnerships, thus influencing the overall structure of the market and reinforcing the pre-existing situation of concentration of market power at intermediate and lower stages of the food chain.
4.3.5 Reply to Q 4: proposed changes to improve efficacy and efficiency of existing TRQs system
In light of the answers provided under Q1 – Q3, which changes could be proposed in the existing TRQs system to improve its efficacy and efficiency?
Question 4 explicitly refers to potential changes in the existing TRQs system to improve its efficacy and efficiency; in this context, it is worth noting that while the study highlighted a general good level of efficacy of the system – albeit with some areas of concern – the assessment of the efficiency of the system revealed serious limits.
The changes proposed below, elaborated also taking into account the results of the investigation on the use of TRQs in other countries, are of a technical nature within the given structure of the Swiss TRQ system or address research issues. They may result only in minor improvements of the overall efficiency. They can be enlisted as follows:
1. In the light of the complexity of the TRQ system and of its administration, in-depth and more targeted investigations aimed at exploring the potential for, and the possible implications of, a simplification of the TRQ system, of its administration or at least of the most complex aspects of it would be advisable, also with a view to improving the transparency of the system for non-professional operators and/or the general public.
2. The very limited amount of imports at the out-of-quota duty for all the products under analysis suggests that the levels of the out-of-quota tariff are particularly high. An in-depth, more targeted data collection and investigation aimed at quantifying with precision how over-protective the out-of-quota tariffs are would be advisable, as it would allow to assess the potential for a reduction in their level to stimulate the search for greater efficiency within the concerned supply chains, by keeping the support to the Swiss farmers.
3. The possibility of trading import quotas among operators emerged as an element of TRQ administration impacting the structure of imports and of the arena of operators active in import trading, with potential threats of market rationing arising whenever accumulation of import quotas by leading operators is combined with low utilization of these quotas. In-depth and more targeted investigations aimed at assessing the pros and cons of possible solutions for addressing such conduct (for instance, an obligation to fully utilize any acquired import quotas) would therefore be advisable.
4. Finally, always with a view to improving the transparency of the functioning of the TRQ system to the benefit of non-professional operators and/or of the general public, the possibility of disclosing information collected by FOAG on certain aspects of TRQ administration which emerged as having important implications for various aspects considered in the assessment (e.g. trade of import quotas among operators) should be considered.
These changes to the existing structure would not tackle the most serious limitations to the efficiency of the Swiss TRQ system as a whole, since they are intrinsic to its current structure; if more substantial improvements of the system’s efficiency are to be reached, more profound changes should be considered.

Policy evaluation of Tariff Rate Quotas
160
5 Investigation on the use of TRQs in other countries and comparison with the Swiss case
In this chapter, an additional investigation on the use of TRQs in other countries is made. This basically aims at elaborating an overview of notable examples of application of TRQs for such products, in order to allow for a qualitative comparative analysis. The investigation was entirely based on desk analysis; for this reason, the level of detail of analysed features as well as the number of aspects analysed for the different countries are limited by the amount and quality of publicly available information. In particular, information on the concrete implementation of TRQs administration is often lacking; even for those countries where more disclosure is provided, information is basically never comparable with the level of detail available for Switzerland in the framework of the present study, thus limiting the possibility to perform comparisons other than the very general one provided in the following paragraphs. The cases that will be presented show a wide array of options used for the administration of TRQs.
The present investigation on TRQs systems for meat products in countries other than Switzerland concentrates on beef rather than on pork basically since more notable examples are available for a comparative analysis.
TRQ administration systems vary depending on the country; this study focused on the notable examples listed below, in order to cover the widest range of administration systems.
5.1 Overview of notable examples of application of TRQs for beef
At first glance, the different administration systems considered for this investigation present some specific features which deeply differentiate them from the Swiss one.
In Canada, TRQ administration for beef is based on a license on demand mechanisms: it is sufficient for an importer to present request to the Department of Foreign Affairs, proven that it has a specific import permit issued by the Minister of International Trade. In the Canadian system specific provisions exist aimed at ensuring an orderly transition between quota years and at facilitating the turnover of importers. Generally speaking, holders cannot obtain more than 30% of their previous year’s import allocation if other market players request for quota shares97.
The system in place in the United States is based on quota allocation on the basis of the eligible countries of origin; in this context several different subgroups exist, the most relevant being NAFTA countries (Canada and Mexico) with no limit set, Country-specific TRQs (Australia, Japan, New Zealand, Uruguay and Argentina) whose tariff-rate quotas are set on a yearly basis, and other eligible countries without a country-specific quota. An important element of the US system is the non-administered allocation of quotas for US importers: once a partner country has its tariff rate quota set, it also has the freedom to allocate it among its exporters according to the preferred system. Taking Australia – the leading exporter of beef to the US for 2014 and 2015 – as an example, it allocates tariff rate quotas on a first-come, first-served basis for the first 85% of the batch and the remaining 15% on a historical quota used basis98. The Other Countries TRQ is offered on a first-come, first-served basis to the eligible countries. These mechanisms result in a market-based situation for US importers, whose chances to import depends on their relationships and efficiency towards commercial foreign partners.
For what concerns the setting of in-quota tariff under minimum access, the system in the European Union can be considered very transparent (with respect to other WTO countries where it seems more difficult to reconstruct how the various in quota tariffs are defined); on the other side, the size and the product definition for the current access reflects historical agreements and bilateral settlements of earlier disputes and therefore is less clear. The EU defines lists of countries which have access to quotas for specific products and – for the quota allocation to European importers – it adopts a combination of licenses on demand, historical imports and first-come, first-served approaches (this latter not used for beef), on the basis of the different product categories. In the specific case, TRQs for beef are managed through a double approach: 80% of the quotas are attributed according to historical imports, and the remaining 20% to newcomers, with the objective to prevent rigidities in the market99.
Iceland’s TRQ administration system is different from those observed in Canada, the US and the EU, partly because of the particular nature of the domestic market, almost self-sufficient for what concerns dairy products and meat, and on the other side completely dependent on imports for the vast majority of fruit and vegetable products. In this context, beef is among the products for which a system of protection is envisaged. Market access for beef and veal is administered through quotas in multilateral and bilateral agreements and arrangements; under its WTO commitments, Iceland applies minimum access tariff rate quotas. Quotas are set yearly for the period 1 July – 30 June and are advertised and allocated to importers by the Minister of Fisheries and Agriculture based on recommendations made by a special committee comprising representatives from the Ministry of Agriculture, Commerce and Finance. If applications exceed the available quotas, these latter are auctioned and allocated to the highest
97 Global Affairs Canada – Advances under the Beef and Veal Tariff Rate Quotas – Message to Industry and to Brokers (http://www.international.gc.ca/controls-controles/prod/agri/beef-boeuf/notices-avis/867-message-3.aspx?lang=eng) 98 USDA Foreign Agricultural Service – A Review of U.S. Tariff Rate Quotas for Beef Imports – April 2016 (http://www.fas.usda.gov/data/review-us-tariff-rate-quotas-beef-imports) 99 Jean-Christophe Bureau and Stefan Tangermann – Tariff Rate Quotas in the EU –Agricultural and Resource Economics Review 29/1 – April 2000.

Policy evaluation of Tariff Rate Quotas
161
bidder. The similarities in TRQ administration for beef products between Iceland and Switzerland are interesting: both countries have much smaller domestic markets with respect to the US, the EU and Canada, and very specific conditions of internal supply both in terms of self-sufficiency and of product range. In this context it is worth to note that in Iceland quota allocation to importers is carried out by the Ministry of Fisheries and Agriculture based on recommendations made by a special committee comprising representatives of that Ministry and the Ministry of Economic Affairs, and, if the applications exceed the available quota, these latter are auctioned.
South Africa’s TRQs administration is based on historical imports to attribute imports rights to operators and countries. In this context it should be noted that, more than in other countries covered in the present study, South Africa seems to apply low tariffs (approximately 20% of the WTO bound rates), which do not seem to be an obstacle to market access. In such a specific situation, the allocation through historical criteria, somehow less based on market competitiveness than, for example, auctions, could imply less distortions on the market thanks to the relatively small advantage of in quota imports with respect to out of quota ones.
5.2 Comparative analysis of the administration of TRQs for beef: Switzerland vs. other countries
Theoretical analysis converges in showing that auctioning is the best way to administer TRQs from a societal point of view (i.e. consumers and taxpayers). Actually TRQs do create rents, but auctioning would eliminate extra-marginal suppliers100 from competition assuring that quotas are allocated to the more efficient market players. TRQ rents accrue to the Government. Rent distribution along the supply chain is a different matter, as it deals with the supply chain structure and the distribution of market power within it. The risk that even TRQ auctioning may result in uneven welfare distribution along the supply chain can be theoretically proved101. Actually only a minority of TRQs worldwide (4%) are administered according to auctioning, whose diffusion is lower than that of historical criteria (5%), mixed methods/methods not specified in WTO notifications (8%), first come-first served (11%), licenses on demand (25%) and applied tariff/quotas not enforced (47%) mechanisms102.
The theoretical analysis of TRQ administration systems generally focuses on some basic models to explain TRQ effects. In the real world, basic models come with some relevant complementary rules, which define the actual functioning.
The Swiss Government’s practice in TRQ administration clearly differentiates systems according to the nature of the product: limiting our considerations to the products covered by the present study, TRQ administration for meat products shows clear differences from fruit and vegetable products, which have been illustrated in the report. In order to compare the Swiss systems with the examples provided in the former section, a recall on the main criteria for import quota allocation, as well as information about the rules that complete the main allocation criteria, are provided in Table 5.1 below.
Table 5.1 – Switzerland vs. third countries: basic TRQ administration models for beef and complementary rules
Country / Area Basic administration model Complementary rules
Canada Licenses on demand Limits to quota allocation for the next year to historical quota holders
United States First-come, first-served Allocation by country of origin. Exporting countries decide about TRQ administration systems
European Union Licenses on demand (historical imports)
20% of import quotas reserved to newcomers each year
Iceland Auctions Quota allocation carried out by the Ministry of Fisheries and Agriculture based on recommendation made by a special committee.
South Africa Historical imports
Switzerland Auction + Historical Decentralization of TRQ administration (inter-branch association) Quota trade among quota holders also in favour of no-quota holders Quota transfer to the next period, within the year
The Swiss quota allocation system for beef is currently a mixed one, as it includes auction-based and historical criteria (quota allocation by auction varies from 40% to 90% of import quotas, depending on product category, with a complicated history of
100 Having a cost to produce or a price to purchase that exceeds the market value. 101 R. Joering, The impact of Tariff-Rate Quotas and Imperfect Competition on Market Access, 2001 102 David W. Skully - Economics of Tariff-Rate Quota Administration - U.S. Department of Agriculture. Technical Bulletin No. 1893, 2001
Policy evaluation of Tariff Rate Quotas
162
shifts among administration models since 2004 (§ 2.1.4.1).103 A number of complementary devices complete the basic model and are relevant to our reasoning:
a. Some relevant decisions concerning TRQ administration (timing and volume of import quota releases) are decentralized to inter-branch/umbrella organisations which include all the participants into the whole beef food chain up to consumers (the latter have only an advisory vote). The same mechanism applies to other products too. This institutionalises a negotiation mechanism among supply chain players (federal parties not included). Within the limits of their role, these organisations are meant to speak as “one voice” vis-à-vis the Swiss Government, which doesn’t take part in negotiations. FOAG indeed participates in Proviande meetings as an observer and has only a control function on the respect of administrative procedures.
b. Quota holders may transfer their quotas (in part or in their entirety) to other market players, no matter if they are quota holders or not, upon communication to the FOAG (the so called quota trade).
c. Quota may be transferred to the next quota period within the same calendar year within given limits (no more than 5% of the quota share, and no less than 500 kg). Until today, however, this possibility has never been used.
Supply chain analysis performed at § 4.3 showed that operators use quota trade to centralize quota management through service companies, owned by the operators themselves. Secondly, even though this is a less common practice in the beef sector, quota trade among operators may take place after quota assignment. To complete the picture, it must be underlined that the import structure of the beef sector shows no relevant changes over time and across TRQ administration changes, nor relevant variations in the concentration of imports have appeared after quota trade since the service companies always hold a very substantial share.
As for point (a) it must be underlined that umbrella associations are organizational substitutes of markets in the respect of rent distribution. In markets, structural aspects (e.g. sector concentration, market power) and company strategies do matter, and determine rent distribution among market players. Within organizations, also the institutional mission does matter (be it explicit or implicit). Reasonably, recalling the basic criteria of the Swiss agricultural policy, the mission of umbrella organizations should be that of setting fair prices for producers while assuring food supply. Negotiations should in principle comply with these criteria. Organizational solutions (as opposed to market mechanism) do not necessarily eliminate company strategies: these (e.g. the ones concerning rent distribution) may change in part and/or just adapt to a different set of rules. It is not clear how negotiations take place within umbrella organisations. Some interviews revealed that balanced solutions are attained based on mutual deterrence among players who are more generally oriented to maintain fair behaviour in the long period than to get immediate, non-durable advantages in each negotiation round. On the other side, supply chain players do have different roles within the supply chain and it’s logical to assume that they may tend to exert pressures on counterparts to influence TRQ administration in their own favour (e.g. large market players may be favourable to historical criteria or domestic purchases for quota allocation to maintain the position that auctioning systems may instead endanger by reducing their rent, and may involve other supply chain actors to exert political pressure in this sense, with a view to value redistribution).
In comparison with the countries listed in Table 5.1, this mechanism seems to be quite particular. On one end of the range of possibilities, the US completely decentralizes TRQ administration decisions to exporting countries. Iceland accepts negotiations, but public institutions participate into them, and this probably ensures that decisions are more aligned on policy objectives. On the opposite end, in the EU negotiation mechanisms are politically managed, are part of a separate negotiation and no mechanism allows for on-going interferences by supply chain players in day-by-day TRQ administration. As mentioned above, in Switzerland public institutions do not participate in the Swiss umbrella organisations, and apparently no means are in place to test the validity of the decisions with respect to the policy objectives (except the tacit approval of the parties).
Quota transfer (point (b) above) may also be relevant in terms of impact on the market structure. As mentioned above, this mechanism allows for peculiar organizational solutions in the Swiss beef sector (reliance on service companies for imports). First, from an economic point of view this may be interpreted as an organizational solution that a pool of companies adopts to reduce transaction cost related to quota access. As transaction costs are among the costs that reduce the rent, minimizing transaction costs may contribute to safeguard the rent. Secondly, quota trade among operators may also occur to adjust their commercial potential. At this stage of the reasoning it is not relevant if quotas are re-traded for money or if they just rise credits among companies over time, as also credits are valuable in this context, no matter what is the term of trade. Credits may be returned in any negotiation among companies, including those for TRQ management. In other words, quota trade has a potential for collusion104. Finally, outsourcing of import services somewhat reduces the transparency of the whole mechanism. To complete the reasoning, it is worth mentioning the problem of quota filling, which can be seen as complementary, in terms of impacts on the market structure, to that of quota trade. In the Swiss system, there are no provisions aimed at pushing operators to fill their import
103 See § 2.1.4.1, “The most important changes with respect to the management of TRQ sub-quota 05.7 for beef concern the distribution method of quota shares: as already noted, from 2005 to 2007 a transition from allocation in proportion to domestic purchases to a mostly auction-based system took place. In 2015, the distribution method was partially changed back to domestic purchases again. From 2008 onwards, only small quotas were opened for the category “beef pieces for dried meat”. In May 2007, tariffs rebates for goods that are intended for specific uses were introduced”. 104 The concept of collusion is used in this context to an observed/implied economic functioning of the market and not to any legal judgment or definition.
Policy evaluation of Tariff Rate Quotas
163
quotas. On the opposite, quota can be freely traded among operators or (theoretically) transferred over time in the short run. Quota management flexibility (or the absence of a quota filling obligation) allows for a significant degree of freedom in market management. The larger the import quota of an individual operator, the larger the margin for management. Flexibility about quota filling coupled with quota trade increases market management possibilities for any operator.
As mentioned above, import structure analysis performed at § 4.3 highlighted a marked stability over time and across TRQ administration systems. The comparison with other countries made here showed that in some cases similar TRQ allocation methods are accompanied by complementary measures that may affect the turnover. In Canada, quota holders in one year may have access in general to only 30% of their quota in the next year. In the EU, 20% of the import quota is reserved for newcomers. In other countries, quota filling is compulsory, and derogation to this rule implies penalties.
All considered, an analytical framework which includes institutional features of TRQ management may add elements of understanding. The institutional setting concerns not only the basic models of TRQ administration, but the entire array of rules that are complementary to these models. Individual rules are not necessarily mutually coherent in view of the general policy objectives (in the beef case, service companies may bypass the quota allocation system based on auctioning, thanks to quota transfer rules105). The umbrella association model may miss its objective of a value redistribution coherent with policy objective (via an institutional negotiations) without proper controls; in addition, the lack of specific measures – identified in other countries – to facilitate turnover in quota allocations underlines the peculiarities of the Swiss TRQ administration system as potentially much more exposed to imbalances in market powers and collusion than those in place in other countries.
105 In the present report, the terms “quota trade” and “quota transfers” are used interchangeably.

Policy evaluation of Tariff Rate Quotas
164
6 Conclusions
Generally speaking, the results of the analysis carried out to answer the specific evaluation questions (detailed below) indicate that whereas some of the policy objectives of TRQs are reached and therefore the policy can be considered partly effective, it is clearly inefficient. In addition to the volume of the TRQs and the height of the out-of-quota duty, also TRQ administration methods have an important role in this respect. However, some relevant elements for a thorough evaluation of the system were found to be missing (for instance, there is a lack of data on actual Swiss producer prices for fruit and vegetable products).
Conclusions on the efficacy of existing TRQs system
Preliminary questions
Q.1.1 What is the impact of TRQs on imports, production and consumption?
Q.1.2 What is the impact of TRQs on import and domestic prices at the various stages of the food chain?
Questions on efficacy
Q. 2.1 What is the contribution to existing price differentials between domestic and world prices? Is this difference lower than the out-of-quota tariff?
Q. 2.2 What is the contribution to stable domestic prices?
Q. 2.3 What is the contribution to allow an adequate provision of domestic markets?
The replies to preliminary question 1.1 (§ 4.1.1) highlighted that TRQ and TRQ administration have an evident impact on imports of all the six products covered by the assessment since the out-of-quota duties are usually extremely high and the volume of imports strongly depends on the releases of import quotas. Quotas are released only when the domestic production is not sufficient to cover domestic demand and this is consistent with the intention of the legislator to complement domestic supply with imports when necessary. As for the impacts of TRQ administration on domestic production and demand, the assessment found that it is more the TRQ administration which is carefully tailored to adapt to the conditions and the dynamics of production and demand (two-phase system to take into account seasonality of production for fruit and vegetables, less quota releases wherever a structural oversupply is detected, careful definition of the timing and volume of the quota releases for meat in order to ease the domestic market without putting pressure on prices, etc.), rather than TRQ administration having an impact on domestic production and consumption.
The replies to preliminary question 1.2 (§ 4.1.2) detected impacts of TRQ and TRQ administration on domestic prices for most of the products covered by the assessment (the only exceptions being potatoes and apples because of the very limited importance of imports for these products with respect to domestic production), allowing higher prices with respect to foreign markets. Impacts on prices were usually found to be in general consistent with those which would be expected in the light of the policy rationale. However, while the policy rationale is centred on higher domestic producer prices (with special attention to the period in which seasonal products – tomatoes, strawberries - are placed on the market), the analysis showed higher prices at all the levels of the supply chain, and especially at wholesale and retail stages. For meat, quota releases are typically made when high domestic consumer prices signal a tight situation on the domestic market (low supply with respect to domestic demand), in order to complement domestic supply with imports. An interesting result is that, contrary to what would be expectable, domestic prices at all levels remain high during periods of quota releases, confirming that the release of import quotas is carefully managed in a way to ensure that there is no pressure on domestic prices. Potatoes are imported in general from January to May, when the TRQ is open. For fruit and vegetable products, following the seasonal character of TRQ administration, consumer prices are higher during the managed period; in this case the analysis is however limited by the availability of only reference prices at wholesale and producer levels. Asymmetric vertical price transmission, suggesting the presence of imbalances in bargaining power to the advantage of downstream stages of the supply chain, and especially of retailing, was detected in the supply chains of beef and pork. This implies that high consumer prices obtained by TRQ administration are only partially transmitted to producers’ prices.
As for efficacy proper, the replies to question 2.1 (§ 4.2.1) highlighted the presence of significant to substantial price differentials between the domestic prices and the external prices at most/all stages of the supply chain for all the six products covered by the assessment (for fruit and vegetable products, since most of the price series are only available during the campaign, it was possible to monitor this gap only in the managed period). The assessment of price differentials against the out-of-quota tariffs posed some important challenges, and suffered from a number of limitations in the available evidence base (in
Policy evaluation of Tariff Rate Quotas
165
particular the features and length of the available price series). This notwithstanding, additional elements emerging from replies to other study questions (above all the limited/negligible extent of out-of-quota imports for all the six products studied, which indicated that the TRQ system did not allow to satisfy the increase in domestic demand via out-of-quota imports) allowed to conclude with reasonable confidence that price differentials between domestic and external prices are usually lower than the out-of-quota tariff.
The elements emerged from the replies to question 2.2 (§ 4.2.2), albeit non-conclusive, suggested that the TRQs and their administration have probably contributed to the greater stability of domestic prices vis-à-vis external prices, which was detected for all the six products at nearly all the stages of the supply chain (the only significant exceptions being consumer prices of beef and strawberries); once again, for fruit and vegetable products this analysis is severely limited by the fact that only indicative prices are available for the wholesale and producer stages of the domestic supply chain.
Finally, question 2.3 (§ 4.2.3) investigated the contribution of the TRQs and TRQ administration in allowing an adequate provision of domestic markets, a rather complex concept which was defined as a combination of:
iv. the absence of product shortages (which would be signalled by a lower frequency of price spikes in Switzerland than in external markets);
v. a balanced origin composition of imports (which should better guarantee supply security than an extremely polarised one, relying on a single dominant country);
vi. the absence of conditions (i.e. underutilised import quotas, especially when at the same time important transfers of the same occur among operators, significant volumes of out-of-quota imports by operators that are “locked out” of the in-quota import trade) which could suggest the occurrence of market rationing by importers.
Also in this case, the assessment posed some challenges, and suffered from limitations deriving mainly from the features and length of the available price series. The key conclusions can be summed up in as follows:
No elements emerged which could unequivocally suggest the occurrence of shortages for the six products covered in the assessment.
The products showing a highly polarised origin composition of imports (half-carcasses of swine and, to a lesser extent, potatoes and strawberries) were found to be in a situation of oversupply (pork), or saw a non-critical role of imports in supplying the domestic market (potatoes), or did not show any other elements suggesting potential threats in terms of supply security (strawberries).
The threat of market rationing by the leading importers, with consequent risk of sub-optimal provision of the domestic market, was detected for potatoes and (especially) for tomatoes, although it might potentially concern all products, since import quota releases (in terms of both volume and timing) are decided by market operators to avoid negative impacts on domestic prices.
Summary of conclusions on efficacy
The main conclusions on the efficacy of TRQs can be sketched as follows:
1. Concerning the support of domestic production, the analysis shows that imports are only allowed when domestic production is not sufficient to cover domestic demand, consistent with the intention of the legislator. Both TRQs (due to the height of out-of-quota duty) and TRQ administration (timing and frequency of quota releases) have an evident impact on imports of all the six products covered by the assessment. In this respect, it is more the TRQ administration which is precisely tailored to adapt to the conditions and the dynamics of production and demand, rather than TRQ administration having an impact on domestic production and consumption.
2. TRQs helped keeping domestic prices higher than foreign ones at all the levels of the supply chain. TRQ administration also contributed to allow higher prices even in periods of quota releases. These contribute to support producers’ income106. However: a. While the policy rationale is centred on higher domestic producer prices, the analysis showed higher prices at all the
levels of the supply chain, and especially at wholesale and retail stages. b. Asymmetric vertical price transmission in the beef and pork market suggests the presence of imbalances in bargaining
power to the advantage of the downstream stages of the supply chain, so that increases in consumer prices are only partially transmitted to the producers’ prices.
c. Price differentials between domestic and external prices at all the stages of the supply chains are usually lower than the out-of-quota tariff (no arbitrage through out-of-quota imports is basically possible).
d. For fruit and vegetable products, the analysis is however limited by the availability of reference prices only.
106 Note that a detailed analysis of costs and revenue composition falls outside the scope of the study.
Policy evaluation of Tariff Rate Quotas
166
3. On price stability, TRQs and their administration have probably contributed to the greater stability of domestic prices vis-à-vis external prices, for all the six products at nearly all the stages of the supply chain. Also here, for fruit and vegetable products, the analysis is however limited by the availability of reference prices only.
4. On providing an adequate provision to domestic markets, albeit no elements suggest the occurrence of shortages for the six products, the threat of market rationing by leading importers (with sub-optimal provision of the domestic market) is concrete especially for potatoes and tomatoes, but might potentially concern all products.
Questions on efficiency
Q. 3.1 Which costs and benefits result for the various actors involved (economic welfare of producers, importers, processors, distributors, retailers, consumers, government), taking into account the relevant characteristics of world and domestic markets? In particular, what can be said about the impact on farmers vs the impact on the downstream industry? Which rents arise, and how are they distributed?
Q. 3.2 Which is the impact of TRQs and of their administration method on the structure of imports (effect on the price and volume composition of shipments, structure of importers)?
Q. 3.3 Does the Swiss market structure (not perfect competition) influence the distribution of costs, benefits, rents?
Q. 3.4 What is the impact of TRQs on the development of the market structure of the food chain / on the vertical chain of production? Do they promote the formation of non-competitive market structures? To which extent?
The assessment in relation to question 3.1 (§ 4.3.1) showed that there is a rent associated with TRQs, since domestic prices are kept higher than foreign ones by border protection. A series of limitations prevented from the quantification of rent / total surplus deriving from TRQs. Different studies and articles have provided general indications on the order of magnitude of the rent: the OECD107 estimated the gain of producer surplus in approximately CHF 1.01 billion, while – due to efficiency losses associated to border protection measures – the total cost for Swiss consumers is estimated around CHF 1.7 billion. The Swiss price monitor108 provides an indication of the extra-cost for Swiss consumers as between CHF 2 and 3 billion. The downstream sectors – and the retail stage in particular – have had an advantage over producers in capturing the rent created through the TRQs and their administration for most of the products covered by the assessment. This can be concluded for a number of reasons: different dynamics of domestic prices at the two extremes of the supply chain (producer: flat / consumer: increasing); asymmetries in price transmission (for meat); dominance of the leading retailers and limited importance of independent operators; fairly static arena of importers and no producers active in import trading. A possible exception to this emerged for potatoes (where, even in a market dominated by the two leading retailers, producers might hold a relatively bigger share in import trading in comparison with the other products) and for beef and pork (where the introduction of an auction-based import quota allocation has allowed the Swiss government to capture a part of the rent generated by the administration of the TRQ). Swiss consumers were found to be negatively affected (in terms of higher retail prices paid, or of foregone savings from lower prices that would prevail in absence of TRQs and TRQ administration) by the presence of the TRQs and their administration for all the products covered by the assessment. For beef and strawberries the potential rent accruing to the intermediate stages of the food chain has increased over time thanks to the diverging dynamics of domestic consumer price (increasing) and producer price (rather flat) over the respective foreign ones.
The reply to question 3.2 (§ 4.3.2) highlighted the following impacts of TRQs and of their administration method on the structure of imports:
i. Effects on quality/price composition of imports for all products except apples (where no significant impact on imported varieties and corresponding prices was found), promoting the import of specific typologies of products (high quality beef, half-carcasses of swine, early potatoes) or strictly regulating import volumes, with very low volumes of imports and peaks in import unit value109 during the management period (tomatoes and strawberries).
ii. Effects on origin composition of imports for beef (where the absence of origin-specific quota allocations resulted in a very diversified group of exporting countries) and strawberries (where the preferential quota for EU origins resulted in the prevalence of few EU countries as foreign suppliers).
iii. Effects on the structure of imports and of the arena of operators active in import trading for all the six products covered by the assessment, mainly determined by the possibility of trading import quotas among operators.
107 OECD Review of Agricultural Policies for Switzerland, 2015 108 Newsletter 04/16, www.preisueberwacher.admin.ch/pue/it/home/documentazione/informazioni-ai-media/newsletter/2016.html 109 Import unit value is calculated as the ratio between the value (in CHF) and the volume (in Kg net) of imports of a tariff line relevant for the allocation of import quota releases in a specified period (usually a month); it is basically the weighted average of imported values.

Policy evaluation of Tariff Rate Quotas
167
The practical relevance of the switch to auctioning of import quotas on the structure of the arena of operators active in importing and in-quota trading of beef and pork, was found to have been very limited. Service companies and some of the companies they operate on behalf of, which had been the key subjects in the system prior to 2005, succeeded in maintaining such a role also after the switch to auctioning (also thanks to the aforementioned possibility of trading import quotas among operators); this limited the effects of the switch to auctions in rebalancing the market power among importers. The introduction of auctions as administration method for meat allowed the entrance of new importers in the market: despite this, their relevance in terms of import rights (and of actual imports) has been low (it should also be noted that the presence of service companies constitutes a challenge in tracing what the various operators behind them actually import). Finally, it cannot be excluded that – in concentrated markets like meat– service companies providing pooling of demand, risk minimization and centrally managing the necessary administrative process for quota allocation, might further facilitate player coordination in import strategies in addition to what promoted by TRQs (see below). These companies act on behalf of many individual operators – some of very large dimensions – and their role in redistribution of quotas among their members is not clear: in this context, the potential impact on the overall market structure of these entities might be relevant. As per the potential effects on producers, no elements emerged from the analysis suggesting neither negative nor positive impacts of the switch to auctioning on producer prices and rents.
The replies to questions 3.3 and 3.4 are inter-linked with replies to questions 3.1 and 3.2.
The reply to question 3.3 (§ 4.3.3) highlighted that the non-perfect competition characterising the structure of the Swiss market for the products considered in the evaluation has had an influence on rent distribution: this conclusion, particularly evident for beef and pork where the econometric analysis on price transmission was feasible, also applies to fruit and vegetable products, on the basis of indirect findings of analysis carried out to answer previous questions. For all the six products covered by the assessment, the downstream stages of the food supply chain resulted to be those who are better positioned to capture the highest share of the rent.
Finally, the reply to question 3.4 (§ 4.3.4), which focuses on the assessment of the reversed causal relationship tackled by question 3.3) concluded that the TRQ administration system of all the six products covered in the assessment formally encourages / allows the exchange of information and – more practically – of import quotas, and the cooperation among players within the respective supply chains. Although market structure and concentration depend on many other factors than TRQs, and even if no direct proof could be obtained for, ceteris paribus, a lower degree of concentration in the absence of TRQs, such self-regulated, well-coordinated and consensus-based processes almost certainly fosters more or less formalised alliances and partnerships among the operators themselves, thus influencing the overall structure of the market . The need to find agreements - both within the same stage of the supply chain and with the other stages - on volumes and timing of quota releases, the possibility to exchange quotas obtained through auctions (for meat) or to have a second round of trade to fine-tune a company’s import rights (for fruit and vegetable products), suggest that in an already concentrated market as the Swiss one, concertation and dialogue are crucial for an effective management of import activities; in such a context, the market structure, both in its formalised and in its practical form, can be impacted, and the incentives to a more aggressive competition can be limited. The resulting effects of these elements are almost certainly the promotion of non-competitive market structures, with an overall decrease in the efficiency of the system.
In general, the most critical aspects of the TRQ administration system highlighted by the assessment are the following:
iii. Its remarkable complexity, especially as far as certain aspects of its functioning (e.g. original allocations of import quotas; trade of import quotas among operators) are concerned.
iv. The fact that crucial decisions for TRQ administration (timing and volume of releases of import quotas) are de facto decided by the concerned operators, through a coordinated, consensus-based process: in an agro-food system like the Swiss one, characterised by two leading retailers holding substantial shares in various markets, and with significant upstream vertical integration, this could result in further reinforcement of dominant positions with potentially negative effects on the overall efficiency of the system. In addition, the strategies of the various actors involved in the decisional process are by nature undisclosed: the functioning of the TRQ system is therefore not completely transparent to external observers / the general public.
Summary of conclusions on efficiency
The main conclusions of the analysis concerning TRQs efficiency can be summarized as follows:
1. A consolidated result of the relevant economic literature is that TRQs create rents to producers thanks to the border protection they offer; however, the net welfare effect is negative. The OECD and the Swiss price monitor have provided indications on the order of magnitude of the rent. The losses for consumers are higher than the benefits accruing to producers and to the governmental budget.
2. The downstream sectors have had an advantage over producers in capturing any rents created through the TRQs and their administration system for most of the products covered by the assessment. This is due to the conditions of imperfect competition in the intermediate stages of the food chain.
Policy evaluation of Tariff Rate Quotas
168
3. TRQs and their administration system influenced the quality composition of imports and their price. 4. The practical effects of the switch to auctioning of import quotas on the structure of the arena of operators active in importing
and in-quota trading of beef and pork have been very limited. 5. In addition to this, the following considerations can be made:
a. As mentioned above, the non-perfect competition characterising the structure of the Swiss market for the six products studied has influenced rent distribution, with the retail and wholesale stages capturing the largest part of the rent.
b. At the same time, the TRQ administration system almost certainly fosters more or less formalised alliances and partnerships among the operators themselves, thus influencing the overall structure of the market.
Conclusion on proposed changes to improve efficacy and efficiency
In light of the answers provided under Q1 – Q3, which changes could be recommended in the existing TRQs system to improve its efficacy and efficiency?
Question 4 (§ 4.3.5) explicitly refers to potential changes in the existing TRQs system to improve its efficacy and efficiency; in this context, it is worth noting that while the study highlighted a general good level of efficacy of the system – albeit with some areas of concern – the assessment of the efficiency of the system revealed serious limits.
The modification of specific elements of the existing system (e.g. overall simplification of the system; possible reduction of out-of-quota tariffs; introduction of limits and/or obligations regarding trade of import quotas and their filling) would only bring minor improvements; if more substantial improvements of the system’s efficiency are to be reached, more profound changes should be considered.
Policy evaluation of Tariff Rate Quotas
169
7 Annex
Complete annexes reported in the document “TRQ study_draft_final report_Annexes”

Policy evaluation of Tariff Rate Quotas
170
8 Bibliography and literature review
8.1 Bibliography
References in the tables which follow are reported by theme and in alphabetic order (by author); websites are reported at the bottom of each table.
General methods and approaches to investigate TRQs (including their application in countries other than Switzerland)
Abbott, Philip C., Paarlberg, Philip L., Tariff rate quotas: structural and stability impacts in growing markets, Agricultural Economics 19, 257-267, 1998
Abbott, Philip C., Tariff rate quotas: Failed market access instruments?, 77th EAAE Seminar / NJF Seminar No. 325, August 17-18, 2001, Helsinki, 2001
Barichello, Richard R., A Review of Tariff Rate Quota administration in Canadian agriculture, in Agricultural and Resource Economics Review 29/1, 103-114, 2000
Bergsten, C. Fred et al., Auction quotas and United States trade policy, Institute for International Economics, Washington, D.C., 1987
Bhagwati, Jagdish N., On the equivalence of tariffs and quotas, in Baldwin, R.E. et al. (eds.), Trade growth and the balance of payments, Chicago, 1965
Boughner, Devry S., de Gorter, Harry, Sheldon Ian M., The economics of two-tier Tariff-Rate Import Quotas in agriculture, in Agricultural and Resources Economics Review, 29/1, 58-69, April 2000
Bureau, Jean-Christoff, Tangermann, Stefan, Tariff Rate Quotas in The EU, University of Gottingen, Agricultural and Resource Economics Review 02/2000, 2000
De Gorter, Harry, Kliauga, Erika, Reducing tariffs versus expanding tariff rate quota, Agricultural trade reform and Doha agenda, Washington DC, World Bank and Palgrave Mcmillan, 2006
Junker, Franziska, Heckelei, Thomas, TRQ-Complication: Who gets the benefits when the EU liberalises Mercosur’s access to the beef markets?, AAEA-ACCI Joint Annual Meeting, Milwaukee, Wisconsin, July 26-29, 2009
Krueger, Anne O., The political economy of the rent-seeking society, in “The American Economic Review, 64(3)”, 291-303, 1974
Lengwiler, Yvan, The multiple unit auction with variable supply, in Economic Theory, 14, 373-392, 1999
Mead, Andrew, Strutt, Anna, Tariff rate quotas and New Zealand’s meat and dairy trade, New Zealand Agricultural and Resource Economics Society Conference, June 25-26, 2004, Blenheim, New Zealand, 2004
Mc Corriston, Steve, Import quota licenses and market power, in American Journal of Agricultural Economics, Vol 78, No. 2 367-371, May, 1996
Ramos, Maria P., Bureau J.C., Salvatici, Luca, Shipping the good beef out: EU trade liberalization to Mercosur exports, TRADEAG-DG General Research, European Commission, Bruxelles 2007
Scoppola, Margherita, The liberalization of Tariff Rate Quotas under oligopolistic competition, in Journal of Agricultural Economics, 2010
Skully, David W., Economics of Tariff-Rate Quota Administration, Market and Trade Economics Division, Economic Research Service, U.S. Department of Agriculture. Technical Bulletin No. 1893, 2001
Takacs W., Auctioning import quota licences: an economic analysis, Institute for International Economic Studies, Seminar Paper n. 390, Stochkolm, Sweden, 1987
Uruguay Round Agreement on Agriculture, 1995
Specific bibliography on Swiss TRQs
Esposti, Roberto, Analysis of price transmission in the wheat sector. Does a sophisticated border protection policy improve the
Policy evaluation of Tariff Rate Quotas
171
Specific bibliography on Swiss TRQs
protection performance? The case of wheat market in Switzerland, Swiss Federal Office for Agriculture, Bern, 2013
FOAG, Grundlagenbericht Grenzschutz, 2015
Joerin, Robert, The regulation of market access (Die Regelung des Marktzutritts), Eidgenoessische Technische Hochschule Zurich, 2000
Joerin, Robert, The impact of Tariff-Rate Quotas and imperfect competition on market access, International agricultural trade research consortium symposium, Auckland, New Zealand, 2001
Joerin, Robert, Lengwiler, Yvan, Learning from Financial Markets: Auctioning Tariff-Rate Quotas in Agricultural Trade, Schweizerische Zeitschrift für Volkswirtschaft und Statistik, 2004, Vol. 140 (4) 521–541, 2004
Joerin, Robert, Improving market access: the role of auctions in converting tariff-rate quotas into single tariffs, in “Review of Agricultural and Applied Economics”, n°1, 24-30, 2013
Khorana Sangeeta, The developmental relevance of tariff rate quotas as a market access instrument: an analysis of Switzerland agricultural imports, The Estey Center Journal of International Law and Trade Policy, Vol 9 n. 2, 8-31, 2008
Swiss agricultural policies, trade policies and regulations
Confederazione Svizzera, Legge federale sull'agricoltura (Legge sull’agricoltura, LAgr), 29 aprile 1998 (Stato 1° gennaio 2015)
FOAG, Rapporto agricolo dell’Ufficio federale dell’agricoltura, from 2003 to 2014
Jarrett, Peter, Moeser, Charlotte, The Agri-food Situation and Policies in Switzerland, OECD Economics Department Working Papers, No. 1086, OECD Publishing, 2013
Joerin, Robert, Schleup Campo, Isabelle, Impacts of Swiss agricultural trade policy on consumer behavior and dietary patterns, Federal Office of Public Health, 2008
OECD, Review of agricultural policies Switzerland 2015
WTO, Trade Policy Review. Switzerland and Liechtenstein, 2013
Federal Office for Agriculture FOAG website: www.blw.admin.ch
TARES database: xtares.admin.ch
SWISSIMPEX: www.swiss-impex.admin.ch
Meat sector
Abdulai Awudu, Using threshold cointegration to estimate asymmetric price transmission in the Swiss pork market, in Applied Economics, 34:6, 679-687, 2002
El Benni, N., Finger, R., Hediger, W., Transmission of beef and veal prices in different marketing channels, EAAE 2014 Congress Agri-Food and Rural Innovations for Healthier Societies, 2014
FOAG, Conseguenze della vendita all'asta di contingenti d'importazione di carne, Rapporto del Consiglio federale, 2006
FOAG, Ulteriore sviluppo del sistema d’importazione di bestiame da macello e carne, Rapporto del Consiglio federale, 2009
FOAG, Rapporto mensile sul mercato della carne, from 2009 to 2015
Proviande, Le marché de la viande, from 2010 to 2015
Schleup Campo, Isabelle, Joerin, Robert, Liberalizing the Swiss Meat Market with the EU: Welfare Effects and Impacts on Third Countries, Swiss Society of Economics and Statistics, Vol. 145 (1) 107–126, 2009
Proviande: www.proviande.ch
Vegetable sector
Chevalley, Marjorie, The fruit and vegetable market in Switzerland, SWISSCOFEL, SIPPO, 2006 (updated 2012)
Policy evaluation of Tariff Rate Quotas
172
Vegetable sector
FOAG, Informazioni concernenti l'importazione di frutta e verdura fresche
FOAG, Rapporto sul mercato delle patate, from 2011 to 2014
FOAG, Rapporto sul mercato di frutta e verdura, from 2009 to 2015
Fruit-Union Suisse: www.swissfruit.ch
Association Suisse du Commerce Fruits, Légumes et Pommes de terre (SWISSCOFEL): www.swisscofel.ch
Centrale suisse pour la culture maraîchère et les cultures spéciales (CCM): www.szg.ch
Swisspatatat: www.kartoffel.ch
8.2 Literature review
An overview of the key reference literature is provided through the following series of boxes (in alphabetical order, by author), each outlining the most significant elements of a number of key references found in bibliography.
Author(s): Abbott, Philip C., Paarlberg, Philip L., Year: 1998
Title: Tariff rate quotas: structural and stability impact in growing markets
Content: This article mainly focuses on the effect of TRQs on price stability. The Authors studied the Philippines pork market, considered as a model market for a small importing country with an expanding market. In order to introduce the issue of price transmission between world and domestic market in case of demand or supply shocks, the authors developed a microeconomic analysis based on relevant examples of variation of import volumes in relation to quotas and tariffs. The results of this exercise have been included in a simulation model which allows to analyse price volatility in the Philippine’s case in relation to tariff and quota variation. Furthermore, the study analyses the importers’ behaviour in relation to the changing of the transaction timing by effect of the variations of policy regime.
Key findings: Price transmission between world and domestic markets depends on the variation of net import volumes in relation to quota filling. Transaction timing is also a relevant variable in determining the importers’ behaviour when TRQs change.
Author(s): Boughner, Devry S., de Gorter, Harry, Sheldon Ian M. Year: 2000
Title: The Economics of Two-Tier Tariff-Rate Import Quotas in Agriculture
Content: The authors examine the effect of the different components of Two-Tier TRQ systems (first tier tariff, second tier tariff and quota) and the practice of “dirty tariffication” (“water in the tariff”) and “dirty quotation” in TRQ implementation. The study adopts a conceptual microeconomic scheme of market equilibrium. The efficiency of the system is analysed under different tariff scenarios (in quota, over quota and out of quota tariffs) and under different quota settings in a framework of trade liberalization.
Key findings: Conclusions are mainly drawn on the efficiency of TRQs and on alternative methods of trade regulation and trade liberalization. Furthermore, conclusions focus on the mechanism of quota allocation.

Policy evaluation of Tariff Rate Quotas
173
Author(s): El Benni N., Finger R., Hediger W. Year: 2014
Title: Transmission of beef and veal prices in different marketing channels
Content: The paper analyses monthly up- and downstream prices for beef and veal meat and tests for Granger causality and asymmetric price transmission in the Swiss retail and restaurant channels through the use of monthly prices collected at processors’ level in the period 2004-2013. VAR and VEC models are estimated in order to highlight the price relationships and test for Granger causality between the different prices, to reveal the direction of price flows across products and between up- and downstream stages. VEC models for asymmetric price transmission are used to estimate the long-run price equilibrium and to model potential asymmetry in price adjustments dependent on whether the margins are squeezed or stretched. While a product-by-product comparison would have suggested uni-directional relations from up- to downstream prices, the across-product analysis reveals that price relations between both types of meat are significant.
Key findings: Significant relations between beef and veal prices are highlighted for both channels. Compared to the retail channel, less price relations can be observed in the restaurant channel, probably because of the higher and more flexible share of imported as well as unlabeled meat compared to the retail channel. No evidence of asymmetric price transmission is found, also because of the data and assumptions adopted (detailed in § 3.1 - footnote n. 30).
Author(s): Esposti, Roberto Year: 2013
Title: Analysis of price transmission in the wheat sector. Does a sophisticated border protection policy improve the protection performance? The case of wheat market in Switzerland
Content: This paper investigates the horizontal price transmission of wheat from the international to domestic markets in Switzerland. Trade policies implemented by the Swiss government are also included in the analysis. These policy measures have the main aim of sheltering the domestic market from external market fluctuations. In particular, trade policies here considered aim to achieve the convergence of domestic prices gradually to international prices but, at the same time, to protect the domestic market with respect to excessive fluctuations. This protection is planned in order to stabilize both food and feed prices but in a differentiated way. Further aims of the policy are to grant food prices more protection and to maintain a gap between food and feed prices favouring, at the same time, a stable domestic wheat production. A key role in this achievement is played by the entry price system. In the case of feed uses, the combination of a declining entry price and a tariff allows to achieve this twofold result of stabilization and gradual convergence. In the food case, the introduction of an entry price system coincides with a period of higher transmission of price signals across the border.
Key findings: The apparent main objective underlying policy measures is to protect the domestic market in order to have stable and relatively high prices for wheat for food and stable and relatively low prices for wheat for feed. In this light, these policy targets have been, at least in part, achieved. The extension of TRQs can be considered as a coherent integrative measure within this context, to be adopted especially during turbulent times.
Policy evaluation of Tariff Rate Quotas
174
Author(s): Jarrett, Peter, Moeser, Charlottes Year: 2013
Title: The Agri-food Situation and Policies in Switzerland, OECD Economics Department Working Paper
Content: Switzerland is a net importer of agro-food products, with a level of self-sufficiency of 63%. Compared to other OECD countries, the level of public support to the agricultural sector is high. Beyond the direct support to farmers, other forms of support have been set up, namely market price support, border protection (among which TRQs), export subsidies and refunds, and input subsidies. This working paper provides a brief overview of the reforms which, in recent years, have been implemented in the Swiss support system to the agricultural sector. Following the Uruguay Round, producer support fell by around 20% of gross farm receipts, and it is now around 56%. Price support has been overtaken by direct payments, and, lately, direct payments have been progressively de-linked from production and are now conditional to specific requirements. Even if import tariffs have been reduced, they are still very high. The implicit consequences of this are higher prices of food products in the country and, at same time, higher costs for taxpayers, because support is mostly based on the federal budget. Furthermore, a high level of support to the agro-food sector could negatively affect productivity and efficiency of Swiss producers. On the opposite, reducing support and border protection could result in an enhanced competitiveness of the sector and of the whole Swiss economy. Final recommendations of the OECD economic department are a reduction of overall support, a strengthening of the link between direct support and general policy objectives such as environmental and biodiversity protection, a liberalisation of the border protection system, a liberalisation of land market and an increase of expenditure on innovation in agriculture.
Key findings: Even if recent reforms have partially reduced the support to the agro-food sector in Switzerland and have enhanced its market orientation, the country still has a very high level of support, both direct and indirect. This affects the competitiveness of the sector and represents a cost for taxpayers. The Swiss government should hence keep reducing the level of support, or shift to alternative forms of support.
Author(s): Joerin, Robert Year: 2001
Title: The impact of Tariff-Rate Quotas and Imperfect Competition on Market Access
Content: The starting point of this paper is the description of market imperfection of agricultural products, which is widely diffused. The author analyses the effect of TRQs in the framework of a disequilibrium of market power. The analysis is included in a general discussion about the comparison between TRQs and tariff systems and about their effects on market distortion. More in detail, the paper examines the effects of quotas and tariffs in an environment where an economic agent acts with the dual role of monopsonist and of monopolist, respectively in upstream and downstream markets. The analysis is then developed in a specific case, namely when a trader acts as monopsonist quota holder and, at the same time, as a monopolist towards downstream sectors. Finally, TRQ administration is also examined with the aim of highlighting systems which can limit undesirable outcomes in terms of imbalances in market power.
Key findings: A dual role of monopolist/monopsonist of an economic agent can result in a reduction of product supply on the market. In particular, market distortions increase when a monopolist has exclusive access to import quota, to the detriment of upstream producers and consumers.
Author(s): Joerin, Robert Year: 2009
Title: Improving Market Access: The Role of Auctions in Converting Tariff-Rate Quotas into Single Tariff *
Content: This paper focuses on the effect of TRQ system on market access and welfare. A comparative analysis of TRQs and single tariffs system is implemented in an economic environment of imperfect competition. The most relevant theoretical references is the so called “Bhagwati theory” showing the non-equivalence of tariffs and quotas under imperfect competition (Bhagwati, 1965) and the welfare benefits of shifting from TRQs to a tariff system. The quantification of the effective tariffs is a critical point of this process. Starting from the work by Bergstern et A. (1987), the author discusses the pros and cons of using quota auctions to reach an efficient tariff level, applying a variable supply mechanism (Lengwiler, 1999). As a case study, in the article the meat TRQ auctioning system implemented by the Swiss Government in 2005 is examined.
Key findings: The article provides insights on the Swiss meat TRQ bidding mechanism and effects. Furthermore, it highlights the problems related to a non-competitive (collusive) auction system. The article focuses on converting TRQs into tariffs under perfect competition and concludes that auctions are the only way to elicit from quota holders how much is their willingness to pay for imports. Finally, the article points out the non-equivalence of tariffs and quotas under imperfect competition and identifies rent-seeking behaviours as the main obstacle for reforms of the TRQ regulations.
* See also Joerin R. (2014)
Policy evaluation of Tariff Rate Quotas
175
Author(s): Mc Corriston, Steve Year: 1996
Title: Import quota Licences and Market Power
Content: This paper focuses on the links between the implementation of certain types of quota administration system and the creation of oligopsonistic power. In fact, in an oligopolistic environment, the market of quota licences can be considered imperfect. The presented case study concerns the dairy import regime in the US, with a special focus on rent creation and rent distribution. A theoretical framework is drawn and empirical data concerning US dairy sector are used to identify alternative scenarios of market power. Also included in the analysis is the possibility for US Government to extract rents from quota administration systems.
Key findings: Administrative tariffs and limitations of imports could actually determine a non-competitive environment in the market of import quotas. The implementation of these measures could determine who captures the rent and which is the level of the rent that can be captured. Finally, these policies have an influence also on the portion of rent which is diverted towards the Government.
Author(s): Ramos, Maria P., Bureau J.C., Salvatici, Luca Year: 2007
Title: Shipping The Good Beef Out: EU Trade Liberalization to Mercosur Export
Content: The paper analyses the potential effects of TRQ administration in the case of EU import from Mercosur through the use of an econometric model. The main focus of the study is the effect of sub-categorization on the variation of import structure and beef quality. The conceptual background of the paper is, among others, the so called Alchian-Allen effect which establishes a relationship between the types of tariffs applied in trade and the selective effect on imports, which normally goes in favour of high quality products.
Key findings: The explanation of the Alchian-Allen effect lies in the combination of high specific tariffs, low ad valorem tariffs and TRQs application. In the specific case study, high tariffs could favour imports of high quality products while, on the opposite, cutting specific tariffs might reduce imports of high quality products.
Author(s): Skully, David W. Year: 2001
Title: Economics of Tariff-Rate Quota Administration, Market and Trade Economics Division
Content: The paper provides a micro-economic analysis of TRQ effects on market equilibrium and on related welfare effects. The author further analyses the characteristics and the effects of different TRQ administration systems according to WTO principles of quota fill and of distribution of trade among suppliers. The relevant types of quota allocation methods examined in the study are auctioning, quasi-market allocation tools (licence on demand, first come-first served), historical allocation, and discretionary methods.
Key findings: The main findings are related to welfare effects of the TRQ administration methods. Auctions are identified as the best way to administer a TRQ. First-come, first-served and license-on-demand methods present a moderate risk of biased trade. State trading organizations and producer groups that directly administer TRQs can also bias trade. Finally, historical allocation is considered a method which can most likely be discriminatory.
Author(s): WTO Year: 2013
Title: Trade Policy Review. Switzerland and Liechtenstein
Content: This WTO report is a compendium of trade policy of Switzerland (and Liechtenstein). After a short introduction on the economic environment of the country, through the use of the main macroeconomic indicators (e.g. GNI, GINI Index, unemployment rate), the report focuses on trade policies. Switzerland is a partner of a certain number of trade agreements: WTO, European Free Trade Association (EFTA), bilateral trade agreements with the EU and with other countries, and non-reciprocal preferential arrangements. The report has a section in which trade policies and practices are presented, classified as follows: measures which directly affect imports and exports, measures which affect production and trade, and sanitary and phytosanitary measures. Another section analyses trade policies by sector. Analysis on the agriculture sector is focused on border measures and domestic support. An analysis of a few selected agricultural markets is provided, in particular in relation to milk and dairy products, meat and livestock, grains and oilseeds, fruit and vegetables, potatoes and sugar.
Key findings: This comprehensive and authoritative report allows to contextualise the TRQs system within the general framework of Swiss trade policy.


