25
Commissioning for Outcomes Steering Group Meeting Wednesday 27 th May 2009 ECONOMIC BENEFIT TASK GROUP Paul King Jennifer Lindsay
| Date post: | 01-Jan-2016 |
| Category: |
Documents |
| Upload: | david-casey |
| View: | 213 times |
| Download: | 0 times |

Commissioning for Outcomes
Steering Group Meeting
Wednesday 27th May 2009
ECONOMIC BENEFIT TASK GROUP
Paul KingJennifer Lindsay

Objectives
• To briefly describe the “journey” and process
• To hi-light our “light bulb” moment
• To illustrate our final 3 outcome measures linked to SROI
• To recommend next steps to you

Our Point
“To develop finance & probity outcomes measures that demonstrate service effectiveness within that context”

Our Journey
• Originally labelled “Finance & Probity”
• PCT, Turning Point & Trust membership
• Formation in December “slow”
• A genuinely difficult concept to grapple with

Our Journey – A Slow Start
• December meeting – no meaningful data available
• Actions centred around “grabbing some data”
• Output to make sense of that data
• Limited discussions about potential outcome measures

Our Journey – Group Re-set
• January meeting – no data produced
• Turnover, through exit, of task group members
• Further discussion of financial “dashboard” tool
• Name change (via Steering Group) to Economic Benefit
• Long list outcome measures developed
• Frustrating differences in Steering Group discussions
• Bridget Gill joined and immediately focused our thinking

Our Journey - Enlightenment
• Further input from the Steering Group
• New focus on “social Return on Investment”
• Suggested metrics
• Better “fit” membership

The “Light Bulb Moment”
• March meeting – Paula Dennison from the DH Social Enterprise Support Unit – “the missing piece”
• Fantastic definitional presentation
• Short list of outcome measures reduced to 5
• Cohort meeting to develop model further
• Further Steering Group encouragement

Social Return on Investment Model
“…the social, environmental or economic benefits which an organisation delivers sometimes called social added value….”

Social Return on Investment Model
• Distinguishes outputs from outcomes
• Identify stakeholders
• Identify impact
• Identify measures
• Be clear about assumptions
• Be clear about managing the impact

Social Return on Investment Model
• Uses impact mapping techniques
• Need to remove double counting
• Scenario plan – what would have happened anyway
• Financial values a proxy for value

Social Return on Investment Model
• Need to understand your story
• Need to understand the value you are creating
• Look how well we manage it
• We can prove it with clear evidence
Social Return on Investment Model
• Start with the impact map
• This measures the value
• Demonstrates change
• Quantifies financially

Social Return on Investment Model – THE MAP
• Stakeholders
• Inputs
• Outputs
• Outcomes
• Impacts

Social Return on Investment Model – MATERIALITY
“We do not need to include everything just what we need to make a sensible
decision”

The Outcome Measures• Reduction in crime
Focusing on acquisitive crime
• Reduction in A&E attendancesData available split by alcohol/controlled drug – accidental or deliberate poisoning
• Reduction in benefits paidMove from sickness benefit to job seekers allowance to gainful engagement, paid work or into education

The Outcome Measures
“The challenge, having identified the measures, is to impact map them within a social return on
investment model”
Outcome 1 Reduction in Crime
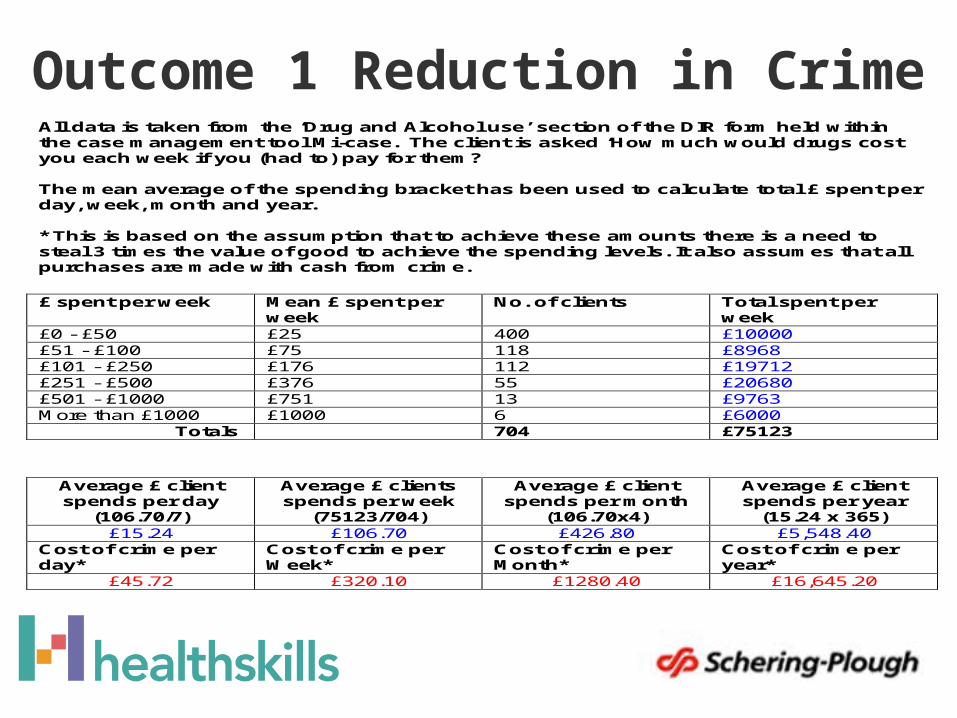
All data is taken from the ‘Drug and Alcohol use’ section of the DIR form held within the case management tool Mi-case. The client is asked ‘How much would drugs cost you each week if you (had to) pay for them?
The mean average of the spending bracket has been used to calculate total £ spent per day, week, month and year. * This is based on the assumption that to achieve these amounts there is a need to steal 3 times the value of good to achieve the spending levels. It also assumes that all purchases are made with cash from crime. £ spent per week Mean £ spent per
week No. of clients Total spent per
week £0 - £50 £25 400 £10000 £51 - £100 £75 118 £8968 £101 - £250 £176 112 £19712 £251 - £500 £376 55 £20680 £501 - £1000 £751 13 £9763 More than £1000 £1000 6 £6000 Totals 704 £75123
Average £ client spends per day
(106.70/7)
Average £ clients spends per week
(75123/704)
Average £ client spends per month
(106.70x4)
Average £ client spends per year
(15.24 x 365) £15.24 £106.70 £426.80 £5,548.40
Cost of crime per day*
Cost of crime per Week*
Cost of crime per Month*
Cost of crime per year*
£45.72 £320.10 £1280.40 £16,645.20
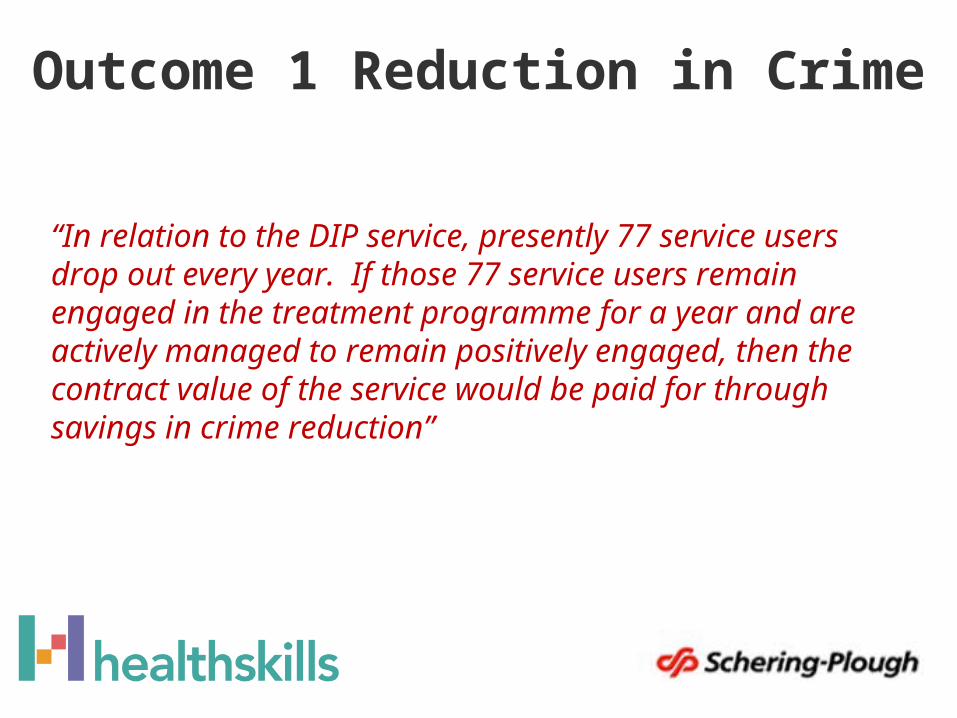
Outcome 1 Reduction in Crime
“In relation to the DIP service, presently 77 service users drop out every year. If those 77 service users remain engaged in the treatment programme for a year and are actively managed to remain positively engaged, then the contract value of the service would be paid for through savings in crime reduction”

Outcome 1 Reduction in Crime

OrganisationScope:
Name Date 01/05/2009
Impact Map Inputs Outputs Attrib % Deadwght % Impacts
Description Indicator Quantity Fin Proxy704 Adults age 18+ given custody assessment
Follow up assessmentsTreatment assessments
Treatment engagement
Reduction in drug dependency
TOPS report data collection commenced October 08
no data no data no data
Treatment careplan
Health conditions better self managed leading to reduced treatment demand
Could be monitored from medical records
no data no data no data
Retention in treatment
Reduction in A&E attendance
A&E admissions data for drug related incidences. See note
no data no data no data
Transfer to community services
extends reduction in crime figures
same as outcome 1, if people are retained for 6 months on a continued treatment programme
% of the 209
? community services est 50%
Prison liaisonRestriction on bailOutreach
Transfer outreached people to community services
Retained in treatment and out of re-offending
figures from community services teams receiving referred outreached people
% of the 77 outreached people
calculated on 77 x £426.80 x 3 x 6 months =£591544.8
£591,544.80 - 50%=£295772.4
Bev Firth-Lewis
Outcomes
£858,625 contract value
referral to wrap around services
Access to accommodation, education, training and employment
Not within scope of criminal justice service, but attribution to other providers from Turning point
Re-engagement in 12 week prog contributes to reduction in crime figures
Turning PointCriminal justice contract 2007-2008The Wakefield Substance Misuse Service is a multi-agency partnership providing a range of services for substance misusers. This impact map seeks to quantify the key outcomes achieved by the Criminal Justice Service delivered by Turning Point
Outreach re-engagement figures 77 people out of 175 outreachvisits
savings on cost of crime as outcome 1
Reduction in crime weekly crime cost saving x 209 people x 12 weeks = £802,810.80
Impact Map
Numbers of those in the criminal justice system arrested for drug related crime completing 12 weeks on the treatment programme. Assumes no crime is committed during the 12 weeks. During assessment data is recorded of what individuals spend on their weekly drug habit
Local crime stats show average cost = 3 X the value of the drug habit actual average per person PA £16,645.20
209Drug Intervention Programme (DIP) stakeholders of the SMRG are police, probation, home office, WDPCT, local authority. Entry to the service is via police referral or self referral
77 x weekly average cost of crime £320.10 for 8 weeks = £197,181.60
police referral
There is some unknown deadweight from self referrals

Outcome 2 Reduction in A&E Attendances
JOB NO: R70043301
A+E ATTENDANCES DUE TO ACCIDENTAL AND DELIBERATE POISONING/INGESTION
2007 AND 2008
TOTAL
Female Male Female Male Female Male Female Male
1 Jan to 31 Dec 2007 71 75 18 28 206 302 48 95 843
1 Jan to 31 Dec 2008 52 56 23 25 267 352 50 72 897
A+E ATTENDANCES DUE TO ACCIDENTAL AND DELIBERATE POISONING/INGESTION
APRIL 2007 TO MARCH 2009
TOTAL
Female Male Female Male Female Male Female Male
1 April 2007 to 31 March 2008 71 74 22 25 246 326 54 103 921
1 April 2008 to 31 March 2009 54 62 21 23 274 401 44 82 961
Accidental Poisoning/Ingestion Deliberate Poisoning/Ingestion
Alcohol Controlled Drug Alcohol Controlled Drug
Controlled Drug
Deliberate Poisoning/IngestionAccidental Poisoning/Ingestion
Alcohol Controlled Drug Alcohol

Outcome 3 Reduction in Benefits Paid
• Movement from sickness benefit to job seekers allowance
• Then from job seekers allowance to gainful engagement, paid work or education

Recommendations
• To understand and then impact map the A&E data
• To understand and then impact map the benefit data
• To impact map the crime data for associated groups
Progress to work Structured day
Community Young people
Shared care Prisons
Health & well being Dual diagnosis
Alcohol

Commissioning for Outcomes
Steering Group Meeting
Wednesday 27th May 2009
ECONOMIC BENEFIT TASK GROUP
Paul KingJennifer Lindsay


![NHS [Insert Name] CLINICAL COMMISSIONING GROUP … · 6 1 Introduction 1.1 Namei The name of this clinical commissioning group is NHS North West London Clinical Commissioning Group](https://static.documents.pub/doc/80x56/5f2545cc76880b0ef4609d1f/nhs-insert-name-clinical-commissioning-group-6-1-introduction-11-namei-the-name.jpg)


