1 UNCTAD REGIONAL VALUE CHAINS BACKGROUND PAPER COMMODITIES SUPER-CYCLE: IMPLICATIONS FOR SOUTH ASIA Machiko Nissanke and Sophie van Huellen School of Oriental and African Studies, University of London BACKGROUND PAPER NO. RVC 3 This study was prepared for UNCTAD’s project on ¨Development Oriented Integration in South Asia” funded by Asian Development Bank and Commonwealth Secretariat. The views in this paper are those of the author and not necessarily those of UNCTAD or its member states. The designations, terminology and format employed are also those of the author.
Transcript
1
UNCTAD
REGIONAL VALUE CHAINS
BACKGROUND PAPER
COMMODITIES SUPER-CYCLE:
IMPLICATIONS FOR SOUTH ASIA
Machiko Nissanke and Sophie van Huellen
School of Oriental and African Studies, University of London
BACKGROUND PAPER NO. RVC 3
This study was prepared for UNCTAD’s project on ¨Development Oriented Integration in South Asia”
funded by Asian Development Bank and Commonwealth Secretariat. The views in this paper are those of
the author and not necessarily those of UNCTAD or its member states. The designations, terminology and
format employed are also those of the author.
2
COMMODITIES SUPER-CYCLE:
IMPLICATIONS FOR SOUTH ASIA
Machiko Nissanke and Sophie van Huellen
UNCTAD
August 2012
Professor, Department of Economics, School of Oriental and African Studies, University of London
COMMODITIES SUPER-CYCLE: IMPLICATIONS FOR SOUTH ASIA
Machiko Nissanke and Sophie van Huellen
1. Introduction
At the beginning of this millennium, there was a significant turn round in primary commodity
prices. After two decades of low, at times of dwindling, prices, many primary commodity prices
have registered a steep increase since 2002. The marked price increases began to gather pace first
in 2002-3 and then in 2006-7, culminating in the all-time high peak in nominal terms in spring-
summer of 2008 across commodities just before the onset of the Global Financial Crisis, as
shown in Fig. 1.1 below for all commodity groups. The sharp increase in nominal prices was so
marked that it has also resulted in a sharp upturn in real commodity prices in the first decade of
the new millennium (Fig. 1.2-A), though the scale of the increase differs among commodities
and real prices of agricultural commodities are still lower than the peaks previously attained
during the Korean war and oil shocks of the early 1970s (Fig. 1.2-B).
Fig. 1.1: Monthly Commodity Price Indices by Commodity Group, Jan. 2000-May 2012 (2000=100)
5
Sources: IMF, 2012, International Financial Statistics: Commodity Price Index
This price movement over the last 10 years has led many observes to conclude that commodities
had entered into a new price super-cycle in the early 2000s (e.g. Kaplinsky, 2010). The soaring
key commodity prices hit the world economy at the time of the severe financial crisis initially
triggered by the Sub-Prime mortgage crisis in the US in the background of global
macroeconomic imbalance, which has spread to major industrial economies through poorly
regulated global financial transactions and systems. The rapidly increasing prices of basic goods
such as fuel and food had sparked off social-and political disquiets and unrest across the globe in
the immediate period preceding the global financial crisis. The rising fuel cost and food
shortages then hit particularly hard the livelihood of the urban and rural poor in developing
countries.
Fig. 1.2-A: Real Non-Fuel Commodity Prices: 1900-2015: Are Commodity Prices in Super Cycle?
Source: Brahmbhatt and Canuto, 2010
Fig. 1.2-B:Historical Trend in Real Prices by Commodity Groups
Commodity Price Indices (Real, MUV-deflated, 2000=100)
6
Notes: MUV stands for Unit-Value of manufactured goods.
Source: Baffes & Haniotis, 2010, Fig. 1
We should note, however, the extreme high volatility as an equally or even more defining feature
of commodity prices to date. At the onset of the global financial crisis in mid-September 2008,
commodity prices experienced an almost free fall across the board in the last quarter of that year.
The fear of accelerating inflation and fuel and food shortages worldwide had been suddenly
overtaken by a greater fear of global recession engulfing all economies, including those in the
developing world. Subsequently, several ‘high-profile’ commodities have continued
experiencing large swings and bounced back nearly to the pre-crisis peak level towards the
spring of 2011. As the world got concerned about the possibility of renewed food and fuel crises
that could jeopardise the fragile global recovery, commodity prices experienced a marked fall
again in connection with the sharp slowdown of the global economy amidst the worsening Euro
Zone crisis. At the time of writing of this paper in the summer of 2012, emerging agricultural
production data seem to indicate a forthcoming global shortage of supply of staple food crops.
One can therefore expect that a new short-term boom-bust cycle of commodity prices is already
in the making.
Indeed, the recent boom-bust price cycles once again highlight the high vulnerability of
commodity dependent low income developing countries (CDDCs) to price shocks and associated
difficulties in managing their economies over commodity price cycles, while placing an
escalating burden from the sudden price hike on countries heavily dependent on imported
essential commodities. Thus, both the prospect of the persistent commodities super-cycles and
the continuing extremely high price volatility will have significant implications for all
developing countries, both commodities exporters as well as commodities importers.
These concerns are of particular relevance to South Asia, a region which experienced its own
historically high growth in the last decade. The region is made up 8 heterogeneous countries: five
of them (Afghanistan, Bangladesh, Bhutan, Maldives, and Nepal) are classified as Least
7
Developed countries (LDCs), while the remaining three (India, Pakistan and Sri Lanka) as
developing countries according to the UN classification. Thus, the region covers countries with
different economic structures: India, Bangladesh, Pakistan, and Sri Lanka are relatively
diversified and large economies, compared with Bhutan and the Maldives, which are small and
specialised, and Nepal and Afghanistan, which are landlocked and largely undiversified
economies (WB, 2010). As discussed in details in Sections 4 and 5, the region contains both an
exporter and importer of several strategically important commodities. As a region, South Asia
has been largely self-sufficient in basic cereals, but emerging as a net exporter of rice and a net
importer of wheat. It is also a net importer of oilseeds but a major exporter of a number of
agricultural commodities such as tea, cotton and jute. Demand for metals and minerals have been
rising for almost all countries in the region, while India is emerging as an important exporter of
iron ore, copper and foremost petroleum products.
Given this background, the objectives of this paper is to examine various economic implications
of the recent development of these commodity prices for the region. Set against this objective,
the paper is structured as follows: in Section 2, we outline the historical trend in commodity
prices, identifying the super-cycles and their broad features in the context of commodity prices
and economic development. This is followed by discussion on the key features of recent
commodity price dynamics as comparison with earlier super-cycles and impacts on economic
development of developing countries. Section 3 presents factors explaining the increasing
volatility of commodity prices in world commodity exchanges as resulting from two interrelating
phenomena; structural change in demand-supply market fundamentals and the finalisation of
commodity markets. Section 4 outlines global regional patterns of trading in different
commodity groups (agricultural commodities, metals & minerals and energy) with focus on
South Asia, while Section 5 discusses South Asia’s role in commodity trade and changing trends
over the last decades. Section 6 then evaluates implications of super-cycles for South Asian
economies. Section 7 offers concluding remarks, including policy implications from our analyses
of commodity price cycles with some concrete policy proposals to deal effectively with
commodity-related developmental problems.
8
2. Commodity Price Dynamics
2.1 Debate in a Historical Retrospect
Historically two questions have dominated the discussions in literature on primary commodity
prices in development economics: i) the declining terms of trade in commodity export prices
relative to imports of manufactured goods from developed countries (the Prebisch-Singer
hypothesis), and ii) the high price volatility and instability. The early debate on trade and
development and the North-South economic relations in the post-war period was largely shaped
by these two questions, as they have had a profound effect on the course of economic
development and management of commodity-dependent low income developing countries.
The long term declining terms of trade of primary exports were explained by Prebisch (1950)
and Singer (1950) in terms of the fundamental differences between primary commodities and
manufactured goods both on demand and supply sides. The Prebisch-Singer hypothesis, as
known in literature, is built on conditions such as: i) the low price-and income-elasticities of
demand for commodities as compared with manufactures; ii) the technological superiority of
developed countries over developing countries; iii) the dominance in economic power
relationships of the former, which allows transnational corporations to capture excess profits;
and iv) the asymmetric impact of labour union power in developed countries and labour surplus
in developing countries on the division of the benefits of increased productivity.
Turning to these fundamental factors affecting commodity prices, Maizels (1994; 1992) explains
the sharp decline of terms of trade for primary commodities in the 1980s in terms of the
structural shifts in the demand and supply relationships in primary commodities. These are not
only due to the nature of technological changes, but also as a consequence of the two oil shocks
and the commodity booms in the 1970s and the subsequent deep recessions following
contractionary macroeconomic adjustments to major industrial economies and the ensued debt
crisis that gripped the developing world.
In a similar fashion, large fluctuations characteristic to commodity prices can be explained in
terms of frequent shocks to the fundamental demand-supply relationship of physical
commodities. Specifically, “because of the low short-term price elasticities of both supply and
demand for the great majority of primary commodities, any given disturbance in economic
activity in the developed countries, or in commodity supply, results in a greater than
proportionate change in commodity prices and export earnings of commodity-dependent
economies” (Maizels, 1994, p. 1692). Typically, for example, exogenous shocks on supply side
set-off a price cycle over medium-term, if the size of shocks is such that it cannot be absorbed
through inventory adjustments. The duration and amplitude of the price cycle is in turn
determined by the way supply would respond to the initial shock as well as the speed of
adjustments on both demand and supply sides.
9
At the same time, as CFC (2006) notes, undifferentiated basic commodities such as tropical
beverages could also exhibit a tendency to structural over-supply or over capacity from time to
time. Such over- supply condition, especially a simultaneous export expansion of basic
commodities in a number of key producing countries would depress prices in world markets, as
the ‘fallacy of composition thesis’ implies. Such a condition prevailed for several commodities in
the 1980s and 1990s, when export growth was encouraged concurrently across commodity
producing countries as a way out of the debt crisis under the Structural Adjustment Programmes.
The over-supply conditions could not be attenuated through effective international coordination
over prices and supply, as the International Commodity Agreements had become defunct over
time during this period.
However, shifts in the supply-demand relationships, such as those described above, have become
less effective on their own for explaining the ever-increasing volatilities in price movements,
observed systematically across a large number of commodities, in particular large fluctuations
found in high-frequency price data. Already in the early 1990s, there was evidence showing that
the high price volatility could result from the intensifying two-way interactions between the
commodity and financial markets. Whilst speculative activities in commodity markets exacerbate
price volatilities, key financial variables can also influence the volume of commodity stocks held
and hence price dynamics over short-run. Thus, “instability in the commodity markets and in the
financial markets feeds on each other, and constitutes an inbuilt mechanism of short-term
destabilization and uncertainty in the world economy” (Maizels, 1994, p. 1692). This two-way
interaction has been further intensified over the last two decades, and the pace of financialisation
of commodity markets has significantly accelerated in the 2000s, as commodities form a critical
part of investors’ asset portfolio, as discussed in detail in Section 3 below.
Indeed, several earlier statistical analyses which examined historical time-series data of
commodity prices up to the 1990s such as Deaton (1999) and Cashin and McDermott (2002),
consistently show that large commodity price cycles have become more frequent with shortened
duration and increased amplitude over the recent decades. For example, Deaton (1999) remarks
that “what commodity prices lack in trend, they make up for in variance”. Analysing the
behaviour of real commodity prices over the period 1862-1999, Cashin and McDermott (2002)
also find that: i) large price volatility dominates the relatively small secular decline in real
commodity prices; and ii) the real commodity index fell by four-fifths between 1900-1999,
ending the century at a record low, with an increasing annual volatility and much shorter price
cycles under the flexible exchange rate regime of 1972-99 (Fig. 2.1).1 The first characteristic is
stressed by Baffes and Haniotis (2010), concluding that price volatility indeed continues
overwhelming price trends when the data analysis is extended to cover the recent decade. The
latter also note that the long term decline in real prices had been especially marked in food and
1 Their analysis is based on the Economist’s index of industrial commodity prices - the longest dataset publicly
available. It covers textiles, metals and non non-food industrial commodities. The real index is calculated by
deflating the nominal industrial commodity-price index (dollar-based with base 1984-5=100, weighted by the value
of developed-country imports) by the GDP deflator of the United States.
10
agriculture, observing the reduction of world food prices in real US dollar terms by 53 percent
for the 5 year period (1975-6 to 2000-1) alone, as shown in Fig. 1.2-B above.
Fig. 2.1: Historical Trend in Real Commodity Prices in the Last Century (Log of real price of industrial commodities, 1826-1999)
Source: Cashin and McDermott, 2002, Fig. 6
2.2 Recent Price Swings in World Commodity Exchanges and Implications for
Economic Development of Developing Countries
As discussed in Introductory Section (Section 1) above, commodity prices have experienced one
of the most extreme swings over the past decade. The marked price increases began to gather
pace first in 2002-2003 and then in 2006-2007, culminating in the all-time peak in the spring-
summer of 2008 across commodities. The boom lasted nearly six years up to the spring and
summer of 2008, which was longer and stronger than any other boom in the last century price
developments. Table 2.1 presents summary statistics on the scale of the price boom and bust of
2002-2008 for main primary commodities.
Table 2.1: Percentage Change of World Primary Commodity Prices Between 2002-2007 and 2008 (Percentage change over previous year monthly average)
Commodity group 2002-2007a 2008
(1st half)b
2008
(2nd half)c
All commodities (excluding crude petroleum) 113 34 -35
Food 65 51 -31
Tropical beverages 67 24 -15
Vegetable oilseeds and oils 93 - -48
Agricultural raw materials 80 26 -25
Minerals, ores and metals 261 18 -41
Crude petroleum 185 52 -50
Note: Price in current dollars a Percentage change between 2002 and 2007 b Average monthly prices for half of 2008 compared 2007 monthly average c Percentage change from the peak monthly price recorded in 2008 in comparison with the November 2008 monthly price
Source: Reproduced from Table 1 of UNCTAD, 2008b
As shown in Table 2.1, the nominal price index of non-fuel commodities increased by 113
percent, while that of crude petroleum increased by 185 percent for the five year period of 2002-
11
2007. The price increases further accelerated in the first half of 2008. The non-fuel commodity
prices registered an average monthly price rise of 34 percent over the one in 2007. The steepest
increase in the first half of 2008 was for crude petroleum (52 percent) and food (51 percent) –
politically sensitive consumer goods.
Noting that the scale of cumulative nominal price increases between 2003 and 2008 (e.g. prices
of energy and metals increased by 230 percent, and food prices doubled, while prices of
fertilizers increased fourfold), Baffes and Haniotis (2010) remark that the price boom of this
period is certainly one of the longest and broadest of the post war period. There are some
similarities between the boom of 2002-8 and the previous booms. For example, Radetzki (2006)
compares the price boom of this period with the two earlier commodity booms of the last
century: the booms during the Korean War and the oil price shocks of 1973-4. The similarities
between the three booms are: i) the three booms took place against a backdrop of high and
sustained economic growth as well as an expansionary macroeconomic environment; and ii) each
was followed by a severe slowdown of economic activity; and iii) all three booms triggered
discussions on coordinated policy actions to address food and energy security concerns.2 Yet, the
recent boom is distinct from earlier commodity booms in some critical aspects, including: i) it
was not only the longest-lasting but the broadest, involving all three commodity groups, i.e.
energy, metals and agriculture simultaneously, though the increases in food prices started with
some time lags; ii) it was not followed by high inflation in the initial period of the cycle, but the
sharp price hike of strategic commodities such as food and fuels fed into higher inflation in
2007-8, hitting hard both the urban and rural poor in developing countries; and iii) it was a part
of the booms across other asset classes traded in financial and housing markets, caused by lax
monetary conditions and depreciation of the US dollar prevailed since 2001.3
Historically, booms in assets prices of this proportion cannot be sustained for too long after all,
always ending in an equally abrupt fall. The recent boom was no exception, but the scale and
speed of the fall was spectacular indeed. As the unprecedented turmoil and meltdown in financial
centres hit the headlines across the globe and the pessimism about the prospects for the world
economy started dominating in September 2008, prices across commodities plummeted sharply
(Table 2.1). Oil prices fell from over $140 dollars in early July to below $50 in November-
December 2008, and to $35-$45 in February 2009. A similar dramatic fall was reported for a
number of metal prices due to an immediate and impending reduction expected in world demand,
notably a drastic deterioration in global prospects for the construction and automobile industries.
Grain prices also declined significantly, For example, wheat prices fell from $440 a tonne in
March 2008 to $240 a tonne in November 2008, while rice prices fell from $1,000 a tonne to
$550 a tonne for the same period.
2 As cited in Baffes and Haniotis (2010).
3 See Baffes and Haniotis (2010) for further discussion on these points and macro conditions leading to the
commodity boom.
12
Commodity prices began to recover the lost ground partially in the second quarter of 2009 while
the global economy was still in a deep recession. An IMF report observed that the recovery in
commodity prices has been faster in the current economic cycle than in the previous ones, whilst
the fall in prices was by far the steepest compared to the previous five recessions across
commodities, as shown in Table 2.2 and Fig. 2.2 below. Subsequently, high price volatility
resurfaced in 2010 and a fear of another global food crisis loomed again in spring 2011, when a
numbers of commodity prices reached another hike, followed by softening prices in the global
economic slowdown amidst the Euro-Zone debt and financial crisis since then (Fig. 1.1 above).
Table 2.2: Commodity Price Developments, 2008-9
Percent Change
Peak to through Through to June 2009:Q2/2009:Q1
IMF Commodity Prices Index -55.6 31.1 15.7
Fuel -64.1 42.7 20.01
Petroleum -68.7 66.4 33.8
Nonfuel -35.5 17.5 9.5
Base metals -49.6 24.5 15.1
Agricultural raw materials -33.0 13.6 0.7
Food -33.4 19.6 10.2
Source: Reproduced from Table 1.2 of IMF, 2009
Fig. 2.2: Commodity Prices in Global Recessions and Recoveries (Percentage change indices, 2005=100)
Source: IMF, 2009, Fig. 1.17
13
The continued price volatility across commodities have been undoubtedly a major source of
instability to the world economy and made all the more difficult to ride through the global
financial crisis of 2007-9 and to secure a robust recovery worldwide since then. The highly
unstable commodity prices over the past decade have also had profound impacts on the course of
economic development of both commodity exporting and importing developing countries alike.
In particular, the recent episodes of commodity price swings remind us once again of the
importance to pay attention to the developmental challenges facing commodity dependent low
income economies, as they remain extremely vulnerable to commodity price shocks with little
resilience. Though a number of developing countries which are rich in oil and minerals,
including those classified earlier as High Indebted Poor Countries (HIPCs), have experienced a
high growth rate on average, “riding” the commodity boom since 2002, many of them have not
succeeded in decreasing their vulnerability and exposure to commodity price shocks. They have
not yet transformed economic structures through diversification in the process of creating a basis
for more articulated economies with vibrant spill-over effects economy wide. In fact, many
farmers engaged in export cash crop production have not benefited from the high agricultural
commodity prices registered in world commodity exchanges even at the height of the commodity
booms. For example, as discussed below, it has been reported that the farm gate prices paid to
small holders for cotton and coffee by private traders working as agents for transnational
corporations (TNCs) have been meagre throughout the boom period.4
While commodity dependence had generally been recognized as an obstacle to economic
development, efforts in overcoming its root causes and negative longer term effects have had
only limited success over the last 50 years at best. It was especially unfortunate that during the
debt crisis of the 1980s and 1990s, the commodity related development issues were not featured
in the global policy debate, in particular, in official positions taken by the IFIs which did take
charge of resolution of the protracted debt crisis. Though there is now a clear acknowledgement
that the high vulnerability to external shocks represents a significant developmental challenge to
fragile low-income countries, the global community has not acted specifically to deal with the
“commodity dependence trap” with its earnest through instituting a global facility to address
excessive volatilities in commodity prices and mitigate their negative developmental impacts.
Furthermore, the extremely volatile commodity prices over the last decade are not only a threat
to the fragile recovery of the global economy but also a heavy burden to low-income developing
countries that are highly dependent on imports of grains, energy and other strategic commodities
for meeting their basic needs. These import-dependent economies are equally subject to external
shocks stemming from volatile commodity price movements in their balance-of payments
management. The soaring key commodity prices in 2007-8 and 2011 hit the world economy at
the time of the severe financial crisis of the advanced economies, and the subsequent feeble
recovery of the global economy with many European countries experiencing deep double
4 . See Nissanke (2010a, 2011) for more detailed discussions on how small-holders and farmers have been
squeezed out.
14
recessions amidst the sovereign debt and euro crises. As the pass-through rate of higher import
prices to domestic prices is very high in most of countries these days as discussed in Section 6
below in relation to South Asia, the rapidly rising food and fuel prices threatened particularly
hard the livelihood of the urban and rural poor in developing countries, impeding the hard-won
progress so far achieved in meeting the MDGs. Prakash (2011) discusses the evidence for the
welfare costs of volatility. and argues that policies should be sought after taking into
consideration long term impact of short episodes of extreme market volatility: While such
episodes may be relatively rare and short-lived, they can trigger "a downward spiral of rising
vulnerability" and have massive long term implications for vulnerable countries. This
vulnerability is often linked to reliance on commodities for participation in international trade,
which remains the main economic scenario for many low income countries. If commodity issues
are continuously left unattended, the goal of achieving the food security of the poor as basic
human rights in near future - one of the critical aspirations of the global community - could be
seriously compromised in many politically and socially fragile low-income countries.
Since commodity prices governing international trade are determined in world commodity
exchanges, it is critical to examine factors behind the recent commodity price dynamics before
discussing appropriate policy responses to counteract any negative developmental impacts.
Hence, we shall now turn to examine the recent heightened volatility of commodity prices as
resulting from two interrelating phenomena: i) structural changes affecting demand-supply
fundamentals; and ii) the ever increasing finalisation of commodity markets.
15
3. Understanding Factors behind the Recent Price Dynamics5
3.1 Changing Market Fundamentals over the Last Decade
The synchronisation of sharp increases in commodity prices in 2002-2008 and again in 2009-11
indicates that common factors may be responsible for the price escalation across commodities. It
is widely accepted that the recent price increases and dynamics over the medium term reflect the
profound changes in fundamental demand-supply relationships affecting many commodities
simultaneously. In contrast to the earlier price cycles, which were typically triggered by supply
shocks, the recent structural changes are known to be mostly found in the “Asian driver” Story
on the demand side. For example, the sharp increase in prices of mineral and metals is driven by
an upsurge in demand from newly industrialising emerging economies, in particular from the two
most rapidly growing economies - China and India - due to intensive use of these raw materials
for their industrialisation drive, physical infrastructure building, and urbanisation trends
(Kaplinsky, 2010).
Similarly, there has been a steady increase in demand for agricultural products from growing
emerging economies, with a time lag of a few years compared with that for oil, minerals and
metals. Substantial increases and changing patterns in food consumption with rising per capita
income have turned these countries into substantial net importers of agricultural products. For
example, China has become a significant net importer of agricultural products, including grains,
soya beans and vegetable oils as well as raw materials such as cotton and rubber. China’s
growing demand has contributed to the steep rise in the prices of foods and other agricultural raw
materials on world markets in 2007-2008.
Further, there are common threads on the supply side too. Minerals, metals and oils have hit
supply constraints in meeting the fast growing demand, as investment in these sectors were
subdued in the 1980s and 1990s due to the historically low commodity prices. Similarly,
agricultural production has long been neglected with low investment in technology and
supporting infrastructure in many low-income developing countries, which were hit hard by the
recent rising world food prices (World Bank, 2008). Small-holder agricultural production in
many poor countries suffered also from institutional vacuums created by the economic reform
programmes in the 1980s and 1990s.6 The food price hike in 2007-8 was also aggravated by poor
harvests due to adverse weather conditions and diversion of food production to bio fuels, as
discussed below.
5 This section is drawn largely on Nissanke (2012), which examines the financialisation of commodity markets in
much more details. 6 See Nissanke (2010a) for a more detailed discussion on this with reference to coffee and cotton producers in
Tanzania.
16
A common observation can also be made with regard to inventory/stock management. For
example, the sharp price increases in 2007-2008 in major food crops took place in the context of
very low world stocks for major crops such as wheat, maize and rice (UNCTAD, 2008). Many
governments ran down grain stocks in the period preceding the food crisis in order to reduce the
cost of storage. According to data supplied by the US Department of Agricultural, global stock-
to-use ratios of several grains are known to have been historically low at the time of their
accelerated price increases in 2006-8. Similarly, the level of inventories was also running low
when the sharp rise in metal prices took place in 2005-2007.
There are also close linkages between oil prices on the one hand and agricultural and other
commodity prices on the other through associated higher transport costs and other input cost for
their production and marketing. 7
The high correlation between metal prices and energy prices is
due to high energy intensive technology used in both mineral production/extraction and the metal
sector. At the same time, there is a particular link between the rise of oil prices and that of food
prices in the recent episode (e.g. Busse et al (2011) demonstrate the evidence of correlation
between energy and rapeseed oil prices between 1999 and 2009).
The dramatic price increase in food prices, which doubled between January 2006 and May 2008,
is associated with the abrupt shift in arable land use from food crops towards bio-fuel crops in a
number of major developed economies in the face of soaring fuel prices. Subsidies available for
converting maize to ethanol in the US are reported to have encouraged this process. Vegetable
oilseeds and oils have seen a dramatic increase as food crops. Climate change, intensified by
soaring global fuel consumption, also adversely affected agricultural production in many
countries. Finally, policy measures such as export bans and other trade restrictions taken by
several food exporting countries at the height of the food crisis in 2008 have aggravated the
situation, sending prices of staple goods such as rice rocketing. Faced with escalating food prices,
various countries especially in East and South Asia where rice is a staple food, imposed export bans and
accumulated domestic reserves in order to prevent domestic food price inflation. Following the policy
action taken by these governments, small traders and consumers also started hoarding rice reserves
(Timmer, 2009). For example, India imposed restrictions on rice exports in October 2008. Export
restrictions were also imposed by Vietnam, China, Cambodia, Indonesia and Egypt, while the Philippines
imported massive amounts of rice to build up domestic reserves in fear of the food crisis predicted
(Brahmbhatt and Cristiaensen, 2008). 8
Taking into account these factors influencing fundamental demand and supply relationships,
many observers concluded that most commodities had entered into a price super-cycle in the
early 2000s. In particular, given that the recent boom is associated with more permanent shifts in
7 After rather dismissing the arguments that the dietary changes in China and India have given rise to the price
increases of food prices, Baffes and Haniotis (2010) conclude that a stronger link between energy and non-energy
commodity prices is likely to have dominant influence on commodity prices, particular food prices. 8 Unlike wheat markets, world rice markets are very thin, trading only 6-7 percent of the global production,
attracting less financial speculators. As suggested by Timmer (2009) and Brahmbhatt and Cristiaensen (2008), the
possible impacts of speculative demand on futures markets may have been indirect for global rice prices compared
to maize and wheat prices
17
demand, originating from a thirst for mineral resources and agricultural products by Asian
drivers, it was argued that commodity prices would remain high until supply capacities catch up
sufficiently with rising investment in their extraction/production. Excess demand for agricultural
products was also predicted to persist over the medium term as some supply side-factors were
found to be not necessarily of a temporary nature.
With these expectations still prevalent in summer 2008, many were caught by surprise when
commodity prices experienced such a precipitous fall in the second half of 2008, at the onset of
the deepening global financial crisis. The sharp simultaneous fall in prices across commodities
was certainly a reflection of the actual and expected shift in demand-supply relationships, as a
marked decline in global aggregate demand with the deep recession was seen as inevitable. In
particular, investors and traders on commodity exchanges undertook a swift revision of
expectations regarding the growth prospect of emerging market economies in Asia. These
countries, which were very much behind the “commodity boom” of 2002-2008, looked suddenly
fragile, as they were known to be heavily dependent on world demand and trade.
Through this connection, we suggest that the swift change in market sentiment resulting from the
increased uncertainty regarding the growth prospect of the world economy on part of all
participants, including financial investors has contributed to the “free-fall” in commodity prices
in the wake of the financial meltdown in September 2008. The crisis of confidence that seized
the global financial system prompted investors to seek “safe” investments with fast increasing
liquidity premiums. The resultant flight en masse to the “quality”- highly liquid assets - by
financial investors has led to deleveraging on a massive scale and a sharp drop in liquidity in
other asset markets, including commodity markets, and to the subsequent collapse in world trade
and economic activities. What was observed is typical of a “self-fulfilling” crisis whereby
agents’ expectations in assets markets would result in the expected events and the immediate
collapse of real economic activities, as described in a number of currency crisis models (e.g.
Obstfeld, 1996).
Consequent upon the combined effects of the fast turn-around in market sentiment and the
anticipated reversal in supply-demand dynamics, there was a massive liquidation of long
positions in commodity futures markets and the OTC deals, leading to a precipitous fall of
commodities across the board. After huge deleveraging on the part of portfolio investors for two
months, commodity prices stabilized in December 2008 and a further stockpiling of a number of
strategic commodities resulted in some rebound of their prices in the first half of 2009, even
though the world economy was still in a deep recession. Since mid-2009, prices of several
commodities such as minerals and metals, oil and agricultural raw materials bounced back
strongly, mainly due to robust recovery in demand from emerging market economies (UNCTAD,
2010), as discussed above.
18
3.2 Increasing Participation of Financial Investors in Commodity Derivatives
Markets
While there have certainly been structural changes in market fundamentals, a question frequently
raised is whether ever-increasing volatilities observed in co-movements across commodities can
be explained simply by shifts in supply-demand relationships on their own. This issue has drawn
increasing attention because the high price volatility could result from the intensifying two-way
interactions between the commodity and financial markets.
It is true that financial investors have historically always been active in holding commodities as a
part of their portfolio as Keynes (1942 ) observed. However, it is their increasingly prominent
presence in commodity derivatives markets that has changed the way their participation
influences commodity price dynamics. In particular, the fast expansion of liquid commodity
derivatives have provided investors with ideal and cost-effective means to include commodities
in their portfolios without bearing the cost of holding commodities physically, as they have to
make only a small payment of margin requirements for entry - a tiny fraction of the contract
value.
In this context, it should be noted that the heightened price volatility since the collapse of the
International Commodity Agreements in the late 1980s has led to a rapid expansion of
commodity derivatives markets, as demand for risk hedging instruments from commodity
stakeholders has intensified. The rapid growth of derivatives markets has subsequently attracted
new players - financial investors who are not engaged in the trade of physical commodities - to
the trading floors. Already in the early 1990s, there was a marked shift of speculative funds into,
and out of, commodity futures markets (Maizels, 1994). Their active participation in derivatives
markets and dealings has resulted in a radical change in the structures of trading on commodity
markets, leading to a change in the relationship between derivatives market and physical
markets.
Generally, financial investors enter commodity markets with a view to obtaining an optimal risk-
return configuration from different assets through portfolio diversification. In particular, they can
make good returns on high volatility assets in search of high risk premiums by taking a
speculative position on volatile prices. The growth of linkages between commodity and financial
markets by portfolio investors through derivatives markets and dealings, to which we refer as the
financialisation process of commodity markets, has further accelerated over the last decade or so,
as commodity derivatives markets have experienced an explosive growth. Basu and Gavin
(2011) advance two hypotheses for this phenomenon: i) commodity futures are thought as
offering hedging opportunities against equity risk given a perceived negative correlation between
returns on equity and commodity futures (the Hedging Hypothesis); ii) commodity derivatives
are used as a vehicle for obtaining higher yields from riskier assets in a low interest rate
environment (the Search for Yield Hypothesis).
19
Indeed, an explosion of derivatives markets during the past decade took place after the severe
downturn in equity markets of 2000-2002 triggered by the burst of the dot com bubble. The large
depreciation of the US dollar as well as the general low interest rate environment prevailed in
developed economies provided an added impetus away from US dollar denominated financial
assets to commodity markets, especial to oil markets. Financial institutions and private investors
operating globally have switched to commodities from equity and bond markets with the launch
of commodity index funds. This trend accelerated in 2007-2008 as the crisis unfolded in
financial markets in the US and Europe, as the flight from equities and bond markets as well as
housing mortgage markets to commodity markets took place on a large scale.
As shown in Fig. 3.1 below, there was a marked jump in the volume of derivatives trading and
deals in 2005, culminating in the price spike in 2007-2008. This expansion was in no small
measure facilitated by the deregulation of position limits previously imposed on investment
banks by the US Commodity Futures Trading Commission (CFTC) in 2000. Financial
institutions such as pension and hedge funds and sovereign wealth funds have become significant
players in commodity markets of futures and options (UNCTAD 2008a). As major currencies
were experiencing wild swings, many commodities appeared to have provided investors with a
vehicle for inflation and currency hedging.
Fig. 3.1: Outstanding Volumes of Commodity Derivatives Contracts in Futures and Options Exchanges and OTC Deals
20
Source: Updated from Chart 2.1 in UNCTAD (2011), drawn from data by Bank for International Settlements (BIS), Quarterly Review, June 2011
Further, prices of various commodities have become highly correlated with the rising share of
index trading of a bundle of commodities, in which an index is calculated according to the prices
of selected commodity futures contracts that make up the index (US Senate Committee Report,
2009). Commodity index traders - usually swap dealers active in OTC dealings mostly based at
big investment banks - sell index funds to institutions such as hedge funds and pension funds as
well as wealthy individuals, who want to invest in commodity markets without actually holding
any commodities.9
To offset their financial exposure to changes in prices, index traders buy the
futures contracts on which the index-related instruments are based. UNCTAD (2008a) reports
that the investment in commodity indices surged from less than $13 billion at the end of 2003 to
$260 billion in 2008, constituting about a quarter to one third of the notional amounts of
commodity futures at the time (Fig. 3.2)10
Fig. 3.2: Estimated Index Trader Positions and Commodity Prices, January 2006-June 2009
Source Updated from Chart 2.2 in UNCTAD (2009)
There are several features specific to commodity index trading. First, as Masters and White
(2008) argue, commodity index funds are created specifically as a vehicle for speculation on
price movement in commodity futures, not as an investment vehicle typical to other financial
futures. Further, commodity index traders tend to take continuously a long position in futures
markets by gaining the roll return and in the process pushing futures prices up in a unidirectional
9. Masters and White (2008) report that 85 to 90 percent of index positions are held by swaps dealers and that the
swap dealers are in turn dominated by four investment banks: Goldman Sachs, Morgan Stanley, J.P Morgan and
Barclays Bank, who together accounted for over 70 percent of swap dealings in 2007-08. 10 The Standard & Poor’s-Goldman Sachs Commodity Index (S&P GSCI) and the Dow Jones-AIG Commodity
Index are the most popular commodity indices: the former’s market share is just under two third, while the latter
accounts for about one third (Masters & White, 2008). These indices are based on prices of the nearest-to-expiration
futures contracts.
21
fashion.11
These factors combined are likely to have in turn contributed to price volatility and
driven many commodity prices to historic highs in the first half of 2008.
In the downturn, the dramatic decline in the outstanding OTC commodity derivatives and index
trading during the last quarter of 2008 has clearly contributed to the sharp fall in commodity
prices observed for those months (Fig. 3.1 and Fig. 3.2). The volume of OTC trading has
remained at a subdued level since then (see Fig. 3.1-B). This reflects the fact that OTC deals
involve a transaction through swap deals where contracting parties should assume counter-party
credit risks, which are still seen as risky among investors given the severity of the recent global
banking crisis. In contrast, as shown in Fig. 3.2-A, after a short period of deleveraging of net
positions, financial investors returned to commodity exchanges in 2009, actively taking their
positions in futures and options. This is driven by their renewed appetite for risk premiums
associated with commodity trading under the prevailing environment of low interest rates in
developed countries. UNCTAD (2011) provides an estimate that the commodity-related assets
under management by financial investors recorded a historic high in March 2011, to a level of
$410 billion, about double the pre-crisis level and their ratio to global GDP increased more than
four-fold in the period of 2008-2010.
Thus, trading activities in world commodity markets have undergone some fundamental changes
in both the form and the scale of links between activities in commodity and financial markets. As
UNCTAD (2011) notes, in the process, more complex commodity linked financial instruments
and products are all the time launched in response to heterogeneous and changing demand by
portfolio investors. More recently, the share of passive index trading has been diminishing
despite its increased absolute volume, as many investors have turned to a trading strategy based
on active management of commodity related funds. Irrespective of instruments used, most of
these portfolio investors tend to act as noise traders in derivatives markets, as they take trading
positions with less reference to development in physical commodity fundamentals.12
The
increased presence of noise traders could make prices excessively more volatile than warranted
by fundamentals in all asset markets. With it, the nature of commodity price dynamics might
have altered significantly over the short-run, if not in the medium term.
3.3 The Financialisation Hypothesis as an Explanation for Excess Price
Volatility
Thus, it can be argued that the unprecedented magnitude of swings and excessive volatility in
commodity prices over the past decade can be seen as a reflection of the ever increasing linkages
11 The roll return is derived from the periodic sale of futures contracts nearing expiration and the simultaneous
purchase of futures contracts bearing more distant expiration dates (the roll). The roll returns depend on market
conditions. They are positive when markets are in backwardation (when futures prices are progressively lower with
rising maturities) and negative when markets are in contango (when futures prices decline with rising maturities).
12
. See Nissanke (2012) for more definition and behavioural patterns of noise traders as opposed to informed traders who trade mostly with reference to demand-supply fundamentals of individual physical commodities.
22
between activities in commodity and financial markets. Through this process of financialisation
of commodity markets, the volatility in commodity markets and financial markets can feed on
each other and constitute an inbuilt mechanism of destabilization and uncertainty in the world
economy. In this regard, the simultaneous appearance of severe strains in both commodity and
financial markets in 2007-09 cannot be treated as a mere coincidence. Given the accelerated pace
of financialisation of commodity markets through the rapid expansion of derivatives markets and
dealings over the last 10 years, it is not surprising that the very high volatility of commodity
prices has been increasingly conjectured as being linked to this development. Fears have been
frequently expressed that speculative activities by financial investors in commodity futures
markets and OTC dealings can exacerbate price volatility.
As discussed elsewhere in detail (Nissanke, 2011, 2012), it has long been accepted that the co-
movement in commodity prices does mirror common macroeconomic shocks to inventories.
However, what is debated intensely in the excess co-movement hypothesis is whether the co-
movement is well in excess of anything that can be explained by common macroeconomic
effects such as current or expected inflation, or changes in aggregate demand, interest rates, and
exchange rates.13
In this context, we suggest that with the financialisation of commodity markets,
inventory adjustments to commodity stocks held are increasingly influenced by activities in
derivatives markets and dealings, particularly in index trading. Since financial investors opt to
hold commodities virtually through futures contracts as part of their portfolio, other asset prices
are bound to affect commodity prices. By implication we postulate that an “open interest”- that is
virtual commodity stocks held in futures contract as part of diversified asset portfolios- may
exert a significant effect on commodity prices. If so, commodity prices and their inventory
adjustments can increasingly be exposed to swings in market sentiment in asset markets in
general. Should this be the case, the excess co-movement in commodity prices may be explained
additionally by the “liquidity” effects, whereby traders operating across different asset markets
are subject to swings in market sentiment, hence to common cyclical movements in market
liquidity conditions.
Thus, commodity prices, along with prices of any assets traded globally, can be largely
influenced by market liquidity cycles in global finance. It can be argued that in commodity
markets, where both demand- and supply-elasticities are extremely low in the short-run, price
stability cannot be maintained easily and instantaneously through inventory adjustments only, as
investors’ sentiments shift. Even though financial investors do not take on physical commodity
delivery, changes in futures prices resulting from positions taken by financial investors
responding to swings in general market sentiments and liquidity cycles could therefore affect
spot prices. Besides, changes in market sentiments affecting derivatives markets and deals also
lead to an increase in precautionary demand for commodity holding, thus affecting spot prices
directly. More generally, since physical commodity stakeholders make decisions on production,
13
The analysis presented by Tang and Xiong (2011) demonstrates that co-movement of prices is significantly more
pronounced for commodities which are included in popular investor indices.
23
consumption and inventory stock management with reference to futures prices, any significant
development in derivatives markets such as a fast-expanding demand for futures contracts from
financial investors could exert strong impacts on spot prices. Indeed, Masters and White (2008)
confirm that futures prices are used as the benchmark for spot market transactions conducted by
physical traders.
Thus, the recent heightened instability common across commodities can be attributable, at least
partially, to a growing application of “destabilising” trading by financial investors to commodity
exchanges. Specifically, the recent massive swings in commodity prices could not be explained
without taking into account large-scale leveraging and deleveraging of financial investors in
commodity derivatives markets. This financilaisation hypothesis is still contentious, requiring
further empirical tests for more verification. However, a sizable number of literature have
emerged so far to confirm that the increasing presence of financial investors in commodity
derivatives markets have exerted some powerful influences on the commodity price dynamics
over the past decade or so (Gilbert, 2008; 2010; Mayer, 2009; 2012).14
14
See Nissanke (2012) for more detailed discussions on how the financialisation process can give rise to excessive
volatility in relation to market fundamentals as well as for a review of empirical literatures carried out to date on this
subject which give wide-raging mixed results, some of which confirm the financialisation hypothesis, while others
tend to refute.
24
4. South Asian and Global Regional Patterns in Commodity Trade
In the aggregate statistics, South Asia is among the fastest economically growing regions and the
most densely populated area in the world (Rasul, 2010). However, despite its remarkable
economic growth with an average GDP growth rate of 7 percent over the last decade (Fig.4.1),
the region is home to the largest concentration of people living in conditions of poverty and
conflict. In fact, the region’s recent growth record is dominated by India’s success story in
accelerating growth over the past two decades.
Fig.4.1: GDP and GDP Growth Rates in Comparison (1960-2010)
GDP in Constant 2000 US$ (1960-2010) 10 Year Average Annual GDP Growth Rate (1960-2010)
Source: World Bank, 2010, World Development Indicators
Despite its relatively small area geographically compared with other regional groups, South Asia
is home to a rich variety of geographical features including glaciers, deserts, rainforests, and
grasslands with distinct raw material reserves and potential for agricultural commodity
cultivation (WB, 2010). This diversity in geographical features, together with differences in each
country’s size, location, political circumstances, and economic situations results in different
patterns of commodity trade flows for each of South Asian economies. However, India - by far
the largest South Asian economy, which accounted for nearly 80 percent of the region’s GDP in
2008, clearly dominates commodity demand and supply patterns for the region as a whole.15
Against the backdrop of the region’s large population and fast economic growth, South Asia’s
overall share in global commodity trade is surprisingly low especially in comparison with other
emerging market regions like East and South-East Asia. The low share of South Asia in global
trade of metals and minerals may be explained by its focus on services rather than industry. The
service sector dominates in all South Asian economies but Bhutan, while value added of
industrial sectors is relatively low. This focus on services rather than industry is also reflected in
15
The data used in the text describing the region’s economic characteristics is based on World Development
Indicators (WB, 2012).
25
the relatively low demand for energy commodities. Further, India’s long pursued policy of food
self-sufficiency and high trade quotas and tariffs may have further contributed to the low overall
import and export share of the region in global commodity trade.
However, despite the low share in overall commodity trade, South Asia’s imports and exports are
significant for some commodities. Further, South Asia’s demand and supply of commodities can
be of greater importance to particular regions, even though they may not figure out prominent
globally. An example of this can be found in commodity trade with East, and South East Asian,
as well as Middle-Eastern, and African countries, which are major partners in this respect.
4.1 Food and Agricultural Commodities
The trade matrix below (table 4.1) shows import and export patterns in 2010 for food and
agricultural commodities between regions expressed in the percentage share in total imports and
exports from and to the reporting regions.16
South Asia accounted for 2.74 percent of world food
and agricultural commodity imports and 2.44 percent of world exports. This share is remarkably
reduced if excluding India as a trading partner; shrinking to 1.32 and 0.59 percent respectively.
South Asia’s share in world trade of agricultural commodities are relatively low compared to
East and South-East Asia - South Asia’s neighbouring regions - (10.35 and 10.9 percent of world
imports and exports respectively) even if excluding China which alone accounts for 7.73 and
3.56 percent of world imports and exports respectively (table 4.1.1 appendix).
For almost all regions, intra-regional trade for food and agricultural commodities has the greatest
share in overall trade. With 15.17 percent of South Asia’s exports destining in countries within
South Asia, and 4.39 percent of its imports originating from the region, South Asian is no
exception. Interestingly, if excluding India from the aggregate, the percentage share of imports
originating from other South Asian countries (inclusive of India) increases by almost 20
percentage points. Similarly, the share of exports from South Asian countries excluding India
which destine in South Asia is reduced by more than eight percentage points if excluding India
as an export partner (table 4.1). This is indicative of the great importance of India as a trade
partner for neighbouring economies in food and agricultural commodity trade.
Further, South Asia is especially important as a trading partner in food and agricultural
commodities for East and South-East Asia, West Asia, and to a lesser degree also Sub-Saharan
Africa. 9.08 percent of total West Asian food and agricultural imports originate from South Asia
and 8.97 of total East and South-East Asian exports destine to South Asia. For Sub-Saharan
Africa, 4.11 percent of its food and agricultural exports are reaching South Asia, while 3.96
percent of its imports originate from the region. Also from a South Asian perspective East,
South-East, and West Asia are crucial trading partners in food and agricultural commodities. If
including China almost 40 percent of total South Asian imports originate from East and South-
East Asia, while more than 20 percent of the regions exports destine to West Asia (another 16.62
percent to East and South-East Asia if excluding China and 26.44 percent if including China).
16
A more comprehensive analysis of trade patterns can be found in the appendix (table 4.1.1).
26
Europe is another important export partner, while South and Central America, Australia and New
Zealand (Oceania), and the United States are crucial trading partners regarding South Asian food
and agricultural imports (table 4.1).
Table 4.1: Food and Agricultural Commodities Trade Matrix
REPORTER (Percentage of respective regions’ exports/imports destining/originating to/from South Asia)
Note: Food and agricultural commodities comprise of all food items including food and live animals, beverages and tobacco, oil seeds, and animal and vegetable oils (SITC 0+1+22+4) as well as agricultural raw materials (SITC 2 less 22, 27, and 28). Further, the regional category “South Asia” does not concur with the category “Southern Asia” as defined by UNCTAD Stat. The latter category also includes the Islamic Republic of Iran in Southern Asia, while the Islamic republic of Iran in the above analysis is added to “West Asia” as a region. In the category “East & South-East Asia” China is excluded. Japan, Canada, and other countries not included in the above listed regional categories are included in “Other Regions.” The table is calculated using merchandise trade data by trading partner and product based on SITC, Rev.3 commodity classification, expressed in annual trade dollar values. The entire trade matrix is included in the appendix (table 4.1.1. appendix)
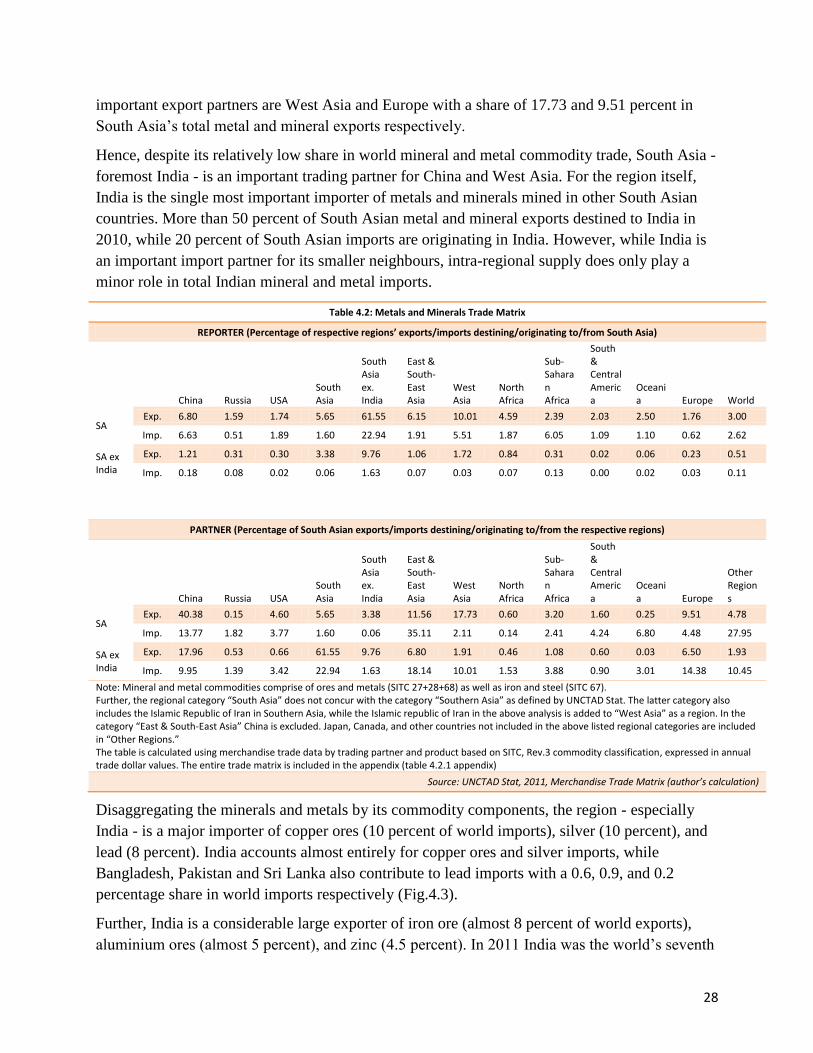
Note: Mineral and metal commodities comprise of ores and metals (SITC 27+28+68) as well as iron and steel (SITC 67). Further, the regional category “South Asia” does not concur with the category “Southern Asia” as defined by UNCTAD Stat. The latter category also includes the Islamic Republic of Iran in Southern Asia, while the Islamic republic of Iran in the above analysis is added to “West Asia” as a region. In the category “East & South-East Asia” China is excluded. Japan, Canada, and other countries not included in the above listed regional categories are included in “Other Regions.” The table is calculated using merchandise trade data by trading partner and product based on SITC, Rev.3 commodity classification, expressed in annual trade dollar values. The entire trade matrix is included in the appendix (table 4.2.1 appendix)
Note: Fuels and energy commodities comprise of mineral fuels, lubricants and related materials including coal, petroleum, gas, and electricity current (SITC 3). Further, the regional category “South Asia” does not concur with the category “Southern Asia” as defined by UNCTAD Stat. The latter category also includes the Islamic Republic of Iran in Southern Asia, while the Islamic republic of Iran in the above analysis is added to “West Asia” as a region. In the category “East & South-East Asia” China is excluded. Japan, Canada, and other countries not included in the above listed regional categories are included in “Other Regions.” The table is calculated using merchandise trade data by trading partner and product based on SITC, Rev.3 commodity classification, expressed in annual trade dollar values. The entire trade matrix is included in the appendix (table 4.3.1 appendix)
Clearly, given that India is by far the biggest economy in the region, it serves as an important
supplier as well as market for commodity imports and exports of its neighbouring countries. At
the same time, India’s own reliance on its neighbouring countries for exports and imports is low,
and hence engaged more in trade with countries outside the South Asian region.
33
5. South Asia’s Role in Commodity Trade
With the high growth rates over the last decade or so as well as the environmental and
demographic changes, the pattern of commodity demand and supply of South Asia has shifted
dramatically. At the same time, the region’s pattern reflects largely India’s, which is by far the
biggest economy in South Asia and an economic driver for the region. For energy and metal
commodities, both demand and supply capacities have concomitantly increased as the economies
have grown over the last decade. However, the region faces pressing challenges in feeding a
growing population with decreasing agricultural yields and arable land per capita. Though the
region was formerly more or less self-sufficient in production of staple food commodities such as
rice and wheat, it is becoming increasingly dependent on food imports. Changing dietary patterns
with growing income further contributes to increasing demand of nutrition-rich food
commodities besides staples.
5.1 Major Features and Overall Trends
Clearly, India is the largest economy in the region and home to 20 percent of the world’s total
population. This alone makes it a major player on global food commodity markets (WB, 2010).
However, historically, India’s food commodity imports were relatively low compared to other
densely populated regions like East and South-East Asia. Over the last decades, India has
followed a policy of self-sufficiency regarding its domestic food supply (Francis & Winters,
2008). Its agricultural sector is highly subsidised in order to achieve adequate returns to farmers
by providing incentives for production. Policies include minimum prices for key agricultural
products as well as input subsidies for electricity needed for irrigation, water, fertiliser and
pesticides.
However, such policies have made the Indian agricultural sector the most irrigation dependent in
the world, which resulted in decreasing ground-water levels in many regions (ibid.). Water
shortages has brought about new environmental challenges causing - beside other factors -
agricultural productivity to stagnate. Combined with increasing population growth, energy
shortages and preceding urbanisation these factors eventually turned India and the region as a
whole into a net importer of some food and agricultural commodities. As there is no quick
solution to the rising challenges, India’s imports of staple food and other agricultural products
are likely to increase further. Moreover, with economic growth food consumption patterns are
likely to shift from staples like wheat and rice towards a more balanced diet, including meet, oils,
and vegetables (ibid.).
As a major consumer, South Asia would have some decisive impacts on world demand for wheat
and sugar, and hence on prices especially in times of significant fluctuations in domestic
production due to weather and climate conditions. Since India lifted its export ban on rice in
1994 and one year later also on wheat, it became one of the largest rice producers globally and
34
together with Pakistan it accounts for more than one quarter of world rice exports. However, it
was only recently during the commodity price peak in 2008 that the Indian government among
others re-imposed export bans on rice and other staples (Timmer, 2009; Brahmbhatt &
Christiaensen, 2008). Such policy decisions are seen to have majorly impacts on world prices.
Given the increasing demand pressure from growing population and stagnating or decreasing
agricultural yields, such policy interventions might occur more often in the future.
South Asia could maintain its key role in global tea, cotton, and jute trade and production.
However, net exports for tea declined steadily over the years due to growing domestic demand.
For jute, net exports decreased for some time, but are increasing again recently. Intra-regional
trade is strong in both tea and jute. Unlike jute, tea is also exported to other regions, including
West Asia and to a lesser extent North America and Europe. Likewise, cotton produced in South
Asia is traded within the region in order to meet regional demand. Only recently, South Asia
became a net exporter of cotton to the rest of world.
India is clearly dominating the region’s overall trade patterns in minerals and metals. However,
India’s role in global commodity trade in this category is still relatively small, especially
compared to China. The relatively low share of South Asia as a whole and India in particular in
metal and mineral trade can be explained by the fact that economic reform policies promoted and
commenced by the Indian government since the early 1990s have favoured services over the
industrial sector (Francis & Winters, 2008). In 2010, services accounted for approximately 55
percent of India’s total GDP while industry had a share of only 26 percent. This is in sharp
contrast to China, where industry contributed 47 percent of total GDP value added (Fig.5.1.1.
appendix). Given that industrial production is a strong driver of metal demand, India’s economic
growth patterns partly explain the relatively minor role - relative to India’s share in world GDP
as well as remarkable economic growth over the last decade - in global metal demand.
However, the increasing focus on the industrial sector (WB, 2010; Francis & Winters, 2008)
coupled with India’s endowments in iron ore and bauxite may change South Asia’s role in
mineral and metal commodity trade in future. India’s steel industry is expected to grow
exponentially due to the predicted rapid growth of its economy throughout the 21st century
(Datamonitor, 2011b). Similar patterns can be expected for copper ore imports as well as copper
and aluminium production.
However, one of persistent challenges for the region’s mining and metal industry is uninterrupted
power supply, which is still a major concern not only for India (Dutta & Mukherjee, 2010).
Further, high tariffs and export bans in times of high world commodity prices as a policy tool for
domestic price control, could further hinder South Asia’s and India’s participation in global
commodity trade. During the recent price hikes for instance, the Indian government imposed not
only restrictions on grain exports but also on cement exports, in order to maintain a smooth
domestic coal supply (ibid.).
India is also the main driving force behind South Asia’s energy commodity trading patterns.
India accounted for 83 percent of South Asian total energy commodity demand and is already the
35
third largest consumer of coal and fourth largest consumer of oil in the world, though it is still far
behind the United States and China in total energy consumption. On the production side, India
accounts for approximately one percent of the global production of oil, and has 0.5 percent of
proven reserves. Likewise, for gas, India accounts for 1.1 percent of global production and 0.6
percent of world gas reserves (Francis & Winters, 2008). India, however, has significant coal
deposits and accounts for 6.6 percent of global production and 10.6 percent of global coal
reserves, making it the third largest producer of coal (behind the US and China, which together
produce 60 percent of the world’s coal) (ibid.).
Overall, India was the fourth largest energy consumer in 2009, after the United States, China,
and Russia. With increasing economic growth as well as population growth India’s energy
demand is likely to increase further in future which puts pressure on the government to ensure its
growing energy needs as a fundamental input for industry, manufacturing as well as agriculture.
The International Energy Agency estimated a total increase of 116 percent in Indian energy
demand over the period from 2007 to 2030 which should be increasingly met by nuclear energy
and gas as well as oil and coal (IEA, 2009). Given India’s low natural endowments in oil, the
dependency on oil imports - already high - is likely to increase further. Also coal imports are
likely to increase because of growing demand from its metal and mining industry for high quality
coal. Given the country’s yet untapped potential for gas production, net-imports are likely to
increase only slowly or even decrease once the Indian gas industry unleashes its potential. If
economic growth prospects of the remaining seven South Asian economies stay strong, import
dependency in coal as well as petroleum and crude oil is likely to increase for these countries.
Changing trend and prospects in specific commodities will be discussed in more details in
section b. on grains and food commodities, section c. on soft commodities and agricultural raw
materials, section d. on minerals and metals, and section e. on energy commodities.
5.2 Agricultural Commodities: Grains and Food
Rice, wheat and sugar make up 60 percent of the average daily caloric intake per capita in South Asia.
South Asia is the second largest rice consuming region in the world after East Asia with rice accounting
for 30 percent of the daily caloric intake (Fig.5.1).
Fig.5.1: Daily Caloric Intake Per Capita, South Asian Average (in 2007)
36
FAO, 2007, Food Balance Sheet: Southern Asia (author's calculation)
However, with economic growth, dietary patterns have been changing and are likely to change
further in the future (Talukder, 2005; Kumar, Mruthyunjaya, & Birthal, 2007). While rice
remains an important staple food, wheat increasingly replaces sorghum, millet, and pulses.
Further per capita consumption of vegetable oils, milk and butter as well as fish, meat and eggs,
has increased steadily since late 1980s, while rice and wheat remain the most important staple
food commodities (Fig.5.2).
Fig.5.2: Food Supply in South Asia: Crop and Livestock Products (100 kcal/capita/day, in 2007)
FAO, 2007, Food Balance Sheet: Southern Asia
South Asia as a region is a net importer of wheat and a net exporter of rice. However, within the
region, domestic demand-supply gaps and hence trade patterns are quite diverse. While Pakistan
and India are net exporters of cereals, Bangladesh and Sri Lanka are net-importers. The volatility
in the volume of annual imports and exports of cereals is very high, especially for India (Fig.5.3).
Fig.5.3: Annual Net Exports of Cereals (in million tonnes, 1980-2007)
37
FAO, 2007, Food Balance Sheet: Selected Countries (author’s calculation)
Fig.5.4 shows trends of net exports disaggregated by individual food and agricultural products in
US$ billion. The first chart confirms that South Asia is a net exporter of cereals as a whole, since
it is dominated by its net-exporter position in rice, while it is a net importer of wheat and a
relatively small exporter in other cereals. The second chart reveals that vegetable oils and
vegetables & fruits constitute increasingly significant import bills for the region, while export
earnings from fish, meat, and tea have steadily increased. On the whole, import bills of wheat,
and vegetables & fruits have started exceeding export earnings, so that the region became a net-
importer in these commodities since the mid 2000.
Fig.5.4: Annual South Asian Net Exports of Selected Food and Agricultural Commodities (in billion US$, 1995-2010)
Note: The category “South Asia” comprises Afghanistan, Bhutan, Bangladesh, India, Maldives, Nepal, Pakistan, and Sri Lanka and hence does not correspond to the UNCTAD Stat category “Southern Asia.”
Source: UNCTAD Stat, 2011, Merchandise Trade Matrix: South Asia (author’s calculation)
According to the food balance sheet published by FAO Stat, for seven out of eight South Asian
countries rice is among the three most important food crops produced annually measured in
tonnes for 2000-2007. India is the second largest rice producer worldwide after China, and
together with Pakistan it is the largest rice exporter of the South Asian region (Fig.5.5). India
increased its domestic rice production from 50 million tonnes in 1980 to almost 100 million
tonnes in 2007. Bangladesh also more than doubled its rice production over the same period from
38
14 million tonnes to 29 million tonnes. India and Bangladesh are the two biggest South Asian
rice producers. However, only since the mid-1990s India has become a net exporter of rice,
exporting about 6 percent of its total production. Bangladesh remains a net importer despite its
rising production level. Pakistan’s large export share in rice is a result of its lower domestic
consumption of rice so that more than 50 percent of domestic production could be exported in
2007according to FAO Stat.
According to UN Comtrade data, which provide detailed breakdown by trading partners,
Bangladesh, Saudi Arabia and the United Arab Emirates are the major destinations of Indian rice
exports.17
Other major importers of Indian rice include Nigeria, Kuwait, Iran, United Kingdom,
Nepal, Sri Lanka and Madagascar. 18
For Pakistan, three major export partners, measured in
trading volume were United Arab Emirates, Iran, and Kenya for 2003 to 2010. In terms of export
values Saudi Arabia replaces Kenya as the third most important market for Pakistani rice exports,
followed by Afghanistan (fourth largest importer of Pakistani rice over the period), Oman and
Qatar as well as several African countries (e.g. Cote d’Ivoire, Mozambique, South Africa, and
Madagascar). Indian rice exports accounted for 9.2 percent of world rice exports (in kg) in 2010,
which made it the world’s fourth largest rice exporter, right after Pakistan with a share of 15.5
percent of world exports. Indian and Pakistani rice exports were only outperformed by Thailand
(33 percent) and the United States (17 percent). Hence, India and Pakistan are important rice
suppliers, not only to South Asian, but also to East and South-East Asian, African and Middle
Eastern countries. Pakistani and Indian exports ensure rice supply around the Arabian Sea and
Indian Ocean among which major trading partners (except the United Kingdom) are located.
Fig.5.5: Annual Net Rice Exports by South Asian Countries (in million tonnes, 1980-2007)
India is the only country in the region with a considerable large metal and mining industry. All
other countries are net importers of aluminium, iron and steel, coal and base metals (lead, zinc,
copper, nickel, and tin). As shown in figure 5.11, South Asia as a region became a major
exporter of iron ore and to a lesser extent copper since 2002 and 2005 respectively, while it is net
importer of copper ores and concentrates, which increased substantially since 2003. It also
imports iron & steel as well as silver since then, registering a significant increase in value terms.
43
In 2011 India has become the world’s seventh largest aluminium producers, fourth largest zinc
producer, and fourth largest iron ore producer (USGS, 2011). As of May 2012 India is among the
five largest crude steel producers with 6.2 million tonnes of output, which is roughly 4.75
percent of global steel supply, after registering an annual growth of 4.24 percent in production.
This production level is similar to Russia’s and only slightly lower than production in the United
States (Worldsteel, 2011; Worldsteel, 2012). However, India’s production is only one-tenth of
China’s steel output which accounts for 47 percent of global production (ibid.). Besides India,
Bhutan and Nepal are also exporters of iron & steel, which accounts for 40 percent of Bhutan’s
export earnings and for 12 percent of Nepal’s export earnings in 2010 (Fig.5.1.2 appendix).
Although for both countries iron & steel exports are important, they are marginal exporters in
relation to world iron & steel trade.
Fig.5.11: Annual South Asian Net Exports of Selected Minerals and Metals (in billion US$, 1995-2010)
Note: The categorisation “South Asia” comprises of Afghanistan, Bhutan, Bangladesh, India, Maldives, Nepal, Pakistan, and Sri Lanka and hence does not correspond to the UNCTAD Stat category “Southern Asia.”
Sources: Afghanistan: Central Statistics Organization, Afghanistan Statistical Yearbook (various years)/DA Afghanistan Bank, Quarterly Economic and Statistical Bulletin (various quarters); Bangladesh: Bangladesh Bureau of Statistics, Monthly Economic Trends; Bhutan: Royal Monetary Authority Bhutan, Selected Economic Indicators (various volumes); India: Office of the Economic Adviser, Ministry of Commerce & Industry, Government of India, Index Numbers of Wholesale Prices in India - by Groups and Sub-Groups (various month); Maldives: Maldives Monetary Authority, Monthly Statistics (various month), Consumer Price Index - National; Nepal: Nepal Rastra Bank: Monthly Inflation Data: National Urban Consumer Price Index (various month); Pakistan: State Bank of Pakistan: Statistical Bulletin: Selected Economic Indicators (various month); Sri Lanka: Department of Census and Statistics Sri Lanka: Colombo Consumer Price Index: Inflation Sub-Group (base 2002=100)
In mid-2008 Bhutan’s inflation rate peaked at 12.5 percent, food-price inflation in the Maldives
reached almost 30 percent, while for Sri Lanka food inflation peaked at 40.2 percent then
(Fig.6.6). Although less dependent on food imports than its smaller neighbours, for Pakistan the
pass-through rate of world food prices to domestic prices was also high. Food price inflation
there peaked 34.1 percent in mid-2008. India acted to counteract food inflation in 2007-8 by
significant policy interventions such as export ban and subsidies, though inflation of fuel and
energy prices could not be prevented.
In figure 6.7 we show our estimates of average producer prices for various agricultural
commodities across South Asian countries. Producer prices increased from 2002 onwards in all
countries. However, recalling domestic inflation patterns, the increase in producer prices is
largely offset by high inflation.
Fig.6.7: Average Producer Prices Selected Commodities for South Asian Countries (in US$/tonne, 1991=100, 1991-2009)
Source: FAO, 2009, Producer Prices
While high food and agricultural commodity prices might be thought to be beneficial for farmers,
poor households even in rural areas of South Asia are net-buyers of food and hence strongly
affected by rising food prices (WB, 2010). Further, although producer prices were increasing,
producer profits were squeezed by higher input costs. Rising input prices offset any gains in
producer prices not only for the agricultural but also for the industrial sector (Datamonitor,
2011a). For example, price volatility on global markets for essential input factors like coal is an
increasing burden for the industry (Dutta & Mukherjee, 2010). Steelmakers recently broke a 40-
year tradition of annual pricing in favour of adopting a contract system based on a quarterly
index of iron ore and coking coal prices (Datamonitor, 2011b). This is probably the industry’s
62
reaction to increasing price risk induced by high price volatility. This would leave especially
steelmakers vulnerable to significant price risk (ibid.).
Especially for smaller South Asian economies, highly dependent on commodity imports, the pass
through rate of global commodity prices to domestic prices is high. Such high inflation rates
disproportionally affect the poor and vulnerable non-poor households (WB, 2010). Safety net
programs and food and energy subsidies are costly, imposing an increasing fiscal burden, putting
high pressure on the countries’ balance of payments and causing depletion of foreign reserves.
63
7. Concluding remarks
7.1. Overall findings of commodities related issues facing South Asia
South Asia’s share in global commodity trade is still much smaller than its neighbouring regions
such as East and Southeast Asia.. Further, while several countries of the region other than India
such as Bangladesh, Bhutan, Sri Lanka, and Pakistan are a significant player in global trade of
food and agricultural commodities, trade in mineral and metals as well as in fuels and energy
commodities is dominated by India alone. South Asia’s trading in commodities are conducted
more with East, South-East, and West Asia as well as Sub-Saharan Africa than with advanced
economies such as those in North America or Europe. Furthermore, since intra-regional trade
contributes to a large share of overall commodity trade in South Asia, many smaller countries in
the region are heavily dependent on commodity imports and exports from India or Pakistan.
Overall, given that India is by far the biggest economy in the region, it serves as an important
supplier as well as market for commodity imports and exports of its neighbouring countries. At
the same time, India’s own reliance on its neighbouring countries for exports and imports is low,
and hence engaged more in trade with countries outside the South Asian region. Hence, the
region’s overall pattern in commodity trade with outside world reflects largely India’s, which is
by far the biggest economy in South Asia and an economic driver for the region.
With the high growth rates over the last decade or so as well as the environmental and
demographic changes, the pattern of commodity demand and supply of South Asia has shifted
dramatically in recent years. For energy and metal commodities, both demand and supply
capacities have concomitantly increased as the economies have grown over the last decade.
However, the region faces pressing challenges in feeding a growing population with decreasing
agricultural yields and arable land per capita. Historically India has followed a policy of self-
sufficiency in food with its subsidised agricultural sector through policies of minimum prices for
key agricultural products as well as input subsidies. India’s food commodity imports are
relatively low compared to other densely populated regions like East and South-East Asia. Since
India lifted its export ban on rice and wheat in mid 1990s, it became one of the largest rice
producers globally and together with Pakistan it accounts for more than one quarter of world rice
exports. Smaller countries in the region have become heavily dependent on these larger
economies’ supply capacity. Hence, India’s decision to re-impose export bans on rice and other
stables during the commodity price peak in 2008 had major impacts on prices and availabilities
of staple foods in these smaller economies as well as on world prices of these commodities.
India is clearly dominating the region’s overall trade patterns in minerals and metals as well,
though India’s role in global commodity trade in this category is still relatively small, especially
compared to China. However, this may change in future as India’s focus on restructuring its
historically service based economy. In this regard, India as well as other countries in the region
64
face one of persistent challenges for developing mining and metal industry with more secure
power supply.
India is also the main driving force behind South Asia’s energy commodity trading patterns,
accounting for over 80 of South Asian total energy commodity demand. Today, it is the fourth
largest overall energy consumer, the third largest consumer of coal and fourth largest consumer
of oil in the world, though its share in global trade of energy commodities are much smaller
compared with China, the US or Russia with significant coal reserves and domestic production.
With increasing economic growth as well as population growth India’s energy demand is likely
to increase further in future which puts pressure on the government to ensure its growing energy
needs as vital inputs for industry, manufacturing as well as agriculture. Given India’s low natural
endowments in oil, the dependency on oil imports - already high - is likely to increase, as it has
become a significant exporter of petroleum products with its increasing refinery capacity. Also
coal imports are likely to increase because of growing demand from its metal and mining
industry for high quality coal.
Given the overall picture of the region’s patterns of commodity trade as well as domestic supply-
demand balances, South Asia can be a net exporter or net importer depending on the commodity
in question. In this regard, it can be either winners or losers from commodity price movements,
in terms of implications of commodity price super-cycle for the region’s balance of payments.
However, the high price volatility of commodity prices has definitely posing a significant threat
to the region’s security of strategic commodities such as food and fuels as well as to
macroeconomic stability. High levels and extreme volatility of commodity prices would impose
severe constraints on the region’s aspiration for accelerating industrialisation and sustaining
economic growth as well as their ambition to provide access to foods as basic human rights to
growing population and to achieve significant poverty reduction. Smaller countries in the region
are subject to much higher vulnerability to price shocks as their pass-rate of import prices to
domestic inflation is high. They are also highly vulnerable to trade policies adopted by the larger
neighbours as their dependence on intra-regional trade for supply of basic commodities is very
high. Since only a slight increase in food prices could throw both the urban and rural poor under
the poverty line in South Asia, high and increasing import dependency would make many South
Asian countries most vulnerable to global food price movements.
7. 2. Policy Implications
With the sharp swings and continued high volatility of commodity prices affecting the course of
the global economy in the new millennium, the “commodities and development” are back to the
international policy agenda. The “revival” of interests in this topic could potentially make an
important difference to the plight of low-income developing countries. Especially, this is because
the commodity related development challenges facing these countries were eclipsed by the
dominant “free trade and globalisation” agenda in international policy discussions throughout the
1980s and 1990s. At this historical juncture, we should remind us that formulating appropriate
policies to address the “commodity” issues for development would require an in-depth
65
understanding of the nature and sources of structural vulnerability of these developing countries
when they are exposed to shocks originating in world commodity markets as either exporters or
importers.
From this perspective in mind, the paper examined the historical evolution and the recent
developments in commodity markets, trade and production, before discussing specific cases
facing developing countries in South Asia. At the country level, effective commodity sector
specific development strategies should be built around realistic and practically feasible goals.
These goals should be set with the overall objectives of reducing the degree of exposure to
shocks as well as building the resilience at micro and macro levels through persistent and
innovative investment in productive capacity. Hence, any commodity sector-specific
interventions should be incorporated into a country’s overall development strategy in improving
agricultural productivity, poverty reduction and sustainability of its growth and development
path. Furthermore, to be effective in fast-changing commodity markets, policy makers would
need to undertake continuous assessments and filtering of available intervention instruments in
relation to prior agreed indicators of commodity related vulnerability with its negative feedback
loop identified in a country specific context.
We should bear in mind that market-based solutions and instruments do not necessarily provide
fragile countries and fragmented producers with workable solutions to improve their
competitiveness in commodity production and trade with reduced risks of exposure to huge
shocks from price volatility. Greater attention should be paid to building the resilience of
commodity producers and consumers through rigorous investment in sustained productivity
growth and institutional capability for creating an economic base for advancing social
development goals. Given South Asia’s high degree of intra-region trade in commodities, it is
also important to achieve much more coherence and coordination in policy responses to
commodity price shocks within the region.
Further, it is important to note that the continued extreme volatility of commodity prices has
become a major source of instability to the world economy. The highly unstable commodity
prices over the past decade have also had profound impacts on the course of economic
development of both commodity exporting and importing developing countries alike. The
instability originating from world commodity exchanges have added considerable strains and
setbacks on the progress in socio-economic development in low income developing countries
worldwide. The sharp price rise of strategic commodities such as grains and fuels hit particularly
hard poor countries heavily dependent on imports of these commodities.
Because the problems associated with excessive volatility of commodity prices and the resulting
income instability have global dimension and implications, there is a strong case for coherent
global policies and actions. As examined and discussed in details in Nissanke (2010b, 2012),
the global community should seriously consider establishing two new global facilities to address
commodity related development issues collectively: a) innovative stabilisation schemes through
virtual intervention to reduce large swings of commodity prices, well in excess of what could be
explained in demand-supply fundamentals of individual commodities and standard
macroeconomic variables; and b) a new compensatory financing facility such as a state-
contingent compensating facility as a basis for counter-cyclical macroeconomic demand
management to mitigate negative impacts of income instability associated with exogenous
shocks such as large price swings of strategic commodities. Both schemes discussed therein
have innovative elements to suit a new challenge in this millanium.
66
An establishment and successful operation of these schemes would depends on the political
exigency and willingness of the global community to support innovative schemes to reduce
excessive price volatility and income instability that have derailed socio-economic development
of low-income countries so far. It can be recalled that the lack of strong political and financial
support has led to the demise of the earlier stabilisation mechanisms and compensatory financing
facilities. It is no longer acceptable to let low income countries to bear large share of global costs
of volatility and instability originating in world commodity exchanges, where large financial
investors exert considerable influences on price dynamics in pursuit for high private returns on
high frequency transactions. This demands a new international policy framework that contains a
series of concerted global actions to address commodity related development challenges at
source. As often the case, power and will to counteract destabilizing market forces still lies
largely with developed nations. Without a radical change of their mindsets and approaches to
commodity related development challenges, the world's poorest people will continue to pay the
highest price and socio-economic development of low-income developing countries cannot be
placed in a secure and sustainable path. Emerging market economies such as India are now
acquiring more voices in global economic issues. They are now in a position to exercise their
rights and responsibility to debate actively appropriate policy actions to overcome commodity
related development challenges as both exporters and importers by representing interests of the
developing world as a whole.
67
8. Bibliography
ADB, A. D. (2012). Asian Development Outlook 2012: Confronting Rising Inequality in India.
Mandaluyong City: Asian Development Bank.
Baffes, J., & Haniotis, T. (2010). Placing the 2006/08 Commodity Price Boom into Perspective.
Washington D. C.: World Bank, Policy Research Working Paper 5371.
Basu, P., & Gavin, W. T. (2011). What Explains the Growth in Commodity Derivatives. Federal
Reserve Bank of St. Louis Review, January/February 2011, 93(1) , 37-48.
Brahmbhatt, M., & Canuto, O. (2010). Natural Resources and Development Strategy after the
Note: Food and agricultural commodities comprise of all food items including food and live animals, beverages and tobacco, oil seeds, and animal and vegetable oils (SITC 0+1+22+4) as well as agricultural raw materials (SITC 2 less 22, 27, and 28). Further, the regional category “South Asia” does not concur with the category “Southern Asia” as defined by UNCTAD Stat. The latter category also includes the Islamic Republic of Iran in Southern Asia, while the Islamic republic of Iran in the above analysis is added to “West Asia” as a region. In the category “East & South-East Asia” China is excluded. Japan, Canada, and other countries not included in the above listed regional categories are included in “Other Regions.” The table is calculated using merchandise trade data by trading partner and product based on SITC, Rev.3 commodity classification, expressed in annual trade dollar values.
Note: Mineral and metal commodities comprise of ores and metals (SITC 27+28+68) as well as iron and steel (SITC 67). Further, the regional category “South Asia” does not concur with the category “Southern Asia” as defined by UNCTAD Stat. The latter category also includes the Islamic Republic of Iran in Southern Asia, while the Islamic republic of Iran in the above analysis is added to “West Asia” as a region. In the category “East & South-East Asia” China is excluded. Japan, Canada, and other countries not included in the above listed regional categories are included in “Other Regions.” The table is calculated using merchandise trade data by trading partner and product based on SITC, Rev.3 commodity classification, expressed in annual trade dollar values.
Note: Fuels and energy commodities comprise of mineral fuels, lubricants and related materials including coal, petroleum, gas, and electricity current (SITC 3). Further, the regional category “South Asia” does not concur with the category “Southern Asia” as defined by UNCTAD Stat. The latter category also includes the Islamic Republic of Iran in Southern Asia, while the Islamic republic of Iran in the above analysis is added to “West Asia” as a region. In the category “East & South-East Asia” China is excluded. Japan, Canada, and other countries not included in the above listed regional categories are included in “Other Regions.” The table is calculated using merchandise trade data by trading partner and product based on SITC, Rev.3 commodity classification, expressed in annual trade dollar values.
Fig.5.16.1: Sources of Domestic Energy Production per Country and Domestic Energy Use in South Asia (annually, 1971-2008)
81
Source: WB, 2011, World Development Indicators
Fig.5.17.1: Bangladesh Total Primary Energy Supply (ktoe) and Import Percentage Share (annually, 2000-2009)
82
Source: International Energy Agency (2011): Energy Balances of Non-OECD Countries (author’s calculation)
Fig.5.17.2: India Total Primary Energy Supply (ktoe) and Import Percentage Share (annually, 2000-2009)
Note: Total Primary Energy Supply comprised of total domestic production plus net-imports plus/minus stock changes. Oil products are not included in the percentage import shares as India is a net-exporter.
Source: International Energy Agency (2011): Energy Balances of Non-OECD Countries (author’s calculation)
Fig.5.17.3: Nepal Total Primary Energy Supply (ktoe) and Import Percentage Share (annually, 2000-2009)
83
Source: International Energy Agency (2011): Energy Balances of Non-OECD Countries (author’s calculation)
Fig.5.17.4: Pakistan Total Primary Energy Supply (ktoe) and Import Percentage Share (annually, 2000-2009)
Source: International Energy Agency (2011): Energy Balances of Non-OECD Countries (author’s calculation)
Fig.5.17.5: Sri Lanka Total Primary Energy Supply (ktoe) and Import Percentage Share (annually, 2000-2009)
84
Source: International Energy Agency (2011): Energy Balances of Non-OECD Countries (author’s calculation)