26
Commodity Futures of Soybean and Aluminium Group No. 3
| Date post: | 15-Jul-2015 |
| Category: |
Presentations & Public Speaking |
| Upload: | harshad-shelar |
| View: | 108 times |
| Download: | 1 times |
Commodity Futures of Soybean and
Aluminium
Group No. 3

INTRODUCTION
Soybean is an important global crop and processed soybean is the largest source of
protein feed and second largest source of vegetable oil in the world.
The major portion of the global and domestic crop is solvent-extracted with hexane to
yield soy oil and obtain soymeal, which is widely used in the animal feed industry. It is
estimated that above 85% of the output is crushed worldwide.
Soybeans derivatives are found in hundreds of human foods, animal feeds and industrial
Products.
The cultivation of soybean is successful in climates with hot summers, with
temperatures between 20°C to 30°C being optimum. Temperatures below 20°C and
over 40°C are found to retard growth significantly.
Though, a very small proportion of the crop is consumed directly by humans, soybean
products appear in a large variety of processed foods.
It can grow in a wide range of soils, with optimum growth in moist alluvial soils with a
good organic content.
Modern soybean varieties generally reach a height of around 1 m (3 ft), and take 80-120
days from sowing to harvesting.

The annual global soybean production has been in the range of 210-230 million tonnes in the recent years, accounting for 55-58% of total global oilseed output of around 390-400 million tonnes.
US, Brazil, Argentina, China and India are the major producers in order of production with production in these countries ranging around 70-80, 55-60, 32-48, 14-16 and 8-10 million tonnes in the recent couple of years.
Weather, acreage under other competitive crops like corn, cotton and pests & diseases are the major factors influencing production.
While in US, India and China crop starts arriving from Aug-Sept, it starts from Jan-Feb in S. America.
The annual global trade in soybean is estimated to be around 70-80 million tonnes
While, USA (30 -35 million tonnes), Brazil (23-28 million tonnes), Argentina (5-15 million tonnes) are the exporters of beans, China (35-40 million tonnes) and EU (12-16 million tonnes) are the major importers.
In addition to soybean, soy oil and soymeal are also widely traded globally with annual trade of around 9 million tonnes and 52 million tonnes respectively. While, US is the largest exporters for soybeans, Argentina is the largest exporter of soy oil and soy meal globally
Global Scenario
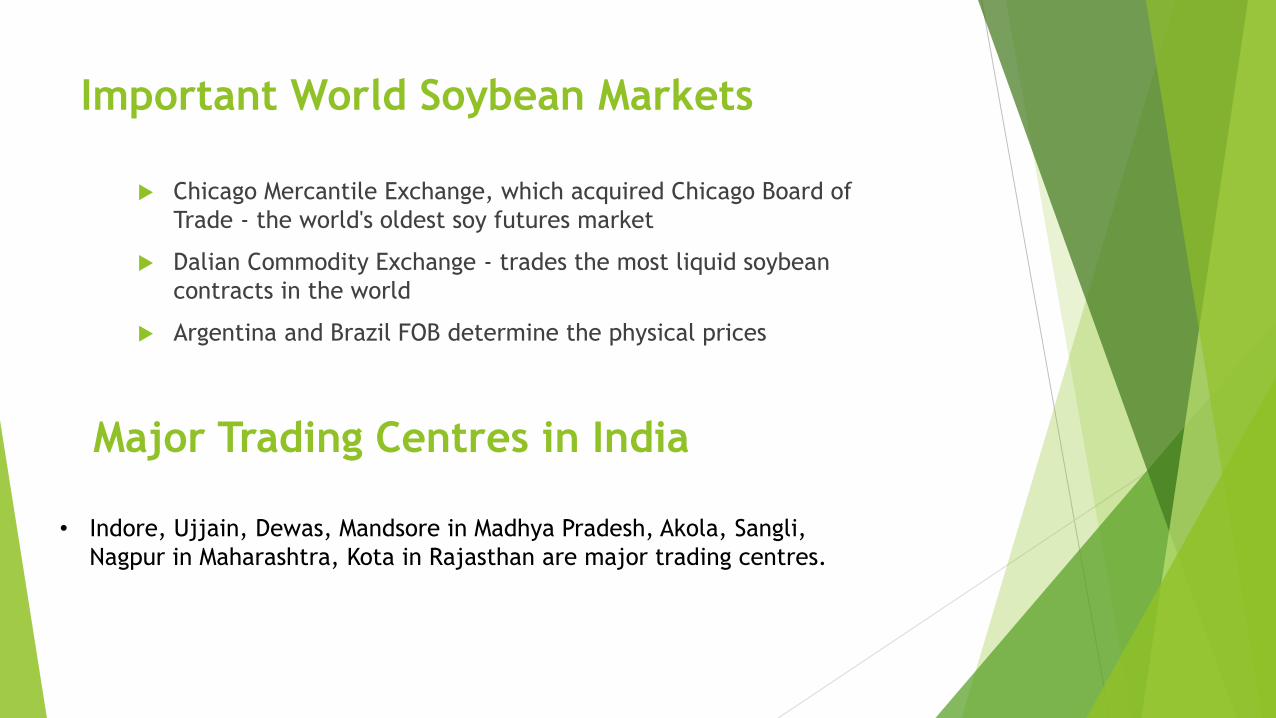
Important World Soybean Markets
Chicago Mercantile Exchange, which acquired Chicago Board of
Trade - the world's oldest soy futures market
Dalian Commodity Exchange - trades the most liquid soybean
contracts in the world
Argentina and Brazil FOB determine the physical prices
Major Trading Centres in India
• Indore, Ujjain, Dewas, Mandsore in Madhya Pradesh, Akola, Sangli,
Nagpur in Maharashtra, Kota in Rajasthan are major trading centres.

(Rounded figs.) Global India % Share
(In million tons)
Soybean Production 230 9 4
Soybean Trade 75 0 0
Soy Oil Production 35 1.5 4
Soy Oil Imports 9 1 11
Soy Oil Exports 9 0 0
Soy Meal Production 150 7 5
Soy Meal Exports 52 3.5 7
Soy Meal Imports 52 0 0
India in World Soy Industry

Indian Scenario
India's annual production of soybean has been around 8.5-10 million tonnes in the recent years with India's production in 2009-10 estimated to be around 8.9 million tonnes by the Government of India.
The acreage under this crop has more than doubled in the past two decades to around 11 million hectares currently being sown under this crop, with better returns encouraging more farmers to adopt this new crop.
Madhya Pradesh, Maharashtra, Rajasthan and Andhra Pradesh are the major cultivators of this important oilseed, with their respective contributions usually around 60%, 25%, 6-7% and 1-2%.
Soybean is exclusively grown in the khariff season in India, with sowing taking place after the first monsoon showers in late June or early July. Sowing can extend unto end of July in different parts of the country.
The harvesting commences from September, with Maharashtra reporting the earliest arrivals. October and November are the peak arrival months, with all-India arrivals crossing 10 lakh bags of approximately 90 kg on the peak arrival days.
The production is dependent on the monsoon and fluctuates between years.
India is highly dependent on imports to meet domestic edible oil requirement. Government policies are in favour of developing the domestic crushing industry and supporting Indian farmers and do not promote import or export of soybean. Thus, there is virtually no import or export of soybeans.
However, India out of its total soymeal production of around 6.5-7 million tonnes, exports around 3.5 million tonnes with Vietnam, Japan, Thailand, Indonesia, UAE, Greece being the major importers.

Market Influencing Factors Domestic prices are highly influenced by the global price movements, with
prices highly correlated with the CME prices.
Fundamentally, weather at all producing centres, domestic and international is
the most crucial factor, with the pod bearing period, being the most crucial.
United States Department of Agriculture makes progressive assessment of crops,
stocks, global supply and demand and releases regular reports, which are widely
looked upon by the global market to determine prices.
The other major influencing factor is the prices of soy oil and soymeal, which are
in-turn dependent on the fundamentals of global edible oil and global animal
feed industry.
Locally, prices are influenced by currency fluctuations, weather, acreage, pest &
diseases, production estimates by industry associations, Government agencies.
India imports more than 60% of its entire edible oil requirement and the entire
edible oilseed and oil sector is a highly sensitive sector. Thus, new Government
policies and apprehensions about new policies have a strong sway over prices,
during periods when new announcements are made or are about to be made.
The supply-demand and price scenario of competitive oils, viz., palmoil.
The crush margin between meal, oil and seed

Type of Contract
Futures Contract
Name of
commodity
Soy Bean
Ticker symbol
SYBEAN2MT
Trading System
NCDEX Trading System
Basis
Ex-Warehouse Indore exclusive of Sales taxes
Unit of trading
2 MT
Delivery unit
2 MT
Maximum Order
Size
500 MT
Quotation/base
value
Rs per quintal
Tick size
Rs. 1
Quality
specification
Moisture : 10 % basis, 12% Maximum
Foreign Matters : 2 %
Damaged : 2 %
Green Seed : 7 %
Quantity variation
+/- 2%
Delivery center
Indore (within a radius of 50 km from the municipal limits)
Additional delivery
center
Akola, Nagpur, Latur (Maharashtra);Itarsi, Sagar, Vidisha,
Mandsaur (MP); and Kota (Rajasthan) Location Premium/Discount as notified by the Exchange
from time to time.
Trading hours
As per directions of the Forward Markets Commission from
time to time, currently - Mondays through Fridays :10:00 AM to 05:00 PM
The Exchange may vary the above timing with due notice
Contract Specification of SOYBEAN – NCDEX

CME Soybean Futures Contract Specs

Contract Launch Calendar Soybean – (2MT)
Contract Launch Month Contract Expiry Month
June 2014 January 2015
July 2014 February 2015
October 2014 April 2015
November 2014 June 2015
December 2014 August 2015
February 2015 October 2015
March 2015 No Launch
April 2015 November 2015
May 2015 December 2015
NCDEX

Soybean Futures
NCDEX
Rs/Qtl
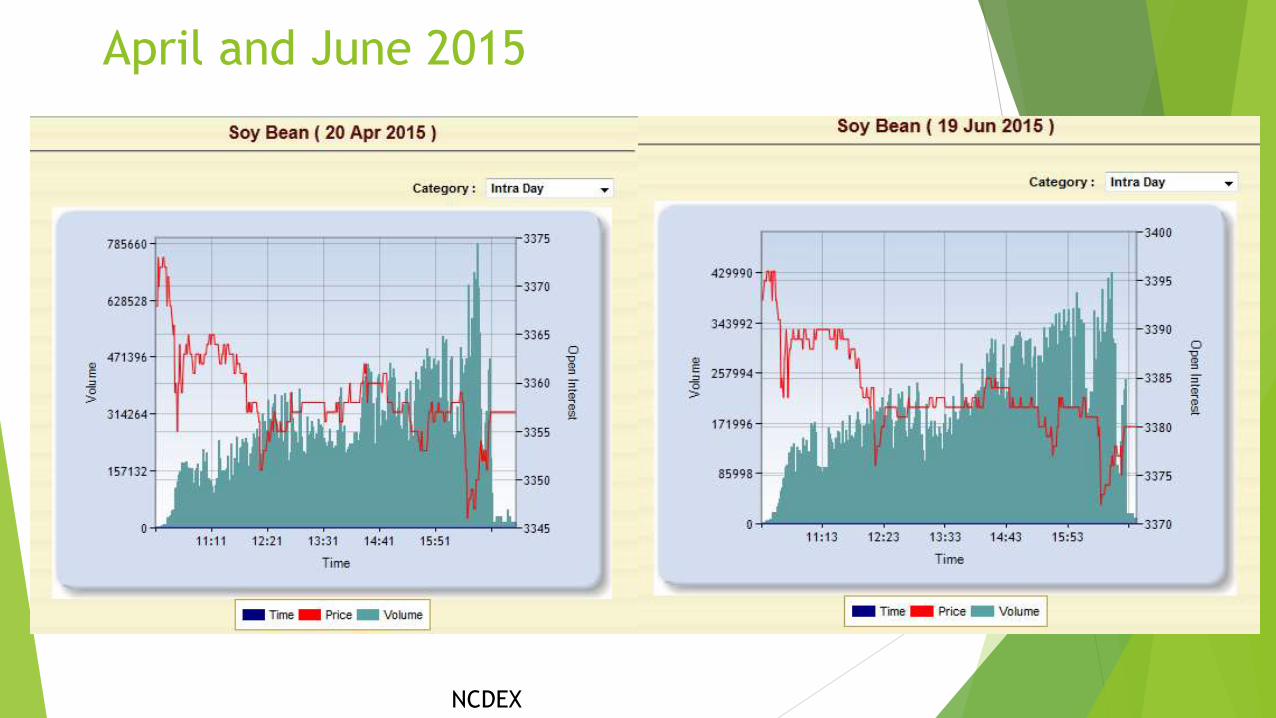
April and June 2015
NCDEX

August and October 2015
NCDEX

CME Soybean Future$/bushel
Aluminium
INTRODUCTION
Aluminium (chemical symbol - Al) is the third most abundant element present in the earth's crust.
It exists in a very stable combination with other materials particularly silicates and oxides.
It is resistant to common atmospheric gases and a wide range of liquids. Hence, aluminium is known for its durability and high resale value.
Aluminium is a unique metal; which is light weight, strong, durable, flexible, and impermeable. It is rust resistant and is 100% recyclable
Demand and Supply
In 2012, global primary aluminium production was 40.974 million metric tonnes (MMT), up from 39.930 MMT in 2011.
Global primary aluminium consumption rose to 48.075 MMT in 2012, compared with 44.594 MMT in 2011
Global Scenario
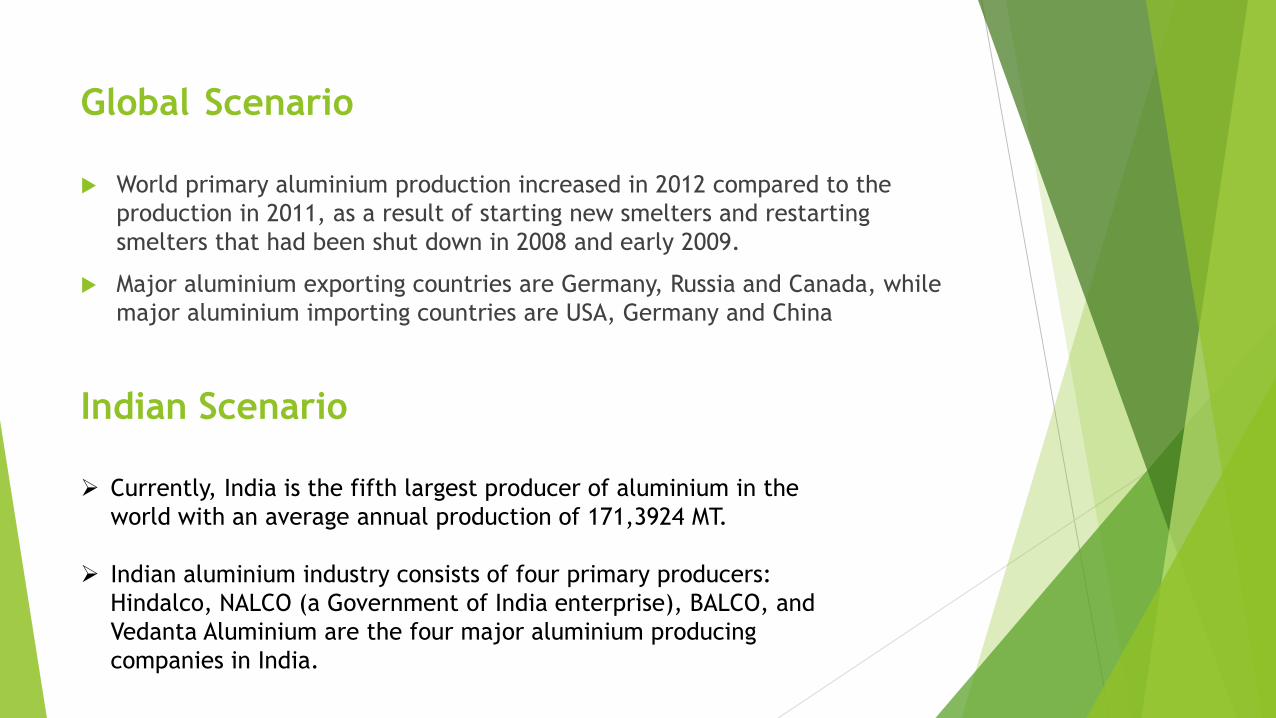
World primary aluminium production increased in 2012 compared to the
production in 2011, as a result of starting new smelters and restarting
smelters that had been shut down in 2008 and early 2009.
Major aluminium exporting countries are Germany, Russia and Canada, while
major aluminium importing countries are USA, Germany and China
Currently, India is the fifth largest producer of aluminium in the
world with an average annual production of 171,3924 MT.
Indian aluminium industry consists of four primary producers:
Hindalco, NALCO (a Government of India enterprise), BALCO, and
Vedanta Aluminium are the four major aluminium producing
companies in India.
Indian Scenario
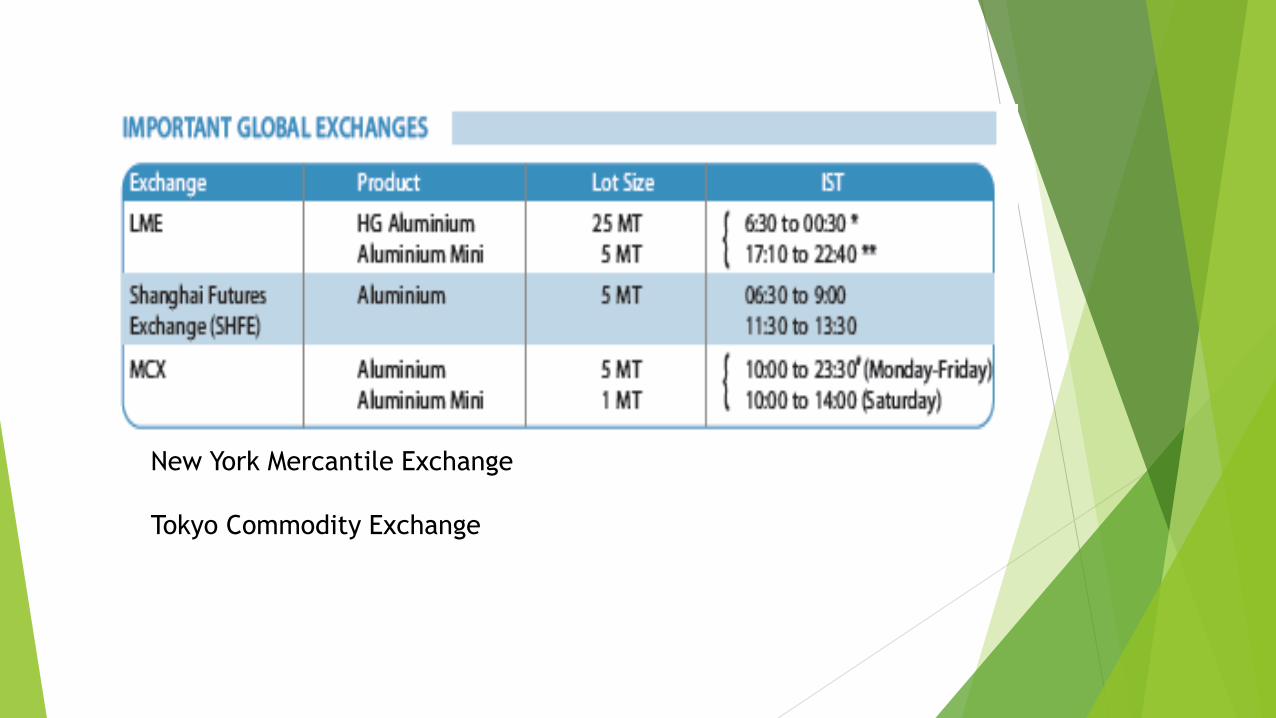
New York Mercantile Exchange
Tokyo Commodity Exchange
Factors Influencing the Market
Aluminium prices in India are fixed on the basis of the rates that rule on the international
spot market, and Indian Rupee and US Dollar exchange rates.
Economic events such as national industrial growth, global financial crisis, recession, and
inflation affect metal prices.
Commodity-specific events such as the construction of new production facilities or
processes, new uses or the discontinuance of historical uses, unexpected mine or plant
closures (natural disaster, supply disruption, accident, strike, and so forth), or industry
restructuring, all affect metal prices.
Trade policies set by the Government (implementation or suspension of taxes, penalties,
and quotas) affect supply as they regulate (restricting or encouraging) material flow.
Geopolitical events involving governments or economic paradigms and armed conflict can
cause major changes.
As societies develop, their demand for metal increases based on their current economic
position, which could also be referred as ‘National Economic Growth Factor’.

APPLICATIONS
Aluminium’s unique characteristics make it a highly attractive metal. It is
primarily used in transportation, packaging (cans), defence and consumer
electronic industries.
Its high strength-to-weight ratio makes it suitable for the construction of
aircrafts, cars and train carriages. Transportation equipment and building
construction account for around 50% of aluminium consumption.
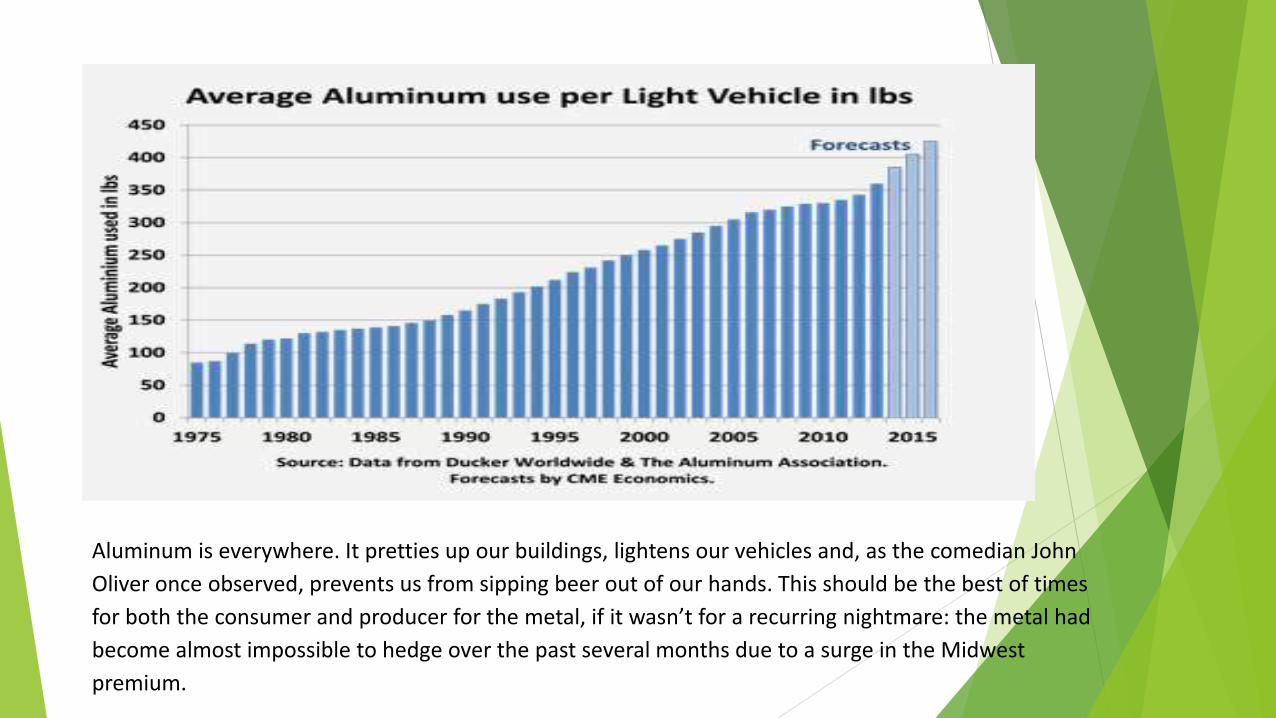
Aluminum is everywhere. It pretties up our buildings, lightens our vehicles and, as the comedian John
Oliver once observed, prevents us from sipping beer out of our hands. This should be the best of times
for both the consumer and producer for the metal, if it wasn’t for a recurring nightmare: the metal had
become almost impossible to hedge over the past several months due to a surge in the Midwest
premium.

World Aluminium Production and
Consumption

CONTRACT SPECIFICATION OF ALUMINIUM - MCX
SYMBOL ALUMINIUM
Description ALUMINIUMMMMYY
Trading period Monday to Saturday
Trading session Monday to Friday: 10:00 am to 11:30 pm
Saturday : 10:00 am to 2:00 pm
Contract months Monthly contracts
Expiry date Last day of the Contract
Trading unit 5 MT
Quotation/base value / kg
Tick size 5 paisa / kg
Maximum order size 150 MT
Daily price limit 4%
Initial margin Minimum 5% or based on SPAN, whichever is higher
Maximum allowable For individual clients: 15,000 MT
Open position For a member: 75,000 MT or not more than 15% of the market-
wide
open position in a contract at any point of time
Delivery logic Both options
Delivery Centre Exchange designated warehouse at Bhiwandi
Delivery Unit 10 MT with tolerance limit of 0.5 MT
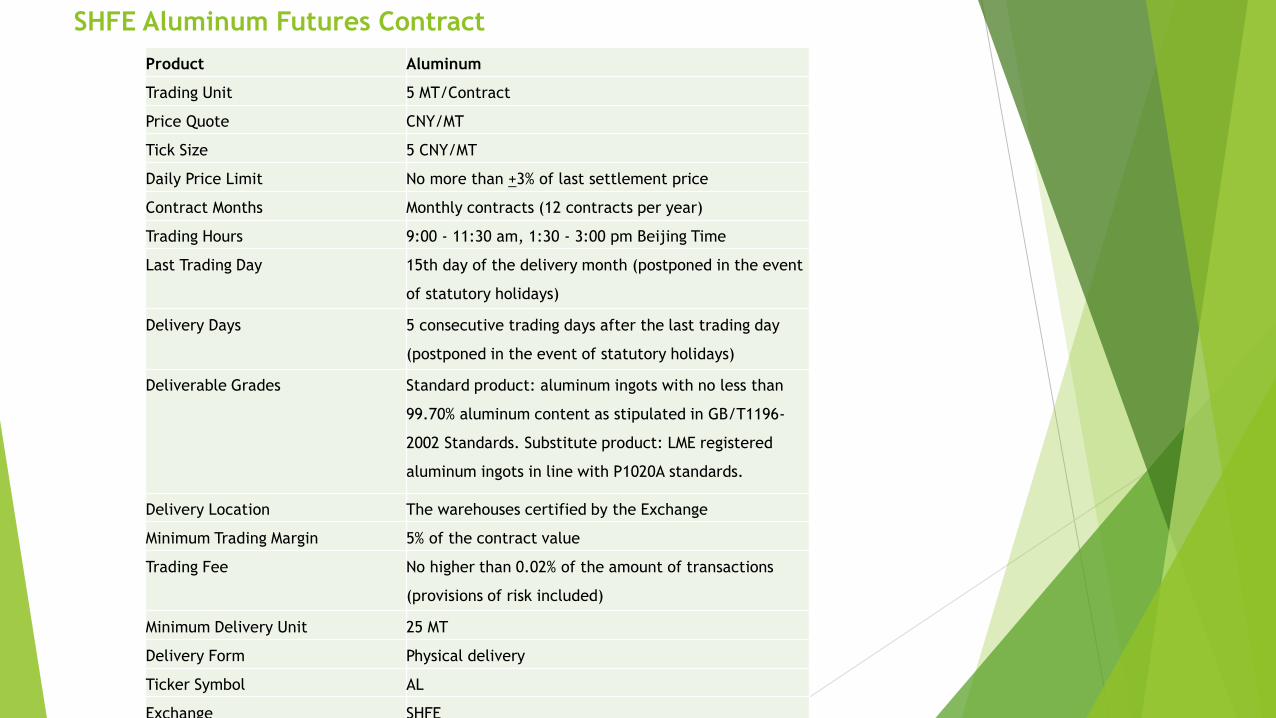
SHFE Aluminum Futures Contract
Product Aluminum
Trading Unit 5 MT/Contract
Price Quote CNY/MT
Tick Size 5 CNY/MT
Daily Price Limit No more than +3% of last settlement price
Contract Months Monthly contracts (12 contracts per year)
Trading Hours 9:00 - 11:30 am, 1:30 - 3:00 pm Beijing Time
Last Trading Day 15th day of the delivery month (postponed in the event
of statutory holidays)
Delivery Days 5 consecutive trading days after the last trading day
(postponed in the event of statutory holidays)
Deliverable Grades Standard product: aluminum ingots with no less than
99.70% aluminum content as stipulated in GB/T1196-
2002 Standards. Substitute product: LME registered
aluminum ingots in line with P1020A standards.
Delivery Location The warehouses certified by the Exchange
Minimum Trading Margin 5% of the contract value
Trading Fee No higher than 0.02% of the amount of transactions
(provisions of risk included)
Minimum Delivery Unit 25 MT
Delivery Form Physical delivery
Ticker Symbol AL
Exchange SHFE

MCX FUTURES Price for Aluminium
Rs/KG

SHFE (Shanghai Futures Exchange)
Aluminium Futures Prices
CNY - Chinese Yuan Renminbi ( RMB)/MT


