OCCASIONAL PAPER SERIES NO 60 / APRIL 2007 COMMODITY PRICE FLUCTUATIONS AND THEIR IMPACT ON MONETARY AND FISCAL POLICIES IN WESTERN AND CENTRAL AFRICA by Uwe Böwer, André Geis and Adalbert Winkler
Transcript
ISSN 1607148-4
9 7 7 1 6 0 7 1 4 8 0 0 6
OCCAS IONAL PAPER SER IESNO 60 / APR IL 2007
COMMODITY PRICE FLUCTUATIONS AND THEIR IMPACT ON MONETARY AND FISCAL POLICIES IN WESTERN AND CENTRAL AFRICA
by Uwe Böwer, André Geis and Adalbert Winkler
OCCAS IONAL PAPER SER IE SNO 60 / APR I L 2007
This paper can be downloaded without charge from http://www.ecb.int or from the Social Science Research Network
electronic library at http://ssrn.com/abstract_id=967605.
COMMODITY PRICE FLUCTUATIONS AND THEIR
IMPACT ON MONETARY AND FISCAL POLICIES
IN WESTERN AND CENTRAL AFRICA *
by Uwe Böwer, André Geis and Adalbert Winkler
In 2007 all ECB publications
feature a motif taken from the €20 banknote.
* This paper is an extended version of a background paper prepared for the Eurosystem Seminar with Western and Central African Central Banks in Paris on 1 February 2007. The opinions expressed in this paper are those of the authors and do not necessarily
refl ect the views of the European Central Bank. The paper benefi ted from comments from participants at the Eurosystem Seminar as well as Frank Moss, Georges Pineau, Francesco Mazzaferro and from excellent research assistance by Elva Bova
and Simone Ruiz. We would also like to thank Sanjeev Gupta and Magnus Saxegaard, both from the IMF, for data support.
AddressKaiserstrasse 2960311 Frankfurt am MainGermany
Postal addressPostfach 16 03 1960066 Frankfurt am MainGermany
Telephone+49 69 1344 0
Websitehttp://www.ecb.int
Fax+49 69 1344 6000
Telex411 144 ecb d
All rights reserved. Any reproduction, publication or reprint in the form of a different publication, whether printed or produced electronically, in whole or in part, is permitted only with the explicit written authorisation of the ECB or the author(s).
The views expressed in this paper do not necessarily reflect those of the European Central Bank.
ISSN 1607-1484 (print)ISSN 1725-6534 (online)
3ECB
Occasional Paper No 60April 2007
CONTENTSCONTENTS
ABSTRACT 4
EXECUTIVE SUMMARY 5
1 INTRODUCTION 6
2 COMMODITY PRICES AND ECONOMIC DEVELOPMENTS IN WESTERN AND CENTRAL AFRICA 62.1 Commodity price developments 62.2 The significance of commodities
in Western and Central Africa 72.3 Economic developments in
Western and Central Africa 10
3 MAJOR CHANNELS THROUGH WHICH COMMODITY PRICE CHANGES INFLUENCE INFLATION 203.1 Pass-through channel 213.2 Spending channel 223.3 Liquidity channel 28
4 CONCLUSIONS AND POLICY CHALLENGES 32
ANNEX 34
BIBLIOGRAPHY 49
EUROPEAN CENTRAL BANKOCCASIONAL PAPER SERIES 51
4ECB Occasional Paper No 60April 2007
ABSTRACT
Commodity prices play an important role in economic developments in most of the 24 Western and Central African (WCA) countries covered in this paper. It is confirmed that in the light of rising commodity prices between 1999 and 2005, net oil exporters recorded strong growth rates while net oil-importing countries – albeit benefiting from increases in their major non-oil commodity export prices – displayed somewhat lower growth. For most WCA economies, inflation rates appear less affected by commodity price changes and more determined by exchange rate regimes as well as monetary and fiscal policies. While pass-through effects from international to domestic energy prices were significant, notably in oil-importing countries, second-round effects on overall prices seem limited. Governments of oil-rich countries reacted prudently to windfall revenues, partly running sizable fiscal surpluses. A favourable supply response to rising spending as well as sterilisation efforts and increasing money demand also helped to dampen inflationary pressures. However, substantial excess reserves of commercial banks reflect challenges in financial sector developments and the effectiveness of monetary policy in many WCA countries. Given currently widely-used fixed exchange rate regimes, fiscal policy will continue to carry the main burden of macroeconomic adjustment and of sustaining non-inflationary growth, which remains the key policy challenge facing WCA authorities.
Commodities play an important role in the economies of most of the 24 countries in Western and Central Africa (WCA), which derive the majority of their merchandise export revenues from one single commodity or several commodities.
Against the background of rising commodity prices, most WCA economies developed favourably between 1999 and 2005, although differences between net oil-exporting and importing countries were apparent. Net oil exporters recorded the highest growth rates, mainly supported by rising investment and exports on the back of record oil prices and an expanding oil sector in some countries. Net oil-importing countries displayed lower growth, which was largely driven by domestic factors, most notably private consumption. Rising oil prices placed a burden on WCA economies, often counteracting benefits accruing from rising prices for their own main export products.
For most WCA countries, inflation rates seem to have remained relatively unaffected by changes in commodity prices. The exchange rate regimes of individual countries and their respective monetary and fiscal policies emerged as the determining factors in inflation developments.
Focusing on the inflationary impact of oil price developments, pass-through effects from international to domestic energy prices were significant in all countries, notably oil importers. Oil exporters experienced a comparably lower degree of pass-through, possibly reflecting the more widespread use of oil price subsidies. While this first-round effect of increased energy prices in WCA countries can be quantified as substantial, the limited availability of more detailed economic data make it difficult to analyse possible second-round effects. However, relatively contained inflation rates suggest that the impact of such second-round effects on the overall price level seems limited.
At the same time, governments of oil-rich countries reacted quite prudently to the windfall revenues from higher oil prices. Although spending increased substantially, the budget position improved markedly in several countries, with some countries running sizeable fiscal surpluses. Moreover, the response of domestic supply to the rise in private and public spending was favourable, while global markets were easily able to provide goods and services as demonstrated by the rapid rise in imports of WCA countries. Finally, sterilisation efforts and an increase in money demand helped to dampen inflationary pressures that could arise from strong capital inflows associated with a rise in liquidity.
Sustaining non-inflationary growth in an environment characterised by high commodity prices remains the key policy challenge facing WCA authorities. Since almost all countries operate either a fixed exchange rate regime or a managed float, there is little room for an active monetary policy helping to fight inflationary pressures. Indeed, central banks are likely to continue intervening in foreign exchange markets to counteract appreciation pressures. Moreover, substantial excess reserves of commercial banks – while dampening money and credit growth in the short term – indicate that financial sector developments in many WCA countries represent an additional challenge. This challenge needs to be met in order to channel capital inflows towards productive uses and to enable central banks to manage liquidity more effectively in the context of large capital inflows.
Given currently prevailing exchange rate regimes, fiscal policy will continue to carry the main burden of ensuring sustainable, non-inflationary growth, taking into account the specific conditions of countries highly dependent on commodity price developments. Moreover, given the uncertainty of the nature of the commodity price shock, in particular whether it is a temporary or permanent shock, fiscal policy is called upon to target spending at enhancing the productive capacities of the economies, in particular their ability to diversify away from oil and other dominant commodities.
EXECUTIVE SUMMARY
6ECB Occasional Paper No 60April 2007
1 INTRODUCTION
Commodities play an important role in the economies of most of the 24 countries in Western and Central Africa (WCA),1 which derive the majority of their merchandise export revenues from a single commodity or several commodities. Against this background, this paper reviews the impact of recent commodity price developments on monetary and fiscal policy in the region. It is structured as follows: Section 2 provides an overview of past and recent commodity price cycles, highlights the significance of commodity production for the 24 WCA countries and presents their economic development in the light of these findings. Section 3 is aimed at analysing why the impact of oil price developments on inflation in WCA countries has been limited, distinguishing between oil-exporting and oil-importing countries in the region. The analysis focuses on three channels through which rising oil prices could have affected inflation in the region: (1) the pass-through channel from international to domestic energy prices; (2) the spending channel, i.e. an increase in private or government spending, reflecting strong GDP growth and a rise in government revenues; and (3) the liquidity channel, i.e. the impact of strong capital inflows on foreign exchange reserve accumulation and excess liquidity in the banking sector. Section 4 summarises the main conclusions of the analysis and lists key challenges facing WCA authorities in sustaining non-inflationary growth in an environment characterised by high commodity prices.
2 COMMODITY PRICES AND ECONOMIC DEVELOPMENTS IN WESTERN AND CENTRAL AFRICA
2.1 COMMODITY PRICE DEVELOPMENTS
Since the late 1990s, commodity prices have followed an upward trend, with the prices of metals and crude oil showing the most pronounced increases. Although booms in commodity prices could be observed previously,
the magnitude of the increase, its duration and its breadth are unparalleled compared with other upswings in the past 25 years. Notably, prices for all commodity groups2 have risen simultaneously since 2002, a pattern which cannot be detected for such a prolonged period any time since 1980 (see Charts 1 and 2).
Of the individual commodity groups, crude oil prices have increased more than fivefold, while metal prices have more than tripled since early 1999. In both cases, this is the longest continuous rise since 1980. Prices have been driven mainly by growing demand from emerging markets, particularly China and India, encountering constrained supply conditions caused by past underinvestment in the wake of low or falling commodity prices. Moreover, geopolitical tensions have been contributing to high and rising prices, especially in the market for crude oil.
Price developments for agricultural products have been more subdued. Although prices for agricultural raw materials, food and beverages have been following an upward trend since late 2001, their respective gains of around 30%, 50% and 70% are relatively moderate compared with non-agricultural commodities. Nevertheless, the current rise is the most prolonged for food and beverages in the last two and a half decades. Explaining the rise in agricultural product prices is less straightforward than for crude oil and metals. Excluding weather conditions, which can have a strong impact on these commodities, structural changes in food consumption patterns in developing economies or higher demand for cotton and wool from a nascent textile industry in emerging markets might be possible explanations for the observed trends.
1 Benin, Burkina Faso, Cameroon, Cape Verde, Central African Republic, Chad, Congo, Côte d’Ivoire, Democratic Republic of the Congo, Equatorial Guinea, Gabon, The Gambia, Ghana, Guinea, Guinea Bissau, Liberia, Mali, Mauritania, Niger, Nigeria, São Tomé and Príncipe, Senegal, Sierra Leone and Togo.
2 Commodities can be classified into five groups, namely crude oil, metals (copper, aluminium, iron ore, tin, nickel, zinc, lead and uranium), agricultural raw materials (timber, cotton, wool, rubber and hides), food (cereals, vegetable oils, meat, seafood, sugar, bananas and oranges) and beverages (coffee, tea and cocoa).
7ECB
Occasional Paper No 60April 2007
2.2 THE SIGNIFICANCE OF COMMODITIES IN WESTERN AND CENTRAL AFRICA
Commodities play an important role in the economies of most of the 24 WCA countries, which derive the majority of their merchandise export revenues from one single commodity or several commodities (see Table 1). Countries with a dominant share of oil in their export revenues also appear to be highly dependent on oil regarding government revenues and GDP, with contributions of around 50% or above. By contrast, the direct contribution of agricultural products and other non-oil commodities to GDP and government revenues is considerably smaller. Thus, the significance of these commodities for the respective economies stems mainly from their importance as a source of foreign exchange revenue and their being responsible for the employment of large parts of the labour force, particularly in countries with mainly agricultural produce.3
Some of the WCA countries are not only important exporters of commodities, but also display sizeable commodity imports, notably petroleum-related products. 16 countries in the region4 are dependent on oil imports to satisfy
their energy needs and are therefore negatively affected by the rise in oil prices.
As a result, WCA economies are highly susceptible to fluctuations in commodity prices, but the conclusion that their increase is beneficial per se appears to be premature. Indeed, while the prices for some of Western and Central Africa’s main export products, in particular aluminium, crude oil, gold, iron ore, rubber and uranium, have followed the recent price boom (see Chart 3), developments have been either more moderate or more volatile for other commodities (see Chart 4).5
Chart 1 Price developments of crude oil and metals, 1980-2006
(index, January 1980 = 100)
Sources: IMF and ECB calculations.
crude oilmetals
0
50
100
150
200
250
0
50
100
150
200
250
Jan.2006
Jan.2004
Jan.2002
Jan.2000
Jan.1998
Jan.1996
Jan.1994
Jan.1992
Jan.1990
Jan.1988
Jan.1986
Jan.1984
Jan.1982
Jan.1980
Chart 2 Price developments of agricultural commodities, 1980-2006
(index, January 1980 = 100)
Sources: IMF and ECB calculations.
foodbeveragesagricultural raw materials
Jan.2006
Jan.2004
Jan.2002
Jan.2000
Jan.1998
Jan.1996
Jan.1994
Jan.1992
Jan.1990
Jan.1988
Jan.1986
Jan.1984
Jan.1982
Jan.1980
0
20
40
60
80
100
120
140
160
180
0
20
40
60
80
100
120
140
160
180
3 For other dimensions of commodity dependence, see Marinkov and Burger (2005). To explore the degree of volatility in commodity prices, they measure the standard deviation of their cyclical components. They also examine the elasticity of real exchange rates to changes in relative commodity prices as well as the direction of causality between commodity exports and GDP.
4 Benin, Burkina Faso, Cape Verde, Central African Republic, Ghana, Guinea, Guinea Bissau, Liberia, Mali, Mauritania, Niger, São Tomé and Príncipe, Senegal, Sierra Leone, The Gambia, Togo.
5 Charts 2 and 3 reflect price developments of commodities that meet certain standardised specifications and qualities. A commodity produced by an individual country might not meet these criteria and thus might be subject to price levels and fluctuations different from those displayed in the charts. Nevertheless, underlying trends using different qualities and specifications are likely to be similar.
2 COMMODITY PRICES AND ECONOMIC DEVELOPMENTS
IN WESTERN AND CENTRAL AFRICA
8ECB Occasional Paper No 60April 2007
Table 1 Significance of commodites in the economies of Western and Central African countries
Share in
Commodity
Merchandise exports(percentages)
(2005) 1)
GDP(percentages)
(2005) 1)
Government revenues,excl. grants
(percentages)(2005) 1)
Economies in which a single commodity is dominantChad oil 86.3 n.a. n.a.Congo oil 88.4 49.2 3), 6) 69.8 3), 6)
Sierra Leone diamonds 83.0 3) n.a. 2.0 3), 6), 18)
Guinea Bissau cashew nuts 92.8 21.0 11.0 19)
Benin cotton 58.1 21.0 5), 9) n.a.Burkina Faso cotton 71.5 4) 18.9 4), 5) ...São Tomé and Príncipe cocoa 89.5 5) 13.3 4), 6), 7) n.a.Liberia rubber 87.9 5) 21.2 n.a.Economies in which several commodities from the same commodity group are dominantGuinea Major commodities 85.7 17.0 18.3
of which: bauxite and alumina 63.1 4)
17.0 4), 15) 18.3 4)
gold 22.6 4)
The Gambia Major commodities 86.9 21.8 n.a. of which: groundnuts 65.4 4), 6) 8.9 4) n.a. fruit and vegetables 20.3 4), 6) 10.2 4), 14) n.a. fishing 1.2 4), 6) 2.7 4) n.a.
Economies in which several commodities from different commodity groups are dominantCameroon Major commodities 76.7 6.3 n.m.
Sources: IMF, UN Comtrade and ECB calculations.Note: Due to a lack of reliable data, Senegal and Togo are omitted; commodities do not comprise a significant share of merchandise exports in Cape Verde. n.a. = not available; n.m. = not meaningful; ... = zero or close to zero1) unless otherwise indicated2) 20023) 20034) 20045) estimate6) preliminary7) agriculture8) forestry9) agriculture and forestry10) cocoa production and marketing11) livestock12) cash crops13) export crops14) other crops15) mining16) mining and quarrying17) petroleum extraction and energy, including petroleum refining18) sum of revenues from mining licenses, royalties and export duties19) duties on cashew exports20) taxes and exports taxes on cocoa and coffee21) non-tax revenue from petroleum and gas22) fishing royalties and penalties23) export duty on cocoa24) revenue collected from the mining sector
2 COMMODITY PRICES AND ECONOMIC DEVELOPMENTS
IN WESTERN AND CENTRAL AFRICA
10ECB Occasional Paper No 60April 2007
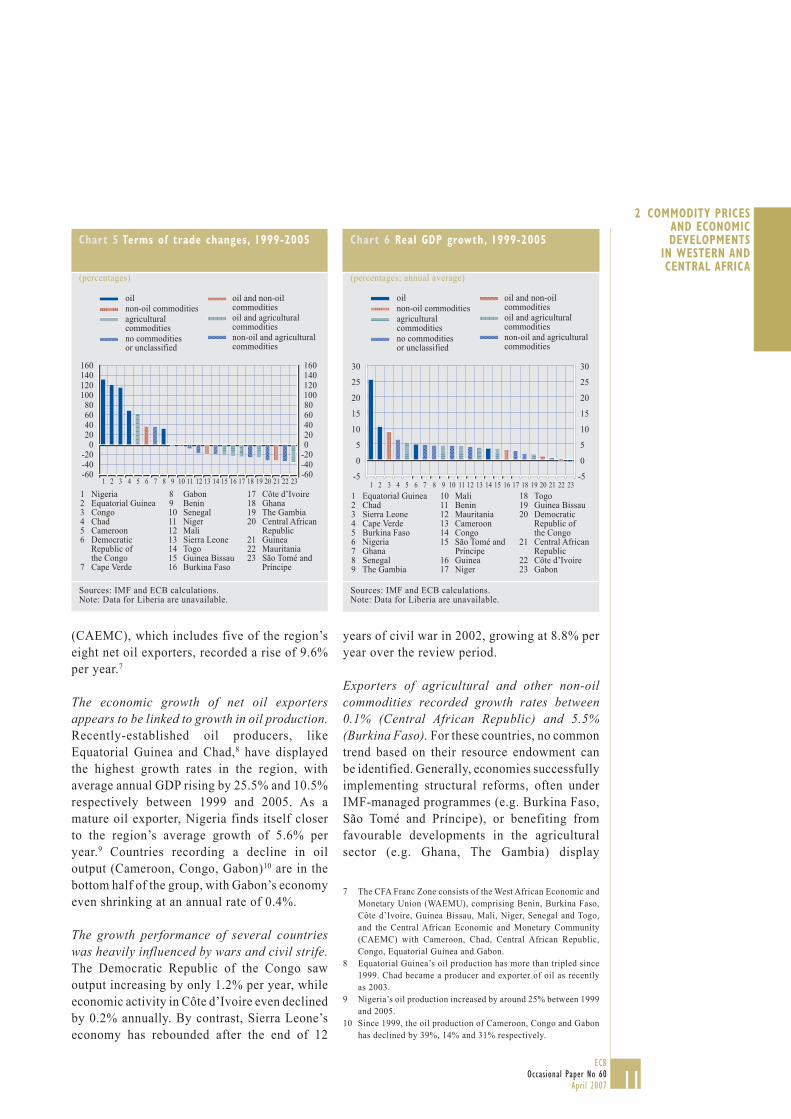
Cross-country differences in exposure to certain commodities and in terms of price developments imply that terms of trade changes have varied substantially for the countries under review (see Chart 5). Net oil exporters6 stand out as the main beneficiaries of the commodity boom, whereas the terms of trade of exporters of agricultural produce and, to a lesser extent, of non-oil commodities, have deteriorated. This reflects the fact that the rise in oil prices has been substantially stronger compared with most other commodities produced in the region (see Charts 3 and 4). Indeed, oil trade balances for the 16 net oil importers have worsened significantly since 1999. Correspondingly, most countries are spending a considerably higher amount of their import bill on oil than they did in 1999. Against this background, it is useful to distinguish between net oil exporters and importers when assessing the impact of commodity price fluctuations on the respective economies.
2.3 ECONOMIC DEVELOPMENTS IN WESTERN AND CENTRAL AFRICA
Growth rates across individual WCA economies varied considerably over the review period (see Chart 6), mainly reflecting differences in terms of commodity exposure and the impact of wars and civil strife on economic activity. The GDP of net oil exporters expanded by 6.2% annually between 1999 and 2005, whereas the average annual growth of net oil importers was 4.4%. Members of the CFA Franc Zone grew by 6.7% per year, with output in the West African Economic and Monetary Union (WAEMU) increasing by 3.2% per year, while the Central African Economic and Monetary Community
Chart 3 Commodities with large price increases since 1999
(index, January 1999 = 100)
Sources: IMF, Bloomberg and ECB calculations.
July2006
Jan.July2005
Jan.July2004
Jan.July2003
Jan.July2002
Jan.July2001
Jan.July2000
Jan. July1999
Jan.
uraniumrubberiron orecrude oilgoldaluminium
0
100
200
300
400
500
600
700
0
100
200
300
400
500
600
700
6 Countries where exports of petroleum and petroleum products exceed imports of these products are classified as net oil exporters. In Western and Central Africa, Cameroon, Chad, Congo, Côte d’Ivoire, the Democratic Republic of the Congo, Equatorial Guinea, Gabon and Nigeria are net oil exporters. For Côte d’Ivoire and the Democratic Republic of the Congo, however, oil exports only slightly exceed oil imports. Their most important export commodities are not oil, but cocoa and diamonds respectively. Indeed, Côte d’Ivoire was the only net oil-exporting country to record a negative terms of trade change between 1999 and 2005.
Chart 4 Commodities with moderate price increases since 1999
(index, January 1999 = 100)
Sources: IMF, Bloomberg, Bank of Botswana and ECB calculations.
July2006
Jan.July2005
Jan.July2004
Jan.July2003
Jan.July2002
Jan.July2001
Jan.July2000
Jan. July1999
Jan.
groundnutscottondiamondscobaltcocoa
0
50
100
150
200
250
0
50
100
150
200
250
11ECB
Occasional Paper No 60April 2007
(CAEMC), which includes five of the region’s eight net oil exporters, recorded a rise of 9.6% per year.7
The economic growth of net oil exporters appears to be linked to growth in oil production. Recently-established oil producers, like Equatorial Guinea and Chad,8 have displayed the highest growth rates in the region, with average annual GDP rising by 25.5% and 10.5% respectively between 1999 and 2005. As a mature oil exporter, Nigeria finds itself closer to the region’s average growth of 5.6% per year.9 Countries recording a decline in oil output (Cameroon, Congo, Gabon)10 are in the bottom half of the group, with Gabon’s economy even shrinking at an annual rate of 0.4%.
The growth performance of several countries was heavily influenced by wars and civil strife. The Democratic Republic of the Congo saw output increasing by only 1.2% per year, while economic activity in Côte d’Ivoire even declined by 0.2% annually. By contrast, Sierra Leone’s economy has rebounded after the end of 12
years of civil war in 2002, growing at 8.8% per year over the review period.
Exporters of agricultural and other non-oil commodities recorded growth rates between 0.1% (Central African Republic) and 5.5% (Burkina Faso). For these countries, no common trend based on their resource endowment can be identified. Generally, economies successfully implementing structural reforms, often under IMF-managed programmes (e.g. Burkina Faso, São Tomé and Príncipe), or benefiting from favourable developments in the agricultural sector (e.g. Ghana, The Gambia) display
7 The CFA Franc Zone consists of the West African Economic and Monetary Union (WAEMU), comprising Benin, Burkina Faso, Côte d’Ivoire, Guinea Bissau, Mali, Niger, Senegal and Togo, and the Central African Economic and Monetary Community (CAEMC) with Cameroon, Chad, Central African Republic, Congo, Equatorial Guinea and Gabon.
8 Equatorial Guinea’s oil production has more than tripled since 1999. Chad became a producer and exporter of oil as recently as 2003.
9 Nigeria’s oil production increased by around 25% between 1999 and 2005.
10 Since 1999, the oil production of Cameroon, Congo and Gabon has declined by 39%, 14% and 31% respectively.
Chart 5 Terms of trade changes, 1999-2005
(percentages)
Sources: IMF and ECB calculations. Note: Data for Liberia are unavailable.
oilnon-oil commoditiesagricultural commoditiesno commodities or unclassified
oil and non-oil commoditiesoil and agricultural commoditiesnon-oil and agricultural commodities
1 Equatorial Guinea2 Chad3 Sierra Leone4 Cape Verde5 Burkina Faso6 Nigeria7 Ghana8 Senegal9 The Gambia
10 Mali11 Benin12 Mauritania13 Cameroon14 Congo15 São Tomé and Príncipe16 Guinea17 Niger
-5
0
5
10
15
20
25
30
-5
0
5
10
15
20
25
30
oilnon-oil commoditiesagricultural commoditiesno commodities or unclassified
oil and non-oil commoditiesoil and agricultural commoditiesnon-oil and agricultural commodities
2 COMMODITY PRICES AND ECONOMIC DEVELOPMENTS
IN WESTERN AND CENTRAL AFRICA
12ECB Occasional Paper No 60April 2007
superior growth rates. Those facing domestic political instability (e.g. Guinea Bissau, Central African Republic) or those confronted with the fallout from conflicts in neighbouring countries (e.g. Guinea) show weaker growth.
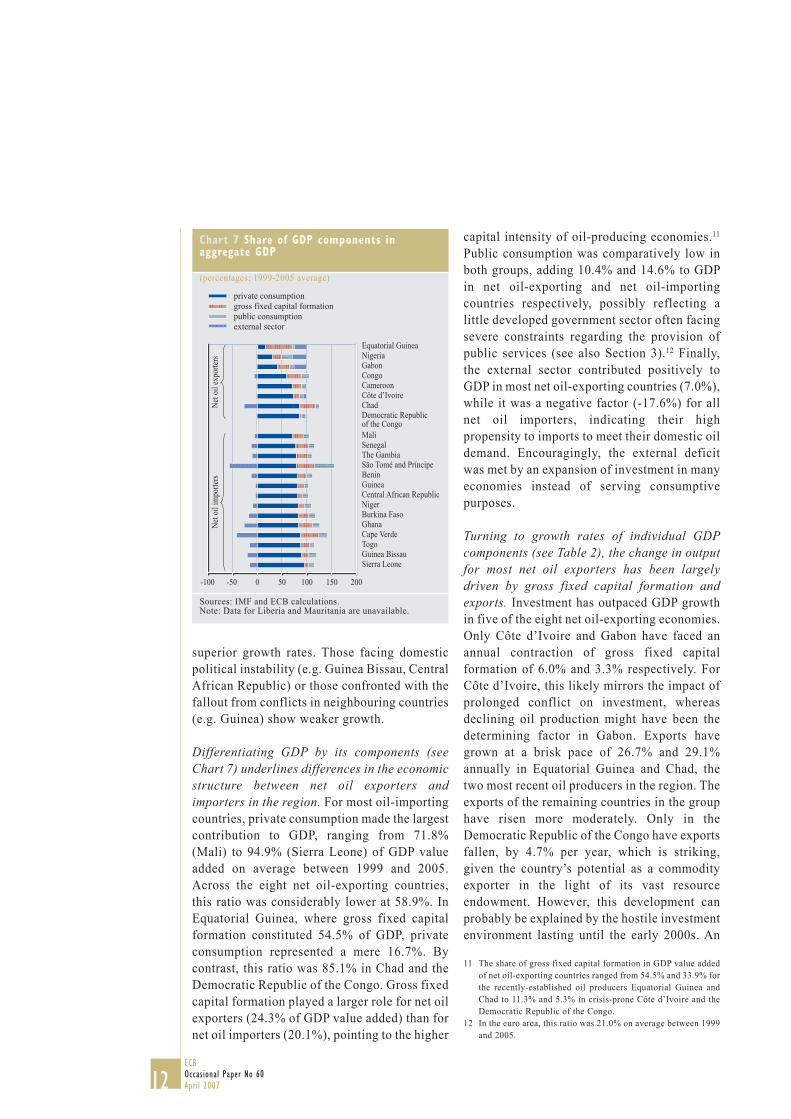
Differentiating GDP by its components (see Chart 7) underlines differences in the economic structure between net oil exporters and importers in the region. For most oil-importing countries, private consumption made the largest contribution to GDP, ranging from 71.8% (Mali) to 94.9% (Sierra Leone) of GDP value added on average between 1999 and 2005. Across the eight net oil-exporting countries, this ratio was considerably lower at 58.9%. In Equatorial Guinea, where gross fixed capital formation constituted 54.5% of GDP, private consumption represented a mere 16.7%. By contrast, this ratio was 85.1% in Chad and the Democratic Republic of the Congo. Gross fixed capital formation played a larger role for net oil exporters (24.3% of GDP value added) than for net oil importers (20.1%), pointing to the higher
Chart 7 Share of GDP components in aggregate GDP
(percentages; 1999-2005 average)
Sources: IMF and ECB calculations.Note: Data for Liberia and Mauritania are unavailable.
private consumptiongross fixed capital formation public consumptionexternal sector
Equatorial GuineaNigeriaGabonCongoCameroonCôte d’IvoireChadDemocratic Republic of the CongoMaliSenegalThe GambiaSão Tomé and PríncipeBeninGuineaCentral African RepublicNigerBurkina FasoGhanaCape VerdeTogoGuinea BissauSierra Leone
Net o
il ex
porte
rsNe
t oil
impo
rters
-100 -50 0 50 100 150 200
capital intensity of oil-producing economies.11
Public consumption was comparatively low in both groups, adding 10.4% and 14.6% to GDP in net oil-exporting and net oil-importing countries respectively, possibly reflecting a little developed government sector often facing severe constraints regarding the provision of public services (see also Section 3).12 Finally, the external sector contributed positively to GDP in most net oil-exporting countries (7.0%), while it was a negative factor (-17.6%) for all net oil importers, indicating their high propensity to imports to meet their domestic oil demand. Encouragingly, the external deficit was met by an expansion of investment in many economies instead of serving consumptive purposes.
Turning to growth rates of individual GDP components (see Table 2), the change in output for most net oil exporters has been largely driven by gross fixed capital formation and exports. Investment has outpaced GDP growth in five of the eight net oil-exporting economies. Only Côte d’Ivoire and Gabon have faced an annual contraction of gross fixed capital formation of 6.0% and 3.3% respectively. For Côte d’Ivoire, this likely mirrors the impact of prolonged conflict on investment, whereas declining oil production might have been the determining factor in Gabon. Exports have grown at a brisk pace of 26.7% and 29.1% annually in Equatorial Guinea and Chad, the two most recent oil producers in the region. The exports of the remaining countries in the group have risen more moderately. Only in the Democratic Republic of the Congo have exports fallen, by 4.7% per year, which is striking, given the country’s potential as a commodity exporter in the light of its vast resource endowment. However, this development can probably be explained by the hostile investment environment lasting until the early 2000s. An
11 The share of gross fixed capital formation in GDP value added of net oil-exporting countries ranged from 54.5% and 33.9% for the recently-established oil producers Equatorial Guinea and Chad to 11.3% and 5.3% in crisis-prone Côte d’Ivoire and the Democratic Republic of the Congo.
12 In the euro area, this ratio was 21.0% on average between 1999 and 2005.
13ECB
Occasional Paper No 60April 2007
annual increase in private consumption above GDP growth could be observed in Nigeria (+7.3% p.a.) and Congo (+15.4% p.a.), whereas only in Nigeria has public consumption had a significant impact on GDP, growing 19.3% per annum.
In net oil-importing economies, the main drivers of GDP are more difficult to identify. Growth is fairly evenly spread across the different components of domestic demand, with private consumption taking a prominent role in many countries. Exports are expanding less rapidly than GDP in nine of the 16 net oil-importing countries, indicating the dependency of the group on domestic rather than foreign factors for economic expansion.
Cumulated balance of payment flows between 1999 and 2005 (see Table 3) highlight the disparities between net oil exporters and importers in the region. Most net oil exporters recorded strong surpluses in their trade in goods, driven mainly by rising oil prices and,
in the case of Chad, Equatorial Guinea and Nigeria, by increasing production volumes as well. In contrast, trade balances are negative for the majority of net oil importers, largely triggered by higher costs for their energy imports.
Net oil exporters’ positive merchandise trade balances were offset and in some instances exceeded by significantly negative services and income balances, mainly reflecting the import of know-how (e.g. drilling services) and the repatriation of foreign oil companies’ profits (see Box 1). As a result, the current account balances of four countries in this group were in deficit, most prominently in Equatorial Guinea and Chad, which significantly expanded their oil output over the review period. Nevertheless, these deficits were comfortably covered by sizeable inflows of foreign direct investment, accompanied by current and capital transfers13
Table 2 Growth in GDP and its components, 1999-2005
(percentages, annual average)
Major commodities
GDP
Privateconsump-
tion
Gross fixed
capitalformation
Publicconsump-
tion Exports Importsoil non-oilagri-
culture
none/unclas-sified
Equatorial Guinea O 25.5 1.7 5.5 -0.1 26.7 5.0Chad O 10.5 4.3 16.3 7.0 29.1 15.2Nigeria O 5.0 7.3 14.7 19.3 3.2 11.3Cameroon O O 3.9 3.6 7.2 6.9 5.1 8.3Congo O 3.6 15.4 21.1 3.7 1.1 16.5Democratic Republic of the Congo O O 1.2 1.2 11.6 -1.0 -4.7 -3.3Côte d’Ivoire O O -0.2 -1.0 -6.0 2.7 2.3 -1.4Gabon O -0.4 -3.3 -3.3 -1.6 3.2 -0.8Sierra Leone O 8.8 9.9 22.1 8.8 6.2 15.3Cape Verde O 6.5 6.3 10.0 4.5 2.6 6.6Burkina Faso O 5.5 5.4 2.3 6.1 7.8 3.0Ghana O O 4.8 5.5 3.8 0.5 3.5 3.4Senegal O 4.6 3.8 5.6 8.2 2.1 5.4The Gambia O 4.5 5.5 9.5 2.9 4.8 7.5Mali O O 4.5 2.9 3.4 7.6 8.8 5.2Benin O 4.4 3.5 4.3 10.9 1.2 2.5São Tomé and Príncipe O 3.6 4.0 3.0 10.9 3.7 6.7Guinea O 3.1 3.9 -0.5 0.5 6.2 4.5Niger O O 2.8 2.9 7.4 0.4 2.6 4.2Togo O 1.9 2.6 5.5 -2.2 4.0 5.1Guinea Bissau O 1.7 -0.3 5.3 13.7 16.7 9.0Central African Republic O O 0.1 -0.4 -3.1 -1.1 -3.5 -6.7
Sources: IMF and ECB calculations.Note: Data for Liberia and Mauritania are unavailable.
13 Current transfers take the form of official (e.g. aid) and private (e.g. remittances) transfers. Capital transfers have an impact on the capital account and comprise mainly debt relief and migrants’ transfers.
2 COMMODITY PRICES AND ECONOMIC DEVELOPMENTS
IN WESTERN AND CENTRAL AFRICA
14ECB Occasional Paper No 60April 2007
in Chad and the Democratic Republic of the Congo. Net oil exporters with a current account surplus (Congo, Côte d’Ivoire, Gabon and Nigeria) benefited from foreign direct investment and debt relief, but also show comparatively large outflows of private transfers (Côte d’Ivoire and Gabon) and other investment (Congo and Gabon), reflecting the movement of remittances out of the country and the repayment of loans respectively.
The deficits in merchandise trade of most net oil importers were further aggravated by
negative services and income balances. Only Cape Verde and The Gambia displayed a positive services balance, while all countries except Mauritania recorded net income outflows. However, for most economies the largest part of this shortfall was met by current and capital transfers, either from official or private sources. Guinea Bissau, São Tomé and Príncipe, Sierra Leone and The Gambia received considerable proportions of their external financing from foreign governments. In contrast, Cape Verde, Ghana and Senegal cover their deficits via private channels, mainly in the
Table 3 Cumulated balance of payments flows, 1999-2005
(as a percentage of cumulated GDP)
Major commodities Balance of payments
oilnon-oil
agri-culture
none/unclassified
Current account balance
Balance ingoods
Balance inservices
Net factorincome
Equatorial Guinea O O -23.4 67.1 -28.4 -61.3
Congo O 4.1 54.4 -23.9 -26.6
Gabon O O 12.5 40.9 -11.7 -12.9
Nigeria O O 4.4 22.5 -8.2 -13.4
Côte d’Ivoire O O O 1.2 16.8 -7.0 -5.4
Chad O O -23.4 8.9 -24.8 -11.2
Guinea -4.6 3.1 -6.3 -1.8
Cameroon O O -2.8 2.2 -1.9 -4.4
Central African Republic O O -3.6 0.9 -6.6 -0.7
Democratic Republic of the Congo O -4.2 -0.9 -4.5 -5.6
Mali O -7.4 -0.7 -6.3 -4.7
Niger O -6.2 -4.2 -5.2 -0.7
Guinea Bissau O O -6.9 -6.2 -13.7 -5.1
Burkina Faso O -9.9 -9.4 -4.0 -0.6
Sierra Leone O -8.6 -11.4 -7.4 -2.9
Benin O -7.4 -10.9 -1.3 -0.9
Togo O -12.1 -11.6 -4.7 -1.7
Senegal O -6.3 -11.8 -0.3 -1.7
Ghana O -4.9 -17.8 -2.3 -2.1
The Gambia O -6.6 -19.4 8.0 -5.1
Mauritania O -22.7 -22.5 -12.1 3.7
Cape Verde O O -10.3 -37.3 3.0 -2.1
São Tomé and Príncipe O -25.5 -48.7 -8.4 -5.1
Sources: IMF and ECB calculations. Note: Data for Liberia are unavailable.1) Reserve assets are not necessarily equivalent to a country’s foreign exchange holdings, but might also include exceptional financing in the form of debt write-offs by foreign creditors.
15ECB
Occasional Paper No 60April 2007
form of remittances, which are also prominent in Guinea Bissau and Sierra Leone. Foreign direct investment and other investment are highly concentrated on the nascent oil producers Mauritania and São Tomé and Príncipe. For the remaining net oil importers, foreign direct investment plays a relatively minor role compared with current and capital transfers.
Balance of payments Balance of paymentsCurrent account balance
34.6 2.1 0.0 21.0 6.8 0.0 26.3 -12.0 São Tomé and Príncipe
2 COMMODITY PRICES AND ECONOMIC DEVELOPMENTS
IN WESTERN AND CENTRAL AFRICA
16ECB Occasional Paper No 60April 2007
Box 1
PROFIT REPATRIATION IN GABON
Foreign ownership of local oil companies may be associated with substantial repatriation of corporate profits. The case of Gabon,1 where the major refinery is around 75% owned by western oil companies and appropriate data are available up to 2003, provides some evidence for the contribution of profit transfers to income balance deficits. Indeed, repatriated earnings of foreign companies seem to be roughly in line with the development of the oil price (see chart on the right). Expressed as a share of GDP, the level of foreign earnings which are not reinvested domestically amount to up to 7% of national GDP.2
Profit repatriation, Gabon
(as a percentage of GDP; oil price index 1995 = 100)
Sources: IMF and ECB calculations.Note: Data on earnings unavailable after 2003.
1 See El Said and Leigh (2006) for details.2 In the case of Congo, where data are only available for 2005,
net repatriated earnings amounted to 18% of GDP.
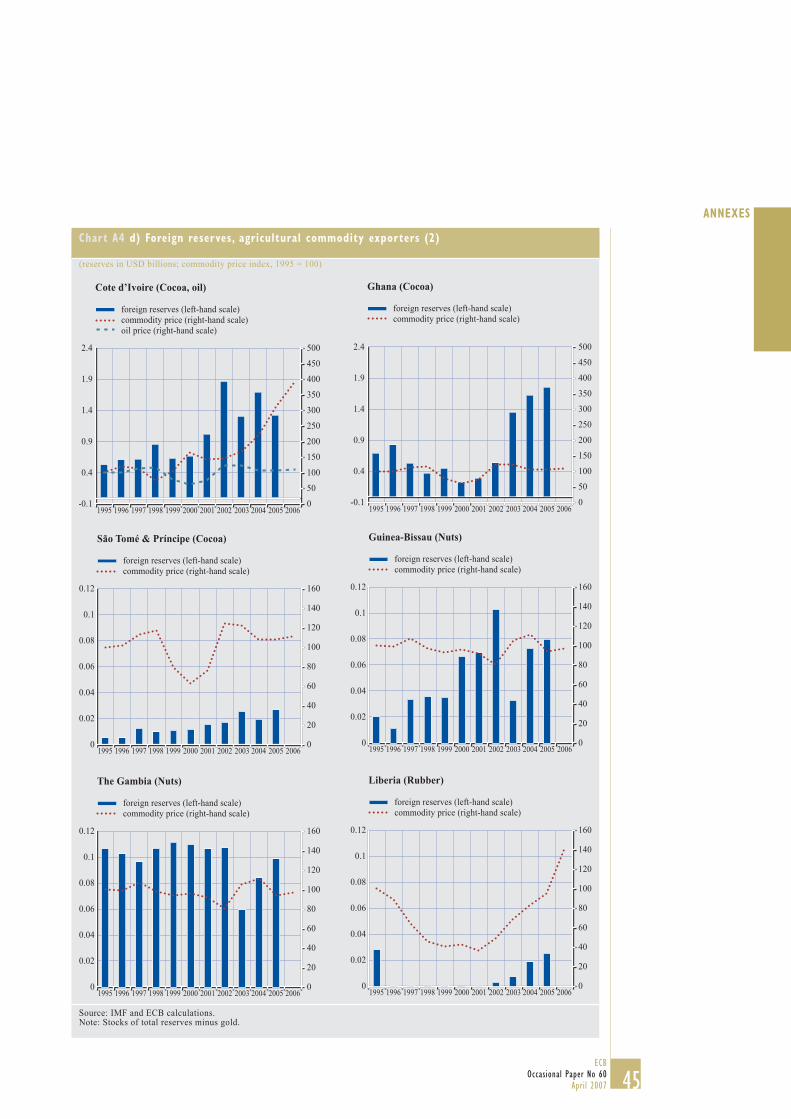
Almost all WCA countries have accumulated foreign exchange reserves (see Chart 8), despite sizeable current account deficits. In the case of recently-established (Chad and Equatorial Guinea) and future (Mauritania and São Tomé and Príncipe) oil producers, sizeable inflows of foreign direct investment and other investment have supported the accumulation of reserve assets. For many of the remaining countries, capital transfers in the form of debt forgiveness and migrants’ transfers have already reduced the current account deficit, so that any additional inflows into the financial account could contribute to further reserve building. Only Burkina Faso, the Central African Republic, Congo, The Gambia and Niger have registered a decline in reserve assets.
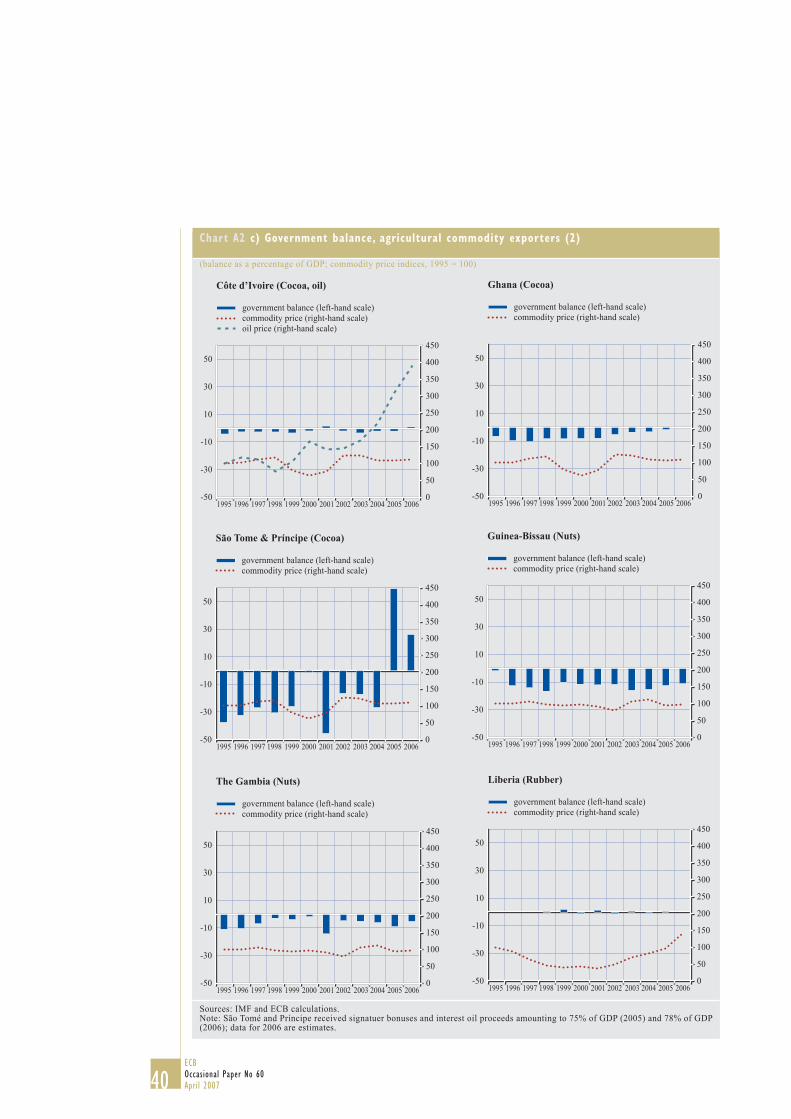
Government balances have improved for the majority of economies in the region (see Chart 9) with oil producers showing the largest surpluses.14 In contrast, trends in government finances of non-oil commodity exporters have been rather diverse and appear to be little affected by fluctuations in commodity prices,
Source: IMF.Note: Foreign exchange reserves data are unavailable for the Democratic Republic of the Congo, for Guinea between January and December 2003 and for Mauritania after April 2004.
14 Revenues resulting from the prospect of future oil extraction, expected to begin in 2012, triggered an extraordinary swing in São Tomé and Príncipe’s government balance, from -26.6% of GDP in 2004 to 59.3% in 2005, with oil signature bonuses accounting for close to 60% of São Tomé and Príncipe’s government receipts in 2005.
17ECB
Occasional Paper No 60April 2007
Chart 9 Change in the government balance as a share of GDP, 1999 vs. 2005
(percentage points)
Sources: IMF and ECB calculations. Note: Data for Liberia are unavailable.
1 São Tomé and Príncipe2 Equatorial Guinea3 Congo4 Nigeria5 Gabon6 Cape Verde7 Sierra Leone8 Ghana
9 Cameroon10 Chad11 Niger12 Guinea13 Democratic Republic of the Congo14 Togo15 Mali
-10-505
101520253040 40
-10-5051015202530
85.2
oilnon-oil commoditiesagricultural commoditiesno commodities or unclassified
oil and non-oil commoditiesoil and agricultural commoditiesnon-oil and agricultural commodities
reflecting the comparatively low share of the respective commodity sector in revenues in many of these countries (see Table 1).
The direct impact of soaring oil prices on government expenditure seems to have been limited. While the majority of countries in the region exert some kind of price control over petroleum products (see Chart 12), price subsidies, which would have an immediate effect on the budget, are rare.15
Inflation in most WCA economies was comparatively low between 1999 and 2005 (see Chart 11), with only five countries recording average annual inflation rates above 10%.16 Outliers were Ghana, where prices have risen at an annual rate of close to 20% on the back of a sharply depreciating exchange rate in 1999-2000 and an upward adjustment of regulated prices for electricity and petroleum products, and the Democratic Republic of the Congo, which faced hyperinflation of more than 100% annually in the wake of its prolonged period of conflict.
The impact of commodity price changes on inflation developments seems to have been limited, given the level and volatility of inflation rates in the region (see Charts 10 and 11) and the dynamics of commodity price changes (see Charts 3 and 4) in the period 1999-2005.17 Rather, inflation seems to have been largely determined by monetary and fiscal policies, in particular the exchange rate regime.
The countries of the CFA Franc Zone (see Box 2), including those experiencing strong capital inflows related to soaring prices of their main export commodities, have displayed
Chart 10 Inflation, 1999-2005
(percentages, annual average)
Sources: IMF and ECB calculations. Note: Data for Liberia are unavailable. 1) CAEMC members 2) WAEMU members
1 Democratic Republic of the Congo2 Ghana3 Nigeria4 São Tomé and Príncipe5 Guinea6 Sierra Leone
7 The Gambia8 Mauritania9 Equatorial Guinea1)
10 Côte d’Ivoire2)
11 Benin2)
12 Cameroon1)
13 Congo1)
14 Togo2)
15 Burkina Faso2)
0
5
10
15
20
25
0
5
10
15
20
25113.8
oilnon-oil commoditiesagricultural commoditiesno commodities or unclassified
oil and non-oil commoditiesoil and agricultural commoditiesnon-oil and agricultural commodities
15 Among the non-oil producers in Western and Central Africa, only Cape Verde, Ghana and Senegal subsidise prices. Interestingly, government balances of the former two improved between 1999 and 2005.
16 Official inflation figures may be distorted by the subsidising of particular goods comprising the CPI basket, particularly petroleum products.
17 This is in line with the evidence presented in Deaton and Miller (1995) who did not find a direct causal link between international commodity prices and domestic price levels in sub-Saharan African countries for the period 1962-1988.
2 COMMODITY PRICES AND ECONOMIC DEVELOPMENTS
IN WESTERN AND CENTRAL AFRICA
18ECB Occasional Paper No 60April 2007
the lowest rates of inflation.18 Inflation developments in the WAEMU and CAEMC followed a downward trend after peaking at 5.1% (WAEMU) and 6.6% (CAEMC) in mid-2001. After a short period of deflation in the first half of 2004, prices have picked up again, bringing inflation closer to the levels last seen in 2001.
For economies outside the CFA Franc Zone, inflation has been at a more elevated level and subject to considerable volatility (see Chart 11). Between 1999 and 2005, monthly year-on-year inflation rates ranged from 1.2% to 27.7%, with episodes of high and low inflation following on from each other relatively rapidly, mainly triggered by developments in Nigeria and Ghana, the largest economies in the group. Year-on-year inflation in Nigeria peaked at 23.2% in April 2001 and 24.8% in February 2004, following an expansionary monetary policy, and at 28.5% in August 2005, on the back of increases in domestic fuel and food prices.
Summing up, the majority of WCA economies performed well between 1999 and 2005, although differences between net oil-exporting and importing countries in the region are apparent. Net oil exporters recorded the highest growth rates, mainly supported by rising investment and exports on the back of record oil prices and an expanding oil sector in some countries. Net oil-importing countries displayed lower growth, which was largely driven by domestic factors, most notably private consumption. An increasing oil price placed a burden on these economies, often counteracting
benefits accruing from rising prices for their own main export products. Interestingly, inflation rates seem to have remained relatively unaffected by changes in commodity prices. Instead, the exchange rate regime of individual countries (see Box 2) and their respective monetary and fiscal policies emerge as the determining factor in inflation developments (see Section 3).
18 Only Equatorial Guinea exhibits an inflation rate which is notably higher than that of other CAEMC members, a development driven by a rapidly expanding oil sector triggering an abundance of liquidity and encountering supply constraints in the rest of the economy.
Chart 11 Inflation, 1999-2005
(percentages, year on year)
Sources: IMF and ECB calculations.Note: Averages weighted by purchasing power parities.1) Cameroon, Central African Republic, Chad, Congo, Equatorial Guinea, Gabon; data for Equatorial Guinea are unavailable after May 2005.2) Benin, Burkina Faso, Côte d’Ivoire, Guinea Bissau, Mali, Niger, Senegal, Togo.3) Cape Verde, The Gambia, Ghana, Mauritania, Nigeria, Sierra Leone; excluding the Democratic Republic of the Congo; monthly inflation data for Guinea, Liberia and São Tomé and Príncipe are unavailable; monthly inflation data for Nigeria are unavailable for July and August 2001.
July2005
Jan.July2004
Jan.July2003
Jan.July2002
Jan.July2001
Jan.July2000
Jan. July1999
Jan.
CAEMC1)
WAEMU2)
other countries3)
-5
0
5
10
15
20
25
30
-5
0
5
10
15
20
25
30
Box 2
MONETARY AND EXCHANGE RATE ARRANGEMENTS IN WESTERN AND CENTRAL AFRICA
The majority of WCA countries are either members of an existing monetary arrangement or are striving for closer monetary cooperation. The Central African Economic and Monetary Community (CAEMC), comprising Cameroon, Central African Republic, Chad, Congo, Equatorial Guinea and Gabon, and the West African Economic and Monetary Union (WAEMU), consisting of Benin, Burkina Faso, Côte d’Ivoire, Guinea Bissau, Mali, Niger, Senegal and
19ECB
Occasional Paper No 60April 2007
Togo, together form the CFA Franc Zone. Their currencies are pegged to the euro at a rate of 655.95 CFA Francs per euro. The convertibility of CFA Francs into French Francs and since 1999 into euro is guaranteed by the French Treasury. In spite of these close links to the euro, inflation developments in the CFA Franc Zone only partially follow those in the euro area (see Chart A), indicating that the economies of the CFA Franc Zone are exposed to shocks which are often different to those facing the euro area.
In 2000, the Gambia, Ghana, Guinea, Nigeria and Sierra Leone established the West African Monetary Zone (WAMZ), originally aiming at the introduction of a common currency for the five countries by mid-2005. Up to now, progress has been limited, as all members have been maintaining their own national monetary policies, even though the WAMZ’s exchange rate mechanism requires the exchange rate of each currency against the US dollar to be maintained within a ±15% target band around a central rate. However, none of the central banks has implemented this measure so far. Only Nigeria adopted a tightly managed float in February 2005, aimed at keeping the naira within a band of ±3% against the US dollar. Before that, and in line with all other currencies in the WAMZ, its currency has been depreciating considerably since 1999 (see Chart B).
Of the remaining countries, Cape Verde maintains a fixed peg to the euro. Mauritania tightly managed its exchange rate against the US dollar until May 2005, when it reclassified its regime to a fixed peg against the US currency. São Tomé and Príncipe has sustained a managed float with a depreciating trend against the US dollar since 1999. Finally, the currency of the Democratic Republic of the Congo lost more than 99% of its value between 1999 and 2005, reflecting the country’s ongoing involvement in conflicts up to late 2002.
Chart A Inflation in the euro area and the CFA Franc Zone, 1999-2005
(percentages, year on year)
Sources: IMF and ECB calculations.Note: CAEMC and WAEMU averages weighted by purchasing power parities. Correlations: 0.45 (CAEMC), 0.44 (WAEMU).
-3-2-1012345678
0.0
0.5
1.0
1.5
2.0
2.5
3.0
3.5
CAEMC (left-hand scale)WAEMU (left-hand scale)euro area (right-hand scale)
Jan. July Jan. July Jan. July Jan. July Jan. July Jan. July Jan. July Jan.1999 2000 2001 2002 2003 2004 2005
Chart B Exchange rates of WAMZ members against the US dollar, 1999-2005
(index, January 1999 = 100; an upward movement indicates depreciation)
Sources: IMF and ECB calculations.
GhanaGuineaNigeriaSierra LeoneThe Gambia
Jan. July Jan. July Jan. July Jan. July Jan. July Jan. July Jan. July Jan.1999 2000 2001 2002 2003 2004 2005
50
100
150
200
250
300
350
400
450
50
100
150
200
250
300
350
400
450
2 COMMODITY PRICES AND ECONOMIC DEVELOPMENTS
IN WESTERN AND CENTRAL AFRICA
20ECB Occasional Paper No 60April 2007
Box 3
DUTCH DISEASE PHENOMENA IN WESTERN AND CENTRAL AFRICA?
High inflation rates have brought about a real exchange rate appreciation of the currencies of WCA oil-exporting countries, which has raised concerns about a possible “Dutch disease” effect. Dutch disease is the effect of a large inflow of foreign currency associated with real exchange rate appreciation and a loss in competitiveness.
Among the core oil-exporting countries in the WCA region, Nigeria’s real effective exchange rate (REER) has increased by more than a third since 2000 (see the chart). The picture for the other oil exporters, which are all members of the CAEMC, is mixed. While, on average, the REER in the CAEMC has not fully recovered from the 1994 devaluation, standing at about 88% of the pre-1994 level, there are substantial differences within the region. Equatorial Guinea is the CAEMC country that has experienced the largest appreciation, equal to 114% of its pre-devaluation value, also reflecting the fact that the United States and countries whose currencies are pegged to the US dollar account for almost 50% of its trade.
Non-oil exports have declined since the late 1990s, both in absolute terms and as ratios to GDP and to total exports. Moreover, non-oil exports have become less diversified over the last five years.1 Subject to all caveats to this limited analysis, this might be the main indicator suggesting the presence of Dutch disease phenomena.
1 See IMF (2005).
Real appreciation, oil exporters
(real effective exchange rates, 2000 = 100)
Sources: IMF and ECB calculations.
CameroonChadCongoEquatorial GuineaGabonNigeria
20062000 2001 2002 2003 2004 200590
100
110
120
130
140
150
160
90
100
110
120
130
140
150
160
3 MAJOR CHANNELS THROUGH WHICH COMMODITY PRICE CHANGES INFLUENCE INFLATION
This section aims to analyse in greater detail why the impact of commodity price developments on inflation in WCA countries has been limited. It focuses on the pass-through channel whereby changes in international commodity prices have a direct impact on the corresponding retail prices in domestic economies, the spending channel, i.e. an increase in private or government
spending, reflecting strong GDP growth and a rise in government revenues, and the liquidity channel, which shows the impact of strong capital inflows on foreign exchange reserve accumulation and excess liquidity in the banking sector.
Given their strong rise in the recent past and their importance for economic developments in general (see Section 2), the analysis focuses on the inflationary effects of oil prices, while distinguishing between oil-exporting and oil-
21ECB
Occasional Paper No 60April 2007
importing countries. In the WCA region, three groups of oil exporters can be distinguished. The first group consists of six countries for which oil is the major export commodity, namely Cameroon, Chad, Congo, Equatorial Guinea, Gabon – all CAEMC countries – and Nigeria. Côte d’Ivoire and the Democratic Republic of the Congo comprise the second group. While both of these countries are currently net oil exporters,19 oil is not their main export commodity. Finally, Mauritania and São Tomé and Príncipe constitute the third group, as oil resources have been discovered recently in these two countries, giving them the status of prospective oil exporters. While this section’s analysis of oil-exporting countries mainly focuses on the first group, reference is made to the second and third groups when appropriate. All other WCA countries are referred to as oil importers.
3.1 PASS-THROUGH CHANNEL
Many WCA countries have seen a relatively high pass-through of international oil prices to domestic petrol prices (see Chart 12). In eleven countries, the pass-through effect has been greater than 0.8, indicating a substantial first-round effect of international oil price movements on domestic petrol prices.20 Due to limited data, an analysis of possible second-round effects is difficult. However, relatively contained inflation rates suggest that the impact of such second-round effects on the overall price level has been limited.
The relatively high pass-through in many WCA countries has been observed despite widespread price controls (see Chart 12). 13 WCA countries have ad hoc price controls in place and seven countries adjust domestic prices on the basis of a formula that is automatically applied in the event of changes in international prices. Only Guinea and Ghana, which are among the five countries with the highest pass-through coefficients, allow their domestic petrol prices to adjust freely to changes in international prices.
Chart 12 Petrol pass-through
(ratio of the change in the retail price to the change in the import price, in national currency, 2003-2006)
Source: IMF.Note: The price regime is indicated by (A) for automatic price controls, (AH) for ad-hoc price controls and (L) for liberalised prices. An asterisk (*) denotes price subsidisation. Data on pass-through are not available for Cape Verde, Chad, Liberia and Mauritania. For Chad and Mauritania, no information on price regulation or subsidies is available.
0.0
Chad
Gabon (A)*
Equatorial Guinea (AH)*
Congo (AH)*
Oil-exporter average
Cameroon (A)*
Nigeria (AH)
Mauritania
Liberia (AH)
Cape Verde (AH)*
Central African Republic (AH)
Côte d'Ivoire (AH)
Senegal (A)*
Benin (A)
Mali (AH)
Guinea Bissau (AH)
Burkina Faso (A)
The Gambia (AH)
Niger (A)
Oil-importer average
Togo (AH)
Democratic Republic of the Congo (AH)
Ghana (L)*
Sierra Leone (A)
Guinea (L)
São Tomé and Príncipe (AH)
oil importeroil exportergroup average
0.2 0.4 0.6 0.8 1.0 1.2 1.4 1.6 1.8 2.0 2.2
Oil-exporting countries (0.51) have experienced a lower average pass-through ratio than oil importers (1.07), possibly reflecting the more
19 Given the ongoing post-conflict recovery, the Democratic Republic of the Congo is likely to become a net oil importer in the near future.
20 Applying the method used in IMF (2006b), the pass-through effect is calculated as the ratio of the change in retail prices to the change in import prices of petrol in national currency between 2003 and 2006. For data availability, see the note to Chart 12.
3 MAJOR CHANNELS THROUGH WHICH
COMMODITY PRICE CHANGES INFLUENCE
INFLATION
22ECB Occasional Paper No 60April 2007
widespread use of oil price subsidies.21 Indeed, four oil exporters have been subsidising domestic petrol prices (see Chart 12), while only three net oil importers have used this instrument to limit price increases in the domestic market. 21 This observation is in line with the results of a study recently
conducted by the World Bank (2006). See also IMF (2006b).
Chart 13 Demand components, oil exporters
(indices of total real demand, real GDP)
Sources: IMF and ECB calculations. Note: Data for 2006 are estimates.
The spending response of oil-exporting WCA countries to the rise in oil prices has been mixed. While domestic demand has increased
23ECB
Occasional Paper No 60April 2007
3 MAJOR CHANNELS THROUGH WHICH
COMMODITY PRICE CHANGES INFLUENCE
INFLATION
substantially in Equatorial Guinea, Congo and Nigeria (in the latter two countries it has even outpaced the growth of real GDP), spending behaviour has been more moderate in the other oil-exporting countries (see Chart 13). While private sector spending for investment or consumption purposes has been the main driver of domestic demand in almost all oil-exporting countries, as well as in the prospective oil producer São Tomé and Príncipe, public spending has also expanded, in particular in Equatorial Guinea and Nigeria.
Among oil-importing countries, the expansion of demand has been subdued and mainly reflects a rise in private consumption. Due to regional conflicts, domestic demand has seen temporary slumps in several countries, such as the Democratic Republic of the Congo and Sierra Leone (see Chart A1 in the Annex). At the same time, several oil exporters have recorded sizeable budget surpluses, indicating that governments have saved a substantial part of the windfall revenues originating from commodity price rises. This holds true in particular for Congo, Equatorial Guinea, Gabon and Nigeria (see Chart 14; for oil-importing countries, see Chart A2 in the Annex). The budget positions of Cameroon and Chad, however, have not benefited significantly from the oil price boom. In the case of Cameroon, this may be due to the relatively small share of oil exports in GDP (6.3% in 2005, see Table 1). In Chad, where public finance management is
considered to be weak, oil production only started in 2003.
In the medium to long term, however, strong public spending may become a cause of mounting inflationary pressure if – as in the past22 – oil revenues are not used efficiently, ie. for raising the productive potential and diversifying the economies concerned. Sound investments that strengthen the supply side of the economy, including the institutions supporting a functioning market economy, will be key in ensuring sustainable, non-inflationary growth. Efficient use of oil revenues is by no means assured as standard indicators suggest that oil-exporting WCA countries face substantial governance challenges (see Table 4).
Moreover, inflation risks may arise in the event of a substantial drop in the price of oil and other commodities. Experience of past commodity price booms suggests that adjusting public spending in the wake of a decline in commodity prices may be difficult due to policy reversal costs.23 Thus, government spending
Table 4 Oil exporters, governance indicators in 2004
22 For evidence on spending behaviour of oil producers during the oil price boom of the 1970s, see Malik (2006), Ondo Mañe (2005) and Sala-i-Martin and Subramanian (2003).
23 Policy reversal costs typically stem from sunk costs related to investments and from difficulties in reducing public sector employment and wages, Boccara and Devarajan (1993). On fiscal soundness as a prerequisite for a favourable institutional monetary policy setting in the context of highly oil-dependent countries, see also Fanizza and Söderling (2006).
24ECB Occasional Paper No 60April 2007
Chart 14 Government balance, oil exporters
(balance as a percentage of GDP; oil price index, 1995 = 100)
Sources: IMF and ECB calculations. Note: Data for 2006 are estimates.
government balance (left-hand scale)oil price (right-hand scale)
tends to remain high and increasingly financed by public borrowing, and possibly through monetary financing. As a result, countries may face inflationary pressure at times of declining oil and commodity prices.
Up to now, however, the inflationary impact of any increase in spending originating from a rise in the price of oil and other commodities seems to have been mitigated by a flexible supply-side response on the part of domestic and global markets. While it is difficult to quantify output gaps for the economies under review,24 the available evidence suggests that capacity constraints have not yet become binding (see Chart A3 in the Annex), possibly reflecting a rapidly growing labour force. World Bank data indicate that since 1990 the labour force in the region as a whole has increased by 50%, with the annual rate of increase ranging between 2.2% and 3.2%.
Other indicators measuring capacity constraints, such as the unemployment rate or wage and productivity growth rates, are not available for most WCA countries. For the countries that do publish unemployment data, no general trend can be identified. While Nigeria has reported a stable unemployment rate of 4.5% since 2002, unemployment in Côte d’Ivoire increased from 6.7% in 1999 to 8.4% in 2005. By contrast, Cape Verde and São Tomé and Príncipe have seen a gradual decline in unemployment, but current rates are still around 18%. Thus, while the available evidence should be interpreted with caution, as employment might have increased in the informal sectors25 of the economies, possibly leading to rising wage pressures, it does not provide strong support for the proposition that countries face an immediate risk of strong inflationary demand pressures.
Inflationary pressures originating from a rise in private and public spending have also been contained, as a large part of the increase in domestic demand has been directed towards
global markets. As a result, imports have risen substantially when expressed as a share of GDP (see Chart 15), but even more so in absolute terms. Indeed, expressed in US dollars, imports by Chad and Equatorial Guinea were more than four times higher in 2006 than in 1999. Nigeria, the largest oil producer in the region, was expected to import goods and services in the amount of about USD 38 billion in 2006, up from close to USD 15 billion in 1999.
24 Given that output series have been disrupted by exogenous shocks and political instability in many WCA countries, it is statistically difficult to calculate reliable output gaps by applying a band-pass filter which isolates the long-term trend from the short-term cyclical component.
25 ILO data on selected Sub-Saharan African economies suggest that the informal sector accounts for a sizeable share of total employment. For example, data for Cameroon (1992), Ghana (1999) and Nigeria (1999) put the informal sector’s share of total employment at more than 30% in Nigeria and more than 80% in the other two countries (Xaba, Horn and Motala 2002).
3 MAJOR CHANNELS THROUGH WHICH
COMMODITY PRICE CHANGES INFLUENCE
INFLATION
Chart 15 Import intensity, oil and mineral exporters
(imports as a percentage of GDP)
Sources: IMF and ECB calculations.
2000-2005 average1995-1999 average
1501251007550250
Democratic Republicof the Congo
Central AfricanRepublic
Cameroon
Niger
Guinea
Sierra Leone
Gabon
Côte d’Ivoire
Mauritania
Nigeria
Equatorial Guinea
Congo
Mali
Chad
26ECB Occasional Paper No 60April 2007
Box 4
STABILISATION FUNDS, SAVINGS FUNDS AND FISCAL RULES
Stabilisation funds aim to adjust government spending and cushion the domestic economy from sharp and unpredictable variations in commodity prices and, consequently, in revenues. Stabilisation funds face a number of challenges, including determining the benchmark value of the respective commodity price. Commodity prices usually exhibit random walk behaviour and do not fluctuate around a fixed average. Moreover, funds will not fulfil their stabilising function if the overall fiscal policy stance does not reflect the position of the commodity price cycle. In the past, optimistic revenue expectations during commodity booms have led many countries to engage in heavy borrowing which was facilitated by easy access to credit from global markets. The objective of savings funds is to save part of the export receipts for future generations, given that mineral resources are non-renewable. When a country opts for a fiscal rule rather than a stabilisation or savings fund, it regulates government spending on the basis of a benchmark value related to the price of the commodity or the volume of exports. A fiscal rule is a less binding commitment than that implied by savings or stabilisation funds, as it does not entail the accumulation of revenues but only regulates the level of spending in line with prospective revenues from the commodity.
Among WCA countries, funds have been established mainly in oil exporting countries, namely Gabon, Chad, Equatorial Guinea (savings) and Mauritania (stabilisation). São Tomé and Príncipe and Burkina Faso aim to establish a savings fund for oil revenues and a stabilisation fund for cash crop revenues respectively, while Cameroon and Nigeria have opted for fiscal rules. The implementation of selected funds and rules is discussed in the following paragraphs.
The Gabon Fund for Future Generations (FGF), established in 1998, is serving the country for the transition from an economy highly dependent on oil to a diversified one, owing to the fact that Gabon’s oil resources will be exhausted within 30 years. The fund is held at the Banque Centrale des États d’Afrique Centrale and – as at June 2006 – has been remunerated at 2.2% as a “special account”. According to the law that established the fund, assets are to be invested in stocks of companies with international reputations and in low-risk financial instruments. However, capital was withdrawn in 2003 and, generally, the fund receives low contributions from the budget, probably because the interest rate on public debt is much higher than the FGF interest rate and the government is more committed to the repayment of debt. Indeed, in the past six years the fund has accumulated only XAF 240 billion while oil revenues have increased by XAF 450 billion.1
In Chad, a Revenue Management Programme was implemented in 1998 in recognition of the establishment of a pipeline between Chad and Cameroon, supported by the World Bank. Under the Programme, the Chad government was committed to placing 10% of direct oil revenues from dividends and royalties in a trust for future generations. From the beginning of the oil boom in 2003 until early 2006, the trust accumulated USD 36 million. However, in January 2006, the fund was abolished as a result of the reform of the Revenue Management Programme, and its revenues were transferred to the budget.
1 See IMF (2006d).
27ECB
Occasional Paper No 60April 2007
In 1998, Equatorial Guinea established a Fund for Future Generations and adopted a law whereby 0.5% of oil revenues would be held in the Fund. Although the government has adhered to this commitment in recent years, the value of 0.5% is too low to constitute a major constraint for government balances.
Mauritania became an oil exporter in February 2006. In March 2006, it established the National Hydrocarbon Revenue Fund (FNRH). The fund receives all oil revenues that accrue to the government, namely shares of profits and bonuses, taxes paid by all enterprises in the sector and dividends paid by the Mauritanian Hydrocarbon Company. The FNRH is an offshore account placed with the Banque de France and directly managed by the Banque Centrale de Mauritanie. It does not borrow, and income earned on the assets is reinvested. The resources of the FNRH are either saved in order to smooth the adjustment of public spending if prices were to fall, or are used to repay outstanding debt, including government debt vis-à-vis the central bank. Data from the Comité National de Suivi des Revenues des Hydrocarbures, which supervises the fund, indicate that while revenue accumulation in the fund has been fairly stable, at an average of USD 15 million per month, withdrawals from the fund have been conducted quite irregularly and range from USD 40 million in July 2006 to zero withdrawals in August and September.
São Tomé and Príncipe aims to establish a savings fund, as estimates indicate that in 2013 oil revenues will become a stable source of financing for the budget. The Permanent Fund for Future Generations (PFFG) will be regulated by a fiscal rule based on the model of the permanent income hypothesis (PIH). Simulations suggest that, in the scenario of the PIH, budget revenues from oil will be stable until 2033 at around USD 92 million per annum, with the PFFG reaching a steady state level of USD 3.1 billion. Thus, fiscal policy is pursuing an adjustment path towards the assumed steady state level taking account of the annual budget revenues predicted under the PIH.2
Stabilisation funds may also benefit agricultural commodity producers. Although windfall revenues are not as large as in the case of oil, agricultural commodity prices have been volatile in the past. Against this background, cotton farmers and ginning companies in Burkina Faso are considering the application of a cotton price-setting mechanism (Fonds de Lissage), which would tie domestic producer prices to a moving average band of past and expected future price developments. If prices exceeded the band, cash reserves would be built up. If prices fell below the band, producers would receive the agreed domestic producer price, with the difference being drawn from the fund. If this mechanism works well, it may be extended to other countries and other agricultural commodities.
After several attempts to establish a stabilisation fund in the 1990s, Nigeria has adopted a fiscal rule which takes into consideration a calculated stream of oil revenue at an assumed constant price per barrel.3 The 2004 budget was based on an assumed oil price of USD 25 per barrel and production of 2.5 million barrels per day. Thus, the government saved oil revenues in excess of this benchmark price and production level (equivalent to 4.5% of GDP). This led to savings of about USD 6 billion in 2004 and an increase in international reserves to USD 28 billion in 2005, of which USD 8 billion were used for the Paris Club debt relief agreement.
2 See Segura (2006).3 See Fasano (2000).
3 MAJOR CHANNELS THROUGH WHICH
COMMODITY PRICE CHANGES INFLUENCE
INFLATION
28ECB Occasional Paper No 60April 2007
3.3 LIQUIDITY CHANNEL
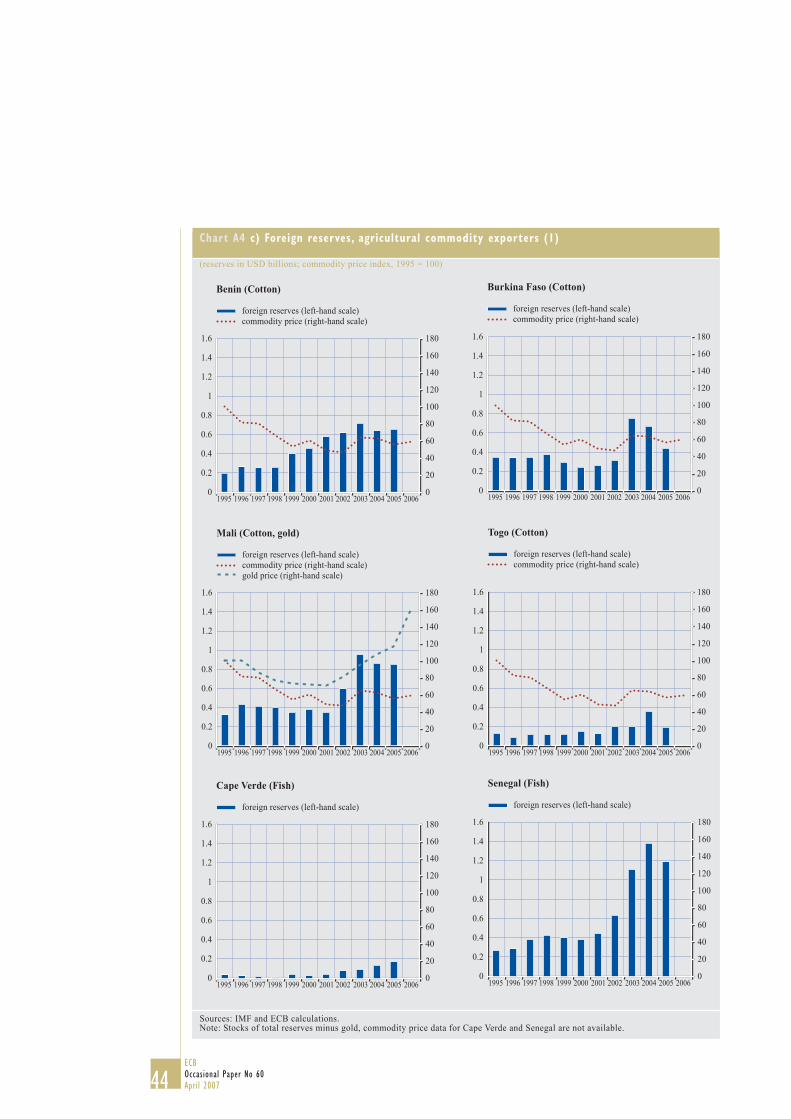
The rise in commodity prices has been associated with strong capital inflows to WCA countries, raising the level of liquidity in the receiving financial sectors. Moreover, in many WCA countries, capital inflows have also reflected an increase in remittance flows and foreign aid.26 Additionally, keen interest in the African continent from emerging economies, most notably China, is likely to contribute to future capital inflows to some countries in the region.27
Given the dominance of fixed exchange rate regimes in WCA countries, strong capital inflows have been accompanied by a rapid rise in foreign exchange reserves (see Chart 8). While the increase has been most pronounced in oil-exporting countries, foreign exchange reserves have been growing rapidly in other WCA countries as well, in particular in countries where oil production has just started or is set to start (Mauritania and São Tomé and Príncipe) and in countries experiencing a surge in remittances (Cape Verde and Ghana). Chart A4 in the Annex illustrates foreign reserves together with commodity price developments.
Countries experiencing the most rapid rise in foreign exchange reserves have made active use of sterilisation instruments. While the ratio of foreign exchange reserves to reserve money was broadly stable or even declined slightly in nine countries in the period 2000–2005, the ratio grew rapidly in some oil-exporting countries (Congo, Equatorial Guinea, Gabon and Nigeria) and the two prospective oil-
exporting countries (Mauritania and São Tomé and Príncipe), as well as in Cape Verde and Ghana, two non-oil exporters experiencing strong growth in foreign exchange reserves. This suggests that authorities have been making active use of sterilisation instruments, thereby limiting the impact of foreign exchange interventions on reserve money growth.28
Correlation analysis reveals that in Nigeria growth in foreign exchange reserves was even negatively correlated with growth in reserve money in the period 1999-2005, indicating that the authorities were particularly active in sterilising interventions (see also Box 5). In the CAEMC and the WAEMU, the correlation between growth rates of foreign exchange reserves and reserve money has been positive, reaching 0.75 in the CAEMC and 0.84 in the WAEMU.
Cameroon has restrained government spending through a built-in contingency mechanism formulated in 2003. The mechanism aims to regulate expenditure from oil revenues and net domestic borrowing. Oil revenues were based on the assumption of a price of USD 25.70 per barrel of Cameroonian crude and an export volume of 18 million barrels for the second half of 2003, and on projections for subsequent years. Based on these assumptions, a quantitative performance criterion on the contribution of oil revenues to the government budget was estimated. Higher than programmed oil revenues and all privatisation proceeds are allocated to repayments of domestic and external debt.
26 On capital inflows in Sub-Saharan Africa, see Mohanty and Turner (2006). Barnichon and Peiris (2007) estimate the real money gap for selected African countries and find a significant impact of excess money on inflation.
27 During the last China-Africa summit held in Beijing in November 2006, China pledged to double its aid to Africa by 2009 and to provide USD 10 billion in preferential loans and export credits. Deals signed with WCA countries in the context of the summit included a USD 3 billion iron ore development project with Gabon, encompassing the extension of a railway and the construction of a bulk commodities and container port, the building of a USD 600 million hydroelectric dam in Ghana and the realisation of a USD 8 billion railway project in Nigeria, to which China granted a USD 2.5 billion loan.
28 Calvo and Reinhart (1999) review the experience of sterilisation efforts of various sub-Saharan African countries. Boccara and Devarajan (1993) highlight the challenges of sterilisation in the context of the CFA monetary unions.
29ECB
Occasional Paper No 60April 2007
Box 5
FOREIGN EXCHANGE INTERVENTIONS AND STERILISATION IN NIGERIA
Rising oil prices associated with strong capital inflows to Nigeria have put the exchange rate under appreciation pressures to which the Central Bank of Nigeria (CBN) has reacted by carrying out substantial interventions in the foreign exchange market. As a result, foreign exchange reserves rose from USD 6.7 billion at end-2003 to USD 39.2 billion in August 2006.
In 2004 and 2005, the CBN was successful in limiting money supply growth to levels between 15% and 20%, while foreign exchange reserves grew by up to 140% (see the chart). This performance reflects a number of sterilisation measures taken by the authorities:
1. The withdrawal of public sector deposits from commercial banks. Between 2004 and 2005, deposits of the public sector, mainly those of the Nigerian National Petroleum Company, which holds a 57% share of the total oil industry, were moved from commercial banks to the CBN. Public sector deposits at the CBN steadily increased from about NGN 200 billion in November 2003 to more than NGN 2,300 billion in mid-2005. Since then, the amount of deposits held at the CBN has been quite volatile, fluctuating between NGN 1,200 billion and NGN 2,700 billion, sterilising between 40% and 60% of total foreign exchange reserves.
2. Sale of bonds. Between November 2003 and August 2005, the CBN was active in selling CBN bonds to mop up excess liquidity. Bond sales increased from NGN 30,650 million in November 2003 to NGN 73,400 million in August 2005.
3. Raising reserve requirements. At the beginning of 2005, the CBN raised the cash rate ratio (CRR)1 from 9.5% to 10%. At end-2005, however, probably as a response to a decline in broad money growth seen at the end of 2005, the ratio was cut to 5%.
Since early 2006 broad money growth has been accelerating, once again reaching more than 30% year on year and almost 60% at an annualised rate – close to the growth rate observed for foreign exchange reserves. Against the background of a target range of 15%-17% for broad money growth, and renewed inflationary pressures, the CBN raised the minimum rediscount rate from 13% to 14%.
1 The cash rate ratio is defined as the proportion of the total demand deposits, savings and time deposits which banks are expected to keep as deposits with the central bank.
Jan. July Jan. July Jan. July Jan. July Jan. Jan.July-40-20
020406080
100120140160
-40-20020406080100120140160
2001 2002 2003 2004 2005 2006
3 MAJOR CHANNELS THROUGH WHICH
COMMODITY PRICE CHANGES INFLUENCE
INFLATION
30ECB Occasional Paper No 60April 2007
The exchange rate regime, sterilisation efforts and resource endowments are key factors explaining the divergence of broad money growth rates in the region (see Chart 16). In the CAEMC, where the growth of foreign exchange reserves and reserve money has increased substantially in recent years, reflecting the dominance of oil-exporting countries in the group and a lack of sterilisation, year-on-year broad money growth has been accelerating, peaking in May 2006 at 30%. By contrast, broad money growth in the WAEMU, which consists of non-oil-exporting countries, has remained subdued, albeit recently increasing to about 8%. Nigeria has seen the largest volatility in money growth rates. In general, credit growth to the private sector has followed developments in monetary aggregates.
Standard indicators of financial development suggest that financial sectors in most WCA countries are underdeveloped. The level of monetisation, as measured by the broad money to GDP ratio, is below 30% and the level of financial intermediation, as measured by the private sector credit to GDP ratio, is below 15% in most countries (see Chart 17).
WCA countries are largely cash-based economies. In 17 countries the share of currency in broad money is around 20% or more. In some countries, such as the Central African Republic, Chad and Guinea Bissau, currency accounts for even more than 60% of broad money.
Faced with strong inflows of foreign capital, commercial bank reserves held with the central bank in excess of the required reserves have
Chart 16 Growth in broad money
(percentages, year on year)
Sources: IMF and ECB calculations.
-10
10
20
30
40
50
60
70
80
-10
0
10
20
30
40
50
60
70
80
-10
10
20
30
40
50
60
70
80
-10
0
10
20
30
40
50
60
70
80
CAEMCWAEMUNigeria
Jan. July Jan. July Jan. July Jan. July Jan. July Jan.2001 2002 2003 2004 2005 2006
Chart 17 Financial market depth
(broad money and credit, as percentages of GDP, averaged over 2000-2005)
Sources: IMF and ECB calculations.Note: Broad money is defined as money plus quasi-money, credit denotes credit to the private sector. Data for the Democratic Republic of the Congo and Liberia are not available.
Equatorial GuineaChadNiger
MauritaniaCongoGuinea
Central African RepublicGabon
CameroonSierra LeoneBurkina Faso
NigeriaCôte d’Ivoire
TogoMali
BeninSenegal
GhanaGuinea-Bissau
The GambiaSão Tomé & Príncipe
Cape Verde
money ratiocredit ratio
0 10 20 30 40 50 60 70 80
31ECB
Occasional Paper No 60April 2007
4 CONCLUSIONS AND POLICY CHALLENGESbeen rising rapidly in some WCA countries,29 in
particular in oil-exporting countries such as Congo, Equatorial Guinea and Gabon (see Chart 18; see Chart A5 in the Annex for oil-importing countries). In general, however, excess reserve ratios have been rather stable, albeit at high levels, in most cases surpassing the level of required reserves, thereby confirming the underdeveloped status of financial sectors in many WCA countries. This suggests that banks have been unwilling or unable (for example due to a lack of bankable projects in a poor lending environment) to expand financial intermediation in an environment characterised by rapid output growth.
A strong increase in the demand for money is the most plausible explanation for the limited impact of strong foreign exchange, reserve and broad money growth on inflation. Standard money demand functions suggest that rapid output growth in an environment characterised by comparatively low inflation and broad exchange rate stability should lead to a rise in money demand. Moreover, similar evidence has been found in other resource-rich economies, such as Russia.
However, the abundance of liquidity in many WCA countries may lead to increasing inflationary pressures in the medium term. In particular, risks to the inflation outlook may arise if – reflecting potential low levels of governance and financial development – either the government or the banking sector channels liquid funds to inefficient investment projects, thereby combining the potential inflationary impact of both the spending channel and the liquidity channel.30 Moreover, it may be difficult for monetary authorities to influence money supply and steer domestic demand if banks hold large amounts of liquidity in excess of minimum reserves. This is because mopping up liquidity can be very costly since issuing bonds or increasing remunerated minimum reserve requirements would increase the interest burden of the central bank.
29 Following Saxegaard (2006), excess liquidity is defined as commercial bank holdings of liquid assets with the central bank in excess of the effective statutory level. Country data up to 2004 are taken from Saxegaard (2006) and updated to 2006 if available.
30 See IMF (2006c) and Sy (2006) on financial sector challenges in the context of excess liquidity in the CAEMC and the WAEMU, respectively.
4 CONCLUSIONS AND POLICY CHALLENGES
Given the diversity of WCA economies, no general assessment of economic developments in the region can be derived that fits each individual country. Bearing this caveat in mind, it seems fair to conclude that in the early years of the new millennium many WCA economies have enjoyed a period of strong growth which has been accompanied by a relatively high degree of monetary stability.
While rising commodity prices have supported export growth in almost all economies, economic developments in net oil exporters and importers have been markedly different, as (prospective) oil exporters have – in general – seen higher growth and inflation than other WCA countries. The divergence is not only caused by the fact that oil prices have been increasing much faster than prices of other commodities, but also by the extreme importance of oil for the economies of most oil-exporting countries, and the need for oil importers to cope with rising import prices.
Many WCA countries have been faced with the challenge of absorbing strong capital inflows in a non-inflationary, growth-promoting manner. This has been most obvious in resource-rich countries, given the current account implications of rising commodity prices. However, in some countries capital inflows have also been associated with rapidly rising remittances and foreign aid flows.
Up to now, the inflationary impact of the rise in commodity prices, in particular oil prices, and of the associated increase in domestic spending and benign liquidity conditions, has been limited. More detailed analysis reveals that governments of oil-rich countries have reacted
32ECB Occasional Paper No 60April 2007
Chart 18 Excess liquidity, oil exporters
(percentages of total bank deposits, price index, 1995 = 100)
Sources: IMF, Saxegaard (2006), national sources and ECB calculations.Note: The CAEMC countries Cameroon, Chad, Congo, Equatorial Guinea and Gabon introduced minimum reserve requirements in 2001.
quite prudently to the windfall revenues originating from higher oil prices. Although spending has increased substantially, the budget position has improved markedly in several countries, with some governments running sizeable fiscal surpluses. Moreover, the supply-side response to the rise in private and public spending has been favourable. Capacity constraints in domestic markets have not yet been reached, while global markets have been easily supplying goods and services, as shown by the rapid rise in imports by WCA countries. Finally, sterilisation efforts and an increase in money demand have helped dampen inflationary pressures resulting from the rise in liquidity originating from strong capital inflows.
Sustaining non-inflationary growth in an environment characterised by high commodity prices remains the key policy challenge facing WCA authorities. The challenge is daunting, as out of the 24-country sample, 16 economies operate under fixed exchange rate regimes, either in the form of the CFA monetary unions or a currency peg. Of the eight remaining countries, seven operate under a managed float regime, with only the Democratic Republic of the Congo being classified as an independent float regime. Thus, the scope for monetary policy to make an active contribution to fighting inflationary pressures is limited.
The dominance of pegs and tightly managed floats implies that central banks are likely to continue intervening in foreign exchange markets, counteracting appreciation pressures. Moreover, even though capital account liberalisation has not been completed in the region, the uncovered interest rate parity condition sets tight limits on an expansion of sterilisation efforts, with significant implications for (rising) domestic interest rates. In addition, central banks will aim to avoid sterilisation losses, which – given the importance of foreign exchange reserves to central bank balance sheets – would immediately be felt in the profit and loss account.
Substantial excess reserves of commercial banks indicate that financial sector development in many WCA countries represents an additional challenge that needs to be met in order to channel capital inflows to productive uses. However, this is a medium-term, structural challenge, as it focuses as much on the quality as on the quantity of financial intermediation. Indeed, a purely quantitative increase in financial development, e.g. a rise in the private sector credit to GDP ratio, would be counterproductive if it represented unsound lending practices. A credit-based expansion of domestic demand would actually increase inflationary pressures if borrowers did not make productive use of the funds.
Taking current exchange rate regimes as given, fiscal policy will continue to bear most of the burden of ensuring sustainable, non-inflationary growth. While fiscal policies have been prudent overall in many WCA countries in recent years, further progress – including the establishment and proper functioning of oil stabilisation and savings funds or fiscal rules – would seem to be needed to cope with the cyclical and structural policy challenges posed by high commodity prices. Indeed, given the current level of oil prices and other commodity prices and the associated capital inflows, even higher surpluses and/or lower deficits might be needed to maintain macroeconomic stability. Moreover, they would facilitate any adjustment process in the event of a pronounced decline in commodity prices.
In structural terms, given the uncertainty surrounding the character of a commodity price shock, in particular whether it is temporary or permanent, fiscal policy is called upon to support, via targeted spending, the ability of economies to diversify away from oil and other dominant commodities. Alternatively, government savings, e.g. based on an explicit fiscal rule and/or a savings fund, would dampen cyclical demand pressures and address long-term intergenerational equity considerations.
Sources: IMF, Saxegaard (2006), national sources and ECB calculations.Note: Effective minimum reserve ratios are calculated as the average of the statutory minimum reserve requirement ratios on demand deposits and on savings and time deposits, weighted by the actual respective deposits.
35ECB
Occasional Paper No 60April 2007
Chart A1 a) Demand components, non-agricultural commodity exporters
(indices of total real demand, real GDP)
Sources: IMF and ECB calculations. Note: Data for 2006 are estimates.
Chart A2 c) Government balance, agricultural commodity exporters (2)
(balance as a percentage of GDP; commodity price indices, 1995 = 100)
Sources: IMF and ECB calculations.Note: São Tomé and Príncipe received signatuer bonuses and interest oil proceeds amounting to 75% of GDP (2005) and 78% of GDP (2006); data for 2006 are estimates.
government balance (left-hand scale)commodity price (right-hand scale)oil price (right-hand scale)
Sources: IMF and ECB calculations.Note: The output gaps equal the cyclical GDP components, derived by applying the Baxter-King band-pass filter and expressed as a percentage of GDP. The underlying data period stretches from 1980 to 2008 (estimates for 2006-2008). Due to the three-year lead/lag structure of the filter, three years are cut off at both ends of the sample.
Chart A4 b) Foreign reserves, non-agricultural exporters
(reserves in USD billions; commodity price index, 1995 = 100)
Sources: IMF and ECB calculations.Note: Stocks of total reserves minus gold; no data are available for DR Congo since 1997 and for Mauritania since 2004.
Chart A5 c) Excess liquidity, agricultural commodity exporters (2)
(percent of total bank deposits, price index, 1995 = 100)
Sources: IMF, Saxegaard (2006), national sources and ECB calculations.Note: Liquidity data are unavailable for Liberia before 2000 and for São Tomé & Príncipe before 1997.
Barnichon, Régis and Shanaka Peiris (2007), “Sources of inflation in Sub-Saharan Africa”, IMF Working Paper 07/32.
Bartsch, Ulrich (2006), “How much is enough? Monte Carlo simulations of an oil stabilisation fund for Nigeria”, IMF Working Paper 06/142.
Boccara, Bruno and Shantayanan Devarajan (1993), “Determinants of inflation among Franc zone countries in Africa”, World Bank Policy Research Working Paper 1197.
Calvo, Guillermo and Carmen Reinhart (1999), “The consequences and management of capital inflows: Lessons for Sub-Saharan Africa”, Almqvist & Wiksell.
Cody, Brian and Leonard Mills (1991), “The role of commodity prices in formulating monetary policy”, The Review of Economics and Statistics 73(2), pp. 358-365.
Davis, Jeffrey, Rolando Ossowski, James Daniel and Steven Barnett (2001), “Stabilization and savings funds for non-renewable resources: experience and fiscal policy implications”, IMF Occasional Paper 205.
Deaton, Angus and Ron Miller (1995), “International commodity prices, macroeconomic performance and politics in Sub-Saharan Africa”, Princeton Studies in International Finance 79.
El Said, Moataz and Daniel Leigh (2006), “Fuel price subsidies in Gabon: Fiscal Cost and Distributional Impact”, IMF Working Paper 06/243.
Fanizza, Domenico and Ludvig Söderling (2006), “Fiscal determinants of inflation: A primer for the Middle East and North Africa”, IMF Working Paper 06/216.
Fasano, Ugo (2000), “Review of the experience with oil stabilization and savings funds in selected countries”, IMF Working Paper 00/112.
Hill, Catherine (1991), “Managing commodity booms in Botswana”, World Development 19(9), pp. 1185-1196.
IMF (2005), CAEMC Country Report 05/390, International Monetary Fund.
IMF (2006a), World Economic Outlook 02/2006, International Monetary Fund.
IMF (2006b), Sub-Saharan Africa Regional Economic Outlook, International Monetary Fund.
IMF (2006c), CAEMC Financial System Stability Assessment, International Monetary Fund.
IMF (2006d), Gabon Country Report 06/238, International Monetary Fund.
BIBLIOGRAPHY
50ECB Occasional Paper No 60April 2007
Malik, Adeel (2006), “Macroeconomic effects of commodity shocks: A review of issues”, Centre for the Study of African Economies, Oxford University.
Marinkov, Marina and Philippe Burger (2005), “The various dimensions of commodity dependence in Africa”, South African Journal of Economics 73(2), pp. 269-291.
Marquis, Milton and Steven Cunningham (1990), “Is there a role for commodity prices in the design of monetary policy? Some empirical evidence”, Southern Economic Journal 57(2), pp. 394-412.
Masson, Paul and Catherine Pattillo (2005), The monetary geography of Africa, Brookings Institution Press.
Mohanty, M. S. and Philip Turner (2006), “The global economy and Africa: The challenges of increased financial inflows”, Central banks and the challenge of development, Bank for International Settlements, pp. 26-43.
Ondo Mañe, Damian (2005), “Emergence of the Gulf of Guinea in the global economy: Prospect and challenges”, IMF Working Paper 05/235.
Sala-i-Marin, Xavier and Arvind Subramanian (2003), “Addressing the natural resource curse: An illustration from Nigeria”, NBER Working Paper 9804.
Saxegaard, Magnus (2006), “Excess liquidity and effectiveness of monetary policy: Evidence from Sub-Saharan Africa”, IMF Working Paper 06/115.
Segura, Alonso (2006), “Management of oil wealth under the permanent income hypothesis: the case of São Tomé and Príncipe”, IMF Working Paper 06/183.
Shortland, Anja and David Stasavage (2004), “What determines monetary policy in the Franc zone? Estimating a reaction function for the BCEAO”, Journal of African Economies 13(4), pp. 518-535.
Sy, Amadou (2006) “Financial integration in the WAEMU”, IMF Working Paper 06/214.
UNCTAD (2003), “Economic development in Africa. Trade performance and commodity dependence”, United Nations Conference on Trade and Development.
World Bank (2006), “Coping with higher oil prices”, Energy Sector Management Assistance Program Report, The World Bank Group.
Xaba, Jantjie, Pat Horn and Shirin Motala (2002), “The informal sector in Sub-Saharan Africa”, ILO Working Paper 2002/10.
51ECB
Occasional Paper No 60April 2007
1 “The impact of the euro on money and bond markets” by J. Santillán, M. Bayle andC. Thygesen, July 2000.
2 “The effective exchange rates of the euro” by L. Buldorini, S. Makrydakis and C. Thimann, February 2002.
3 “Estimating the trend of M3 income velocity underlying the reference value for monetary growth” by C. Brand, D. Gerdesmeier and B. Roffia, May 2002.
4 “Labour force developments in the euro area since the 1980s” by V. Genre andR. Gómez-Salvador, July 2002.
5 “The evolution of clearing and central counterparty services for exchange-traded derivatives in the United States and Europe: a comparison” by D. Russo, T. L. Hart and A. Schönenberger, September 2002.
6 “Banking integration in the euro area” by I. Cabral, F. Dierick and J. Vesala, December 2002.
7 “Economic relations with regions neighbouring the euro area in the ‘Euro Time Zone’” by F. Mazzaferro, A. Mehl, M. Sturm, C. Thimann and A. Winkler, December 2002.
8 “An introduction to the ECB’s survey of professional forecasters” by J. A. Garcia, September 2003.
9 “Fiscal adjustment in 1991-2002: stylised facts and policy implications” by M. G. Briotti, February 2004.
10 “The acceding countries’ strategies towards ERM II and the adoption of the euro: an analytical review” by a staff team led by P. Backé and C. Thimann and including O. Arratibel, O. Calvo-Gonzalez, A. Mehl and C. Nerlich, February 2004.
11 “Official dollarisation/euroisation: motives, features and policy implications of current cases” by A. Winkler, F. Mazzaferro, C. Nerlich and C. Thimann, February 2004.
12 “Understanding the impact of the external dimension on the euro area: trade, capital flows and other international macroeconomic linkages“ by R. Anderton, F. di Mauro and F. Moneta, March 2004.
13 “Fair value accounting and financial stability” by a staff team led by A. Enria and including L. Cappiello, F. Dierick, S. Grittini, A. Maddaloni, P. Molitor, F. Pires and P. Poloni, April 2004.
14 “Measuring financial integration in the euro area” by L. Baele, A. Ferrando, P. Hördahl, E. Krylova, C. Monnet, April 2004.
EUROPEAN CENTRAL BANKOCCASIONAL PAPER SERIES
EUROPEAN CENTRAL BANK
OCCAS IONAL PAPER SER IES
52ECB Occasional Paper No 60April 2007
15 “Quality adjustment of European price statistics and the role for hedonics” by H. Ahnert and G. Kenny, May 2004.
16 “Market dynamics associated with credit ratings: a literature review” by F. Gonzalez, F. Haas, R. Johannes, M. Persson, L. Toledo, R. Violi, M. Wieland and C. Zins, June 2004.
17 “Corporate ‘excesses’ and financial market dynamics” by A. Maddaloni and D. Pain, July 2004.
18 “The international role of the euro: evidence from bonds issued by non-euro area residents” by A. Geis, A. Mehl and S. Wredenborg, July 2004.
19 “Sectoral specialisation in the EU: a macroeconomic perspective” by MPC task force of the ESCB, July 2004.
20 “The supervision of mixed financial services groups in Europe” by F. Dierick, August 2004.
21 “Governance of securities clearing and settlement systems” by D. Russo, T. Hart, M. C. Malaguti and C. Papathanassiou, October 2004.
22 “Assessing potential output growth in the euro area: a growth accounting perspective” by A. Musso and T. Westermann, January 2005.
23 “The bank lending survey for the euro area” by J. Berg, A. van Rixtel, A. Ferrando, G. de Bondt and S. Scopel, February 2005.
24 “Wage diversity in the euro area: an overview of labour cost differentials across industries” by V. Genre, D. Momferatou and G. Mourre, February 2005.
25 “Government debt management in the euro area: recent theoretical developments and changes in practices” by G. Wolswijk and J. de Haan, March 2005.
26 “The analysis of banking sector health using macro-prudential indicators” by L. Mörttinen, P. Poloni, P. Sandars and J. Vesala, March 2005.
27 “The EU budget – how much scope for institutional reform?” by H. Enderlein, J. Lindner, O. Calvo-Gonzalez, R. Ritter, April 2005.
28 “Reforms in selected EU network industries” by R. Martin, M. Roma, I. Vansteenkiste, April 2005.
29 “Wealth and asset price effects on economic activity”, by F. Altissimo, E. Georgiou, T. Sastre, M. T. Valderrama, G. Sterne, M. Stocker, M. Weth, K. Whelan, A. Willman, June 2005.
30 “Competitiveness and the export performance of the euro area”, by a Task Force of the Monetary Policy Committee of the European System of Central Banks, June 2005.
31 “Regional monetary integration in the member states of the Gulf Cooperation Council (GCC)” by M. Sturm and N. Siegfried, June 2005.
53ECB
Occasional Paper No 60April 2007
32 “Managing financial crises in emerging market economies: experience with the involvement of private sector creditors” by an International Relations Committee task force, July 2005.
33 “Integration of securities market infrastructures in the euro area” by H. Schmiedel, A. Schönenberger, July 2005.
34 “Hedge funds and their implications for financial stability” by T. Garbaravicius and F. Dierick, August 2005.
35 “The institutional framework for financial market policy in the USA seen from an EU perspective” by R. Petschnigg, September 2005.
36 “Economic and monetary integration of the new Member States: helping to chart the route” by J. Angeloni, M. Flad and F. P. Mongelli, September 2005.
37 “Financing conditions in the euro area” by L. Bê Duc, G. de Bondt, A. Calza, D. Marqués Ibáñez, A. van Rixtel and S. Scopel, September 2005.
38 “Economic reactions to public finance consolidation: a survey of the literature” by M. G. Briotti, October 2005.
39 “Labour productivity in the Nordic EU countries: a comparative overview and explanatory factors – 1998-2004” by A. Annenkov and C. Madaschi, October 2005.
40 “What does European institutional integration tell us about trade integration?” by F. P. Mongelli, E. Dorrucci and I. Agur, December 2005.
41 “Trends and patterns in working time across euro area countries 1970-2004: causes and consequences” by N. Leiner-Killinger, C. Madaschi and M. Ward-Warmedinger, December 2005.
42 “The New Basel Capital Framework and its implementation in the European Union” by F. Dierick, F. Pires, M. Scheicher and K. G. Spitzer, December 2005.
43 “The accumulation of foreign reserves” by an International Relations Committee Task Force, February 2006.
44 “Competition, productivity and prices in the euro area services sector” by a Task Force of the Monetary Policy Committee of the European System of Central banks, April 2006.
45 “Output growth differentials across the euro area countries: Some stylised facts” by N. Benalal, J. L. Diaz del Hoyo, B. Pierluigi and N. Vidalis, May 2006.
46 “Inflation persistence and price-setting behaviour in the euro area – a summary of the IPN evidence”, by F. Altissimo, M. Ehrmann and F. Smets, June 2006.
47 “The reform and implementation of the stability and growth pact” by R. Morris, H. Ongena and L. Schuknecht, June 2006.
EUROPEAN CENTRAL BANK
OCCAS IONAL PAPER SER IES
54ECB Occasional Paper No 60April 2007
48 “Macroeconomic and financial stability challenges for acceding and candidate countries” by the International Relations Committee Task Force on Enlargement, July 2006.
49 “Credit risk mitigation in central bank operations and its effects on financial markets: the case of the Eurosystem” by U. Bindseil and F. Papadia, August 2006.
50 “Implications for liquidity from innovation and transparency in the European corporate bond market” by M. Laganá, M. Peřina, I. von Köppen-Mertes and A. Persaud, August 2006.
51 “Macroeconomic implications of demographic developments in the euro area” by A. Maddaloni, A. Musso, P. Rother, M. Ward-Warmedinger and T. Westermann, August 2006.
52 “Cross-border labour mobility within an enlarged EU” by F. F. Heinz and M. Ward-Warmedinger, October 2006.
53 “Labour productivity developments in the euro area” by R. Gomez-Salvador, A. Musso, M. Stocker and J. Turunen, October 2006.
54 “Quantitative quality indicators for statistics – an application to euro area balance of payment statistics” by V. Damia and C. Picón Aguilar, November 2006
55 “Globalisation and euro area trade: Interactions and challenges” by U. Baumann and F. di Mauro, February 2007.
56 “Assessing fiscal soundness: Theory and practice” by N. Giammarioli, C. Nickel, P. Rother, J.-P. Vidal, March 2007.
57 “Understanding price developments and consumer price indices in south-eastern Europe” by S. Herrmann and E. K. Polgar, March 2007.
58 “Long-Term Growth Prospects for the Russian Economy”, by Roland Beck, Annette Kamps and Elitza Mileva
59 “The ECB Survey of Professional Forecasters (SPF) a review after eight years’ experience”, by Carlos Bowles, Roberta Friz, Veronique Genre, Geoff Kenny, Aidan Meyler and Tuomas Rautanen, April 2007.
60 “Commodity price fluctuations and their impact on monetary and fiscal policies in Western and Central Africa” by U. Böwer, A. Geis and A. Winkler, April 2007.
ISSN 1607148-4
9 7 7 1 6 0 7 1 4 8 0 0 6
OCCAS IONAL PAPER SER IESNO 55 / JANUARY 2007
THE ROLE OF FINANCIAL MARKETS AND INNOVATION FOR PRODUCTIVITY AND GROWTH IN EUROPE
Revised version of a paper prepared for theInformal ECOFIN Meeting in Helsinki, 8-9 September 2006