54
2013-5 Swiss National Bank Working Papers Commodity Price Shocks and the Business Cycle: Structural Evidence for the U.S. Matthias Gubler and Matthias S. Hertweck

2013
-5Sw
iss
Nati
onal
Ban
k W
orki
ng P
aper
sCommodity Price Shocks and the Business Cycle:Structural Evidence for the U.S.
Matthias Gubler and Matthias S. Hertweck

The views expressed in this paper are those of the author(s) and do not necessarily represent those of the Swiss National Bank. Working Papers describe research in progress. Their aim is to elicit comments and to further debate.
Copyright ©The Swiss National Bank (SNB) respects all third-party rights, in particular rights relating to works protectedby copyright (information or data, wordings and depictions, to the extent that these are of an individualcharacter).SNB publications containing a reference to a copyright (© Swiss National Bank/SNB, Zurich/year, or similar) may, under copyright law, only be used (reproduced, used via the internet, etc.) for non-commercial purposes and provided that the source is mentioned. Their use for commercial purposes is only permitted with the prior express consent of the SNB.General information and data published without reference to a copyright may be used without mentioning the source.To the extent that the information and data clearly derive from outside sources, the users of such information and data are obliged to respect any existing copyrights and to obtain the right of use from the relevant outside source themselves.
Limitation of liabilityThe SNB accepts no responsibility for any information it provides. Under no circumstances will it accept any liability for losses or damage which may result from the use of such information. This limitation of liability applies, in particular, to the topicality, accuracy, validity and availability of the information.
ISSN 1660-7716 (printed version)ISSN 1660-7724 (online version)
© 2013 by Swiss National Bank, Börsenstrasse 15, P.O. Box, CH-8022 Zurich

1
Commodity Price Shocks and the Business Cycle:Structural Evidence for the U.S.∗
Matthias Gubler†
Swiss National BankMatthias S. Hertweck‡
University of Konstanz
This Version: April 25, 2013
Abstract
This paper evaluates the relative importance of commodity price shocks in theU.S. business cycle. Therefore, we extend the standard set of business cycle shocksto include unexpected changes in commodity prices. The resulting SVAR showsthat commodity price shocks are a very important driving force of macroeconomicfluctuations — second only to investment-specific technology shocks — particularlywith respect to inflation. Neutral technology shocks and monetary policy shocks, onthe other hand, seem less relevant at business cycle frequencies. Neutral technologyshocks rather play an important role at low frequencies.
JEL Classifications: C32, E32, E52, Q43Keywords: business cycles, commodity price shocks, structural VAR
∗This paper is based on Chapter 2 of the first author’s doctoral dissertation written at the Uni-versity of Basel. Without implication, we would like to thank Ralf Brüggemann, Patrick Bunk, JesúsFernández-Villaverde, Christian Glocker, Christian Kascha, Robert G. King, Marco Lombardi, AlexanderPerruchoud, Fabien Rondeau, Almuth Scholl, Frank Schorfheide, Atılım Seymen, Konstantinos Theodor-idis, Sebastian Watzka, Attilio Zanetti, and an anonymous referee, as well as conference participants atDIW Berlin, RGS Dortmund, ifo Dresden, VfS Frankfurt, IWH-CIREQ Halle, ICMAIF Rethymno, CEFSan Francisco, SOLE Vancouver, and seminar audiences at the Bank of England, Essex, JLU Gießen,LMU Munich, Penn, and Zurich (KOF-ETH-UZH) for extensive comments and suggestions; and RiccardoDiCecio for kindly sharing his data. Hermione Miller-Moser provided excellent editorial assistance. Thefirst author is indebted to Peter Kugler for his help and supervision. Part of this research project wasconducted while the second author was affiliated with the University of Basel, supported by the SwissNational Science Foundation (Project No. 118306). The views expressed in this paper do not necessarilyreflect the view of the Swiss National Bank.
†Contact Address: Swiss National Bank, Börsenstrasse 15, P.O. Box, 8022 Zürich, Switzerland.Email: [email protected]
‡Corresponding Author: University of Konstanz, Department of Economics, Box 145, 78457 Konstanz,Germany.Email: matthias.hertweck@uni − konstanz.de, Homepage: http : //www.hertweck.org/

2
1 Introduction
What are the sources of the U.S. business cycle? In recent years, the main body of busi-ness cycle research has focused on the impact of (neutral) technology shocks (Galí 1999),investment-specific technology shocks (Fisher 2006), and monetary policy shocks (Chris-tiano et al. 1996). Following this strand of the literature, technology shocks, particularlyinvestment-specific technology shocks, are considered to be a very important driving forceof the business cycle.1 On the other hand, Hamilton (2008) emphasizes that “nine out often” recessions in the postwar era are associated with a surge in oil prices. Given that oilis both a consumption good and an intermediate good, such a surge has a direct impact onthe price level and changes the cost structure of firms (Medina & Soto 2005). Quite sur-prisingly, however, the macroeconomic effects of oil/commodity price shocks have beenstudied either in isolation (Edelstein & Kilian 2007, 2009, Blanchard & Galí 2010), ortogether with monetary policy shocks (Bernanke et al. 1997, Hamilton & Herrera 2004,Herrera & Pesavento 2009, Kilian & Lewis 2011), but never so far in conjunction with thestandard set of business cycle shocks.
This paper bridges the gap between these two strands of the literature. Our mainaim is to quantify the relative importance of commodity price shocks in the U.S. businesscycle. Therefore, we develop a nine-dimensional SVAR, where the standard set of businesscycle shocks (Altig et al. 2011) is extended to include unexpected changes in commodityprices.2 The commodity price shock is identified by assuming that commodity prices arepredetermined with respect to U.S. macroeconomic aggregates. This short-run restrictionis based on the observation that energy prices do not respond immediately to macroeco-nomic news (Kilian & Vega 2011). As explained by Kilian (2008, p. 4), this assumptionprovides a “good approximation” when working with quarterly data. Furthermore, fol-lowing Edelstein & Kilian (2007, 2009), we focus our analysis on the average effects ofcommodity price shocks, irrespective of whether these movements are driven by changesin supply or demand. We subject these identifying assumptions to a number of robustnesschecks (see below).
We find that that commodity price shocks are a very important driving force of theU.S. business cycle, second only to investment-specific technology shocks. In particu-lar, we show that commodity price shocks explain a large share of cyclical movementsin inflation. Results from a historical decomposition of shocks indicate that commodityprice shocks have played a significant role especially during and after the the first OPECoil crisis. Unexpected variations in the relative price of investment goods are the pri-
1Evidence supporting this view includes SVAR studies (Ravn & Simonelli 2008, Canova et al. 2010,Altig et al. 2011) and estimated DSGE models (Gertler et al. 2008, Justiniano et al. 2010).
2We measure commodity prices using the index by the BLS (2012, see also Section 2.1). Given thatthis broad commodity price index is less prone to changes in institutional settings than the price of crudeoil (see Figure 1), we are able to estimate the 9-dimensional SVAR model based on a long sample period.
1

3
mary determinant of business cycle fluctuations in output and per-capita hours. Neutraltechnology shocks and monetary policy shocks, on the other hand, seem less relevant atbusiness cycle frequencies. Neutral technology shocks rather play an important role atlow frequencies.
Furthermore, we demonstrate that an unexpected increase in commodity prices ischaracterized by significant U-shaped responses in output, consumption and per-capitahours. Most notably, the inflation rate displays a significant spike, followed by a rapidreturn to the initial level. The unexpected surge in the inflation rate prompts the FederalReserve to elevate the nominal interest rate. Results of a counterfactual exercise indicatethat the systematic contractionary response helped the Federal Reserve to achieve pricestability in the long run, yet at the cost of a significant economic downturn in output andper-capita hours.3
Besides, we find that the estimated impulse response functions to monetary policyshocks, neutral technology shocks, and investment-specific technology shocks are very sim-ilar compared to those obtained by Altig et al. (2011) or Ravn & Simonelli (2008). Inparticular, the response of per-capita hours to neutral technology shocks is positive andmarginally significant. This result is very robust, no matter whether the data are filteredor not, indicating that concerns about leaving (Fernald 2007, Francis & Ramey 2009,Canova et al. 2010) or removing (Gospodinov et al. 2011) low-frequency movements inthe data are quantitatively not very important as long as the size of the information set issufficiency large. On the other hand, if the information set is small, the impact responseof per-capita hours is indeed extremely sensitive to the treatment of the data. This result,confirms our choice to estimate a large-scale SVAR.
We perform the following robustness checks to test the sensitivity of our results. First,we relax the contemporaneous exogeneity assumption by allowing for immediate responsesin the commodity price index to innovations in U.S. aggregate activity; i.e., labor pro-ductivity growth and per-capita hours. Second, in order to control for contemporaneousmovements in the global demand for commodities, we include a global demand indicator,which is ordered first before the commodity price index (as in Kilian & Lewis 2011). Fur-thermore, we examine robustness to the specific commodity price index used, the choiceof the lag length, and the sub-sample properties of our model. We find that the effects ofa commodity price shock on output and the inflation rate are milder in the post-Volckerperiod, but the impulse responses remain statistically significant at the 10% level. Thisresult is consistent with previous estimates by Edelstein & Kilian (2009), Herrera & Pe-savento (2009) or Blanchard & Galí (2010).
3The counterfactual exercise presumes that the Federal Funds rate is kept constant when the U.S.economy is hit by a commodity price shock (as in Bernanke et al. 1997). However, our approach differs inmany aspects from theirs as we adopt several suggestions — e.g. a linear VAR model (Kilian & Vigfusson2011) with a lag length beyond one year (Hamilton & Herrera 2004) — made in the subsequent debate.
2

4
The remainder of this paper is organized as follows. Section (2) presents the identi-fication and estimation strategies. Section (3) presents the results. Section (4) performsseveral robustness checks. Section (5) concludes.
2 Identification and Estimation Strategy
This paper evaluates the relative importance of commodity price shocks in the U.S. busi-ness cycle. Therefore, we extend the standard set of business cycle shocks (i.e., monetarypolicy, neutral technology, and investment-specific technology Altig et al. 2011) to includeunexpected changes in commodity prices.
2.1 Data
We develop a nine-dimensional VAR in order to capture the impact of the relevant factorsfor macroeconomic fluctuations. The sample period covers aggregate U.S. data between1955Q3 and 2007Q4.4 The following variables enter the SVAR: growth in the relativeprice of investment goods Δqt, growth in labor productivity Δat (measured by the ratioof real output to hours per capita in the business sector), the CPI inflation rate πt, hoursper capita ht, the consumption share in output ct, the investment share in output it, theemployment rate nt, the Federal Funds rate rt, and the commodity price index “PPI: crudematerials for further processing” pt (see also Figure 1). We prefer to use this particularcommodity price index by the BLS (2012, p. 8) — also used by Hanson (2004) or Sims& Zha (2006) — as it appropriately captures the time-varying importance of differentraw materials, based on input-output studies by the BEA.5 In addition, Figure (1) showsthat, compared with the price of crude oil in the pre-1973 period, the pattern of changesin the broad commodity price index is much less discrete. All time series are seasonallyadjusted (where applicable). Precise definitions can be found in the Appendix (Tables 1and 2).
Note that our information set explicitly considers the consumption and the investmentshare in output. As demonstrated by Christiano et al. (2003), omitting these two variablesmay be associated with a serious specification error. This effect is likely due to the fact
4The endpoint of our sample marks the start of the Great Recession when the Federal Reserve adoptedseveral unconventional monetary policy measures, which are unlikely to be appropriately captured by ouridentification procedure.
5In contrast, the Commodity Research Bureau (2013) BLS Spot Index (available from 1951Q1) doesnot capture petroleum based products. The Continuous Commodity Index by Thomson Reuters (2013,calculated backwards until 1956Q4); i.e., the “old CRB”, captures petroleum based products, but con-tinuously rebalances the different commodity categories to maintain an equal and time-invariant weight(we use this index for robustness checks presented in Section 4.3 and Figure 18). The “new” ThomsonReuters/Jefferies (2013) CRB Index, introduced in 2005, captures petroleum based products and usestime-varying weights, but was calculated backwards only until 1994Q1 (see the link in the references).Figure (1) shows that the BLS (2012) index and the “new” Thomson Reuters/Jefferies (2013) CRB indexbehave remarkably similar in the overlapping sample.
3

5
that these two variables reflect “news that agents see but we do not” (Cochrane 1994, p.295). In addition, we include the employment rate in order to analyze labor adjustmentalong the extensive and the intensive margin.
Recently, Fernald (2007) has shown that SVAR models with long-run restrictions maybe biased by “low-frequency movements” in hours per capita. This effect can be attributedto sectoral changes involving government and non-profit employment or the movement ofthe baby boom generation through the labor market (Francis & Ramey 2009). Differencingremoves the low-frequency movements from the data. However, differencing a boundedseries (like per-capita hours) may involve misspecification issues (Hamilton 1994, p. 652).Therefore, Canova et al. (2010) suggest to filter the data prior to estimation. On theother hand, Gospodinov et al. (2011) argues that filtering the data prior to estimationremoves information necessary to identify these shocks using long-run restrictions.
With this in mind, we estimate our SVAR model in two specifications; i.e., the “levelspecification” and the “bandpass filter specification”. For the reader’s convenience, weoffer comparisons between these two specifications throughout the paper. For the former,we first take the natural logarithm of all variables except for the (net) Federal Fundsrate, and then difference labor productivity and the relative price of investment goods.For the latter, we additionally apply a one-sided bandpass filter (Christiano & Fitzgerald2003)6 in order to control for low-frequency movements in per-capita hours. We preferthis particular filter since agents know only the past (Lucas 1980). More precisely, weapply the one-sided bandpass filter not only to per-capita hours, but to all series consid-ered.7 Figure (2) illustrates that this procedure allows us to maintain spectral coherence(Granger 1969) between labor productivity growth and per-capita hours. When all seriesare filtered — as in the top panel — we are able to break the low-frequency comovementand minimize distortions at higher (particularly, at business cycle) frequencies. Whenonly per-capita hours are filtered — as in the bottom panel — we are less successfulin breaking the low-frequency comovement and distort the relationship at business cyclefrequencies.
2.2 Identification
We estimate the following four structural shocks using standard identifying assumptions.Commodity price shocks (Rotemberg & Woodford 1996) and monetary policy shocks(Christiano et al. 1996) are identified using short-run restrictions. Neutral and investment-
6To be precise, we first remove the drift of the series and then apply the one-sided bandpass filter withfollowing options: pl = 2, pu = 52, root = 1, drift = 0, ifilt = 0, nfix = −1, thet = 1. Where available,we use data from 1948Q1 to 2007Q4 and then drop the filtered data points prior to 1955Q3. The FederalFunds rate is only available from 1954Q3.
7Our long-run identification strategy (see Section 2.2) requires that labor productivity and the relativeprice of investment goods enter the SVAR in first differences. Hence, we difference these variables firstand then apply the bandpass filter.
4

6
specific technology shocks are identified using long-run restrictions (Galí 1999, Fisher2006).8 The remaining shocks in the nine-dimensional SVAR model are identified via arecursive ordering scheme.
Consequently, the reduced-form VAR is given by:
xt = a + B(L)xt−1 + et (1)
xt =[
Δqt Δat zt rt pt
]�
zt =[
πt ht ct it nt
]�
where B(L) is a lag polynomial of order M . By premultiplying with β0, we obtain thestructural VAR:
β0xt = α + β(L)xt−1 + �t (2)
where �t denotes the vector of fundamental shocks. The orthogonality assumption impliesthat its covariance matrix V� = E(��
t�t) is diagonal. Moreover, we normalize the diagonalof β0 to a 9x1 vector of ones.
Both technology shocks are identified using long-run restrictions (Shapiro & Watson1988, Blanchard & Quah 1989). Following Fisher (2006), we assume that only investment-specific technology shocks affect the relative price of investment goods in the long run.The long-run level of aggregate productivity may be affected by both investment-specificand neutral technology shocks. No other shock has any long-run effect on the relativeprice of investment goods or the level of labor productivity (Galí 1999).
The identification strategies of the commodity price shock and the monetary policyshock are based on short-run restrictions. We impose the constraint that no other variablemay respond contemporaneously when the Fed’s monetary policy — given by the FederalFunds rate — deviates from its linear rule. This presumes that, when setting the nominalinterest rate, the Fed’s information set includes the contemporaneous values of all othervariables included in the SVAR (Christiano et al. 1996). Moreover, we identify the com-modity price shock by assuming that nominal commodity prices are predetermined withrespect to U.S. macroeconomic aggregates.9 This identification strategy was originallydeveloped by Rotemberg & Woodford (1996) in the context of nominal oil price shocks.10
The assumption of predeterminedness is based on the observation that energy prices donot respond contemporaneously to macroeconomic news (Kilian & Vega 2011). As ex-
8The current section follows largely the identification procedure described in Ravn & Simonelli (2008),with commodity prices instead of government spending. We are unable to find significant movement togovernment spending shocks when we include government spending per capita instead of commodityprices in our SVAR model
9In contrast, innovations in real commodity prices may be due to unexpected changes in U.S. inflationand, therefore, should be treated as endogenous (Rotemberg & Woodford 1996, Hamilton 2008). SeeKilian & Lewis (2011) for a recent work on this issue.
10The shape of the impulse responses remains unchanged when we use the West Texas Intermediate spotoil price instead, but the broad commodity price index turns out to be quantitatively more important.
5

7
plained by Kilian (2008, p. 4), this short-run restriction provides a “good approximation”when working with quarterly data.11 Nevertheless, when applying this approach to com-modity prices, we take into account the possibility that the broad commodity price indexmay behave less sluggishly than the nominal oil price (Alquist et al. 2011). Moreover,following Edelstein & Kilian (2007, 2009), we focus our analysis on the average effects ofcommodity price shocks, irrespective of whether these movements are driven by changesin supply or demand (see Kilian 2009, for a detailed discussion of this topic). We subjectthese identifying assumptions to the following robustness checks. Therefore, Section (4.1)relaxes the contemporaneous exogeneity assumption to allow for immediate responses inthe commodity price index to innovations in U.S. aggregate activity; i.e., labor produc-tivity growth and per-capita hours. Section (4.2) includes a global demand indicator —which is ordered first before the commodity price index (as in Kilian & Lewis 2011) — inorder to control for contemporaneous movements in the global demand for commodities.12
Besides, note that our linear VAR model presumes that commodity price increases anddecreases have symmetric effects (Kilian & Vigfusson 2011).
Consequently, the process for the Federal Funds rate depends on the current and pastvalues of all other variables, but no other process depends on its current realizations.This implies that the second-last column of the contemporaneous coefficient matrix β0
consists of zeros, apart from the second-last element which is normalized to unity. Theprocess for the commodity price, on the other hand, depends on the lagged values ofcommodity prices and all other variables, but not on the current realizations of any othervariable. Hence, the last row of β0 consists of zeros, apart from the last element whichis normalized to unity. Furthermore, the order of the variables included in the vector zt
imposes a number of additional short-run restrictions on β0.
2.3 Estimation
The first equation of the structural VAR (equation 2):
pt = αp +M∑
j=1βp
x,jxt−j + �pt (3)
11Applications of this identification strategy to quarterly data include Rotemberg & Woodford (1996),Edelstein & Kilian (2007), and Blanchard & Galí (2010).
12Note that, given that commodity prices are denominated in U.S. dollars, we are not able to identifyendogenous (real) exchange rate driven commodity price movements.
6

8
identifies the commodity price shock �pt . We estimate equation (3) using ordinary least
squares. The second equation of the SVAR:
Δqt = αq +M∑
j=1βq
q,jΔqt−j +M−1∑j=0
βqa,jΔ2at−j (4)
+M−1∑j=0
βqz,jΔzt−j +
M−1∑j=1
βqr,jΔrt−j +
M−1∑j=0
βqp,jΔpt−j + �q
t
identifies the investment-specific technology shock �qt . The long-run restriction is imposed
by differencing all the regressors in xt apart from the relative investment goods price itself(note that Δ2 is the second difference operator). Moreover, we exclude the contempora-neous value of the Federal Funds rate from this regression. This implements the short-runassumption on the Fed’s information set. Since �q
t may be correlated with Δat (via equa-tion 5) and zt (via equation 7), we estimate equation (4) with 2SLS. The instruments area constant, the vector [Δqt−j, Δat−j, zt−j, rt−j, pt−j]Mj=1 and �̂p
t (the estimate of �pt ). The
third equation of the SVAR:
Δat = αa +M∑
j=0βa
q,jΔqt−j +M∑
j=1βa
a,jΔat−j (5)
+M−1∑j=0
βaz,jΔzt−j +
M−1∑j=1
βar,jΔrt−j +
M−1∑j=0
βap,jΔpt−j + �a
t
identifies the neutral technology shock �at . Note that we difference all regressors — except
for Δqt and Δat — and exclude the contemporaneous value of the Federal Funds rate. Weestimate equation (5) using 2SLS, given that �a
t may depend on zt (via equation 7) and qt
(via equation 4). The instruments employed above are extended to include the estimateof �a
t ; i.e., �̂at . The fourth equation of the SVAR:
rt = αr − βrq,0Δqt − βr
a,0Δat − βrz,0zt − βr
p,0pt +M∑
j=1βr
x,jxt−j + �rt (6)
identifies the monetary policy shock �rt . This equation is estimated with ordinary least
squares.Following Altig et al. (2011), we estimate the remaining parameters for the vector zt.
The components of zt are denoted by zit, i = 1, . . . , 5. The parameters of the first equation
are obtained by estimating:
z1t = α1 +
M∑j=0
β1q,jΔqt−j +
M∑j=0
β1a,jΔat−j (7)
+M∑
j=1β1
z,jzt−j +M∑
j=1β1
r,jrt−j +M∑
j=0β1
p,jpt−j + �1t
7

9
employing the above-used instruments including the vector of estimated shocks [�̂pt , �̂q
t ,�̂a
t ]′. The second equation extends the set of regressors with z1t and the list of instruments
with �̂1t . We continue this procedure recursively for all the variables included in zt.
In order to determine the optimal VAR order (M), we apply the standard sequentiallikelihood ratio test (see e.g. Lütkepohl 2005, Chapter 4.2.2), which rejects M = 4 at the1% significance level. The choice to use a lag length beyond one year is also supportedby the existing literature on energy price shocks (Hamilton & Herrera 2004). In addition,we test the null hypothesis of zero serial correlation using bootstrapped multivariatePortmanteau (Q) statistics (Altig et al. 2011). On the basis of this test, we do not rejectthe null hypothesis for M = 5.
3 Results
3.1 Dynamic Responses to Structural Shocks
We modify the code by Altig et al. (2011) to estimate the coefficients and to computethe impulse responses to the four identified structural shocks.13 We examine the impulseresponse functions at horizons up to 32 quarters. The graphs depict the responses based onbootstrap sampling over 3,000 replications, where the first 1,000 draws are used to correctfor small sample bias and departures from non-normality (Kilian 1998a,b).14 The solid lineis the median estimate. The gray shaded areas represent the associated 60%, 70%, 80%and 90% non-centered confidence intervals. For the reader’s convenience, Figures (3)-(5),(7) in the Appendix contrast the impulse responses of the “bandpass filter specification”(a panels) with the impulse responses of the “level specification” (b panels).
3.1.1 Commodity Price Shocks
Figure (3) depicts the impulse responses to the identified commodity price shock. We findthat this shock triggers a temporary rise in the commodity price index, peaking shortlyafter the initial increase before slowly returning to its steady state level. Moreover, weobserve a spike in the inflation rate, indicating that aggregate consumer prices are veryflexible in response to commodity price shocks. In the following periods, the inflation ratedeclines sharply. The unexpected surge in the inflation rate prompts the Fed to elevatethe nominal interest rate for a protracted period (about 6-8 quarters).15 Consequently,the inflation rate falls below normal about two years after the shock. We also notethat the relative price of investment goods decreases slightly, but the effect disappears
13We thank Lawrence Christiano for making the code available on his website.14The Jarque-Bera test statistics reject the null hypothesis that the commodity price shocks and the
monetary policy shocks are normally distributed at the 1% significance level.15The peak response of the Federal Funds rate corresponds to 30 basis points. We infer this value from
the level specification (see Figure 3, panel b).
8

10
relatively quickly. The adjustment paths of output, per-capita hours, employment, hoursper worker, consumption, and investment display significant U-shaped responses. Theestimated impulse responses of output and employment are qualitatively consistent withthe results of Blanchard & Galí (2010) — output and employment decline persistentlyafter a lag of 3-5 quarters and reach a trough after about ten quarters.
In this context, Bernanke et al. (1997) argue that a substantial part of the recessionaryeffects of commodity price shocks is not due to the direct impact of higher producer prices,but rather due to the systematic contractionary response of the Federal Reserve.16 Theirconclusion stems from a counterfactual exercise (suggested by Sims & Zha 2006) whichpresumes that the Federal Funds rate is kept constant when the U.S. economy is hitby an unexpected increase in commodity prices. In the following, we perform the samecounterfactual exercise using our estimated SVAR model. Importantly, our approachdiffers in many aspects from theirs as we adopt several suggestions — e.g. a linear SVARmodel (Kilian & Vigfusson 2011) with a lag length beyond one year (Hamilton & Herrera2004) — made in the subsequent debate. We observe that the imputed counterfactualmovements in the Federal Funds rate deviate only moderately from the original series(see Figure 8). For this reason, we believe that our results are less prone to changingparameters due to the Lucas (1976) critique.
Figure (9) contrasts the impulse response functions of output, per-capita hours and theinflation rate in the bandpass filter specification (top panel) with the impulse responsesunder the counterfactual assumption (bottom panel). Indeed, we are unable to observea significant downturn in output and per-capita hours if the Fed stayed passive. Thereis only an insignificant decline in output that occurs with a lag of about two years. Theinitial spike in the inflation rate, on the other hand, seems identical to the one estimatedin the bandpass filter specification. At medium horizons (10-20 quarters), however, thecounterfactual response cannot replicate the significant disinflationary rebound in CPIinflation. Thus, we conclude that the contractionary monetary policy feedback rule helpedthe Federal Reserve to achieve price stability in the long run, yet at the cost of a significanteconomic downturn in output and per-capita hours.17
In addition, Figure (10) illustrates the impulse responses of two CPI sub-indices; i.e.the so-called core inflation rate (all items less food and energy) and its counterpart (foodand energy only). We observe that the spike in the headline inflation rate is mainly due toa sharp rise in food and energy prices. The core inflation rate, on the other hand, shows
16This view did not remain unchallenged. Herrera & Pesavento (2009, p. 107), on the other hand, findthat “the systematic monetary policy response dampened fluctuations in economic activity during the1970s”. Furthermore, Barsky & Kilian (2002) argue that shifts in the monetary policy regime followingthe breakdown of the Bretton Woods system triggered the Great Stagflation of the 1970s.
17Kilian & Lewis (2011), on the other hand, perform an alternative counterfactual exercise whichassumes that the Fed does not respond directly to oil price shocks, but to the movements in othermacroeconomic aggregates triggered by these shocks. They conclude that monetary policy responses didnot cause large fluctuations in U.S. output.
9

11
a lower — but still significant — and more persistent increase. This indicates that a littleprice rigidity at the level of intermediate goods may translate into persistent inflationmovements in other sectors of the economy (Basu 1995) — so-called second-round effects.We also find a marginally significant disinflationary rebound in both CPI sub-indices atmedium horizons. Moreover, by repeating the above-described counterfactual exercise,we notice that the initial increase in both sub-indices remained virtually unchanged ifthe Federal Reserve stayed passive. The disinflationary rebound, however, disappears inboth impulse responses. Therefore, we conclude that the Fed’s contractionary monetarypolicy feedback rule is unable to avoid second-round effects in the short run. Yet, itexhibits medium-run disinflationary effects which help the Federal Reserve to achieveprice stability at longer forecast horizons.
3.1.2 Monetary Policy Shocks
Figure (4) shows the responses to an expansionary shock in monetary policy. This shockrepresents a drop in the Federal Funds rate, due to an unexpected deviation from theFed’s linear policy rule. Our identifying assumptions imply that the shock has only atemporary effect. Nevertheless, the Federal Funds rate remains below its steady statelevel for more than seven quarters. In response to this, we observe that output, per-capita hours, employment, consumption, and investment rise gradually. Peak effects takeplace about 5-6 quarters after the monetary stimulus. At longer forecast horizons, theadjustment paths show a slight rebound. The response of the relative price of investmentgoods, on the other hand, is not significant. Overall, the shapes and elasticities of theresponses are in line with the estimates by Ravn & Simonelli (2008). Only labor inputindicators behave slightly different. Employment seems somewhat less elastic. Hours perworker even display a very mild downturn. Consistent with Sims (1992), the impulseresponse of the inflation rate drops on impact, followed by a slow and persistent increase.According to our estimates, the inclusion of the commodity price index reduces the size ofthe drop slightly, but leaves the shape of the inflation response unchanged. This indicatesthat the “price puzzle” is a robust feature of the data (Hanson 2004).
Furthermore, we observe that an unexpected cut in the Federal Funds rate inducesa slow, but persistent increase in commodity prices. The maximum impact does notoccur until four to five years after the shock. In comparison to Anzuini et al. (2012), ourestimated impulse response is much more gradual and resembles (qualitatively as well asquantitatively) the impulse response of the consumer prices index (i.e., the cumulativeresponse of the inflation rate). In other words, the commodity price index shows nosignificant response in real terms.
10
12
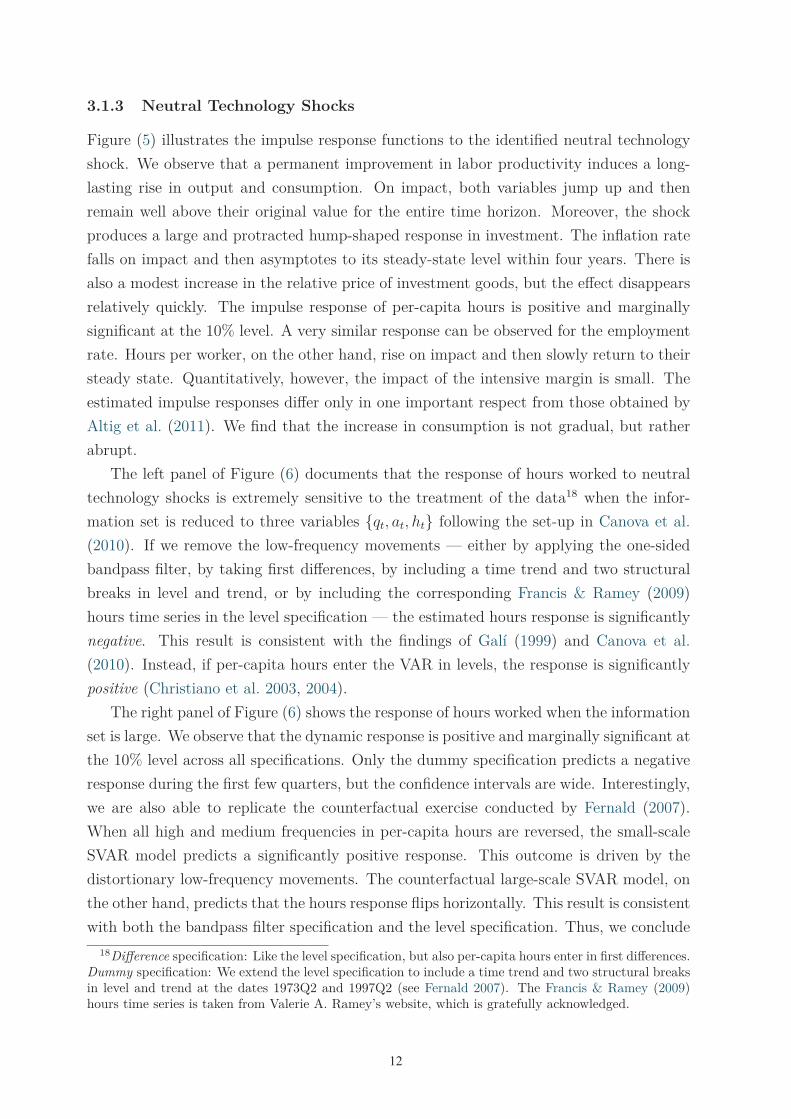
3.1.3 Neutral Technology Shocks
Figure (5) illustrates the impulse response functions to the identified neutral technologyshock. We observe that a permanent improvement in labor productivity induces a long-lasting rise in output and consumption. On impact, both variables jump up and thenremain well above their original value for the entire time horizon. Moreover, the shockproduces a large and protracted hump-shaped response in investment. The inflation ratefalls on impact and then asymptotes to its steady-state level within four years. There isalso a modest increase in the relative price of investment goods, but the effect disappearsrelatively quickly. The impulse response of per-capita hours is positive and marginallysignificant at the 10% level. A very similar response can be observed for the employmentrate. Hours per worker, on the other hand, rise on impact and then slowly return to theirsteady state. Quantitatively, however, the impact of the intensive margin is small. Theestimated impulse responses differ only in one important respect from those obtained byAltig et al. (2011). We find that the increase in consumption is not gradual, but ratherabrupt.
The left panel of Figure (6) documents that the response of hours worked to neutraltechnology shocks is extremely sensitive to the treatment of the data18 when the infor-mation set is reduced to three variables {qt, at, ht} following the set-up in Canova et al.(2010). If we remove the low-frequency movements — either by applying the one-sidedbandpass filter, by taking first differences, by including a time trend and two structuralbreaks in level and trend, or by including the corresponding Francis & Ramey (2009)hours time series in the level specification — the estimated hours response is significantlynegative. This result is consistent with the findings of Galí (1999) and Canova et al.(2010). Instead, if per-capita hours enter the VAR in levels, the response is significantlypositive (Christiano et al. 2003, 2004).
The right panel of Figure (6) shows the response of hours worked when the informationset is large. We observe that the dynamic response is positive and marginally significant atthe 10% level across all specifications. Only the dummy specification predicts a negativeresponse during the first few quarters, but the confidence intervals are wide. Interestingly,we are also able to replicate the counterfactual exercise conducted by Fernald (2007).When all high and medium frequencies in per-capita hours are reversed, the small-scaleSVAR model predicts a significantly positive response. This outcome is driven by thedistortionary low-frequency movements. The counterfactual large-scale SVAR model, onthe other hand, predicts that the hours response flips horizontally. This result is consistentwith both the bandpass filter specification and the level specification. Thus, we conclude
18Difference specification: Like the level specification, but also per-capita hours enter in first differences.Dummy specification: We extend the level specification to include a time trend and two structural breaksin level and trend at the dates 1973Q2 and 1997Q2 (see Fernald 2007). The Francis & Ramey (2009)hours time series is taken from Valerie A. Ramey’s website, which is gratefully acknowledged.
11

13
that the low-frequency bias (present in the level specification) and the misspecificationerror (induced by overdifferencing) become much less important when the information setis sufficiently large.19
3.1.4 Investment-Specific Technology Shocks
Figure (7) displays the effects of an investment-specific technology shock. This shockleads to an unexpected and permanent drop in the relative price of investment goods.We observe that all variables (except labor productivity) move together in response tothis type of disturbance. Consistent with Altig et al. (2011), we find that the dynamicadjustment paths show a marked hump-shaped pattern, with peak effects occurring after3-4 quarters. The impulse response of labor productivity remains insignificant for morethan four years before eventually rising. This result illustrates that, on impact, theelasticity of per-capita hours is of the same magnitude as aggregate output (also here,most variation in labor input is due to adjustments along the extensive margin). Thus,investment-specific technology shocks seem far more important for the cyclical behaviorof the labor market than neutral technology shocks.
3.2 Importance of the Structural Shocks
We now examine the relative importance of the four identified structural shocks for thevariance of all variables included in our SVAR. First, we present the share of variationexplained by each identified shock at different forecast horizons. However, as explained byRavn & Simonelli (2008), these figures do not allow us to draw direct conclusions about theimportance of these shocks at business cycle frequencies. Therefore, we also compute thevariance decomposition at business cycle frequencies (8-32 quarters) following the methodproposed by Altig et al. (2011). In addition, we present the historical decomposition ofthe four identified structural shocks for aggregate output in the postwar period.
3.2.1 Forecast Error Variance Decomposition
Figure (11) displays the forecast error variance decomposition of three key macroeco-nomic variables (output, per-capita hours, and the inflation rate) at different horizons.We observe that neutral technology shocks explain a large share of the variation in out-put, particularly at long forecast horizons. Investment-specific technology shocks are themain determinant of fluctuations in per-capita hours, and the second most importantdeterminant of fluctuations in output. Commodity price shocks (together with neutral
19This conclusion is in line with the results of Forni & Gambetti (2011). They demonstrate thattrivariate SVAR models do not capture sufficient information in order to find an unbiased estimate of thehours response to neutral technology shocks. Our choice to use a large information set is also supportedby the outcome of cross-correlation tests (see Table 3).
12

14
technology shocks) appear to be the primary driving force for movements in the inflationrate. Monetary policy shocks, on the other hand, explain only small shares of macroe-conomic fluctuations. The joint explanatory power of all four shocks lies between 35%(inflation rate) and 48% (output) in the short run, and between 48% (inflation rate) and68% (output) in the long run.
3.2.2 Variance Decomposition at Business Cycle Frequencies
We now investigate the variance decomposition at business cycle frequencies (see Ta-ble 4). The results show that commodity price shocks are a principal driving force formacroeconomic fluctuations. In particular, we find that commodity price shocks explaina large share of cyclical movements in inflation.20 The commodity price shock also turnsout to be a very important determinant of cyclical fluctuations in many other macroe-conomic variables (e.g., Federal Funds rate, investment, or consumption), second onlyto investment-specific technology shocks. Our result are in line with Edelstein & Kilian(2009), who find that energy price shocks are a quantitative important (but not dominant)determinant of changes in aggregate consumption.21 Furthermore, the neutral technologyshock explains only a considerable share of the variation in labor productivity — theendogenous variable in the equation that identifies the neutral technology shock. Themonetary policy shock seems even less relevant. Even though the identifying assumptionsof our VAR model are inherently not testable (Kilian & Vega 2011), two observationsprovide indirect support for our strategy. On the one hand, only 11% of the changes inthe nominal interest rate at business cycle frequencies are due to the unexpected shock.This implies that the Fed’s monetary policy has followed a rule-based approach over oursample period (this conclusion is consistent with the results of Sims & Zha 2006). Onthe other hand, more than 50% of the cyclical variability in the commodity price index isexplained by the commodity price shock itself (note that, e.g., Cochrane 1994, finds evenhigher values). This result indicates that the contemporaneous exogeneity assumption isa reasonable identifying restriction.
The importance of investment-specific technology shocks is in line with the results ofseveral recent SVAR studies by Fisher (2006), Ravn & Simonelli (2008), Canova et al.(2010), and Altig et al. (2011).22 Altogether, the four identified shocks account for 49%-73% of business cycle volatility in the data. At first glance, however, it seems surprising
20This result is consistent with the finding of Hanson (2004), who shows that the commodity priceindex by the BLS (2012) is a good predictor of the inflation rate.
21Note that the same authors (Edelstein & Kilian 2007) are unable to find a significant response innonresidential fixed investment. Their data set, however, differs from ours in that we include consumerdurables in investment.
22Smets & Wouters (2007) and Mumtaz & Zanetti (2012) draw the conclusion that neutral technologyshocks are more important. Both sets of authors use a data set that includes consumer durables inconsumption (and not in investment). Schmitt-Grohé & Uribe (2011) argue that a common stochastictrend in neutral and investment-specific technology is the main driving force for the business cycle.
13

15
that neutral technology shocks do not explain larger shares at business cycle frequencies.Therefore, we analyze also the explanatory power of neutral technology shocks acrossthe whole spectrum (Figure 12). Indeed, we find that neutral technology shocks play avery important role in explaining macroeconomic fluctuations (particularly, output, laborproductivity, and consumption), but at low frequencies.
3.2.3 Historical Decomposition of Shocks
As suggested by Edelstein & Kilian (2009), the following section studies the cumulativeeffects of the identified structural shocks on output and inflation. The historical decompo-sition (see Figure 13) is based on the code provided by Altig et al. (2011). For stationarityconsiderations, we only report the results of the bandpass filter specification here (Kilian& Lewis 2011). When all four identified structural shocks are considered, we observethat our SVAR model is able to replicate the cyclical behavior of output remarkably well.There are only two episodes in U.S. postwar history that exhibit a noticeable trackingerror. The model explains neither the short recession in the late 1960s, nor the depth ofthe recession after the burst of the so-called dot-com bubble.
We also investigate the time series elicited by the four individual shocks. The graphsillustrate that their contribution varies considerably across different episodes in the U.S.postwar period. Commodity price shocks contribute most to the high degree of macroeco-nomic volatility — both in output and inflation — in the 1970s, particularly during andafter the first OPEC oil crisis.23 In addition, commodity price shocks are also an impor-tant determinant of the double-dip in the early 1980s, the economic boom in the early1990s, and the short early 2000s recession. We also note that commodity prices explainonly a moderate share of inflation volatility in the later 1970s/early 1980s, but a largeshare of the decline in inflation during the last two recessions in our sample. Figure (8)evaluates the impact of the Fed’s response to commodity price shocks. Therefore, weexamine the cyclical movements of aggregate output in the absence of the contractionarymonetary policy feedback rule.24 Interestingly, we observe that the monetary policy feed-back rule — in particular, the contractionary response during the first OPEC oil crisisand the subsequent monetary easing — has amplified the output fluctuations caused byunexpected changes in commodity prices.
Consistent with the estimated impulse response functions, the counterfactual timeseries seems to lag the estimated path by about one year. Moreover, we note that theFed’s policy rule was note able to avoid the spike in the inflation rate around the year1974, but had disinflationary effects in the subsequent period (a similar pattern can alsobe observed during the early 1900s recession). In other words, our SVAR indicates that
23This result is not as trivial as it seems. Kilian & Lewis (2011), on the other hand, argue that thecumulative effects of oil price shocks were not large (even prior to 1987).
24See Section (3.1.1) for details and motivation of this counterfactual exercise.
14
16
a contractionary monetary policy feedback rule may help the Federal Reserve to achieveprice stability at longer forecast horizons, yet at the cost of output destabilization.
Monetary policy shocks, on the other hand, have played a role in the late 1960s reces-sion, the double-dip in the early 1980s as well as in the subsequent recovery. Furthermore,in line with our previous results, we are unable to find a systematic relationship betweenneutral productivity shocks and fluctuations in aggregate output at business cycle frequen-cies. Neutral technology shocks seem rather important at low frequencies. For example,neutral productivity shocks suggest a deep recession between 1976 and 1983, reflectingthe productivity slowdown in that period, and two long-lasting economic booms — thefirst in the mid 1980s and the second in the late 1990s. Consistent with Greenwood et al.(1997), we find that investment-specific technology growth was particularly strong duringthe productivity slowdown of other factors in the 1970s. Furthermore, investment-specifictechnology shocks appear to be a principal driving force for the 1960-61 recession andthe following economic expansion, the 1973-75 recession (both output and inflation), theearly 1980s recession as well as of the subsequent recovery.
4 Robustness Analysis
The following section presents a number of robustness checks. We investigate the sensitiv-ity to the identifying assumptions (predeterminedness, global demand), the usage of theThomson Reuters (2013) Continuous Commodity Index with time-invariant weights (seealso Footnote 5), the data treatment, the choice of the lag length, and the selected sampleperiod. We demonstrate that our results are robust across alternative model versions.
4.1 Non-Predetermined Commodity Prices
Section (2.2) assumes that no single shock (but the commodity price shock itself) hasan impact on the contemporaneous value of the commodity price index. Rotemberg &Woodford (1996) proposed this assumption to identify nominal oil price shocks. Giventhat the broad commodity price index may behave differently from the nominal oil price(Alquist et al. 2011), the current section examines the robustness of our identificationstrategy. Therefore, we relax the contemporaneous exogeneity assumption to allow forimmediate responses in the commodity price index to unexpected changes in two mainindicators of the U.S. economy (labor productivity growth and per-capita hours). Thisprocedure is different to the one used by Blanchard & Galí (2010), who have exploredthe consequences of an alternative recursive ordering of the variables. Importantly, asour SVAR is overidentified, we are able to eliminate these two identifying assumptionswithout imposing a new one.
15

17
Consequently, the identified commodity price shock �pt is now obtained by estimating:
pt = αp − βpa,0Δat − βp
h,0ht +M∑
j=1βp
x,jxt−j + �pt (8)
Since �pt may be correlated with Δat (via equation 5) and ht (via equation 7), we estimate
equation (8) with 2SLS. The set of instruments includes a constant and the followingvector:25
[Δqt−j, Δat−j, zt−j, rt−j, pt−j]M+1j=1 .
We find that the estimated results are remarkably robust (see Figure 17). In partic-ular, the CPI inflation rate behaves almost identical to Section (3.1.1). Also the medianresponse of the Federal Funds rate matches the previous estimates closely – even thoughthe confidence bands are somewhat wider. Moreover, Table (5) shows that the businesscycle variance decomposition statistics remain virtually unchanged.
4.2 External Demand
The present identification procedure of the commodity price shock is unable to distin-guish between supply- and demand-driven innovations. However, the assumption thatcommodity price shocks are contemporaneously exogenous to U.S. macroeconomic ag-gregates seems more defensible in the case of supply shocks (e.g., political strife in theMiddle East, see Kilian 2008) than in the case of demand shocks.26 Therefore, we extendour SVAR by adding a variable that captures variations in global demand for commoditygoods. In particular, we choose to include the natural log of the ratio of real exportsto real imports of goods and services (see Table 2). Based on this series, we identify anexternal demand shock using short-run restrictions. Following Abbritti & Weber (2010)or Kilian & Lewis (2011), we assume that the process for the real export/import ratiois independent of the current realizations of all other variables but the commodity priceindex.27
The impulse responses generated by the four remaining shocks, particularly by thecommodity price shock (Figure 16a), remain virtually unchanged when we control forunexpected movements in external demand. In addition, the variance decompositionstatistics at business cycle frequencies are remarkably robust (Table 5). We note only amild reduction (4 percentage points) in the explanatory power of the commodity price
25Note that the parameters are overidentified, given that the number of instruments exceeds the numberof parameters. Using an overidentifying restrictions test (Sargan 1964) we are unable to reject thisspecification at the 10% significance level.
26Kilian & Murphy (2010) emphasize that political strife in the Middle East may not only disrupt oilsupply, but also boost speculative demand.
27Note that the idea to disentangle commodity demand and supply shocks is due to Kilian (2009).
16

18
shock with respect to the cyclical movements in the inflation rate.28 Figure (16b) il-lustrates the effects of the identified external demand shock. This shock represents atemporary but persistent rise in the real exports/imports ratio. We observe that theexternal demand shock causes a hump-shaped increase in the commodity price index,representing commodity price changes due to heightened global demand. Except for in-vestment and consumption, all other variables show barely significant responses, whichmay be attributed to the fact that the U.S. is a relatively closed economy. Besides, the ex-ternal demand shock is unable to explain significant shares in the business cycle varianceof any variable but the real export/import ratio.
4.3 Thomson Reuters Continuous Commodity Index
Figure (18) shows the impulse responses when the Thomson Reuters (2013) ContinuousCommodity Index with time-invariant weights (see Footnote 5) is used for the estimationof our SVAR model. In contrast to Section (3.1.1), the alternative commodity price indexis more persistent with peak effects occurring about one year after the initial increase.Nevertheless, the relative impulse responses remain almost unchanged. Only the increasein the inflation rate seems to be more long-lived. After the initial increase, we observethat the inflation rate remains elevated for more than one year before eventually fallingback to normal. We also note that the confidence bands are tighter. Consequently, thecommodity price shock now becomes significantly more important in terms of the cyclicalvariance decomposition statistics (see Table 5), particularly with respect to inflation. Theinvestment-specific technology shock, on the other hand, loses some of its explanatorypower.
4.4 Data Treatment
Bandpass Filter vs. Level Specification The (b) panels of Figures (3)-(5), (7) andTable (4), respectively, display the impulse responses and the business cycle variancedecomposition when we estimate the level specification of our SVAR model. We observethat all major conclusions survive this type of test. Even the response of per-capitahours to neutral technology shocks remains virtually unchanged (see also Section 3.1.3).The only notable difference between these two specifications is that the cyclical variancedecomposition statistics of the commodity price shock are higher in the level specification,but the cyclical variance decomposition statistics of the investment-specific technologyshock are higher in the bandpass filter specification. Altogether, these results indicatethat the low-frequency bias becomes less important when the information set is sufficiently
28Alternatively, we have used the “rest of the world” GDP index (1972Q1-2006Q4) by Enders et al.(2011), the “global economic activity” index (1968Q1-2007Q4) by Kilian (2009) and the “world industrialproduction” index (1948Q1-2007Q4) by Baumeister & Peersman (2012). Our (subsample) tests indicatethat all indices yield similar results.
17

19
large. Furthermore, the remarkable resemblance of the impulse responses suggests thatconcerns about leaving (Fernald 2007, Francis & Ramey 2009, Canova et al. 2010) orremoving (Gospodinov et al. 2011) low-frequency movements in the data are quantitativelynot very important as long as the size of the information set is sufficiency large.
Treatment of the Hours Series In addition, Table (5) provides the cyclical variancedecomposition statistics of output, per-capita hours, and the inflation rate under differentmodel specifications. The figures confirm that our findings are robust to different filteringmethods (differences, dummies, including the corresponding Francis & Ramey (2009)hours time series in the level specification).
Treatment of the Commodity Price Index Figure (14) shows the impulse responseswhen the commodity price index is differenced prior to applying the one-sided bandpassfilter. This implies that we now identify a permanent shock to the level of the commodityprice index. We observe that the shapes of the impulse responses are almost identical toSection (10). The most interesting difference is that the response of labor productivityis no longer significant, indicating that the elasticities of output and per-capita hours areof the same magnitude. Also the business cycle variance decomposition statistics (seeTable 5) are very similar.
4.5 Lag Length
The present section investigates whether the chosen lag length has any impact on ourresults. For this purpose, we reduce the number of lags to M = 4. Table (5) showsthat, in this case, the investment-specific technology shock becomes less important, butremains the principal driving force for output and per-capita hours over the business cycle.This indicates that our SVAR may suffer from “truncation bias” (Erceg et al. 2005) whenthe VAR order is insufficiently short. Qualitatively, however, we are unable to note anysignificant differences in the results.
4.6 Subsample Stability
Furthermore, we examine the subsample stability of the bandpass filter specification.Figure (15) illustrates the impulse responses to the identified commodity price shockbefore and after the appointment of Paul Volcker as chairman of the Board of Governorsin August 1979. For this exercise — due to the smaller number of observations — wereduce the VAR order to M = 3. Note that, when plotting these graphs, we normalize thestandard deviation of the commodity price shock in both sub-periods to the one measuredin the full sample. We observe that output and the (core) inflation rate respond less elasticin the late sub-sample, but remain statistically significant at the 10% level. This result
18

20
is consistent with previous estimates by Blanchard & Galí (2010),29 who attribute themilder response in the late sub-sample to (a) the smaller share of oil in production, (b)the decline in real wage rigidity, and (c) improvements in monetary policy.30
In contrast to their study, our SVAR explicitly controls for the decreasing share ofoil in production (by using a broad commodity price index with time-varying weights)and identifies neutral and investment-specific technology shocks. Our result of smallersecond-round effects is consistent with their view of a decrease in real wage rigidity.Moreover, we find evidence in favor of increased credibility of monetary policy. In thepre-Volcker period, we notice that the Federal Funds rate stays above its steady statelevel for about five quarters. Following the initial rise, the Federal Reserve reduces thenominal interest rate and keeps it below its long-run mean for the next ten quarters. Thispattern is known as stop-and-go monetary policy.31 In line with the conventional wisdom,we find no evidence for stop-and-go monetary policy in the post-Volcker period. Thecontractionary response in the post-Volcker period seems to be driven by the statisticallysignificant hump-shape in the core inflation rate. Furthermore, consistent with the mutedimpulse responses, Table (5) shows that the explanatory power of the commodity priceshock is somewhat lower in the post-Volcker period.32
5 Summary and Conclusion
This paper evaluates the importance of commodity price shocks in the U.S. business cycle.Therefore, we extend the standard set of identified shocks to include unexpected changesin commodity prices. The resulting SVAR shows that commodity price shocks are avery important driving force for macroeconomic fluctuations, second only to investment-specific technology shocks. In particular, commodity price shocks explain a large share ofcyclical movements in inflation.
The impulse response analysis shows that commodity price shocks generate significantU-shaped responses in output, consumption, and per-capita hours. Most notably, theinflation rate displays a significant spike, followed by a rapid return to the initial level.The unexpected surge in the inflation rate prompts the Fed to elevate the nominal interestrate. Results of a counterfactual exercise (in the style of Bernanke et al. 1997) indicate
29Our sub-sample periods are not exactly identical to the ones chosen by Blanchard & Galí (2010).Given our nine-dimensional SVAR, the number of degrees of freedom is not sufficient in order to estimatethe model accordingly. We also note that Edelstein & Kilian (2009) or Herrera & Pesavento (2009) findmilder responses in the post-Volcker period.
30We also confirm their conclusion that the size of the shock in the post-Volcker period is larger thanin the pre-Volcker period. This implies that the “Great Moderation” is not due to smaller commodityprice shocks.
31The results of Evans & Fisher (2011) suggest that the stop-and-go pattern in the Federal Funds rateis triggered by oil price shocks, while the significant hike is due to changes in prices of other commodities.
32Also note that the investment-specific technology shock is somewhat less important when we excludethe late 1990s Internet boom from our sample.
19

21
that the systematic contractionary response helped the Federal Reserve to achieve pricestability in the long run, yet at the cost of a significant economic downturn in output andper-capita hours.
Our SVAR model also addresses the hours response to neutral technology shocks.In particular, we find that the response of per-capita hours is positive and marginallysignificant. This result is surprising, given that we control for low-frequency movementsin the data (Canova et al. 2010). Further investigations show that this result is veryrobust to the treatment of the data as long as the size of the information set is sufficientlylarge. This result, which is in line with the evidence found by Forni & Gambetti (2011),confirms our choice to estimate a large-scale SVAR.
The sub-sample properties of our model are consistent with Blanchard & Galí (2010).We find that the effects of a commodity price shock on output and the inflation rateare milder in the post-Volcker period, but remain statistically significant at the 10%level. Several further robustness checks confirm the findings of our model. In particular,we examine robustness to the choice of the lag length, the identifying assumptions, thespecific commodity price index used, and the inclusion of an external demand shock(Abbritti & Weber 2010).
20

22
ReferencesAbbritti, M. & Weber, S. (2010), Labor market institutions and the business cycle: Unemploy-
ment rigidities vs. real wage rigidities, Working Paper Series No. 1183, European CentralBank.
Alquist, R., Kilian, L. & Vigfusson, R. J. (2011), Forecasting the price of oil, in G. Elliott &A. Timmermann, eds, ‘Handbook of Economic Forecasting’, 2 edn, Vol. 24 of Handbooks inEconomics, Elsevier. Forthcoming.
Altig, D., Christiano, L., Eichenbaum, M. & Lindé, J. (2011), ‘Firm-specific capital, nominalrigidities and the business cycle’, Review of Economic Dynamics 14(2), 225–247.
Anzuini, A., Lombardi, M. J. & Pagano, P. (2012), The impact of monetary policy shocks oncommodity prices, Temi di discussione (Economic working papers) No. 851, Bank of Italy,Economic Research and International Relations Area.
Barsky, R. & Kilian, L. (2002), Do we really know that oil caused the great stagflation? Amonetary alternative, in B. S. Bernanke & K. Rogoff, eds, ‘NBER Macroeconomics Annual2001’, Vol. 16 of NBER Macroeconomics Annual, The MIT Press, Cambridge, MA, pp. 137–183.
Basu, S. (1995), ‘Intermediate goods and business cycles: Implications for productivity andwelfare’, American Economic Review 85(3), 512–531.
Baumeister, C. & Peersman, G. (2012), ‘The role of time-varying price elasticities in accountingfor volatility changes in the crude oil market’, Journal of Applied Econometrics . Forthcoming.
Bernanke, B. S., Gertler, M. & Watson, M. (1997), ‘Systematic monetary policy and the effectsof oil price shocks’, Brookings Papers on Economic Activity 1, 91–142.
Blanchard, O. J. & Galí, J. (2010), The macroeconomic effects of oil price shocks: Why are the2000s so different from the 1970s?, in J. Galí & M. Gertler, eds, ‘International Dimensions ofMonetary Policy 2007’, University of Chicago Press, Chicago, IL, pp. 373–421.
Blanchard, O. J. & Quah, D. (1989), ‘The dynamic effects of aggregate demand and supplydisturbances’, American Economic Review 79(4), 655–673.
BLS (2012), BLS Handbook of Methods, Bureau of Labor Statistics, U.S. Department of Labor.Chapter 14: Producer Prices.
Canova, F., Lopez-Salido, D. & Michelacci, C. (2010), ‘The effects of technology shocks on hoursand output: A robustness analysis’, Journal of Applied Econometrics 25(5), 755–773.
Christiano, L. J., Eichenbaum, M. & Evans, C. (1996), ‘The effects of monetary policy shocks:Evidence from the flow of funds’, Review of Economics and Statistics 78(1), 16–34.
Christiano, L. J., Eichenbaum, M. & Vigfusson, R. (2003), What happens after a technologyshock?, NBER Working Paper Series No. 9819, National Bureau of Economic Research.
Christiano, L. J., Eichenbaum, M. & Vigfusson, R. (2004), ‘The response of hours to a technologyshock: Evidence based on direct measures of technology’, Journal of the European EconomicAssociation 2(2-3), 381–395.
Christiano, L. J. & Fitzgerald, T. J. (2003), ‘The band pass filter’, International EconomicReview 44(2), 435–465.
21
23
Cochrane, J. H. (1994), ‘Shocks’, Carnegie-Rochester Conference Series on Public Policy41(1), 295–364.
Commodity Research Bureau (2013), ‘CRB BLS Spot Index’.URL: http : //www. crbtrader.com/crbindex/ (last access: March 22, 2013).
Cummins, J. & Violante, G. (2002), ‘Investment-specific technical change in the United States(1947-2000)’, Review of Economic Dynamics 5(2), 243–248.
DiCecio, R. (2009), ‘Sticky wages and sectoral labor comovement’, Journal of Economic Dy-namics and Control 33(3), 538–553.
Edelstein, P. & Kilian, L. (2007), ‘The response of business fixed investment to changes in energyprices: A test of some hypotheses about the transmission of energy price shocks’, The B.E.Journal of Macroeconomics 7(1), 35.
Edelstein, P. & Kilian, L. (2009), ‘How sensitive are consumer expenditures to retail energyprices?’, Journal of Monetary Economics 56(6), 766–779.
Enders, Z., Müller, G. J. & Scholl, A. (2011), ‘How do fiscal and technology shocks affect realexchange rates? New evidence for the United States’, Journal of International Economics83(1), 53–69.
Erceg, C., Guerrieri, L. & Gust, C. (2005), ‘Can long-run restrictions identify technologyshocks?’, Journal of the European Economic Association 3(6), 1237—-1278.
Evans, C. L. & Fisher, J. D. M. (2011), What are the implications of rising commodity pricesfor inflation and monetary policy?, Chicago Fed Letter No. 286, The Federal Reserve Bankof Chicago.
Fernald, J. G. (2007), ‘Trend breaks, long-run restrictions, and contractionary technology im-provements’, Journal of Monetary Economics 54(8), 2467–2485.
Fisher, J. D. M. (2006), ‘The dynamic effects of neutral and investment-specific technologyshocks’, Journal of Political Economy 114(3), 413–451.
Forni, M. & Gambetti, L. (2011), Testing for sufficient information in structural VARs, CEPRDiscussion Paper No. 8209, Centre for Economic Policy Research, London.
Francis, N. & Ramey, V. A. (2009), ‘Measures of per capita hours and their implications for thetechnology-hours debate’, Journal of Money, Credit and Banking 41(6), 1071–1097.
Galí, J. (1999), ‘Technology, employment, and the business cycle: Do technology shocks explainaggregate fluctuations?’, American Economic Review 89(1), 249–271.
Gertler, M., Sala, L. & Trigari, A. (2008), ‘An estimated monetary DSGE model with unem-ployment and staggered nominal wage bargaining’, Journal of Money, Credit and Banking40(8), 1713–1764.
Gordon, R. J. (1990), The Measurement of Durable Goods Prices, NBER Monograph, Universityof Chicago Press, Chicago, IL.
Gospodinov, N., Maynard, A. & Pesavento, E. (2011), ‘Sensitivity of impulse responses to smalllow frequency co-movements: Reconciling the evidence on the effects of technology shocks’,Journal of Business and Economic Statistics 29(4), 455–467.
22

24
Granger, C. W. J. (1969), ‘Investigating causal relations by econometric models and cross-spectral methods’, Econometrica 37(3), 424–438.
Greenwood, J., Hercowitz, Z. & Krusell, P. (1997), ‘Long-run implications of investment-specifictechnological change’, American Economic Review 87(3), 342–362.
Hamilton, J. D. (1994), Time Series Analysis, Princeton University Press, Princeton, New Jersey.
Hamilton, J. D. (2008), Oil and the macroeconomy, in S. N. Durlauf & L. E. Blume, eds, ‘TheNew Palgrave Dictionary of Economics’, 2 edn, The New Palgrave Dictionary of EconomicsOnline, Palgrave MacMillan. doi:10.1057/9780230226203.1215.
Hamilton, J. D. & Herrera, A. M. (2004), ‘Oil shocks and aggregate economic behavior: Therole of monetary policy: Comment’, Journal of Money, Credit and Banking 36(2), 265–286.
Hanson, M. S. (2004), ‘The “Price Puzzle” reconsidered’, Journal of Monetary Economics51(7), 1385–1413.
Herrera, A. M. & Pesavento, E. (2009), ‘Oil price shocks, systematic monetary policy, and the“Great Moderation”’, Macroeconomic Dynamics 13(01), 107–137.
Justiniano, A., Primiceri, G. E. & Tambalotti, A. (2010), ‘Investment shocks and businesscycles’, Journal of Monetary Economics 57(2), 132–145.
Kilian, L. (1998a), ‘Confidence intervals for impulse responses under departures from normality’,Econometric Reviews 17(1), 1–29.
Kilian, L. (1998b), ‘Small-sample confidence intervals for impulse response functions’, Review ofEconomics and Statistics 80(2), 218–230.
Kilian, L. (2008), ‘The economic effects of energy price shocks’, Journal of Economic Literature46(4), 871–909.
Kilian, L. (2009), ‘Not all oil price shocks are alike: Disentangling demand and supply shocksin the crude oil market,’, American Economic Review 99(3), 1053–1069.
Kilian, L. & Lewis, L. (2011), ‘Does the Fed respond to oil price shocks?’, Economic Journal121(555), 1047–1072.
Kilian, L. & Murphy, D. (2010), The role of inventories and speculative trading in the globalmarket for crude oil, CEPR Discussion Papers No. 7753, Centre for Economic Policy Research.
Kilian, L. & Vega, C. (2011), ‘Do energy prices respond to U.S. macroeconomic news? Atest of the hypothesis of predetermined energy prices’, Review of Economics and Statistics93(2), 660–671.
Kilian, L. & Vigfusson, R. J. (2011), ‘Are the responses of the U.S. economy asymmetric inenergy price increases and decreases?’, Quantitative Economics 2(3), 419–453.
Lütkepohl, H. (2005), New Introduction to Multiple Time Series Analysis, Springer, Berlin.
Lucas, R. J. (1976), ‘Econometric policy evaluation: A critique’, Carnegie-Rochester ConferenceSeries on Public Policy 1(1), 19–46.
Lucas, Robert E, J. (1980), ‘Two illustrations of the Quantity Theory of Money’, AmericanEconomic Review 70(5), 1005–1014.
23

25
Medina, J. P. & Soto, C. (2005), Oil shocks and monetary policy in an estimated DSGE modelfor a small open economy, Working Papers No. 353, Central Bank of Chile.
Mumtaz, H. & Zanetti, F. (2012), ‘Neutral technology shocks and the dynamics of labor input:Results from an agnostic identification’, International Economic Review 53(1), 235–254.
Ravn, M. O. & Simonelli, S. (2008), ‘Labor market dynamics and the business cycle: Structuralevidence for the United States’, Scandinavian Journal of Economics 109(4), 743–777.
Rotemberg, J. J. & Woodford, M. (1996), ‘Imperfect competition and the effects of energy priceincreases on economic activity’, Journal of Money, Credit and Banking 28(4), 459–577.
Sargan, J. D. (1964), Wages and prices in the United Kingdom: A study in econometric method-ology, in P. E. Hart, G. Mills & J. K. Whitaker, eds, ‘Econometric Analysis for NationalEconomic Planning’, Vol. 16 of Colston Papers, Butterworth, London, pp. 25–63.
Schmitt-Grohé, S. & Uribe, M. (2011), ‘Business cycles with a common trend in neutral andinvestment-specific productivity’, Review of Economic Dynamics 14(1), 122–135.
Shapiro, M. D. & Watson, M. W. (1988), Sources of business cycles fluctuations, in S. Fisher,ed., ‘NBER Macroeconomics Annual 1988’, Vol. 3 of NBER Macroeconomics Annual, TheMIT Press, Cambridge, MA, pp. 111–156.
Sims, C. A. (1992), ‘Interpreting the macroeconomic time series facts: The effects of monetarypolicy’, European Economic Review 36(5), 975–1000.
Sims, C. A. & Zha, T. (2006), ‘Does monetary policy generate recessions?’, MacroeconomicDynamics 10(02), 231–272.
Smets, F. & Wouters, R. (2007), ‘Shocks and frictions in US business cycles: A Bayesian DSGEapproach’, American Economic Review 97(3), 586–606.
Thomson Reuters (2013), ‘Thomson Reuters Equal Weight Continuous Commodity Index(CCI)’.URL: http : //thomsonreuters.com/content/financial/pdf/i_and_a/indices/cci_factsheet.pdf (last access: March 22, 2013).
Thomson Reuters/Jefferies (2013), ‘Thomson Reuters/Jefferies CRB Index’.URL: http : //www.jefferies.com/Commodities/2cc/389 (last access: March 22, 2013).
24

26
A Tables
A.1 Sources and Definitions of Data
Series Definition Source MnemonicPOP civilian non-institutional population 16+ FRED CNP16OVFFR effective (net) Federal Funds rate FRED FEDFUNDSCPI consumer price index (all urban consumers) FRED CPIAUCSLPPI producer price index (crude materials) FRED PPICRMGOV real government consumption expenditures FRED GCEC96
& gross investmentEXP real exports of goods & services FRED EXPGSC1IMP real imports of goods & services FRED IMPGSC1HOU hours in the business sector BLS PRS84006033OUT real output per hour in the business sector BLS PRS84006093EMP employment in the business sector BLS PRS84006013RPI quality-adjusted relative price of investment DiCecio (2009) p_iCON real personal consumption expenditures DiCecio (2009) cndq + csq
(nondurables & services)INV real quality adjusted gross private fixed DiCecio (2009) r_inv
investment + PCE durables, divided by 100CCI continuous commodity index Datastream NYFECRB
Table 1: This table displays the definitions of the raw series used. The BLS (2012, p. 5) defines crudematerials for further processing as “[. . . ] unprocessed commodities not sold directly to consumers. Crudefoodstuffs and feedstuffs include items such as grains and livestock. The crude energy goods categoryconsists of crude petroleum, natural gas to pipelines, and coal. Examples of crude nonfood materialsother than energy include raw cotton, construction sand and gravel, and iron and steel scrap”. Currentand historical weights can be downloaded at: ftp : //ftp.bls.gov/pub/special.requests/ppi/; e.g.sopnew08.txt summarizes the weights in December 2007. We also thank Riccardo DiCecio for kindlysharing his data. The quality-adjustment follows Gordon (1990), Cummins & Violante (2002), and Fisher(2006). Consumer durables are included in investment, but the change in inventories is not. We aggregateall monthly series to quarterly data.
A.2 Definition of Variables in the SVAR
Variable Symbol Definitiongrowth in labor p’tivity Δat first difference of log (OUT)growth in RPI Δqt first difference of log (RPI)per-capita hours ht log of (HOU/POP)inflation rate πt first difference of log (CPI)nominal interest rate rt FFRemployment rate nt log of (EMP/POP)commodity price index pt log of (PPI)consumption share ct log of (CON/(CON+INV+GOV+EXP-IMP))investment share it log of (INV/(CON+INV+GOV+EXP-IMP))export/import ratio dt log of (EXP/IMP)continuous commodity index ccit log of (CCI)
Table 2: This table displays the variables that enter the SVAR. The trivariate model (Canova et al.2010) uses only the first three variables. The last two variables are only used for robustness checks.
25

27
A.3 Cross Correlations with Technology Shocks
0 1 2 3 4 5ct lag 0.091 0.080 0.090 0.082 0.094 0.059
lead 0.091 0.108 0.108 0.069 0.028 0.033nt lag -0.092 -0.033 -0.018 -0.019 -0.012 -0.001
lead -0.092 -0.105 -0.119 -0.085 -0.064 -0.077rt lag -0.104 -0.052 -0.016 0.021 0.020 0.068
lead -0.104 −0.152∗ −0.190∗∗ −0.210∗∗ −0.197∗∗ −0.145∗
πt lag −0.280∗∗ -0.040 -0.047 -0.122 -0.074 -0.010lead −0.280∗∗ −0.171∗ -0.136 -0.136 -0.107 -0.112
it lag 0.001 -0.026 -0.012 -0.033 -0.045 -0.033lead 0.001 0.012 0.038 0.076 0.100 0.094
pt lag −0.188∗∗ -0.065 -0.050 -0.062 -0.025 0.003lead −0.188∗∗ −0.154∗ -0.134 -0.129 -0.103 -0.100
(a) neutral technology
0 1 2 3 4 5ct lag -0.038 −0.143∗ -0.118 −0.148∗ -0.083 -0.099
lead -0.038 -0.017 0.018 0.033 0.044 0.064nt lag -0.019 0.011 0.022 0.007 0.004 0.003
lead -0.019 -0.036 -0.081 -0.111 -0.115 -0.091rt lag 0.053 0.096 0.095 0.021 0.010 -0.018
lead 0.053 0.003 -0.056 -0.075 -0.048 -0.074πt lag -0.092 0.188∗∗ 0.175∗ 0.016 0.156∗ 0.123
lead -0.092 -0.012 -0.015 -0.137 -0.100 0.014it lag -0.081 0.024 0.031 0.028 0.000 0.016
lead -0.081 -0.104 −0.171∗ −0.177∗ -0.133 -0.103pt lag -0.007 0.066 0.103 0.086 0.081 0.064
lead -0.007 0.000 -0.021 -0.051 -0.002 0.038
(b) investment-specific technology
Table 3: The table displays cross correlation coefficients between the the neutral and the investmentspecific technology shock series estimated using a trivariate SVAR following Canova et al. (2010), re-spectively, and the remaining six variables in our SVAR at leads and lags (± 5 quarters). Stars (∗, ∗∗)indicate significance at the 5% and 1% level, respectively.
26

28
A.4 Variance Decomposition at Business Cycle Frequencies
commodity monetary neutral investment all fourprices policy tech specific shocks
yt 12 (8) 8 (5) 11 (7) 21 (12) 52 (14)yt/ht 8 (6) 6 (4) 17 (9) 13 (9) 44 (14)qt 9 (6) 3 (3) 11 (7) 29 (15) 51 (16)ht 11 (8) 6 (5) 6 (6) 29 (14) 52 (14)nt 11 (8) 7 (5) 6 (6) 27 (14) 51 (14)ht/nt 13 (8) 5 (4) 9 (6) 29 (13) 55 (14)πt 17 (9) 6 (4) 12 (8) 14 (10) 49 (14)rt 14 (8) 11 (6) 7 (6) 26 (14) 58 (14)it 14 (8) 8 (5) 9 (6) 20 (12) 51 (13)ct 14 (8) 8 (5) 13 (8) 20 (11) 55 (14)pt 51 (15) 4 (3) 7 (6) 11 (8) 73 (14)
(a) Benchmark Specification
commodity monetary neutral investment all fourprices policy tech specific shocks
yt 17 (8) 7 (4) 14 (9) 17 (10) 55 (11)yt/ht 11 (7) 5 (3) 16 (10) 19 (10) 51 (12)qt 13 (7) 3 (2) 10 (6) 18 (14) 43 (14)ht 14 (8) 6 (4) 9 (8) 20 (12) 50 (13)nt 14 (8) 6 (4) 9 (8) 23 (13) 52 (13)ht/nt 17 (8) 5 (4) 9 (7) 14 (9) 45 (11)πt 25 (10) 5 (4) 9 (7) 17 (11) 57 (11)rt 17 (9) 13 (5) 8 (7) 20 (12) 58 (13)it 17 (8) 8 (5) 11 (8) 16 (10) 53 (11)ct 20 (9) 8 (5) 14 (8) 15 (9) 57 (11)pt 60 (11) 6 (4) 5 (4) 7 (4) 77 (10)
(b) Level Specification
Table 4: The table displays the decomposition of variance at business cycle frequencies based on es-timated spectral densities (following Altig et al. 2011). Numbers are means of point estimates acrossbootstrap simulations, numbers in parentheses are the corresponding standard deviations.
27

29
A.5 Robustness
commodity monetary neutral investment all fourprices policy tech specific shocks
Benchmark Specificationyt 12 (8) 8 (5) 11 (7) 21 (12) 52 (14)ht 11 (8) 6 (5) 6 (6) 29 (14) 52 (14)πt 17 (9) 6 (4) 12 (8) 14 (10) 49 (14)
Level Specificationyt 17 (8) 7 (4) 14 (9) 17 (10) 55 (11)ht 14 (8) 6 (4) 9 (8) 20 (12) 50 (13)πt 25 (10) 5 (4) 9 (7) 17 (11) 57 (11)
Difference Specificationyt 15 (7) 9 (5) 15 (9) 15 (10) 53 (12)ht 12 (7) 7 (5) 11 (9) 21 (12) 51 (13)πt 24 (9) 6 (4) 9 (6) 15 (10) 54 (12)
Dummy Specificationyt 16 (8) 8 (5) 13 (8) 17 (10) 54 (11)ht 15 (8) 6 (4) 7 (6) 21 (13) 50 (13)πt 27 (10) 6 (4) 8 (6) 12 (9) 53 (11)
Francis & Ramey (2009) Hoursyt 11 (6) 6 (4) 15 (9) 18 (11) 50 (12)ht 9 (6) 6 (4) 9 (8) 22 (13) 46 (13)πt 19 (9) 4 (3) 8 (7) 19 (13) 50 (12)
Commodity Prices in First Differencesyt 10 (6) 8 (5) 14 (8) 18 (11) 50 (14)ht 9 (6) 6 (5) 6 (5) 28 (13) 50 (14)πt 17 (9) 7 (5) 8 (6) 12 (9) 44 (15)
Benchmark Specification with 4 Lagsyt 11 (7) 6 (4) 13 (8) 15 (9) 45 (13)ht 10 (7) 5 (4) 8 (6) 21 (12) 44 (13)πt 20 (10) 7 (4) 12 (7) 7 (5) 45 (13)
Pre-Volcker Period (1959Q1-1979Q2)yt 16 (10) 12 (7) 13 (10) 15 (11) 57 (14)ht 17 (11) 13 (7) 11 (8) 14 (11) 55 (14)πt 17 (10) 12 (7) 10 (8) 15 (8) 55 (13)
Post-Volcker Period (1980Q1-2007Q4)yt 9 (7) 8 (5) 8 (7) 23 (14) 48 (14)ht 9 (8) 7 (5) 8 (7) 23 (16) 47 (15)πt 13 (8) 6 (4) 7 (6) 18 (12) 44 (13)
External Demand Shockyt 10 (7) 7 (5) 11 (7) 20 (12) 54† (14)ht 10 (7) 6 (5) 7 (6) 28 (15) 57† (14)πt 13 (8) 5 (4) 11 (9) 16 (10) 51† (14)
Non-Predetermined Commodity Pricesyt 12 (9) 7 (5) 12 (8) 18 (11) 49 (15)ht 12 (9) 6 (5) 7 (6) 27 (14) 52 (15)πt 17 (10) 5 (4) 11 (8) 15 (10) 48 (15)
Thomson Reuters Continuous Commodity Indexyt 22 (10) 5 (3) 9 (6) 14 (9) 50 (13)ht 20 (10) 4 (3) 7 (6) 14 (10) 45 (13)πt 31 (12) 3 (3) 8 (6) 11 (7) 53 (12)
Table 5: The table displays the decomposition of variance at business cycle frequencies based on es-timated spectral densities (following Altig et al. 2011). Numbers are means of point estimates acrossbootstrap simulations, numbers in parentheses are the corresponding standard deviations. The “externaldemand shock” specification includes five shocks in total (denoted by a dag symbol †).
28

30
B Figures
B.1 Commodity Price Indices
Figure 1: The figure illustrates the evolution of the “PPI: crude materials for further processing” indexby the BLS (2012, p. 8, dashed line), the “old CRB” by Thomson Reuters (2013, calculated backwardsuntil 1956Q4, dotted line), and the “new” Thomson Reuters/Jefferies (2013, solid line) CRB index,introduced in 2005, but calculated backwards until 1994Q1. All three indices are logged and normalizedto unity in 2007Q4.
B.2 Coherence Analysis
0 10 20 30 40 50 60 70 80 900
0.1
0.2
0.3
0.4
0.5
0.6
0.7
0.8
0.9
11
BC Freq.
all filtered
not filtered
(a) all series are filtered
0 10 20 30 40 50 60 70 80 900
0.1
0.2
0.3
0.4
0.5
0.6
0.7
0.8
0.9
1
BC Freq.
hours filtered
not filtered
(b) only per-capita hours are filtered
Figure 2: The figure illustrates the coherence between labor productivity growth and per-capita hours,estimated with five lags.
29

31
B.3 Impulse Response Functions
0 5 10 15 20 25 30
−0.2
0
0.2
Output
0 5 10 15 20 25 30
−0.15
−0.1
−0.05
0
0.05
Labor Productivity
0 5 10 15 20 25 30
−0.1
0
0.1
Relative Price of Investment
0 5 10 15 20 25 30
−0.2
0
0.2
Hours
0 5 10 15 20 25 30−0.2
0
0.2
Employment
0 5 10 15 20 25 30
−0.05
0
0.05
Hours per Worker
0 5 10 15 20 25 30
−0.1
0
0.1
0.2
CPI Inflation Rate
0 5 10 15 20 25 30
−10
0
10
20
Fed Funds Rate
0 5 10 15 20 25 30
−1
−0.5
0
0.5
Investment
Median
90%
80%
70%
60%
0 5 10 15 20 25 30
−0.2
0
0.2
Consumption
0 5 10 15 20 25 30
0
1
2
Commodity Prices
(a) Benchmark Specification
0 5 10 15 20 25 30
−0.6
−0.4
−0.2
0
0.2
Output
0 5 10 15 20 25 30−0.4
−0.2
0
Labor Productivity
0 5 10 15 20 25 30
−0.4
−0.2
0
Relative Price of Investment
0 5 10 15 20 25 30−0.4
−0.2
0
0.2
Hours
0 5 10 15 20 25 30
−0.2
0
0.2
Employment
0 5 10 15 20 25 30
−0.1
0
0.1
0.2
Hours per Worker
0 5 10 15 20 25 30
−0.2
0
0.2
0.4
CPI Inflation Rate
0 5 10 15 20 25 30
−20
0
20
40
Fed Funds Rate
0 5 10 15 20 25 30
−2
−1
0
Investment
Median
90%
80%
70%
60%
0 5 10 15 20 25 30
−0.6
−0.4
−0.2
0
0.2
Consumption
0 5 10 15 20 25 30
−2
0
2
4
Commodity Prices
(b) Level Specification
Figure 3: The figure illustrates the impulse responses to a commodity price shock.
30

32
0 5 10 15 20 25 30
−0.2
0
0.2
Output
0 5 10 15 20 25 30−0.1
0
0.1
Labor Productivity
0 5 10 15 20 25 30−0.1
−0.05
0
0.05
Relative Price of Investment
0 5 10 15 20 25 30−0.2
0
0.2
Hours
0 5 10 15 20 25 30
−0.1
0
0.1
0.2
Employment
0 5 10 15 20 25 30
−0.08
−0.06
−0.04
−0.02
0
0.02
Hours per Worker
0 5 10 15 20 25 30
−0.1
0
0.1
CPI Inflation Rate
0 5 10 15 20 25 30
−20
−10
0
10
Fed Funds Rate
0 5 10 15 20 25 30−0.5
0
0.5
Investment
Median
90%
80%
70%
60%
0 5 10 15 20 25 30
−0.1
0
0.1
0.2
Consumption
0 5 10 15 20 25 30−0.5
0
0.5
Commodity Prices
(a) Benchmark Specification
0 5 10 15 20 25 30−0.2
0
0.2
0.4
Output
0 5 10 15 20 25 30
−0.1
0
0.1
0.2
Labor Productivity
0 5 10 15 20 25 30
−0.1
0
0.1
0.2
Relative Price of Investment
0 5 10 15 20 25 30
−0.1
0
0.1
0.2
0.3
Hours
0 5 10 15 20 25 30−0.1
0
0.1
0.2
Employment
0 5 10 15 20 25 30
−0.1
−0.05
0
0.05
Hours per Worker
0 5 10 15 20 25 30
−0.2
0
0.2CPI Inflation Rate
0 5 10 15 20 25 30
−40
−20
0
Fed Funds Rate
0 5 10 15 20 25 30
0
0.5
1
1.5
Investment
Median
90%
80%
70%
60%
0 5 10 15 20 25 30
0
0.2
0.4
Consumption
0 5 10 15 20 25 30
−1
0
1
Commodity Prices
(b) Level Specification
Figure 4: The figure illustrates the impulse responses to a monetary policy shock.
31

33
0 5 10 15 20 25 300
0.2
0.4
0.6
Output
0 5 10 15 20 25 300
0.2
0.4
Labor Productivity
0 5 10 15 20 25 30
−0.1
0
0.1
0.2
Relative Price of Investment
0 5 10 15 20 25 30
0
0.1
0.2
0.3
Hours
0 5 10 15 20 25 30
0
0.1
0.2
Employment
0 5 10 15 20 25 30−0.05
0
0.05
0.1
Hours per Worker
0 5 10 15 20 25 30−0.4
−0.2
0
CPI Inflation Rate
0 5 10 15 20 25 30−20
−10
0
10
Fed Funds Rate
0 5 10 15 20 25 300
0.5
1
Investment
Median
90%
80%
70%
60%
0 5 10 15 20 25 300
0.2
0.4
0.6
Consumption
0 5 10 15 20 25 30
−0.5
0
0.5
Commodity Prices
(a) Benchmark Specification
0 5 10 15 20 25 300
0.5
1
Output
0 5 10 15 20 25 300
0.2
0.4
0.6
0.8
Labor Productivity
0 5 10 15 20 25 30−0.6
−0.4
−0.2
0
Relative Price of Investment
0 5 10 15 20 25 30
0
0.2
0.4
0.6
Hours
0 5 10 15 20 25 30
0
0.2
0.4
Employment
0 5 10 15 20 25 30
0
0.05
0.1
0.15
Hours per Worker
0 5 10 15 20 25 30
−0.8
−0.6
−0.4
−0.2
0
CPI Inflation Rate
0 5 10 15 20 25 30
−20
0
20
Fed Funds Rate
0 5 10 15 20 25 30
0
1
2
Investment
Median
90%
80%
70%
60%
0 5 10 15 20 25 300
0.2
0.4
0.6
0.8
Consumption
0 5 10 15 20 25 30−1.5
−1
−0.5
0
0.5
Commodity Prices
(b) Level Specification
Figure 5: The figure illustrates the impulse responses to a neutral technology shock.
32

34
Trivariate 9-variate Model
BP
Filt
erL
evel
Diff
eren
ceD
umm
yF
&R
Fern
ald
(200
7)
Figure 6: The figure illustrates the low-frequency bias by the means of the per-capita hours responseto a neutral technology shock.
33

35
0 5 10 15 20 25 30−0.2
0
0.2
0.4
0.6
Output
0 5 10 15 20 25 30−0.2
0
0.2
Labor Productivity
0 5 10 15 20 25 30−1
−0.5
0Relative Price of Investment
0 5 10 15 20 25 30
0
0.2
0.4
0.6
Hours
0 5 10 15 20 25 30
0
0.2
0.4
Employment
0 5 10 15 20 25 30
0
0.05
0.1
0.15
Hours per Worker
0 5 10 15 20 25 30−0.2
0
0.2
CPI Inflation Rate
0 5 10 15 20 25 30
0
20
40
Fed Funds Rate
0 5 10 15 20 25 30
−0.5
0
0.5
1
Investment
Median
90%
80%
70%
60%
0 5 10 15 20 25 30−0.2
0
0.2
0.4
Consumption
0 5 10 15 20 25 30
−1
−0.5
0
0.5
Commodity Prices
(a) Benchmark Specification
0 5 10 15 20 25 30
−0.5
0
0.5
Output
0 5 10 15 20 25 30
−0.4
−0.2
0
0.2
Labor Productivity
0 5 10 15 20 25 30−0.8
−0.6
−0.4
−0.2
0
Relative Price of Investment
0 5 10 15 20 25 30
−0.2
0
0.2
0.4
0.6
Hours
0 5 10 15 20 25 30
0
0.2
0.4
0.6
Employment
0 5 10 15 20 25 30
−0.2
−0.1
0
0.1
Hours per Worker
0 5 10 15 20 25 30
−0.2
0
0.2
0.4
CPI Inflation Rate
0 5 10 15 20 25 30
0
20
40
60
Fed Funds Rate
0 5 10 15 20 25 30
−1
0
1
Investment
Median
90%
80%
70%
60%
0 5 10 15 20 25 30−0.5
0
0.5
Consumption
0 5 10 15 20 25 30−1
0
1
Commodity Prices
(b) Level Specification
Figure 7: The figure illustrates the impulse responses to an investment-specific technology shock.
34

36
B.4 Counterfactual Exercise
Output Fed Funds Rate CPI Inflation
Figure 8: The graphs illustrate the time path of output, the Federal Funds rate, and inflation predictedby commodity price shock (bold line) with the same series predicted by the commodity price shock inthe absence of a monetary policy feedback rule (thin line).
Output Per-Capita Hours CPI Inflation
B’m
ark
C’f
actu
al
Figure 9: The top panel illustrates the responses of output, per-capita hours, and inflation to theestimated commodity price shock. The bottom panel illustrates the same responses when the FederalFunds rate — counterfactually — is assumed to be constant.
All Items All Items less F&E Food & Energy
B’m
ark
C’f
actu
al
Figure 10: The figure illustrates the impulse responses of three CPI inflation measures to the identifiedcommodity price shock; i.e., the “headline” inflation rate (all items), the “core” inflation rate (all itemsless food and energy), and the “food and energy” inflation rate. Due to limited data availability, thelatter two responses are estimated using a slightly reduced sample period (1958Q2-2007Q4). The CPI“food and energy” is a weighted average of its components, using time varying weights (based on owncalculations). All data are taken from FRED.
35
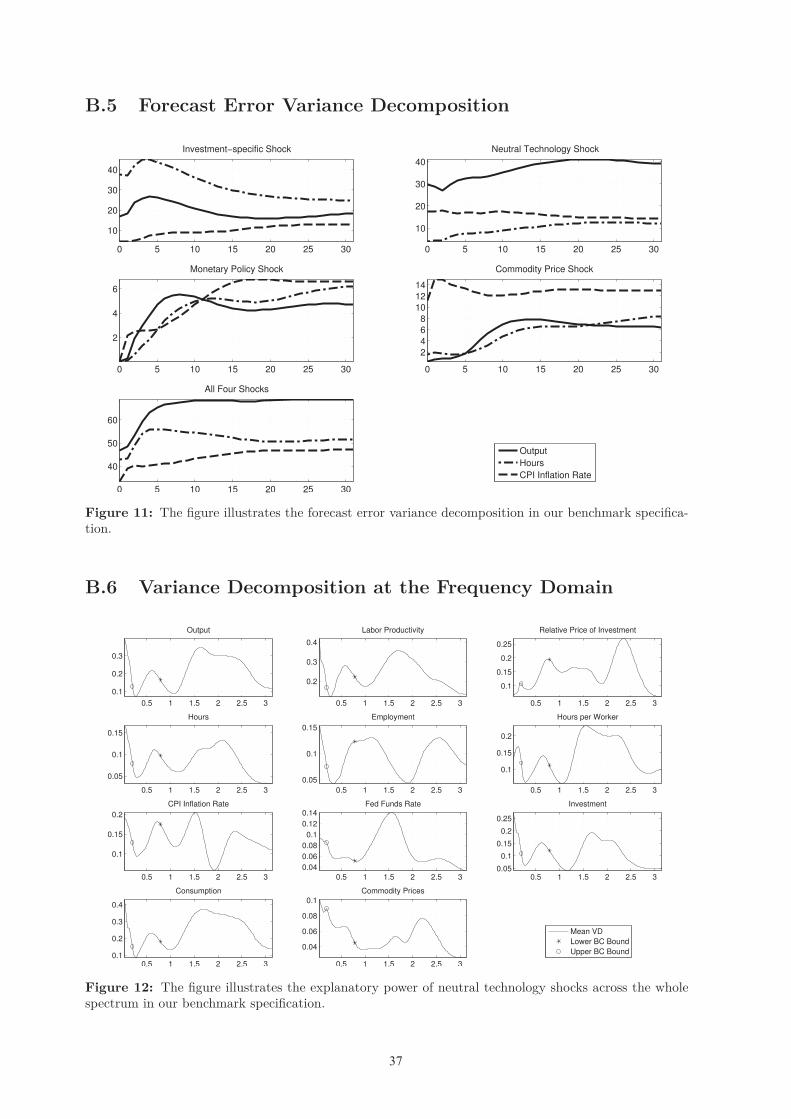
37
B.5 Forecast Error Variance Decomposition
0 5 10 15 20 25 30
10
20
30
40
Investment−specific Shock
0 5 10 15 20 25 30
10
20
30
40
Neutral Technology Shock
0 5 10 15 20 25 30
2
4
6
Monetary Policy Shock
0 5 10 15 20 25 30
2
4
6
8
10
12
14
Commodity Price Shock
Output
Hours
CPI Inflation Rate
0 5 10 15 20 25 30
40
50
60
All Four Shocks
Figure 11: The figure illustrates the forecast error variance decomposition in our benchmark specifica-tion.
B.6 Variance Decomposition at the Frequency Domain
0.5 1 1.5 2 2.5 3
0.1
0.2
0.3
Output
0.5 1 1.5 2 2.5 3
0.2
0.3
0.4
Labor Productivity
0.5 1 1.5 2 2.5 3
0.1
0.15
0.2
0.25
Relative Price of Investment
0.5 1 1.5 2 2.5 3
0.05
0.1
0.15
Hours
0.5 1 1.5 2 2.5 3
0.05
0.1
0.15
Employment
0.5 1 1.5 2 2.5 3
0.1
0.15
0.2
Hours per Worker
0.5 1 1.5 2 2.5 3
0.1
0.15
0.2
CPI Inflation Rate
0.5 1 1.5 2 2.5 3
0.04
0.06
0.08
0.1
0.12
0.14Fed Funds Rate
0.5 1 1.5 2 2.5 30.05
0.1
0.15
0.2
0.25
Investment
Mean VD
Lower BC Bound
Upper BC Bound
0.5 1 1.5 2 2.5 30.1
0.2
0.3
0.4
Consumption
0.5 1 1.5 2 2.5 3
0.04
0.06
0.08
0.1
Commodity Prices
Figure 12: The figure illustrates the explanatory power of neutral technology shocks across the wholespectrum in our benchmark specification.
36
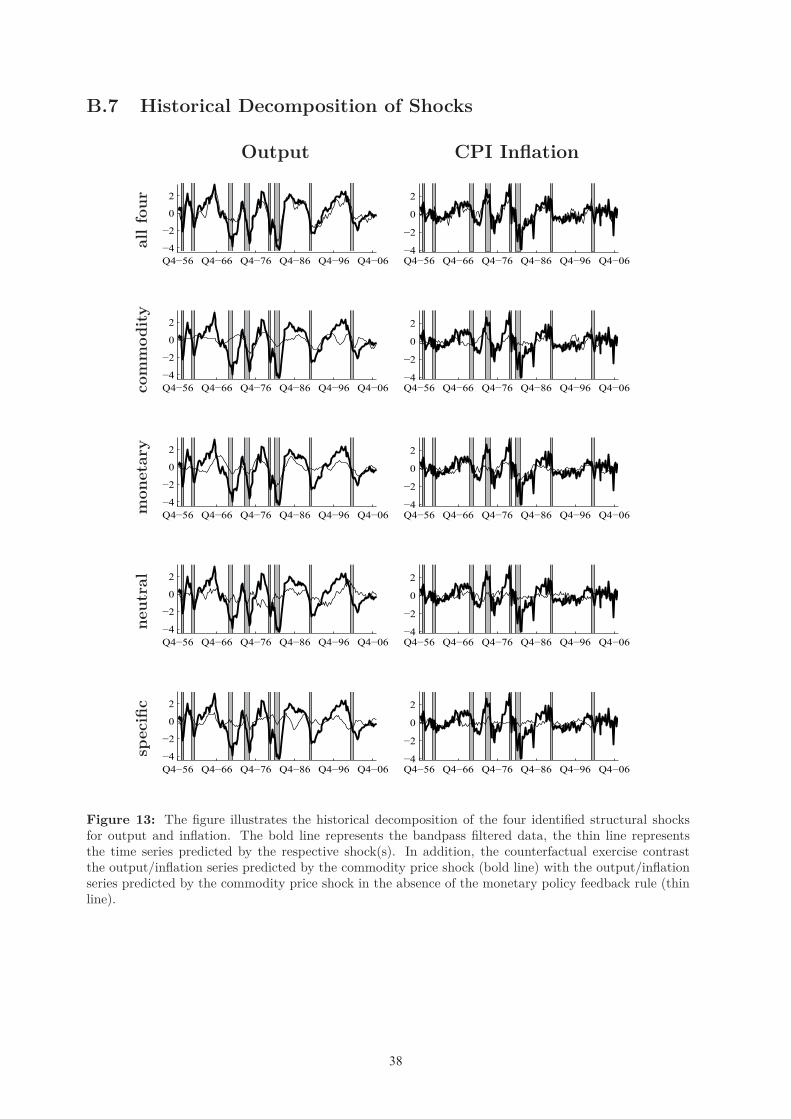
38
B.7 Historical Decomposition of Shocks
Output CPI Inflational
lfo
urco
mm
odit
ym
onet
ary
neut
ral
spec
ific
Figure 13: The figure illustrates the historical decomposition of the four identified structural shocksfor output and inflation. The bold line represents the bandpass filtered data, the thin line representsthe time series predicted by the respective shock(s). In addition, the counterfactual exercise contrastthe output/inflation series predicted by the commodity price shock (bold line) with the output/inflationseries predicted by the commodity price shock in the absence of the monetary policy feedback rule (thinline).
37
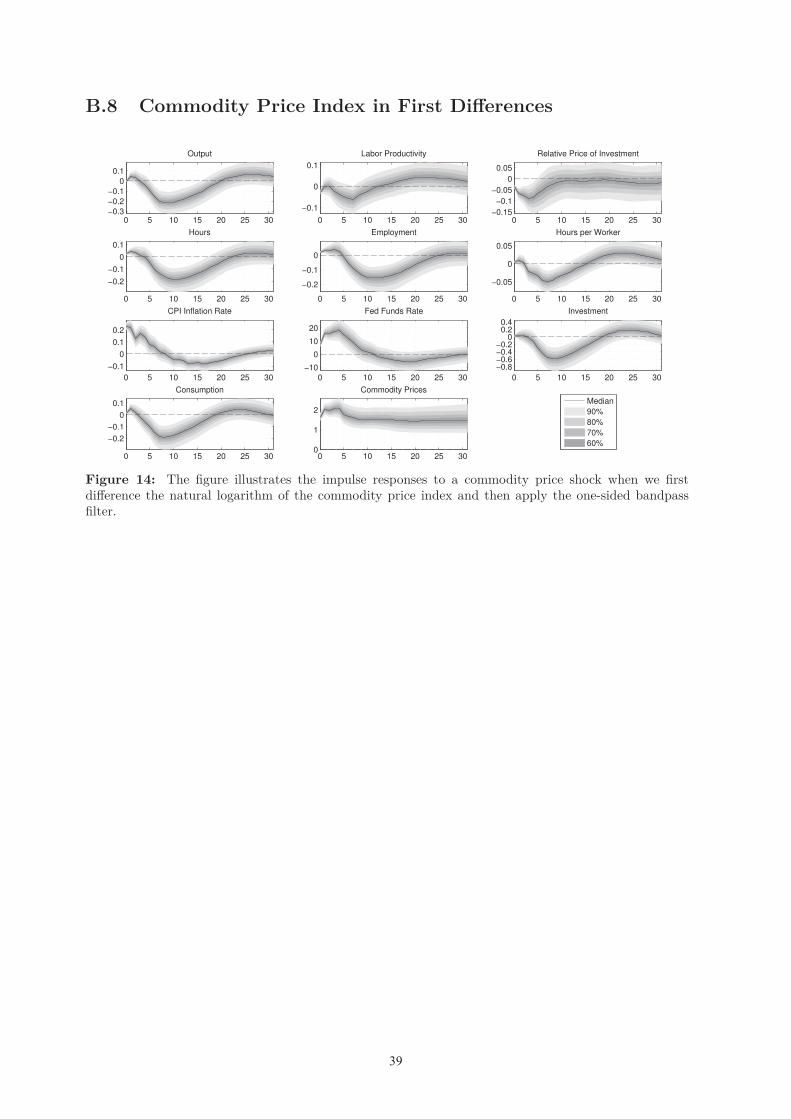
39
B.8 Commodity Price Index in First Differences
0 5 10 15 20 25 30−0.3
−0.2
−0.1
0
0.1
Output
0 5 10 15 20 25 30
−0.1
0
0.1
Labor Productivity
0 5 10 15 20 25 30−0.15
−0.1
−0.05
0
0.05
Relative Price of Investment
0 5 10 15 20 25 30
−0.2
−0.1
0
0.1
Hours
0 5 10 15 20 25 30
−0.2
−0.1
0
Employment
0 5 10 15 20 25 30
−0.05
0
0.05
Hours per Worker
0 5 10 15 20 25 30
−0.1
0
0.1
0.2
CPI Inflation Rate
0 5 10 15 20 25 30
−10
0
10
20
Fed Funds Rate
0 5 10 15 20 25 30
−0.8−0.6−0.4−0.2
00.20.4
Investment
Median
90%
80%
70%
60%
0 5 10 15 20 25 30
−0.2
−0.1
0
0.1
Consumption
0 5 10 15 20 25 300
1
2
Commodity Prices
Figure 14: The figure illustrates the impulse responses to a commodity price shock when we firstdifference the natural logarithm of the commodity price index and then apply the one-sided bandpassfilter.
38

40
B.9 Subsample Stability
Full Sample Pre-Volcker Post-Volcker
Out
put
Hou
rsC
ore
CP
IF
&E
CP
IF
FR
ate
Figure 15: The figure contrasts the impulse responses to a commodity price shock in the “full” sample(1959Q1-2007Q4), the pre-Volcker period (1959Q1-1979Q2), and in the post-Volcker period (1980Q1-2007Q4). All three models are estimated with three lags (M = 3). In order to facilitate comparabilityacross sub-samples, the standard deviation of the commodity price shock is normalized to the standarddeviation over the full sample.
39

41
B.10 External Demand
0 5 10 15 20 25 30
−0.2
0
0.2
Output
0 5 10 15 20 25 30−0.15
−0.1
−0.05
0
0.05
Labor Prod.
0 5 10 15 20 25 30
−0.1
0
0.1
Price of Inv.
0 5 10 15 20 25 30
−0.2
0
0.2
Agg. avg. Hours
0 5 10 15 20 25 30
−0.2
0
0.2
Employment
0 5 10 15 20 25 30
−0.05
0
0.05
Hours per Worker
0 5 10 15 20 25 30
−0.1
0
0.1
0.2
Inflation Rate
0 5 10 15 20 25 30−20
0
20
FF Rate
0 5 10 15 20 25 30−1
−0.5
0
0.5
Investment
0 5 10 15 20 25 30
−0.3−0.2−0.1
00.1
Consumption
0 5 10 15 20 25 30
0
1
2
Commodity Prices
0 5 10 15 20 25 30
0
0.5
1
External Demand
(a) Commodity Price Shock
0 5 10 15 20 25 30−0.2
0
0.2
Output
0 5 10 15 20 25 30
−0.1
0
0.1
Labor Prod.
0 5 10 15 20 25 30−0.1
0
0.1
0.2
Price of Inv.
0 5 10 15 20 25 30−0.2
0
0.2
Agg. avg. Hours
0 5 10 15 20 25 30
−0.1
0
0.1
Employment
0 5 10 15 20 25 30−0.04−0.02
00.020.040.060.08
Hours per Worker
0 5 10 15 20 25 30
−0.05
0
0.05
0.1
Inflation Rate
0 5 10 15 20 25 30
−10
0
10
FF Rate
0 5 10 15 20 25 30
−0.6−0.4−0.2
00.20.4
Investment
0 5 10 15 20 25 30
−0.2
−0.1
0
0.1
Consumption
0 5 10 15 20 25 30
−0.5
0
0.5
Commodity Prices
0 5 10 15 20 25 30
0
0.5
1
External Demand
(b) External Demand Shock
Figure 16: The figure illustrates the impulse responses when we include external demand shocks.
40

42
B.11 Commodity Prices: Relaxed Exogeneity Assumption
0 5 10 15 20 25 30−0.4
−0.2
0
0.2
Output
0 5 10 15 20 25 30−0.2
−0.1
0
0.1
Labor Productivity
0 5 10 15 20 25 30
−0.1
0
0.1
0.2
Relative Price of Investment
0 5 10 15 20 25 30
−0.2
0
0.2
Hours
0 5 10 15 20 25 30
−0.2
0
0.2
Employment
0 5 10 15 20 25 30−0.1
−0.05
0
0.05
Hours per Worker
0 5 10 15 20 25 30
−0.10
0.10.20.3
CPI Inflation Rate
0 5 10 15 20 25 30
−20
0
20
Fed Funds Rate
0 5 10 15 20 25 30
−1
−0.5
0
0.5
Investment
Median
90%
80%
70%
60%
0 5 10 15 20 25 30−0.4
−0.2
0
0.2
Consumption
0 5 10 15 20 25 30
0
1
2
Commodity Prices
Figure 17: The figure illustrates the impulse responses to a commodity price shock when commodityprices may depend on the current values of labor productivity and per-capita hours.
B.12 Thomson Reuters Continuous Commodity Index
0 5 10 15 20 25 30
−0.2
0
0.2
Output
0 5 10 15 20 25 30−0.2
−0.1
0
0.1
Labor Productivity
0 5 10 15 20 25 30
−0.1
0
0.1
Relative Price of Investment
0 5 10 15 20 25 30
−0.2
0
0.2
Hours
0 5 10 15 20 25 30
−0.2
0
0.2
Employment
0 5 10 15 20 25 30
−0.05
0
0.05
Hours per Worker
0 5 10 15 20 25 30
−0.10
0.10.20.3
CPI Inflation Rate
0 5 10 15 20 25 30−20
0
20
Fed Funds Rate
0 5 10 15 20 25 30
−1
−0.5
0
0.5
Investment
Median
90%
80%
70%
60%
0 5 10 15 20 25 30
−0.2
0
0.2
Consumption
0 5 10 15 20 25 30
0
1
2
Commodity Prices
Figure 18: The figure illustrates the impulse responses to a commodity price shock when commodityprices are represented by the Thomson Reuters Continuous Commodity Index.
41

43
Swiss National Bank Working Papers published since 2004: 2004-1 Samuel Reynard: Financial Market Participation and the Apparent Instability of
Money Demand 2004-2 Urs W. Birchler and Diana Hancock: What Does the Yield on Subordinated Bank Debt Measure? 2005-1 Hasan Bakhshi, Hashmat Khan and Barbara Rudolf: The Phillips curve under state-dependent pricing 2005-2 Andreas M. Fischer: On the Inadequacy of Newswire Reports for Empirical Research on Foreign Exchange Interventions 2006-1 Andreas M. Fischer: Measuring Income Elasticity for Swiss Money Demand: What do the Cantons say about Financial Innovation? 2006-2 Charlotte Christiansen and Angelo Ranaldo: Realized Bond-Stock Correlation:
Macroeconomic Announcement Effects 2006-3 Martin Brown and Christian Zehnder: Credit Reporting, Relationship Banking, and Loan Repayment 2006-4 Hansjörg Lehmann and Michael Manz: The Exposure of Swiss Banks to
Macroeconomic Shocks – an Empirical Investigation 2006-5 Katrin Assenmacher-Wesche and Stefan Gerlach: Money Growth, Output Gaps and
Inflation at Low and High Frequency: Spectral Estimates for Switzerland 2006-6 Marlene Amstad and Andreas M. Fischer: Time-Varying Pass-Through from Import
Prices to Consumer Prices: Evidence from an Event Study with Real-Time Data 2006-7 Samuel Reynard: Money and the Great Disinflation 2006-8 Urs W. Birchler and Matteo Facchinetti: Can bank supervisors rely on market data?
A critical assessment from a Swiss perspective 2006-9 Petra Gerlach-Kristen: A Two-Pillar Phillips Curve for Switzerland 2006-10 Kevin J. Fox and Mathias Zurlinden: On Understanding Sources of Growth and
Output Gaps for Switzerland 2006-11 Angelo Ranaldo: Intraday Market Dynamics Around Public Information Arrivals 2007-1 Andreas M. Fischer, Gulzina Isakova and Ulan Termechikov: Do FX traders in
Bishkek have similar perceptions to their London colleagues? Survey evidence of market practitioners’ views

44
2007-2 Ibrahim Chowdhury and Andreas Schabert: Federal Reserve Policy viewed through a Money Supply Lens
2007-3 Angelo Ranaldo: Segmentation and Time-of-Day Patterns in Foreign Exchange
Markets 2007-4 Jürg M. Blum: Why ‘Basel II’ May Need a Leverage Ratio Restriction 2007-5 Samuel Reynard: Maintaining Low Inflation: Money, Interest Rates, and Policy
Stance 2007-6 Rina Rosenblatt-Wisch: Loss Aversion in Aggregate Macroeconomic Time Series 2007-7 Martin Brown, Maria Rueda Maurer, Tamara Pak and Nurlanbek Tynaev: Banking
Sector Reform and Interest Rates in Transition Economies: Bank-Level Evidence from Kyrgyzstan
2007-8 Hans-Jürg Büttler: An Orthogonal Polynomial Approach to Estimate the Term
Structure of Interest Rates 2007-9 Raphael Auer: The Colonial Origins Of Comparative Development: Comment.
A Solution to the Settler Mortality Debate
2007-10 Franziska Bignasca and Enzo Rossi: Applying the Hirose-Kamada filter to Swiss data: Output gap and exchange rate pass-through estimates
2007-11 Angelo Ranaldo and Enzo Rossi: The reaction of asset markets to Swiss National
Bank communication 2007-12 Lukas Burkhard and Andreas M. Fischer: Communicating Policy Options at the Zero
Bound 2007-13 Katrin Assenmacher-Wesche, Stefan Gerlach, and Toshitaka Sekine: Monetary
Factors and Inflation in Japan 2007-14 Jean-Marc Natal and Nicolas Stoffels: Globalization, markups and the natural rate
of interest 2007-15 Martin Brown, Tullio Jappelli and Marco Pagano: Information Sharing and Credit:
Firm-Level Evidence from Transition Countries 2007-16 Andreas M. Fischer, Matthias Lutz and Manuel Wälti: Who Prices Locally? Survey
Evidence of Swiss Exporters 2007-17 Angelo Ranaldo and Paul Söderlind: Safe Haven Currencies
45
2008-1 Martin Brown and Christian Zehnder: The Emergence of Information Sharing in Credit Markets
2008-2 Yvan Lengwiler and Carlos Lenz: Intelligible Factors for the Yield Curve 2008-3 Katrin Assenmacher-Wesche and M. Hashem Pesaran: Forecasting the Swiss
Economy Using VECX* Models: An Exercise in Forecast Combination Across Models and Observation Windows
2008-4 Maria Clara Rueda Maurer: Foreign bank entry, institutional development and
credit access: firm-level evidence from 22 transition countries 2008-5 Marlene Amstad and Andreas M. Fischer: Are Weekly Inflation Forecasts
Informative? 2008-6 Raphael Auer and Thomas Chaney: Cost Pass Through in a Competitive Model of
Pricing-to-Market 2008-7 Martin Brown, Armin Falk and Ernst Fehr: Competition and Relational Contracts:
The Role of Unemployment as a Disciplinary Device 2008-8 Raphael Auer: The Colonial and Geographic Origins of Comparative Development 2008-9 Andreas M. Fischer and Angelo Ranaldo: Does FOMC News Increase Global FX
Trading? 2008-10 Charlotte Christiansen and Angelo Ranaldo: Extreme Coexceedances in New EU
Member States’ Stock Markets
2008-11 Barbara Rudolf and Mathias Zurlinden: Measuring capital stocks and capital services in Switzerland
2008-12 Philip Sauré: How to Use Industrial Policy to Sustain Trade Agreements 2008-13 Thomas Bolli and Mathias Zurlinden: Measuring growth of labour quality and the
quality-adjusted unemployment rate in Switzerland 2008-14 Samuel Reynard: What Drives the Swiss Franc? 2008-15 Daniel Kaufmann: Price-Setting Behaviour in Switzerland – Evidence from CPI
Micro Data
2008-16 Katrin Assenmacher-Wesche and Stefan Gerlach: Financial Structure and the Impact of Monetary Policy on Asset Prices
2008-17 Ernst Fehr, Martin Brown and Christian Zehnder: On Reputation: A
Microfoundation of Contract Enforcement and Price Rigidity
46
2008-18 Raphael Auer and Andreas M. Fischer: The Effect of Low-Wage Import Competition on U.S. Inflationary Pressure
2008-19 Christian Beer, Steven Ongena and Marcel Peter: Borrowing in Foreign Currency:
Austrian Households as Carry Traders
2009-1 Thomas Bolli and Mathias Zurlinden: Measurement of labor quality growth caused by unobservable characteristics
2009-2 Martin Brown, Steven Ongena and Pinar Yesin: Foreign Currency Borrowing by
Small Firms 2009-3 Matteo Bonato, Massimiliano Caporin and Angelo Ranaldo: Forecasting realized
(co)variances with a block structure Wishart autoregressive model 2009-4 Paul Söderlind: Inflation Risk Premia and Survey Evidence on Macroeconomic
Uncertainty 2009-5 Christian Hott: Explaining House Price Fluctuations 2009-6 Sarah M. Lein and Eva Köberl: Capacity Utilisation, Constraints and Price
Adjustments under the Microscope 2009-7 Philipp Haene and Andy Sturm: Optimal Central Counterparty Risk Management 2009-8 Christian Hott: Banks and Real Estate Prices 2009-9 Terhi Jokipii and Alistair Milne: Bank Capital Buffer and Risk
Adjustment Decisions
2009-10 Philip Sauré: Bounded Love of Variety and Patterns of Trade 2009-11 Nicole Allenspach: Banking and Transparency: Is More Information
Always Better?
2009-12 Philip Sauré and Hosny Zoabi: Effects of Trade on Female Labor Force Participation 2009-13 Barbara Rudolf and Mathias Zurlinden: Productivity and economic growth in
Switzerland 1991-2005 2009-14 Sébastien Kraenzlin and Martin Schlegel: Bidding Behavior in the SNB's Repo
Auctions 2009-15 Martin Schlegel and Sébastien Kraenzlin: Demand for Reserves and the Central
Bank's Management of Interest Rates 2009-16 Carlos Lenz and Marcel Savioz: Monetary determinants of the Swiss franc

47
2010-1 Charlotte Christiansen, Angelo Ranaldo and Paul Söderlind: The Time-Varying Systematic Risk of Carry Trade Strategies
2010-2 Daniel Kaufmann: The Timing of Price Changes and the Role of Heterogeneity 2010-3 Loriano Mancini, Angelo Ranaldo and Jan Wrampelmeyer: Liquidity in the Foreign
Exchange Market: Measurement, Commonality, and Risk Premiums 2010-4 Samuel Reynard and Andreas Schabert: Modeling Monetary Policy 2010-5 Pierre Monnin and Terhi Jokipii: The Impact of Banking Sector Stability on the
Real Economy 2010-6 Sébastien Kraenzlin and Thomas Nellen: Daytime is money 2010-7 Philip Sauré: Overreporting Oil Reserves 2010-8 Elizabeth Steiner: Estimating a stock-flow model for the Swiss housing market 2010-9 Martin Brown, Steven Ongena, Alexander Popov, and Pinar Yesin: Who Needs
Credit and Who Gets Credit in Eastern Europe? 2010-10 Jean-Pierre Danthine and André Kurmann: The Business Cycle Implications of
Reciprocity in Labor Relations 2010-11 Thomas Nitschka: Momentum in stock market returns: Implications for risk premia
on foreign currencies 2010-12 Petra Gerlach-Kristen and Barbara Rudolf: Macroeconomic and interest rate
volatility under alternative monetary operating procedures 2010-13 Raphael Auer: Consumer Heterogeneity and the Impact of Trade Liberalization:
How Representative is the Representative Agent Framework? 2010-14 Tommaso Mancini Griffoli and Angelo Ranaldo: Limits to arbitrage during the
crisis: funding liquidity constraints and covered interest parity 2010-15 Jean-Marc Natal: Monetary Policy Response to Oil Price Shocks 2010-16 Kathrin Degen and Andreas M. Fischer: Immigration and Swiss House Prices 2010-17 Andreas M. Fischer: Immigration and large banknotes 2010-18 Raphael Auer: Are Imports from Rich Nations Deskilling Emerging Economies?
Human Capital and the Dynamic Effects of Trade
48
2010-19 Jean-Pierre Danthine and John B. Donaldson: Executive Compensation: A General Equilibrium Perspective
2011-1 Thorsten Beck and Martin Brown: Which Households Use Banks? Evidence from the
Transition Economies 2011-2 Martin Brown, Karolin Kirschenmann and Steven Ongena: Foreign Currency Loans –
Demand or Supply Driven? 2011-3 Victoria Galsband and Thomas Nitschka: Foreign currency returns and systematic
risks 2011-4 Francis Breedon and Angelo Ranaldo: Intraday patterns in FX returns and order
flow 2011-5 Basil Guggenheim, Sébastien Kraenzlin and Silvio Schumacher: Exploring an
uncharted market: Evidence on the unsecured Swiss franc money market 2011-6 Pamela Hall: Is there any evidence of a Greenspan put? 2011-7 Daniel Kaufmann and Sarah Lein: Sectoral Inflation Dynamics, Idiosyncratic
Shocks and Monetary Policy 2011-8 Iva Cecchin: Mortgage Rate Pass-Through in Switzerland 2011-9 Raphael A. Auer, Kathrin Degen and Andreas M. Fischer: Low-Wage Import
Competition, Inflationary Pressure, and Industry Dynamics in Europe 2011-10 Raphael A. Auer and Philip Sauré: Spatial Competition in Quality, Demand-Induced
Innovation, and Schumpeterian Growth 2011-11 Massimiliano Caporin , Angelo Ranaldo and Paolo Santucci de Magistris: On the
Predictability of Stock Prices: a Case for High and Low Prices 2011-12 Jürg Mägerle and Thomas Nellen: Interoperability between central counterparties 2011-13 Sylvia Kaufmann: K-state switching models with endogenous transition
distributions 2011-14 Sébastien Kraenzlin and Benedikt von Scarpatetti: Bargaining Power in the Repo
Market 2012-01 Raphael A. Auer: Exchange Rate Pass-Through, Domestic Competition, and
Inflation: Evidence from the 2005/08 Revaluation of the Renminbi 2012-02 Signe Krogstrup, Samuel Reynard and Barbara Sutter: Liquidity Effects of
Quantitative Easing on Long-Term Interest Rates

49
2012-03 Matteo Bonato, Massimiliano Caporin and Angelo Ranaldo: Risk spillovers in international equity portfolios
2012-04 Thomas Nitschka: Banking sectors’ international interconnectedness: Implications
for consumption risk sharing in Europe 2012-05 Martin Brown, Steven Ongena and Pinar Yeşin: Information Asymmetry and
Foreign Currency Borrowing by Small Firms 2012-06 Philip Sauré and Hosny Zoabi: Retirement Age across Countries: The Role of
Occupations 2012-07 Christian Hott and Terhi Jokipii: Housing Bubbles and Interest Rates 2012-08 Romain Baeriswyl and Camille Cornand: Reducing overreaction to central bank’s
disclosures: theory and experiment 2012-09 Bo E. Honoré, Daniel Kaufmann and Sarah Lein: Asymmetries in Price-Setting
Behavior: New Microeconometric Evidence from Switzerland 2012-10 Thomas Nitschka: Global and country-specific business cycle risk in time-varying
excess returns on asset markets 2012-11 Raphael A. Auer, Thomas Chaney and Philip Sauré: Quality Pricing-to-Market 2012-12 Sébastien Kraenzlin and Thomas Nellen: Access policy and money market
segmentation 2012-13 Andreas Kropf and Philip Sauré: Fixed Costs per Shipment 2012-14 Raphael A. Auer and Raphael S. Schoenle: Market Structure and Exchange Rate
Pass-Through 2012-15 Raphael A. Auer: What Drives Target2 Balances? Evidence From a Panel Analysis 2012-16 Katja Drechsel and Rolf Scheufele: Bottom-up or Direct? Forecasting German GDP
in a Data-rich Environment 2013-01 Andreas Kettemann and Signe Krogstrup: Portfolio balance effects of the SNB’s
bond purchase program 2013-02 Nicole Aregger, Martin Brown and Enzo Rossi: Transaction Taxes, Capital Gains
Taxes and House Prices 2013-03 Simone Meier: Financial Globalization and Monetary Transmission

50
2013-04 Christian Grisse and Thomas Nitschka: On financial risk and the safe haven characteristics of Swiss franc exchange rates
2013-05 Matthias Gubler and Matthias S. Hertweck: Commodity Price Shocks and the
Business Cycle: Structural Evidence for the U.S.

Swiss National Bank Working Papers are also available at www.snb.ch, section Publications/ResearchSubscriptions or individual issues can be ordered at Swiss National Bank, Fraumünsterstrasse 8, CH-8022 Zurich, fax +41 44 631 81 14, E-mail [email protected]


