24
Supply Risk Management CIPS June 2011
Supply Risk Management
CIPS
June 2011

2A.T. Kearney 10/10.2007/27200d
This document is exclusively intended for selected participants of
the CIPS UAE User group, Dubai June 22nd, 2011
. Distribution, quotations and duplications – even in the form of
extracts – for third parties is only permitted upon prior written
consent of A.T. Kearney.
A.T. Kearney used the text and graphs compiled in this report
in a presentation; they do not represent
a complete documentation of the presentation.

3A.T. Kearney 39/10.2009/6190
Agenda
The supply risk challenge
A.T. Kearney’s approach to Supply Risk Management
A.T. Kearney’s Supply Risk Management experience
4A.T. Kearney 39/10.2009/6190
The supply risk challenge
5A.T. Kearney 39/10.2009/6190
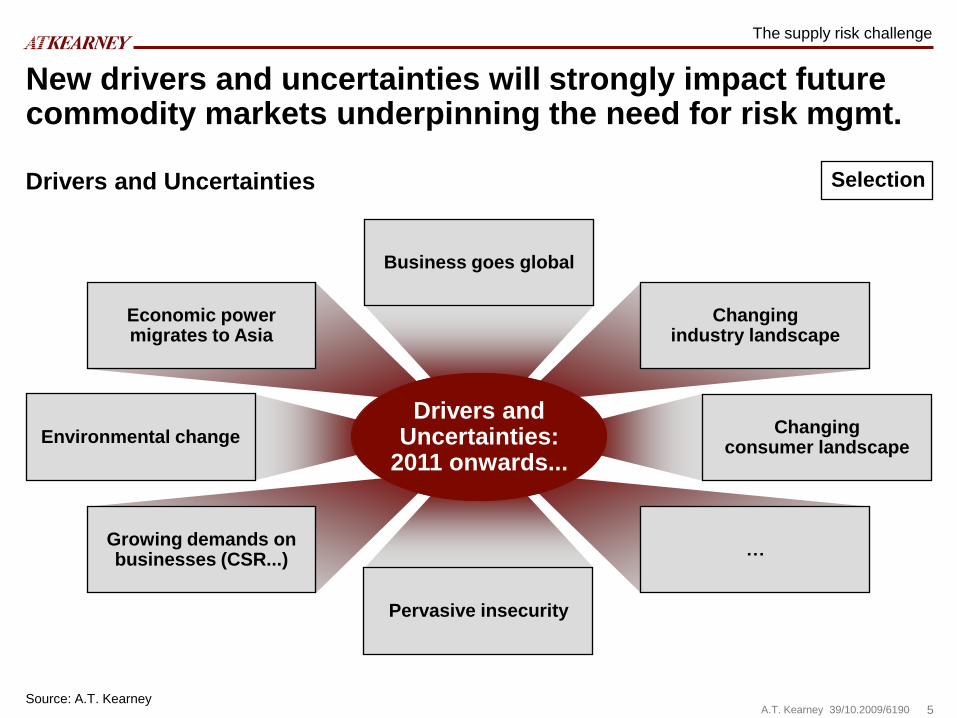
New drivers and uncertainties will strongly impact future commodity markets underpinning the need for risk mgmt.
Economic power migrates to Asia
Changing industry landscape
Business goes global
Changing consumer landscape
Environmental change
Drivers and Uncertainties:
2011 onwards...
Growing demands on businesses (CSR...)
…
Pervasive insecurity
Drivers and Uncertainties
Source: A.T. Kearney
Selection
The supply risk challenge

6A.T. Kearney 39/10.2009/6190
Especially price volatility has increased in the last years reaching in some periods very high levels
Commodity price evolution since January 2005
0
50
100
150
200
250
300
350
400
Iron ore
Pig iron
Rice
Coal
Oil
2011201020092008200720062005
Source: Bloomberg, A.T. Kearney
The supply risk challenge
7A.T. Kearney 39/10.2009/6190
Source: A.T. Kearney
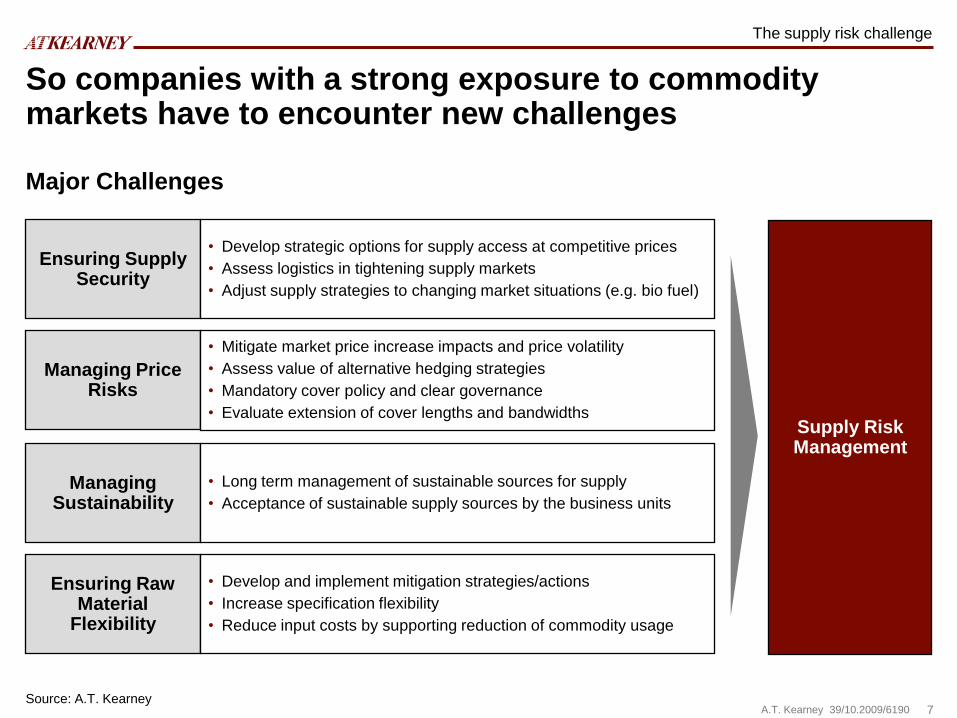
So companies with a strong exposure to commodity markets have to encounter new challenges
Managing Price Risks
Managing Sustainability
Ensuring Raw Material
Flexibility
Ensuring Supply Security
• Develop strategic options for supply access at competitive prices
• Assess logistics in tightening supply markets
• Adjust supply strategies to changing market situations (e.g. bio fuel)
• Develop and implement mitigation strategies/actions
• Increase specification flexibility
• Reduce input costs by supporting reduction of commodity usage
• Mitigate market price increase impacts and price volatility
• Assess value of alternative hedging strategies
• Mandatory cover policy and clear governance
• Evaluate extension of cover lengths and bandwidths
• Long term management of sustainable sources for supply
• Acceptance of sustainable supply sources by the business units
Major Challenges
The supply risk challenge
Supply Risk Management
Source: A.T. Kearney

8A.T. Kearney 39/10.2009/6190
Nevertheless executives are not sufficiently prepared for meeting this challenges by putting SRM at the top of their agenda
The supply risk challenge
Source: A.T. Kearney Supply Risk Management Study (Europe)
Performance of own Supply Risk Management
– in % of responding companies –
Introduction/Improvement plans with regard to
Supply Risk Management
– in % of responding companies –
Introduction Improvement
7
44
39
5 5
Very
strong
Strong Moderate Weak Very
weak
8
0 0
3532
1114
Today Next
Year
Within the
next three
years
Not
planned
9A.T. Kearney 39/10.2009/6190
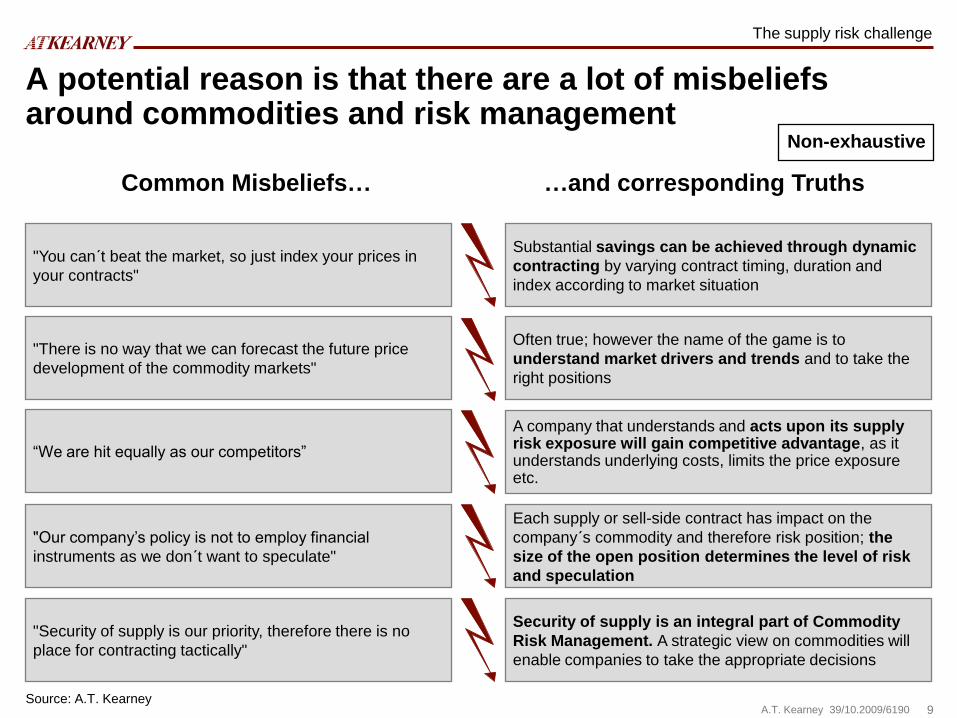
A potential reason is that there are a lot of misbeliefs around commodities and risk management
Common Misbeliefs… …and corresponding Truths
Substantial savings can be achieved through dynamic
contracting by varying contract timing, duration and
index according to market situation
"You can´t beat the market, so just index your prices in
your contracts"
Often true; however the name of the game is to
understand market drivers and trends and to take the
right positions
"There is no way that we can forecast the future price
development of the commodity markets"
“We are hit equally as our competitors”
Each supply or sell-side contract has impact on the
company´s commodity and therefore risk position; the
size of the open position determines the level of risk
and speculation
"Our company’s policy is not to employ financial
instruments as we don´t want to speculate"
Security of supply is an integral part of Commodity
Risk Management. A strategic view on commodities will
enable companies to take the appropriate decisions
"Security of supply is our priority, therefore there is no
place for contracting tactically"
A company that understands and acts upon its supply risk exposure will gain competitive advantage, as it understands underlying costs, limits the price exposure etc.
The supply risk challenge
Non-exhaustive
Source: A.T. Kearney

10A.T. Kearney 39/10.2009/6190
A.T. Kearney’s approach to Supply Risk Management
11A.T. Kearney 39/10.2009/6190
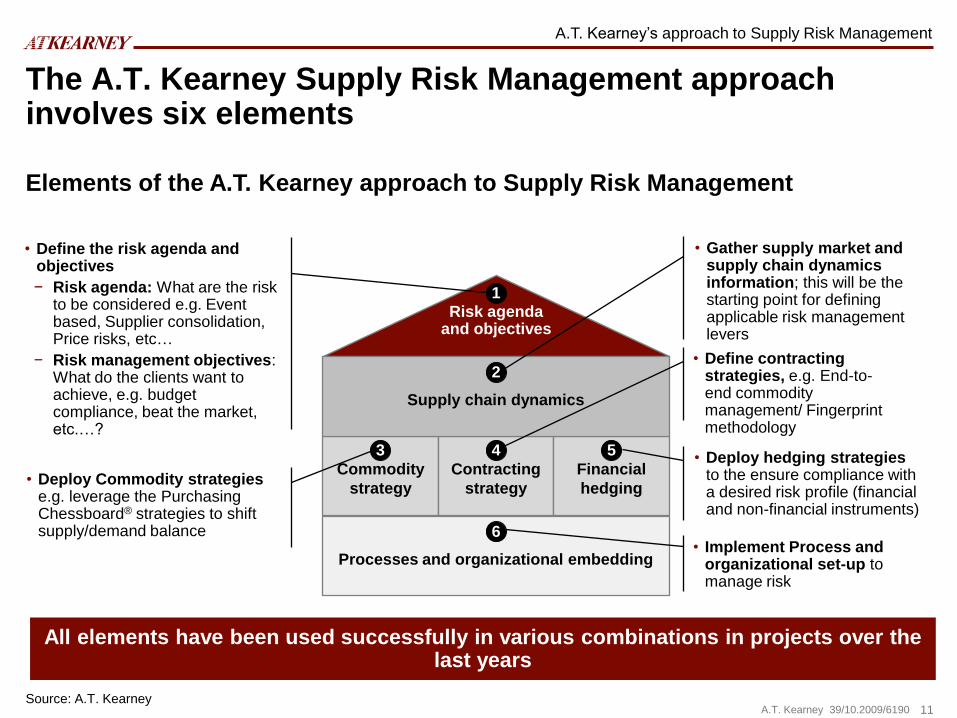
The A.T. Kearney Supply Risk Management approach involves six elements
Elements of the A.T. Kearney approach to Supply Risk Management
Source: A.T. Kearney
A.T. Kearney’s approach to Supply Risk Management
Risk agenda and objectives
Processes and organizational embedding
Commodity
strategy
Contracting
strategy
Financial
hedging
Supply chain dynamics
3 4 5
6
2
1
• Deploy hedging strategies to the ensure compliance with a desired risk profile (financial and non-financial instruments)
• Implement Process and organizational set-up to manage risk
• Deploy Commodity strategies e.g. leverage the Purchasing Chessboard® strategies to shift supply/demand balance
• Define the risk agenda and objectives
− Risk agenda: What are the risk to be considered e.g. Event based, Supplier consolidation, Price risks, etc…
− Risk management objectives: What do the clients want to achieve, e.g. budget compliance, beat the market, etc.…?
• Define contracting strategies, e.g. End-to-end commodity management/ Fingerprint methodology
• Gather supply market and supply chain dynamics information; this will be the starting point for defining applicable risk management levers
All elements have been used successfully in various combinations in projects over the last years
12A.T. Kearney 39/10.2009/6190
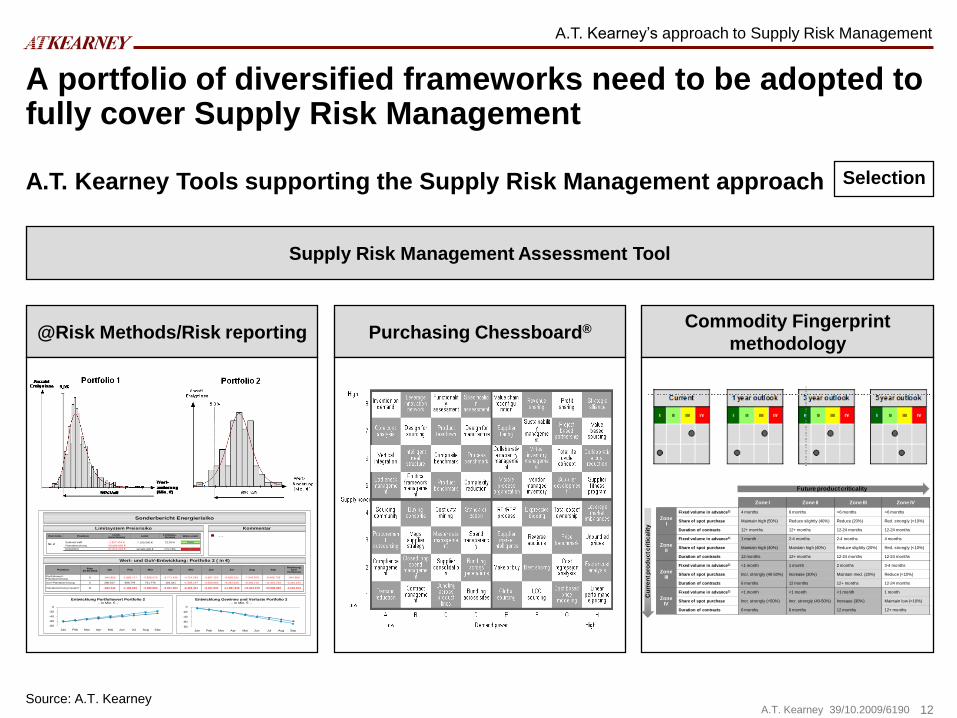
A portfolio of diversified frameworks need to be adopted to fully cover Supply Risk Management
Source: A.T. Kearney
A.T. Kearney Tools supporting the Supply Risk Management approach
A.T. Kearney’s approach to Supply Risk Management
@Risk Methods/Risk reporting Purchasing Chessboard® Commodity Fingerprint
methodology
Supply Risk Management Assessment Tool
Zone I Zone II Zone III Zone IV
Zone I
Fixed volume in advance1) 4 months 6 months >6 months >6 months
Share of spot purchase Maintain high (50%) Reduce slightly (40%) Reduce (20%) Red. strongly (<10%)
Duration of contracts 12+ months 12+ months 12-24 months 12-24 months
Zone II
Fixed volume in advance1) 1 month 2-4 months 2-4 months 4 months
Share of spot purchase Maintain high (40%) Maintain high (40%) Reduce slightly (20%) Red. strongly (<10%)
Duration of contracts 12 months 12+ months 12-24 months 12-24 months
Zone III
Fixed volume in advance1) <1 month 1 month 2 months 3-4 months
Share of spot purchase Incr. strongly (40-50%) Increase (30%) Maintain med. (20%) Reduce (<10%)
Duration of contracts 6 months 12 months 12+ months 12-24 months
Zone IV
Fixed volume in advance1) <1 month <1 month <1 month 1 month
Share of spot purchase Incr. strongly (>50%) Incr. strongly (40-50%) Increase (30%) Maintain low (<10%)
Duration of contracts 6 months 6 months 12 months 12+ months
Cu
rre
nt p
rod
uc
t c
riti
ca
lity
Future product criticality
Sonderbericht Sonderbericht EnergierisikoEnergierisiko
Entwicklung Portfoliowert Portfolio 2– in Mio. € –
Entwicklung Gewinne und Verluste Portfolio 2– in Mio. € –
…
KommentarKommentarLimitsystem PreisrisikoLimitsystem Preisrisiko
WertWert-- und und GuVGuV--EntwicklungEntwicklung: Portfolio : Portfolio 22 ( in ( in €€))
RotRot175,73%12.300.000 €-21.614.416 €Risikolimit
---20.086.992 €Planabweichung
GrGrüünn21,51%7.100.000 €-1.527.424 €Sublimit VaRNr. 2
Warn-stufeLimitaus-lastung
LimitLimit-
anrechnungPositionPort-folio
RotRot175,73%12.300.000 €-21.614.416 €Risikolimit
---20.086.992 €Planabweichung
GrGrüünn21,51%7.100.000 €-1.527.424 €Sublimit VaRNr. 2
Warn-stufeLimitaus-lastung
LimitLimit-
anrechnungPositionPort-folio
-80
-60
-40
-20
0
Jan Feb Mar Apr Mai Jun Jul Aug Sep
-80
-60
-40
-20
0
Jan Feb Mar Apr Mai Jun Jul Aug Sep
-4.244.013 -20.086.992 -15.842.979 -11.887.826 -9.187.835 -6.302.461 -3.667.094 -2.086.800 -1.186.939 -662.342 0 Planabweichung Gesamt
-3.301.154 -11.601.264 -8.300.110 -5.287.815 -3.530.683 -1.588.167 104.341 741.776 698.779 280.517 0 GuV-Planabweichung
-942.859 -8.485.728 -7.542.870 -6.600.011 -5.657.152 -4.714.293 -3.771.435 -2.828.576 -1.885.717 -942.859 0 Portfoliowert-Planabweichung
Änderung zum
VormonatSepAugJulJunMaiAprMärFebJan
Plan 30.09.2004
Position
Selection
13A.T. Kearney 39/10.2009/6190
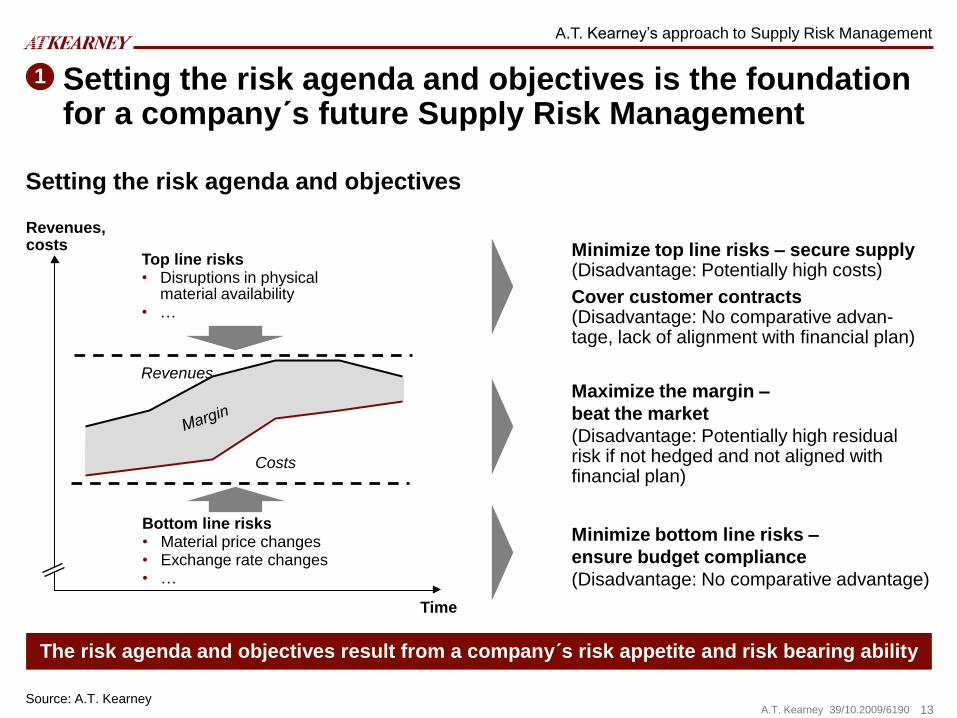
Setting the risk agenda and objectives is the foundation for a company´s future Supply Risk Management
Setting the risk agenda and objectives
Minimize top line risks – secure supply(Disadvantage: Potentially high costs)
Cover customer contracts(Disadvantage: No comparative advan-tage, lack of alignment with financial plan)
Minimize bottom line risks –
ensure budget compliance
(Disadvantage: No comparative advantage)
Maximize the margin –
beat the market
(Disadvantage: Potentially high residual risk if not hedged and not aligned with financial plan)
Revenues
Costs
Top line risks• Disruptions in physical
material availability• …
Bottom line risks• Material price changes• Exchange rate changes• …
Revenues,costs
Time
1
Source: A.T. Kearney
The risk agenda and objectives result from a company´s risk appetite and risk bearing ability
A.T. Kearney’s approach to Supply Risk Management

14A.T. Kearney 39/10.2009/6190
800
600
400
200
1,400
1,200
1,000
0
Iron ore
Coking coal
Scrap
Alloys
Opex
Capex
SG&A
Historical price and cost relationship
Understanding supply chain dynamics will be key for deriving the right risk and hence commodity strategy
Market transparency framework: Example steel
Jan. 09Jan. 04
Steel price
How will the input factors develop?
How will the supply-demand balance change?
Gray: Negative marginSource: A.T. Kearney
DemandSupply
Supply-
demand driven
Input factor
driven
Margin
Client example
2
A.T. Kearney’s approach to Supply Risk Management

15A.T. Kearney 39/10.2009/6190
• Board level stage setting:
Breaking new ground by using
differentiated strategies
• Supply management
direction setting:
Mastering 64 deep-dive
approaches to carry through the
implementation
• Functional leaders role
setting:
Defining a common language to
set the business case and
mobilize the organization
To achieve substantial savings in volatile markets we use a diversified portfolio of sourcing approaches
Supply power:
• Number of credible suppliers
• Suppliers market share
• M&A dynamics
• Entry barriers
• Ease of substituting supplier
• Availability of products
Demand power:
• Your share of demand
• Growth offered to suppliers
• Opportunities for suppliers
to develop competencies
Demand and supply power A.T. Kearney proprietary
Purchasing Chessboard®
Internal communication
3
A.T. Kearney’s approach to Supply Risk Management

16A.T. Kearney 39/10.2009/6190
The Purchasing Chessboard® can be leveraged to manage risk, e.g. by shifting demand/supply power
Low
High
Supply power
8
7
6
5
4
3
2
1
Invention on demand
Core cost analysis
Bottleneck manageme
nt
Sourcing community
Procurement
outsourcing
Compliance manageme
nt
Leverage innovation
network
Political framework manageme
nt
Buying consortia
Mega supplier strategy
Closed loop spend
management
Functionality
assessment
Composite benchmark
Product benchmark
Cost data mining
Master data manageme
nt
Supplier consolidatio
n
Specification
assessment
Design for manufacture
Process benchmark
Complexity reduction
Standardi-zation
Spend transparenc
y
Bundling across
generations
Value chain reconfigu-
ration
Supplier tiering
Collaborative capacity manageme
nt
Visible process
organization
RFI/RFP process
Supplier market
intelligence
Make or buy
Revenue sharing
Sustainability
management
Virtual inventory
management
Vendor managed inventory
Expressive bidding
Reverse auctions
Best shoring
Profit sharing
Project based
partnership
Total life cycle
concept
Supplier developmen
t
Total cost of ownership
Price benchmark
Cost regression analysis
Strategic alliance
Value based
sourcing
Collaborative cost
reduction
Supplier fitness
program
Leverage market
imbalances
Unbundled prices
Factor cost analysis
Demand reduction
Contract manageme
nt
Bundling across product
lines
Bundling across sites
Global sourcing
LCC sourcing
Cost based price
modeling
Linear performanc
e pricing
Low HighDemand power
A B C D E F G H
Intelligent deal
structure
Vertical integration
Product teardown
Design for sourcing
Potential A.T. Kearney Purchasing Chessboard® strategies (examples)
3
Intelligent deal structure
• Adopt deal structures on
both supply and customer
sides to desire risk exposure
• Results in decreased overall
risk exposure
Design for Sourcing
• Increase demand flexibility,
e.g. from developing multiple
formulas
• Results in improved pricing
power and security of supply
Vertical integration
• Integrate vertically either
through acquiring assets or
virtually through e.g. hedging
• Results in overall decreased
risk exposure and increased
security of supply
A.T. Kearney’s approach to Supply Risk Management
Source: A.T. Kearney
17A.T. Kearney 39/10.2009/6190
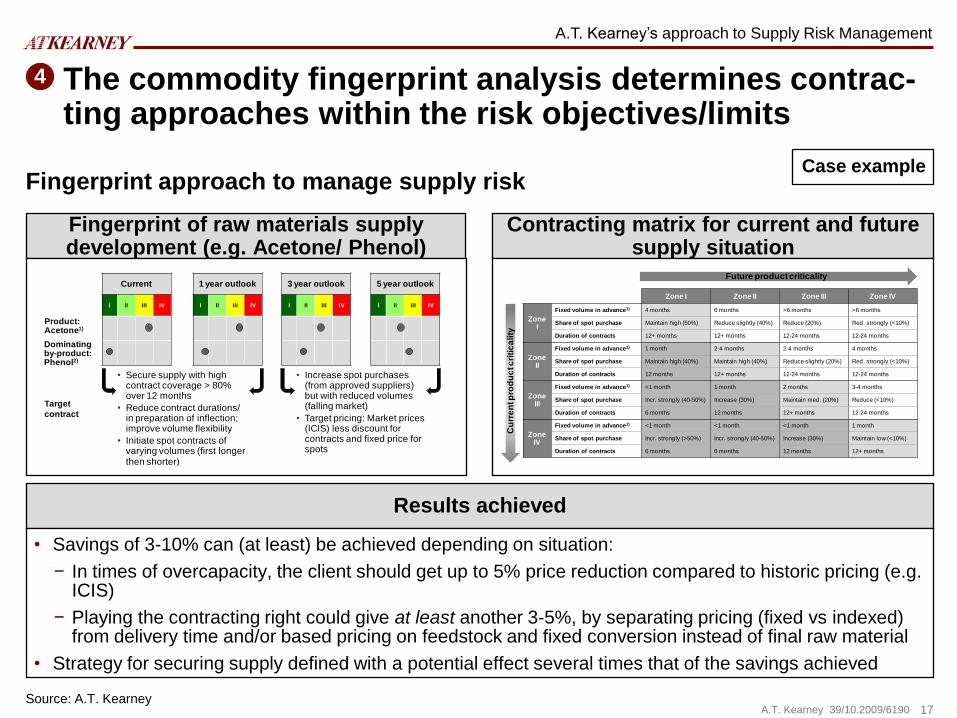
The commodity fingerprint analysis determines contrac-ting approaches within the risk objectives/limits
4
Results achieved
• Savings of 3-10% can (at least) be achieved depending on situation:
− In times of overcapacity, the client should get up to 5% price reduction compared to historic pricing (e.g. ICIS)
− Playing the contracting right could give at least another 3-5%, by separating pricing (fixed vs indexed) from delivery time and/or based pricing on feedstock and fixed conversion instead of final raw material
• Strategy for securing supply defined with a potential effect several times that of the savings achieved
Fingerprint of raw materials supply development (e.g. Acetone/ Phenol)
Contracting matrix for current and future supply situation
Current
I II III IV
1 year outlook
I II III IV
3 year outlook
I II III IV
5 year outlook
I II III IV
Dominating by-product:Phenol2)
Product:Acetone1)
Target
contract
• Secure supply with high contract coverage > 80% over 12 months
• Reduce contract durations/in preparation of inflection; improve volume flexibility
• Initiate spot contracts of varying volumes (first longer then shorter)
• Increase spot purchases (from approved suppliers) but with reduced volumes (falling market)
• Target pricing: Market prices (ICIS) less discount for contracts and fixed price for spots
Zone I Zone II Zone III Zone IV
Zone I
Fixed volume in advance1) 4 months 6 months >6 months >6 months
Share of spot purchase Maintain high (50%) Reduce slightly (40%) Reduce (20%) Red. strongly (<10%)
Duration of contracts 12+ months 12+ months 12-24 months 12-24 months
Zone II
Fixed volume in advance1) 1 month 2-4 months 2-4 months 4 months
Share of spot purchase Maintain high (40%) Maintain high (40%) Reduce slightly (20%) Red. strongly (<10%)
Duration of contracts 12 months 12+ months 12-24 months 12-24 months
Zone III
Fixed volume in advance1) <1 month 1 month 2 months 3-4 months
Share of spot purchase Incr. strongly (40-50%) Increase (30%) Maintain med. (20%) Reduce (<10%)
Duration of contracts 6 months 12 months 12+ months 12-24 months
Zone IV
Fixed volume in advance1) <1 month <1 month <1 month 1 month
Share of spot purchase Incr. strongly (>50%) Incr. strongly (40-50%) Increase (30%) Maintain low (<10%)
Duration of contracts 6 months 6 months 12 months 12+ months
Cu
rre
nt p
rod
uc
t c
riti
ca
lity
Future product criticality
Case example
A.T. Kearney’s approach to Supply Risk Management
Source: A.T. Kearney
Fingerprint approach to manage supply risk
18A.T. Kearney 39/10.2009/6190
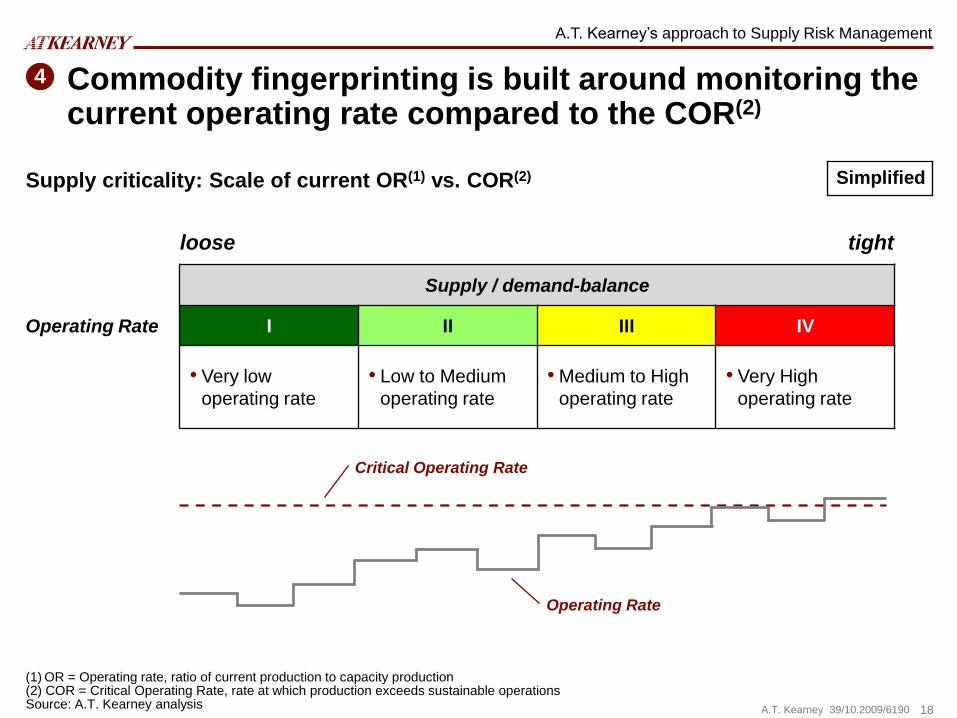
Supply / demand-balance
I II III IV
• Very low
operating rate
• Low to Medium
operating rate
• Medium to High
operating rate
• Very High
operating rate
Commodity fingerprinting is built around monitoring the current operating rate compared to the COR(2)
Simplified
tightloose
(1) OR = Operating rate, ratio of current production to capacity production(2) COR = Critical Operating Rate, rate at which production exceeds sustainable operationsSource: A.T. Kearney analysis
Critical Operating Rate
Operating Rate
Supply criticality: Scale of current OR(1) vs. COR(2)
Operating Rate
4
A.T. Kearney’s approach to Supply Risk Management

19A.T. Kearney 39/10.2009/6190
Supply/demand
balance
I II III IV
Commodity fingerprinting is used to systematically develop dynamic contracting strategies
Simplified
Getting “short”
Source: A.T. Kearney
tightloose
Getting “long”
Contracting Strategies
Contract
lengthShare of spot Order volume
Breakout: Intelligent Deal Structure
Staying “long”
Staying “short”
Supply criticality: Inflection points for one chemical
Operating Rate
Secure supply
Price advantage
Price advantage
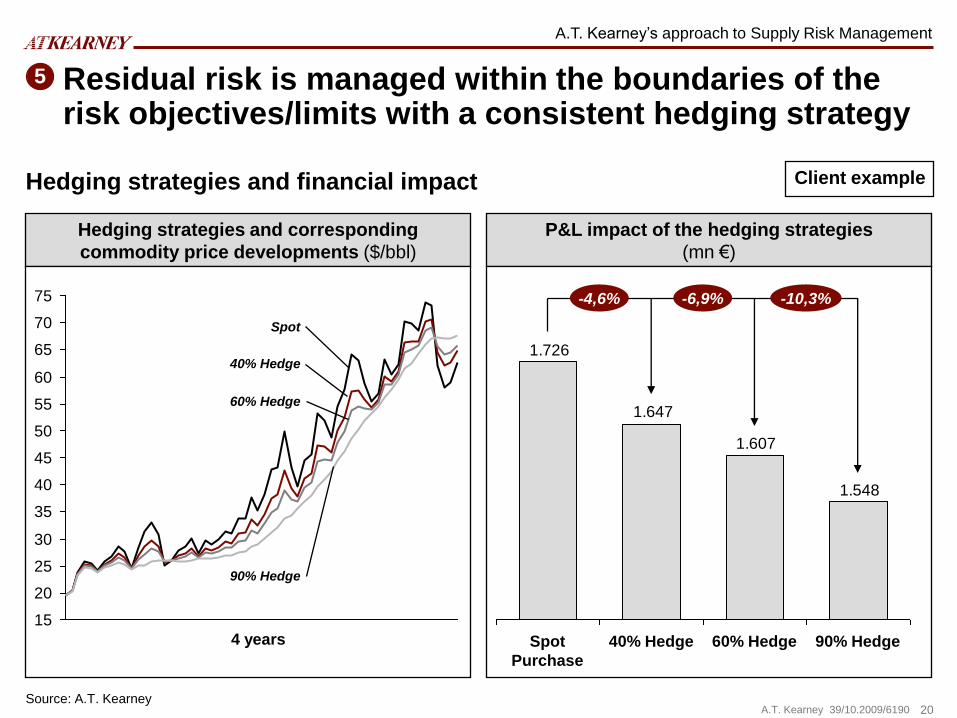
20A.T. Kearney 39/10.2009/6190
Residual risk is managed within the boundaries of the risk objectives/limits with a consistent hedging strategy
Hedging strategies and financial impact
Source: A.T. Kearney
5
Client example
Hedging strategies and corresponding
commodity price developments ($/bbl)
P&L impact of the hedging strategies
(mn €)
1.548
1.607
1.647
1.726
-6,9% -10,3%-4,6%
90% Hedge60% Hedge40% HedgeSpot
Purchase
15
20
25
30
35
40
45
50
55
60
65
70
75
Spot
40% Hedge
60% Hedge
90% Hedge
4 years
A.T. Kearney’s approach to Supply Risk Management
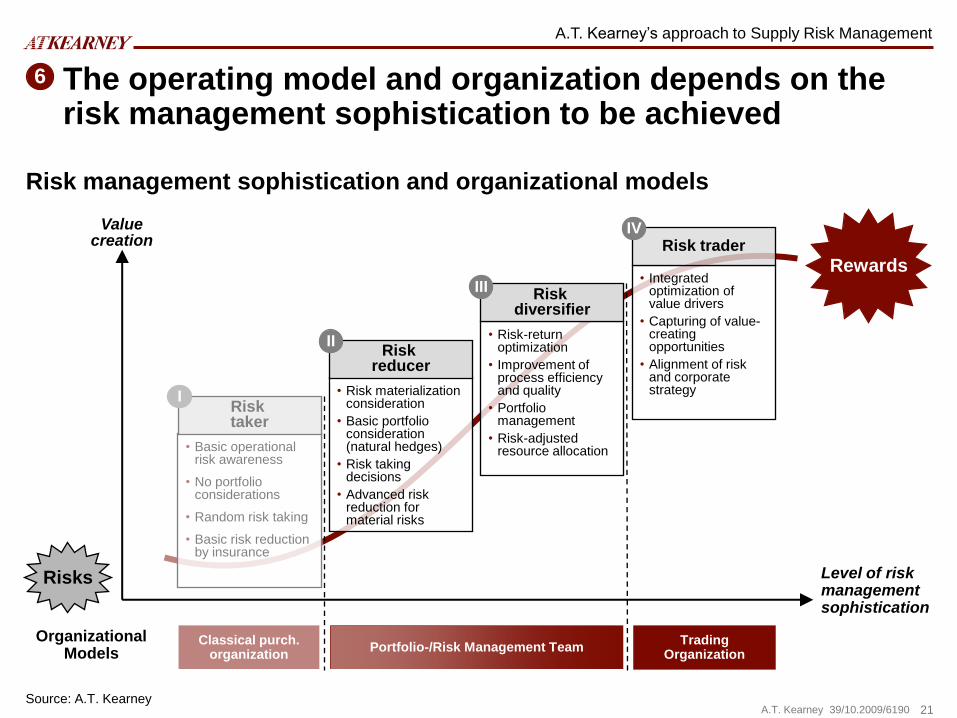
21A.T. Kearney 39/10.2009/6190
The operating model and organization depends on the risk management sophistication to be achieved
Risk management sophistication and organizational models
• Risk-return optimization
• Improvement of process efficiency and quality
• Portfolio management
• Risk-adjusted resource allocation
Risk diversifier
Rewards
Risks
• Integrated optimization of value drivers
• Capturing of value-creating opportunities
• Alignment of risk and corporate strategy
Risk trader
• Risk materialization consideration
• Basic portfolio consideration (natural hedges)
• Risk taking decisions
• Advanced risk reduction for material risks
Risk reducer
• Basic operational risk awareness
• No portfolio considerations
• Random risk taking
• Basic risk reduction by insurance
Risk taker
I
II
III
IV
Level of risk management sophistication
Valuecreation
Portfolio-/Risk Management TeamTrading
OrganizationClassical purch.
organization
OrganizationalModels
6
Source: A.T. Kearney
A.T. Kearney’s approach to Supply Risk Management

22A.T. Kearney 39/10.2009/6190
However harvesting the benefits of improved Supply Risk Management is challenging
Requires a different mind-set (Change management required)
Requires new organizational structures/initiatives
Requires new data and approaches/systems
Requires strategic commitment of top management
But…..
Source: A.T. Kearney
Requirements and benefits of state-of-the art Supply Risk Management
…delivers competitive advantages and positive P/L impact between 3-10%p. a. of purchasing value and in addition risk oversight for the company
A.T. Kearney’s approach to Supply Risk Management
23A.T. Kearney 39/10.2009/6190
A.T. Kearney Risk Management experience

24A.T. Kearney 39/10.2009/6190
Global pharmaceutical player Global automotive player Global industrial player
Situation • Historically limited focus on costs; main focus on secure trustworthy and reliable supply of chemicals and solvents
• Supplier pricing: mostly multi-year contracts linked to index
• Highly exposed to volatile Aluminum LME prices as supplier only offer max 5% reduction on LME spot prices
• Hedging in place; however volume not fully covered
• Client Purchase organization faced significant price increases on commodities with 2-4% bottom line effect
• No transparency of raw material price developments cost effect
Approach • Commodity Fingerprint analysis, analyzing the commodities’ supply/demand balance situation across the value chain
• Purchasing Chessboard®strategies for relevant categories
• Understand overall Group demand and market dynamics
• Generate new ideas to improve sourcing practices
• Process and model to understand client’s commodity exposure were develop
• Market forecast reports structure developed and reliable sources defined
Results • 3–10% benefits compared to original situation from Commodity fingerprint
• Securing of supply for critical chemicals limiting a significant potential negative effect on almost all operations – R&D, final testing, etc.
• New pricing strategies defined with lower volatility than LME:
− Index based prices formula linked to input factor, e.g. alumina
− Long-term fixed contracts on e.g. conversion costs part
• Project started to improve risk management and hedging policy
• Implementation of new process and set-up for managing commodity market development
• Proactively raise prices to mitigate for raw material development: 2-4% profit effect
• Transfer to Global responsible at the Client’s Global Service Center
Areas
Recent projects have delivered significant financial and non-financial results to our clients
Selected case examples
1 2 3 1 2 4 61 2 3 5
A.T. Kearney’s risk management experience
Source: A.T. Kearney
4


