COMMON ENTRANCE SURVEY RESULTS: TEACHER EDUCATION STUDENTS PURSUING MATHEMATICS ENTERING IN 2012-2013 OCTOBER 2012 The Common Entrance Survey was administered to all incoming students enrolled in the University of Connecticut’s Neag School of Education’s teacher preparation program in the fall of the 2012-13 school year. This report presents results of this survey for 17 respondents pursuing a concentration in Mathematics Education in either the Integrated Bachelors/Masters (IB/M) Program or the Teacher Certification Program for College Graduates (TCPCG). The first half of this report includes results for the 8 students from the IB/M program (47.1%), and the second half contains results for the remaining 9 students (52.9%) from TCPCG. Within the sample, 6 students (62.5%) identified themselves as male, and 12 respondents (70.1%) reported being White/Caucasian. All 17 respondents (100%) indicated that they had attended a public high school. Of these, the majority (82.4%) reported that their high school was in a suburban area. Of the students who reported on their high school’s ethnic composition, half (50.0%) indicated the student body was made up of primarily white students, and half (50%) reported the student body was a mixture of white and non-white students. Results suggest that 52.9% of respondents’ mothers and 52.9% of fathers attained an education level of college completion or beyond. With regard to educating English Language Learners (ELLs), IB/M students were reported feeling that most confident in making a difference in the lives of my students (M = 4.0) and providing a positive learning environment and create a climate characterized by high expectations (M = 4.0); TCPCG students also reported feeling most confident about making a difference in the lives of my students (M = 4.4). This report also includes information regarding respondents’ experiences working with English Language Learners (ELLs) and students with disabilities, as well as their confidence with assessment practices and their knowledge of the Common Core State Standards (CCSS). In addition, qualitative data are presented in this report. A thematic analysis of students’ responses to one open-ended question was conducted: “Aside from getting a teaching job, what do you feel will be your most important achievements and/or accomplishments in the Teacher Education Program at the Neag School?” A total of 12 common themes emerged from students in the mathematics field. Overall, the goals most often cited by these respondents involved becoming successful teachers, learning to assess and differentiate instruction, and having a positive impact on students’ lives. The following table further elaborates on all 12 themes in order of popularity among mathematics education students.
Transcript
COMMON ENTRANCE SURVEY RESULTS:
TEACHER EDUCATION STUDENTS PURSUING MATHEMATICS ENTERING IN 2012-2013
OCTOBER 2012
The Common Entrance Survey was administered to all incoming students enrolled in the University of Connecticut’s Neag School of Education’s teacher preparation program in the fall of the 2012-13 school year. This report presents results of this survey for 17 respondents pursuing a concentration in Mathematics Education in either the Integrated Bachelors/Masters (IB/M) Program or the Teacher Certification Program for College Graduates (TCPCG). The first half of this report includes results for the 8 students from the IB/M program (47.1%), and the second half contains results for the remaining 9 students (52.9%) from TCPCG. Within the sample, 6 students (62.5%) identified themselves as male, and 12 respondents (70.1%) reported being White/Caucasian. All 17 respondents (100%) indicated that they had attended a public high school. Of these, the majority (82.4%) reported that their high school was in a
suburban area. Of the students who reported on their high school’s ethnic composition, half (50.0%) indicated the student body was made up of primarily white students,
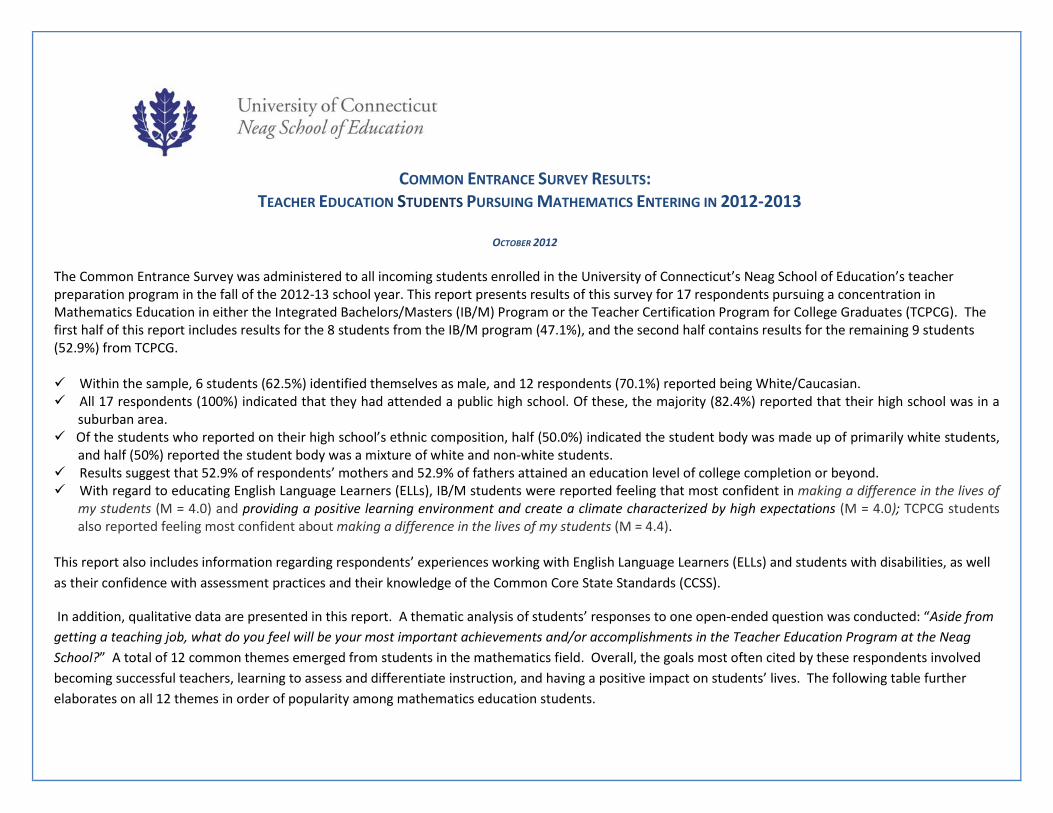
and half (50%) reported the student body was a mixture of white and non-white students. Results suggest that 52.9% of respondents’ mothers and 52.9% of fathers attained an education level of college completion or beyond. With regard to educating English Language Learners (ELLs), IB/M students were reported feeling that most confident in making a difference in the lives of
my students (M = 4.0) and providing a positive learning environment and create a climate characterized by high expectations (M = 4.0); TCPCG students also reported feeling most confident about making a difference in the lives of my students (M = 4.4).
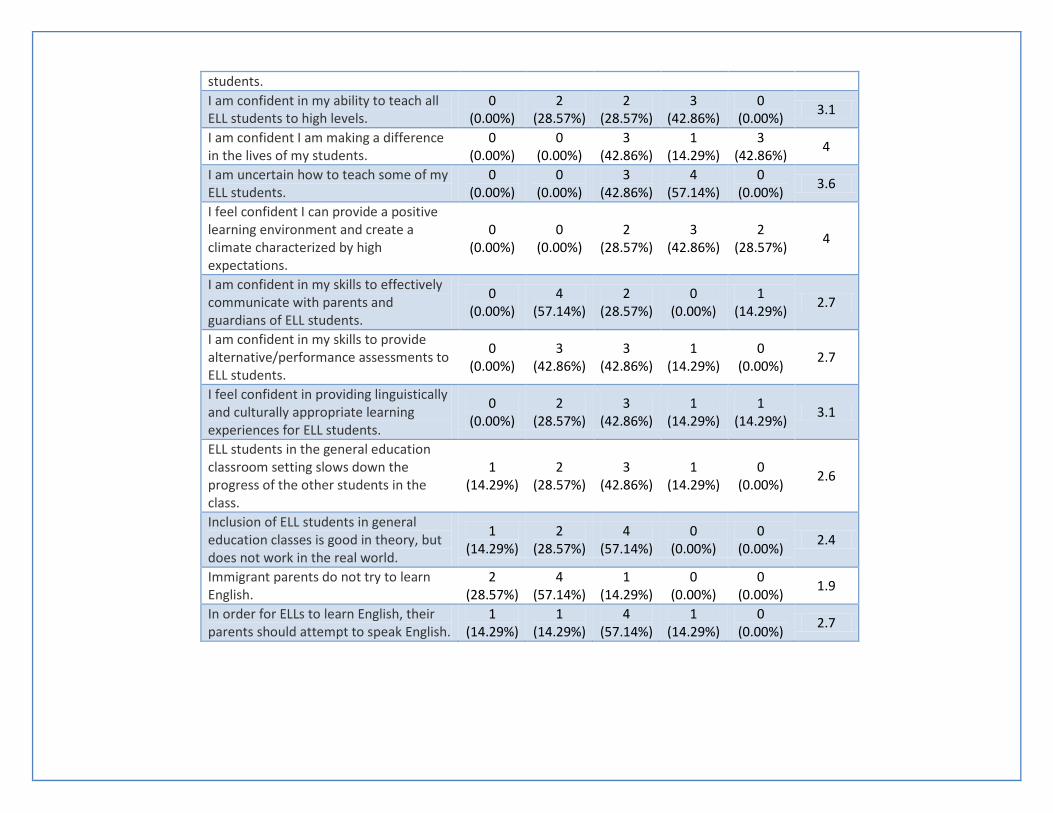
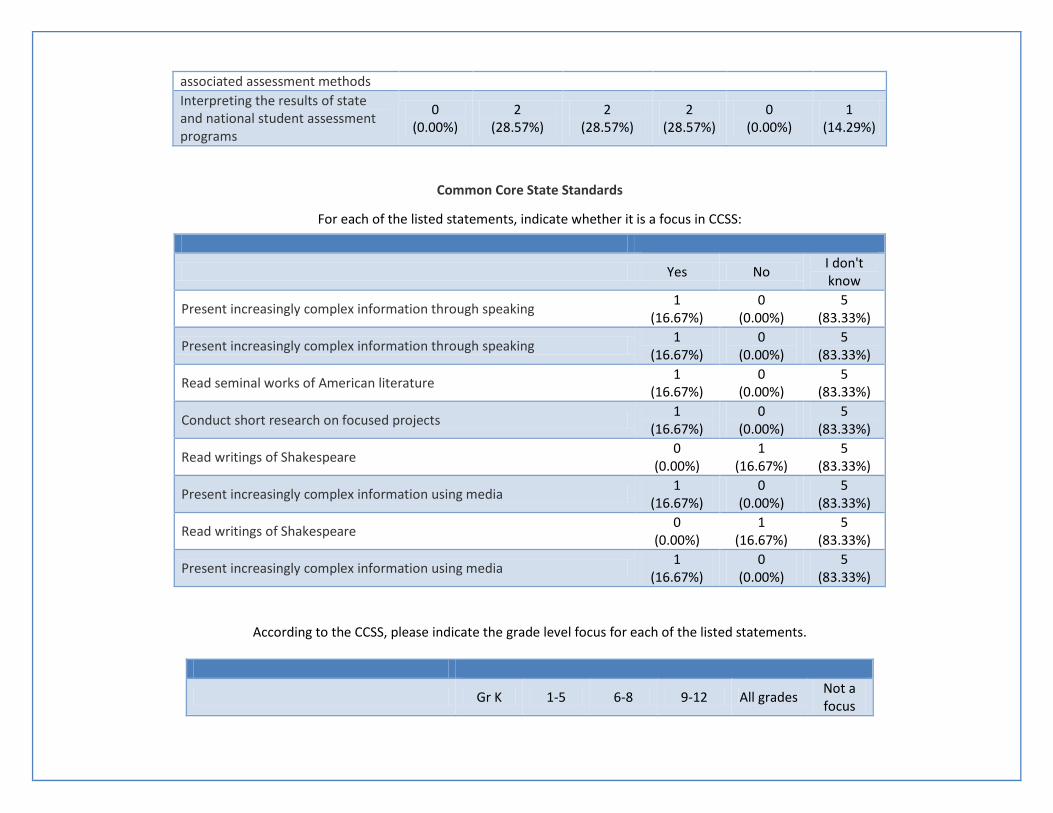
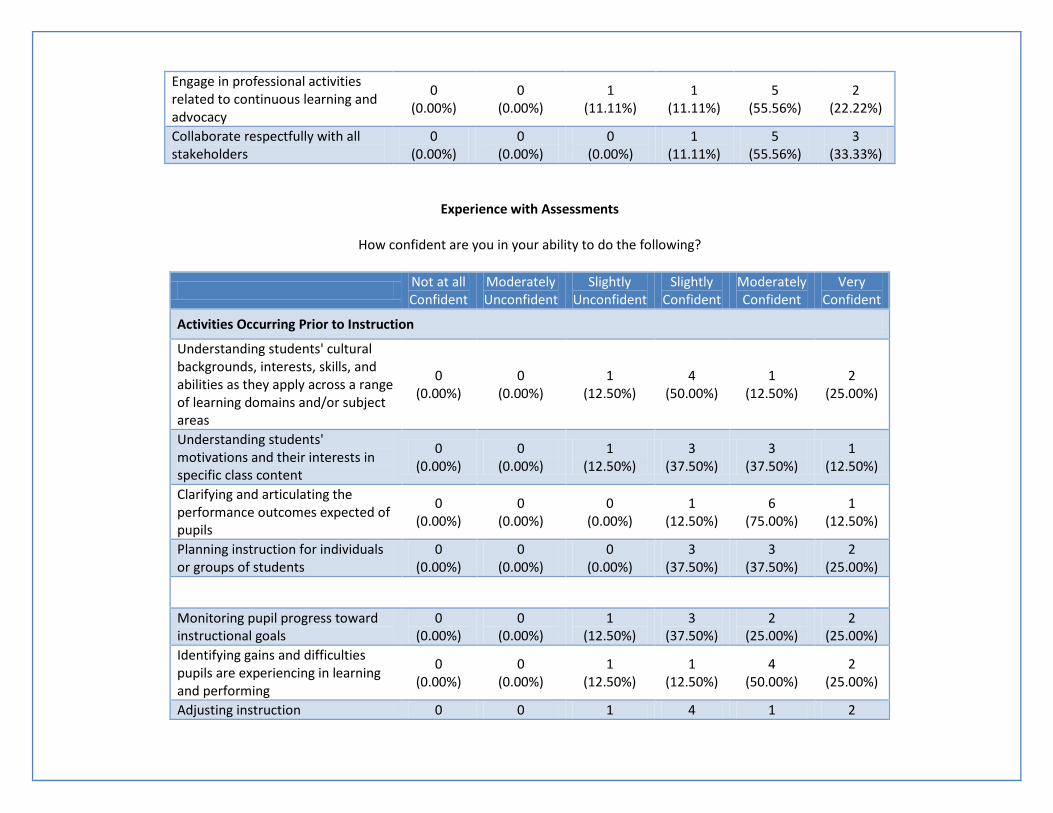
This report also includes information regarding respondents’ experiences working with English Language Learners (ELLs) and students with disabilities, as well as their confidence with assessment practices and their knowledge of the Common Core State Standards (CCSS).
In addition, qualitative data are presented in this report. A thematic analysis of students’ responses to one open-ended question was conducted: “Aside from getting a teaching job, what do you feel will be your most important achievements and/or accomplishments in the Teacher Education Program at the Neag School?” A total of 12 common themes emerged from students in the mathematics field. Overall, the goals most often cited by these respondents involved becoming successful teachers, learning to assess and differentiate instruction, and having a positive impact on students’ lives. The following table further elaborates on all 12 themes in order of popularity among mathematics education students.
Aside from getting a teaching job, what do you feel will be your most important achievements and/or accomplishments in the Teacher
Education Program at the Neag School?
Theme Definition # % Example
Successful teacher Participant hopes to become a successful teacher.
6/17 23.08% “The Education Program at the Neag School was a great opportunity to acquire the necessary skills and knowledge to be a successful teacher.”
Assessment & differentiation
Participant hopes to assess the needs of students and differentiate instruction.
3/17 11.54% “I think that the most important accomplishment that I will gain from the program is the ability to more easily assess the needs of others.”
Positive impact Have a positive impact on his/her students' lives
2/17 7.69% “Feeling confident in myself that I can go into a classroom and teach what I need to in a way that will make a difference in a student's life.”
Theory to classroom Apply educational theory within his/her classroom
2/17 7.69% “I will have gained knowledge of teaching pedagogy that will help me tremendously throughout my teaching career.”
Content area knowledge
Participant hopes to have a strong understanding of his/her content area (eg., math, science, Spanish).
2/17 7.69% “The most important achievement in the TCPCG at the Neag School is to prepare us all the knowledge needed to attend educational settings in a short amount of time.”
Completing program
Complete the teacher education program including student teaching and inquiry project
2/17 7.69% “I feel that my most important achievement in the Neag School of Education will be succeeding in my student teacher position.”
Teacher identity Create identity as a teacher 1/17 3.85% “Feeling confident in myself that I can go into a classroom and teach what I need to in
a way that will make a difference in a student's life.”
Helping students overcome struggles
Help future students overcome personal and academic struggles
1/17 3.85% “Learning how to effectively help students, whether it be in the academic subject they are studying or with any problem they have.”
Educational politics
"Gaining an understanding of the education system in America."
1/17 3.85% “Gaining an understanding of the education system in America.”
Challenging myself Challenge his or herself and take risks with teaching
1/17 3.85% “I hope to push and challenge both my students and myself.”
Effective lesson planning Learn how to effectively lesson plan 1/17 3.85%
“I think that the most important achievement/accomplishment in the UCONN TCPCG program will be the knowledge I gain about planning, instructing, and assessing students.”
Cultural awareness
Participant hopes to promote cultural awareness with students.
1/17 3.85% “So, what would I take away from this if I don't get hired? I would have to say a deeper respect and appreciation for the profession of teaching.”
No response Participant did not respond 3/17 11.54%
Appendix A: Integrated Bachelor’s/Master’s Teacher Education Program (IB/M)
Gender:
Answer Count Percent Female 2 25.00% Male 6 75.00%
Race/ethnicity:
Answer Count Percent Hispanic America 1 14.29% White/Caucasian 6 85.71%
Primary language spoken in your childhood home:
Answer Count Percent English 6 85.71% Spanish 1 14.29%
Can you speak any language other than English?
Answer Count Percent No 1 14.29% Yes 6 85.71%
Highest level of education attained by your mother:
Answer Count Percent Completed college 3 42.86% Completed graduate school 1 14.29% Some college 1 14.29% Completed high school 2 28.57%
Highest level of education attained by your father:
Answer Count Percent Completed college 2 28.57% Some graduate school 1 14.29% Completed junior/community college 1 14.29% Completed high school 3 42.86%
What type of high school did you attend?
Answer Count Percent Public 7 100.00%
How would you describe the location of your high school?
How would you describe the racial/ethnic composition of your high school?
Answer Count Percent A mixture of both white and non-white students 4 57.14% Primarily white students 3 42.86%
The next several questions refer to your preparation for working with English language learners (ELL) students. Please use the following scale to
rate your level of agreement with each statement: 1 = Strongly Disagree; 2 = Disagree; 3 = Neutral; 4 = Agree; 5 = Strongly Agree
1 2 3 4 5 Average Rating
I am prepared to tailor instructional and other services to the needs to ELL students.
0 (0.00%)
2 (28.57%)
3 (42.86%)
2 (28.57%)
0 (0.00%) 3
I possess a clear understanding of the language demands of the content area that I will teach.
0 (0.00%)
3 (42.86%)
1 (14.29%)
3 (42.86%)
0 (0.00%) 3
I am knowledgeable of teaching strategies and instructional practices for ELL students that are developmentally appropriate.
0 (0.00%)
4 (57.14%)
3 (42.86%)
0 (0.00%)
0 (0.00%) 2.4
I am knowledgeable of alternate ways of giving feedback.
0 (0.00%)
0 (0.00%)
4 (57.14%)
3 (42.86%)
0 (0.00%) 3.4
I am knowledgeable of teaching practices that are attuned to students’ language proficiencies and cognitive levels.
0 (0.00%)
4 (57.14%)
2 (28.57%)
1 (14.29%)
0 (0.00%) 2.6
I am knowledgeable of teaching practices that are culturally supportive and relevant.
0 (0.00%)
2 (28.57%)
2 (28.57%)
3 (42.86%)
0 (0.00%) 3.1
If I try hard, I can get through to most of the ELL students.
0 (0.00%)
0 (0.00%)
4 (57.14%)
2 (28.57%)
1 (14.29%) 3.6
I am confident in my ability to handle most discipline problems with ELL
0 (0.00%)
1 (14.29%)
5 (71.43%)
1 (14.29%)
0 (0.00%) 3
students. I am confident in my ability to teach all ELL students to high levels.
0 (0.00%)
2 (28.57%)
2 (28.57%)
3 (42.86%)
0 (0.00%) 3.1
I am confident I am making a difference in the lives of my students.
0 (0.00%)
0 (0.00%)
3 (42.86%)
1 (14.29%)
3 (42.86%) 4
I am uncertain how to teach some of my ELL students.
0 (0.00%)
0 (0.00%)
3 (42.86%)
4 (57.14%)
0 (0.00%) 3.6
I feel confident I can provide a positive learning environment and create a climate characterized by high expectations.
0 (0.00%)
0 (0.00%)
2 (28.57%)
3 (42.86%)
2 (28.57%) 4
I am confident in my skills to effectively communicate with parents and guardians of ELL students.
0 (0.00%)
4 (57.14%)
2 (28.57%)
0 (0.00%)
1 (14.29%) 2.7
I am confident in my skills to provide alternative/performance assessments to ELL students.
0 (0.00%)
3 (42.86%)
3 (42.86%)
1 (14.29%)
0 (0.00%) 2.7
I feel confident in providing linguistically and culturally appropriate learning experiences for ELL students.
0 (0.00%)
2 (28.57%)
3 (42.86%)
1 (14.29%)
1 (14.29%) 3.1
ELL students in the general education classroom setting slows down the progress of the other students in the class.
1 (14.29%)
2 (28.57%)
3 (42.86%)
1 (14.29%)
0 (0.00%) 2.6
Inclusion of ELL students in general education classes is good in theory, but does not work in the real world.
1 (14.29%)
2 (28.57%)
4 (57.14%)
0 (0.00%)
0 (0.00%) 2.4
Immigrant parents do not try to learn English.
2 (28.57%)
4 (57.14%)
1 (14.29%)
0 (0.00%)
0 (0.00%) 1.9
In order for ELLs to learn English, their parents should attempt to speak English.
1 (14.29%)
1 (14.29%)
4 (57.14%)
1 (14.29%)
0 (0.00%) 2.7
Experience Working with Students with Disabilities How confident are you in your ability to do the following?
Not at all Confident
Moderately Unconfident
Slightly Unconfident
Slightly Confident
Moderately Confident
Very Confident
Physically prepare space and materials needed to deliver instruction
0 (0.00%)
0 (0.00%)
0 (0.00%)
3 (42.86%)
3 (42.86%)
1 (14.29%)
Design lesson plans to provide all learners access to the general curriculum
0 (0.00%)
0 (0.00%)
2 (28.57%)
3 (42.86%)
2 (28.57%)
0 (0.00%)
Modify lesson plans to address the needs of students with disabilities
0 (0.00%)
0 (0.00%)
0 (0.00%)
4 (57.14%)
3 (42.86%)
0 (0.00%)
Maintain a structured learning environment
0 (0.00%)
0 (0.00%)
0 (0.00%)
3 (42.86%)
1 (14.29%)
3 (42.86%)
Use a small number of positively stated expectations
0 (0.00%)
0 (0.00%)
1 (14.29%)
2 (28.57%)
2 (28.57%)
2 (28.57%)
Reinforce appropriate behavior 0 (0.00%)
0 (0.00%)
0 (0.00%)
1 (14.29%)
3 (42.86%)
3 (42.86%)
Respond to inappropriate behavior 0 (0.00%)
0 (0.00%)
0 (0.00%)
4 (57.14%)
1 (14.29%)
2 (28.57%)
Implement individualized behavior strategies for students with disabilities
0 (0.00%)
0 (0.00%)
0 (0.00%)
6 (85.71%)
1 (14.29%)
0 (0.00%)
Introduce lesson content 0 (0.00%)
0 (0.00%)
0 (0.00%)
1 (14.29%)
4 (57.14%)
2 (28.57%)
Maximize student engagement 0 (0.00%)
0 (0.00%)
1 (14.29%)
1 (14.29%)
4 (57.14%)
1 (14.29%)
Provide performance-based feedback
0 (0.00%)
0 (0.00%)
1 (14.29%)
2 (28.57%)
3 (42.86%)
1 (14.29%)
Review lesson content at the end of instruction
0 (0.00%)
0 (0.00%)
0 (0.00%)
1 (14.29%)
5 (71.43%)
1 (14.29%)
Teach lesson content relevant to the student population
0 (0.00%)
0 (0.00%)
0 (0.00%)
3 (42.86%)
2 (28.57%)
2 (28.57%)
Assess student ability and/or 0 0 1 2 4 0
knowledge prior to instruction (0.00%) (0.00%) (14.29%) (28.57%) (57.14%) (0.00%) Assess student outcomes related to the student's IEP during instruction
0 (0.00%)
0 (0.00%)
3 (42.86%)
1 (14.29%)
2 (28.57%)
1 (14.29%)
Assess student response to instruction
0 (0.00%)
0 (0.00%)
0 (0.00%)
3 (42.86%)
4 (57.14%)
0 (0.00%)
Uphold high standards of competence in the practice of the profession
0 (0.00%)
0 (0.00%)
0 (0.00%)
2 (28.57%)
1 (14.29%)
4 (57.14%)
Uphold high standards of integrity in the practice of the profession
0 (0.00%)
0 (0.00%)
1 (14.29%)
1 (14.29%)
1 (14.29%)
4 (57.14%)
Use evidence to guide exercise/exercising sound judgment in the practice of the profession
0 (0.00%)
0 (0.00%)
0 (0.00%)
2 (28.57%)
3 (42.86%)
2 (28.57%)
Engage in professional activities related to continuous learning and advocacy
0 (0.00%)
0 (0.00%)
1 (14.29%)
0 (0.00%)
4 (57.14%)
2 (28.57%)
Collaborate respectfully with all stakeholders
0 (0.00%)
0 (0.00%)
0 (0.00%)
1 (14.29%)
3 (42.86%)
3 (42.86%)
Assessment How confident are you in your ability to do the following?
Not at all Confident
Moderately Unconfident
Slightly Unconfident
Slightly Confident
Moderately Confident
Very Confident
Activities Occurring Prior to Instruction Understanding students' cultural backgrounds, interests, skills, and abilities as they apply across a range of learning domains and/or subject areas
0 (0.00%)
0 (0.00%)
1 (14.29%)
2 (28.57%)
2 (28.57%)
2 (28.57%)
Understanding students' motivations and their interests in
0 (0.00%)
0 (0.00%)
2 (28.57%)
1 (14.29%)
3 (42.86%)
1 (14.29%)
specific class content Clarifying and articulating the performance outcomes expected of pupils
0 (0.00%)
0 (0.00%)
1 (14.29%)
2 (28.57%)
3 (42.86%)
1 (14.29%)
Planning instruction for individuals or groups of students
0 (0.00%)
0 (0.00%)
0 (0.00%)
3 (42.86%)
2 (28.57%)
2 (28.57%)
Activities Occurring During Instruction Monitoring pupil progress toward instructional goals
0 (0.00%)
0 (0.00%)
1 (14.29%)
2 (28.57%)
3 (42.86%)
1 (14.29%)
Identifying gains and difficulties pupils are experiencing in learning and performing
0 (0.00%)
0 (0.00%)
1 (14.29%)
2 (28.57%)
4 (57.14%)
0 (0.00%)
Adjusting instruction 0 (0.00%)
0 (0.00%)
0 (0.00%)
4 (57.14%)
3 (42.86%)
0 (0.00%)
Giving contingent, specific, and credible praise and feedback
0 (0.00%)
0 (0.00%)
0 (0.00%)
3 (42.86%)
3 (42.86%)
1 (14.29%)
Motivating students to learn 0 (0.00%)
0 (0.00%)
0 (0.00%)
3 (42.86%)
3 (42.86%)
1 (14.29%)
Judging the extent of pupil attainment of instructional outcomes
0 (0.00%)
0 (0.00%)
0 (0.00%)
4 (57.14%)
2 (28.57%)
1 (14.29%)
Activities Occurring After the Appropriate Instructional Segment (e.g. lesson, class, semester, grade)
Describing the extent to which each pupil has attained both short- and long-term instructional goals
0 (0.00%)
0 (0.00%)
0 (0.00%)
5 (71.43%)
2 (28.57%)
0 (0.00%)
Communicating strengths and weaknesses based on assessment results to students, and parents or guardians
0 (0.00%)
0 (0.00%)
0 (0.00%)
2 (28.57%)
4 (57.14%)
1 (14.29%)
Recording and reporting assessment results for school-level analysis, evaluation, and decision-
0 (0.00%)
0 (0.00%)
1 (14.29%)
3 (42.86%)
3 (42.86%)
0 (0.00%)
making Analyzing assessment information gathered before and during instruction to understand each student's progress to date and to inform future instructional planning
0 (0.00%)
0 (0.00%)
1 (14.29%)
2 (28.57%)
3 (42.86%)
1 (14.29%)
Evaluating the effectiveness of instruction
0 (0.00%)
0 (0.00%)
0 (0.00%)
4 (57.14%)
3 (42.86%)
0 (0.00%)
Evaluating the effectiveness of the curriculum and materials in use
0 (0.00%)
0 (0.00%)
0 (0.00%)
4 (66.67%)
2 (33.33%)
0 (0.00%)
Activities Associated with a Teacher's Involvement in School Building and School District Decision-Making
Serving on a school or district committee examining the school's and district's strengths and weaknesses in the development of its students
0 (0.00%)
0 (0.00%)
5 (71.43%)
1 (14.29%)
0 (0.00%)
1 (14.29%)
Working on the development or selection of assessment methods for school building or school district use
0 (0.00%)
0 (0.00%)
4 (57.14%)
2 (28.57%)
1 (14.29%)
0 (0.00%)
Evaluating school district curriculum
0 (0.00%)
0 (0.00%)
4 (57.14%)
2 (28.57%)
0 (0.00%)
1 (14.29%)
Other (e.g., school improvement planning)
0 (0.00%)
0 (0.00%)
4 (57.14%)
1 (14.29%)
2 (28.57%)
0 (0.00%)
Serving on a state committee asked to develop learning goals and associated assessment methods
0 (0.00%)
2 (28.57%)
2 (28.57%)
2 (28.57%)
1 (14.29%)
0 (0.00%)
Participating in reviews of the appropriateness of district, state, or national student goals and
0 (0.00%)
1 (14.29%)
4 (57.14%)
0 (0.00%)
2 (28.57%)
0 (0.00%)
associated assessment methods Interpreting the results of state and national student assessment programs
0 (0.00%)
2 (28.57%)
2 (28.57%)
2 (28.57%)
0 (0.00%)
1 (14.29%)
Common Core State Standards
For each of the listed statements, indicate whether it is a focus in CCSS:
Yes No I don't
know
Present increasingly complex information through speaking 1 (16.67%)
0 (0.00%)
5 (83.33%)
Present increasingly complex information through speaking 1 (16.67%)
0 (0.00%)
5 (83.33%)
Read seminal works of American literature 1 (16.67%)
0 (0.00%)
5 (83.33%)
Conduct short research on focused projects 1 (16.67%)
0 (0.00%)
5 (83.33%)
Read writings of Shakespeare 0 (0.00%)
1 (16.67%)
5 (83.33%)
Present increasingly complex information using media 1 (16.67%)
0 (0.00%)
5 (83.33%)
Read writings of Shakespeare 0 (0.00%)
1 (16.67%)
5 (83.33%)
Present increasingly complex information using media 1 (16.67%)
0 (0.00%)
5 (83.33%)
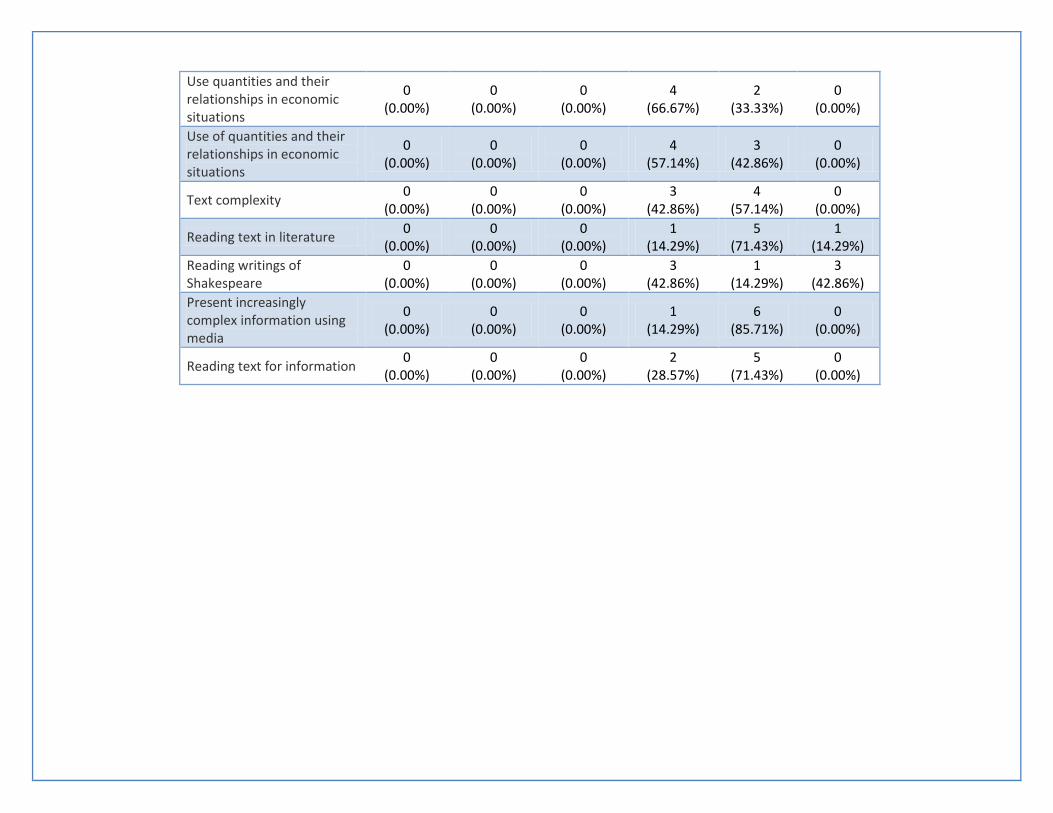
According to the CCSS, please indicate the grade level focus for each of the listed statements.
Gr K 1-5 6-8 9-12 All grades Not a
focus
area
Number and operations 0 (0.00%)
3 (60.00%)
0 (0.00%)
0 (0.00%)
2 (40.00%)
0 (0.00%)
Probability and number sense 0 (0.00%)
0 (0.00%)
3 (60.00%)
2 (40.00%)
0 (0.00%)
0 (0.00%)
Functions 0 (0.00%)
0 (0.00%)
0 (0.00%)
5 (100.00%)
0 (0.00%)
0 (0.00%)
Geometry 0 (0.00%)
0 (0.00%)
0 (0.00%)
5 (100.00%)
0 (0.00%)
0 (0.00%)
Mathematical modeling 0 (0.00%)
0 (0.00%)
0 (0.00%)
3 (60.00%)
1 (20.00%)
1 (20.00%)
Statistics to analyze empirical situations 0 (0.00%)
0 (0.00%)
1 (20.00%)
3 (60.00%)
0 (0.00%)
1 (20.00%)
Number core (learning how numbers correspond to quantities, and learning how to put numbers together and take them apart)
0 (0.00%)
2 (40.00%)
0 (0.00%)
0 (0.00%)
3 (60.00%)
0 (0.00%)
Foundation in whole numbers 1 (20.00%)
1 (20.00%)
0 (0.00%)
1 (20.00%)
2 (40.00%)
0 (0.00%)
Multiplication 0 (0.00%)
4 (80.00%)
1 (20.00%)
0 (0.00%)
0 (0.00%)
0 (0.00%)
Decimals 0 (0.00%)
2 (40.00%)
3 (60.00%)
0 (0.00%)
0 (0.00%)
0 (0.00%)
Conceptual understanding of math concepts
0 (0.00%)
0 (0.00%)
1 (20.00%)
1 (20.00%)
3 (60.00%)
0 (0.00%)
Use quantities and their relationships in economic situations
0 (0.00%)
0 (0.00%)
0 (0.00%)
4 (80.00%)
1 (20.00%)
0 (0.00%)
Use of quantities and their relationships in economic situations
0 (0.00%)
0 (0.00%)
0 (0.00%)
4 (80.00%)
1 (20.00%)
0 (0.00%)
Text complexity 0 (0.00%)
0 (0.00%)
0 (0.00%)
2 (40.00%)
2 (40.00%)
1 (20.00%)
Reading text in literature 0 (0.00%)
0 (0.00%)
0 (0.00%)
0 (0.00%)
5 (100.00%)
0 (0.00%)
Reading writings of Shakespeare 0 (0.00%)
0 (0.00%)
0 (0.00%)
4 (80.00%)
0 (0.00%)
1 (20.00%)
Present increasingly complex information using media
0 (0.00%)
0 (0.00%)
0 (0.00%)
0 (0.00%)
4 (80.00%)
1 (20.00%)
Reading text for information 0 (0.00%)
0 (0.00%)
0 (0.00%)
0 (0.00%)
5 (100.00%)
0 (0.00%)
Appendix B: Teacher Certification Program for College Graduates (TCPCG)
Gender:
Answer Count Percent Female 4 50.00% Male 4 50.00%
Race/ethnicity:
Answer Count Percent Asian/Pacific Islander 1 12.50% Do not wish to supply 1 12.50% White/Caucasian 6 75.00%
Primary language spoken in your childhood home:
Answer Count Percent English 9 100.00%
Can you speak any language other than English?
Answer Count Percent No 8 88.89% Yes 1 11.11%
Highest level of education attained by your mother:
Answer Count Percent Completed college 3 33.33% Completed graduate school 2 22.22% Completed high school 1 11.11% Some college 3 33.33%
Highest level of education attained by your father:
Answer Count Percent Completed college 3 33.33% Completed graduate school 3 33.33% Some college 3 33.33%
What type of high school did you attend?
Answer Count Percent Public 9 100.00%
How would you describe the location of your high school?
Answer Count Percent Suburban 9 100.00%
How would you describe the racial/ethnic composition of your high school?
Answer Count Percent A mixture of both white and non-white students 4 44.44% Primarily white students 5 55.56%
For TCPCG only: In what year did you receive your undergraduate degree?
Identifying gains and difficulties pupils are experiencing in learning and performing
0 (0.00%)
0 (0.00%)
1 (12.50%)
1 (12.50%)
4 (50.00%)
2 (25.00%)
Adjusting instruction 0 0 1 4 1 2
(0.00%) (0.00%) (12.50%) (50.00%) (12.50%) (25.00%) Giving contingent, specific, and credible praise and feedback
0 (0.00%)
0 (0.00%)
0 (0.00%)
1 (12.50%)
4 (50.00%)
3 (37.50%)
Motivating students to learn 0 (0.00%)
0 (0.00%)
1 (12.50%)
2 (25.00%)
4 (50.00%)
1 (12.50%)
Judging the extent of pupil attainment of instructional outcomes
0 (0.00%)
0 (0.00%)
0 (0.00%)
4 (50.00%)
2 (25.00%)
2 (25.00%)
Activities Occurring After the Appropriate Instructional Segment (e.g. lesson, class, semester, grade) Describing the extent to which each pupil has attained both short- and long-term instructional goals
0 (0.00%)
0 (0.00%)
3 (37.50%)
1 (12.50%)
2 (25.00%)
2 (25.00%)
Communicating strengths and weaknesses based on assessment results to students, and parents or guardians
0 (0.00%)
0 (0.00%)
1 (12.50%)
3 (37.50%)
3 (37.50%)
1 (12.50%)
Recording and reporting assessment results for school-level analysis, evaluation, and decision-making
0 (0.00%)
0 (0.00%)
2 (25.00%)
2 (25.00%)
3 (37.50%)
1 (12.50%)
Analyzing assessment information gathered before and during instruction to understand each student's progress to date and to inform future instructional planning
0 (0.00%)
0 (0.00%)
1 (14.29%)
2 (28.57%)
2 (28.57%)
2 (28.57%)
Evaluating the effectiveness of instruction
0 (0.00%)
0 (0.00%)
1 (12.50%)
2 (25.00%)
2 (25.00%)
3 (37.50%)
Evaluating the effectiveness of the curriculum and materials in use
0 (0.00%)
0 (0.00%)
1 (12.50%)
3 (37.50%)
1 (12.50%)
3 (37.50%)
Activities Associated with a Teacher's Involvement in School Building and School District Decision-Making Serving on a school or district committee examining the school's and district's strengths and weaknesses in the development of its students
1 (12.50%)
0 (0.00%)
2 (25.00%)
3 (37.50%)
0 (0.00%)
2 (25.00%)
Working on the development or 0 0 3 2 1 2
selection of assessment methods for school building or school district use