187
i Commonwealth Environmental Water Office long-term intervention monitoring program Murrumbidgee River systems selected area 2014-15 Technical Report

i
Commonwealth Environmental Water
Office long-term intervention monitoring
program Murrumbidgee River systems
selected area
2014-15 Technical Report

ii
Long Term Intervention Monitoring Murrumbidgee Selected Area 2014-15 technical
report. Final, March 2016.
Prepared by: Wassens, S.a, Thiem, J.b, Spencer, J.c, Bino, G.d, Hall, A.a, Thomas, R.c,
Wolfenden, B.a, Jenkins, K.a, Ocock, J.c, Lenon, E.e, Kobayashi, Tc, Heath, J. c and
Cory, Ff.
a Institute for Land, Water and Society. Charles Sturt University, PO
Box 789, Albury, NSW 2640
b NSW Department of Industry, Narrandera Fisheries Centre, PO
Box 182, Narrandera NSW 2700
c Water and Wetlands Team, Science Division, NSW Office of
Environment and Heritage, PO Box A290, Sydney South, NSW 1232
d Centre for Ecosystem Science, University of New South Wales,
Sydney, NSW, 2052
e Commonwealth Environmental Water Office
PO Box 156, Leeton NSW 2705 | Australia
f Murrumbidgee Local land Services, Level 1, 42-45 Johnston Street
(PO Box 5224). Wagga Wagga NSW 2650
This monitoring project was commissioned and funded by Commonwealth Environmental Water Office with
additional in-kind support from the NSW Office of Environment and Heritage, Riverina Local land Services and
Charles Sturt University.
Copyright
© Copyright Commonwealth of Australia, 2015
‘Long Term Intervention Monitoring Murrumbidgee Selected Area 2014-15 Technical report is licensed by the
Commonwealth of Australia for use under a Creative Commons By Attribution 3.0 Australia licence with the
exception of the Coat of Arms of the Commonwealth of Australia, the logo of the agency responsible for publishing
the report, content supplied by third parties, and any images depicting people. For licence conditions see:
http://creativecommons.org/licenses/by/3.0/au/
This report should be attributed as ‘Long Term Intervention Monitoring Murrumbidgee Selected Area 2014-15
Technical report Commonwealth of Australia 2015’.
The Commonwealth of Australia has made all reasonable efforts to identify content supplied by third parties using
the following format ‘© Copyright, [name of third party] ’.
Disclaimer
The views and opinions expressed in this publication are those of the authors and do not necessarily reflect those of
the Australian Government or the Minister for the Environment.
While reasonable efforts have been made to ensure that the contents of this publication are factually correct, the
Commonwealth does not accept responsibility for the accuracy or completeness of the contents, and shall not be
liable for any loss or damage that may be occasioned directly or indirectly through the use of, or reliance on, the
contents of this publication.

iii
Table of contents
Table of contents ........................................................................................................................................... iii
Abbreviations ................................................................................................................................................ vi
Table of Figures .......................................................................................................................................... viii
List of tables................................................................................................................................................. xv
1 Introduction .............................................................................................................. 1
Environmental Watering actions and objectives 2014-15 .............................................................................. 1
Water use ....................................................................................................................................................... 5
2 Summary of monitoring activities -Murrumbidgee Selected Area ............................... 8
3 Ecosystem responses to Commonwealth environmental water .................................. 13
3.1 Ecosystem type ........................................................................................................... 14
Introduction .................................................................................................................................................. 14
3.2 Wetland mapping ....................................................................................................... 15
3.3 Hydrology .................................................................................................................. 20
Wetland hydrology - Inundated areas .......................................................................................................... 20
River Hydrology .......................................................................................................................................... 28
3.4 Water quality ............................................................................................................. 31
Outcomes summary ..................................................................................................................................... 31
Introduction .................................................................................................................................................. 32
Methods ....................................................................................................................................................... 32
Results .......................................................................................................................................................... 33
Discussion .................................................................................................................................................... 37
3.5 Nutrients, carbon and productivity ............................................................................ 38
Outcomes summary ..................................................................................................................................... 38
Introduction .................................................................................................................................................. 39
Methods ....................................................................................................................................................... 40
Results .......................................................................................................................................................... 41
Discussion .................................................................................................................................................... 45
3.6 Microinvertebrates .................................................................................................... 49
Outcomes summary ..................................................................................................................................... 49
Introduction .................................................................................................................................................. 50
Methods ....................................................................................................................................................... 51
Results .......................................................................................................................................................... 52

iv
Discussion .................................................................................................................................................... 59
3.7 Return flows ............................................................................................................... 61
Outcomes summary ..................................................................................................................................... 61
Introduction .................................................................................................................................................. 62
Methods ....................................................................................................................................................... 63
Results .......................................................................................................................................................... 67
Discussion .................................................................................................................................................... 75
3.8 Fish reproduction and larval fish ............................................................................... 78
Outcomes summary ..................................................................................................................................... 78
Introduction .................................................................................................................................................. 79
Methods ....................................................................................................................................................... 79
Results .......................................................................................................................................................... 81
Discussion .................................................................................................................................................... 86
3.9 Fish communities ....................................................................................................... 89
Outcomes summary ..................................................................................................................................... 89
Introduction .................................................................................................................................................. 90
Methods ....................................................................................................................................................... 91
Results .......................................................................................................................................................... 94
Discussion .................................................................................................................................................. 110
3.10 Vegetation ................................................................................................................ 114
Outcomes summary ................................................................................................................................... 114
Introduction ................................................................................................................................................ 115
Methods ..................................................................................................................................................... 116
Results ........................................................................................................................................................ 118
Discussion .................................................................................................................................................. 126
3.11 Other vertebrate diversity- Frogs and Turtles ......................................................... 127
Outcomes summary ................................................................................................................................... 127
Introduction ................................................................................................................................................ 128
Methods ..................................................................................................................................................... 128
Results ........................................................................................................................................................ 129
Discussion .................................................................................................................................................. 133
3.12 Waterbird Diversity ................................................................................................. 136
Outcomes summary ................................................................................................................................... 136
Introduction ................................................................................................................................................ 137
Methods ..................................................................................................................................................... 137

v
Results ........................................................................................................................................................ 138
Discussion .................................................................................................................................................. 141
4 References ............................................................................................................. 143
5 Appendices ............................................................................................................ 157
1. Wetland-dependent bird species recorded during surveys of the Murrumbidgee in
2014-15 ........................................................................................................................................... 158
2. Classification and Regression Tree (CART) analysis .................................................... 160
Waterbirds ................................................................................................................................................. 162
Fish ............................................................................................................................................................ 164
Frogs and tadpoles .................................................................................................................................... 168

vi
Abbreviations
AGRF Australian Genome Research Facility
ANAE Australian National Aquatic Ecosystem
ANOVA Analysis of Variance
ANOSIM Analysis of Similarities
C1 Category 1 LTIM standard methods
C3 Category 3 LTIM standard methods
CAMBA China-Australia Migratory Bird Agreement
CEWH Commonwealth Environmental Water Holder
Chl a Chlorophyll-a
CPUE Catch Per Unit Effort
CSU Charles Sturt University
CTF Commence-To-Fill
DO Dissolved Oxygen
DOC Dissolved Organic Carbon
DTM Digital Terrain Model
EC Electrical Conductivity
EPBC Commonwealth Environment Protection & Biodiversity Conservation Act 1999
ER Ecosystem Respiration
EWA Environmental Water Allowance
FMA NSW Fisheries Management Act 1994
GIS Geographic Information System
GLM Generalised Linear Model
GPP Gross Primary Production
GS General Security
IMEF Integrated Monitoring of Environmental Flows
JAMBA Japan-Australia Migratory Bird Agreement
LiDAR Light Detection And Ranging (DTM)
LTIM Long Term Intervention Monitoring
ML Megalitre
NC Nimmie-Caira system (Lowbidgee floodplain)
NOx Oxidised nitrogen
NTU Nephelometric Turbidity Units
OEH Office of Environment and Heritage, NSW
PCR Polymerase Chain Reaction
PERMANOVA Permutational ANOVA
PLS-PM Partial Least Squares Path Modelling
RB Redbank system (Lowbidgee floodplain)

vii
SIMPER Similarity of Percentages Analysis
SRA Sustainable Rivers Audit
SUPPL Supplementary environmental water allowance
TDN Total Dissolved Nitrogen
TDP Total Dissolved Phosphorus
TSC NSW Threatened Species Conservation Act 1995
UNSW University of New South Wales
YOY Young-Of-the-Year fish

viii
Table of Figures
Figure 1 Distribution of riverine zones and key monitoring locations in the
Murrumbidgee Selected Area. ........................................................................................... 11
Figure 2 Distribution of wetland zones and key monitoring locations in the
Murrumbidgee Selected Area ............................................................................................ 12
Figure 3 Wetland boundary for Nap Nap Swamp (Nimmie-Caira zone) (black solid
line) with bathymetry (coloured) shown with greyscale digital terrain map and rough
boundary (red solid line). ..................................................................................................... 17
Figure 4(a) Wetland boundary for Nap Nap swamp shown with (a) true colour
Landsat image and (b) flood frequency map of the surrounding area. ...................... 17
Figure 5 Wetland boundaries derived using a digital terrain model compared to the
ANAE database wetland boundaries. ............................................................................... 18
Figure 6 Distribution of inundated areas derived from Landsat satellite imagery dates
in the Nimmie-Caira wetland zone during environmental watering action periods
(August 2014-April 2015) and in relation to surveyed wetlands: insets (a) Telephone
Creek (b) Nap Nap Swamp, (c) Avalon Swamp and (d) Eulimbah Swamp................ 20
Figure 7 Distribution of inundated areas in the LTIM surveyed wetlands of the Nimmie-
Caira wetland zone (a) Telephone Creek (b) Nap Nap Swamp, (c) Avalon Swamp
and (d) Eulimbah Swamp during environmental watering action periods between
August 2014 and June 2015. ................................................................................................ 21
Figure 8 Percentage area inundated of the LTIM surveyed wetlands in the Nimmie-
Caira wetland zone of the Lowbidgee during NSW environmental water actions in
2014-15. ................................................................................................................................... 22
Figure 9 Distribution of inundated areas derived from Landsat satellite imagery dates
in the Redbank and Western Lakes wetland zone during environmental watering
action periods (August 2014-June 2015) and in relation to surveyed wetlands: insets
(e) Waugorah Lagoon (f) Mercedes Swamp, (g) Two Bridges Swamp and (h) Piggery
Lake (see Figure 10) .............................................................................................................. 23
Figure 10 Distribution of inundated areas in the LTIM surveyed wetlands of the
Redbank wetland zone (e) Waugorah Lagoon (f) Mercedes Swamp, (g) Two Bridges
Swamp and (h) Piggery Lake during environmental watering action periods
between August 2014 and June 2015. ............................................................................... 24

ix
Figure 11 Percentage area inundated of the LTIM surveyed wetlands in the Redbank
wetland zone of the Lowbidgee from Commonwealth and NSW environmental
water during 2014-15............................................................................................................. 25
Figure 12 Wetland hydrographs indicating the timing of inundation for individual
wetlands as demonstrated by a rapid rise in water depth. ............................................ 27
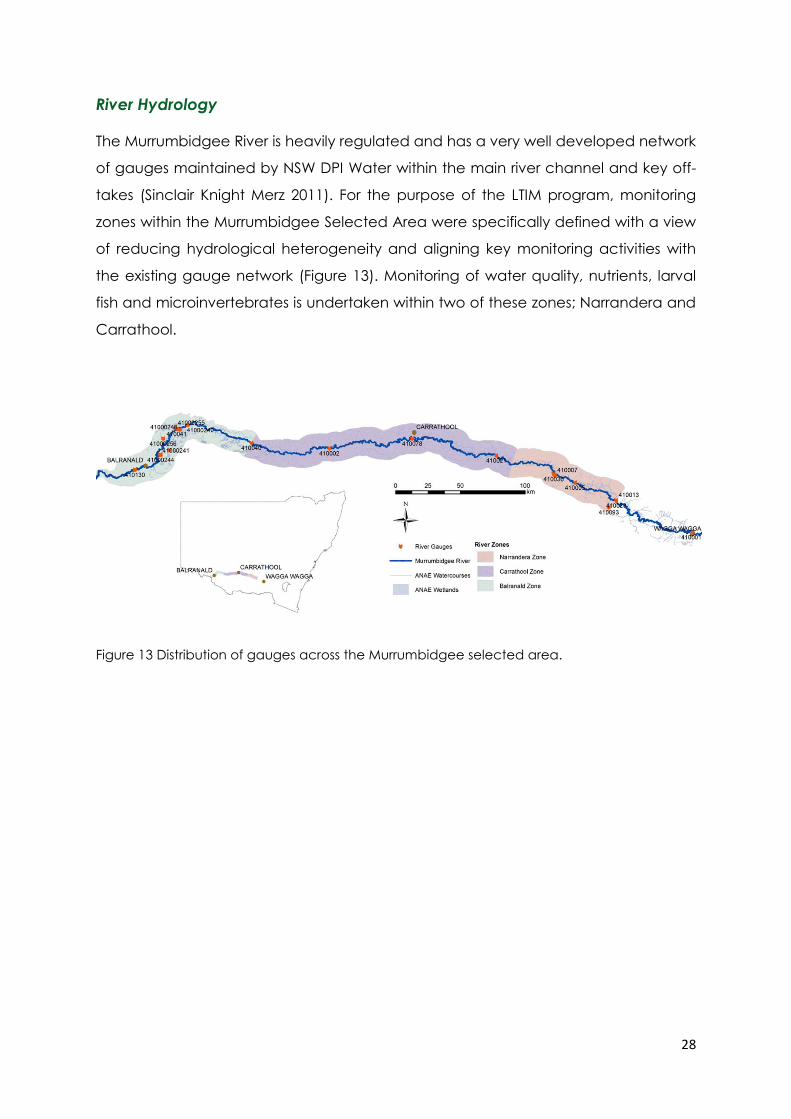
Figure 13 Distribution of gauges across the Murrumbidgee selected area. ................. 28
Figure 14 (a) Mean daily discharge in the Murrumbidgee River at Narrandera and
Darlington Point between 1 July 2010 to 30 June 2015 with base flows (dash-dot line)
and upper and lower commence to fill (CTF) levels. Horizontal bars show
Commonwealth and NSW environmental water actions in 2011-12, 2012-13, 2013-14
and 2014-15. (b) Mean daily discharge in the Murrumbidgee River at Carrathool,
Redbank Weir and downstream of Maude Weir and on the North Redbank Channel
at Glendee in relation to the timing of environmental water delivery to wetland
zones Nimmie-Caira (NC), Western lakes (WL) and Redbank (RB) during survey
period (1 July 2014 to 30 June 2015). .................................................................................. 29
Figure 15 River discharge at Narrandera and Carrathool zone from 1 July 2014 to 30
June 2015, vertical lines indicate key in-channel monitoring periods. .......................... 30
Figure 16 Time series plots of measured water quality parameters and river discharge
(mean daily flows) at larval fish monitoring sites (fortnightly measurements between
20 October 2014 and 1 January 2015). Shapes indicate sites from the Narrandera
(triangle) and Carrathool (circle) reaches. Additional monthly samples were
collected at MKR as part of the Category 1 metabolism monitoring. Discharge
measurements are for the gauges at Narrandera and Carrathool. ............................. 34
Figure 17 Boxplots (showing the full range of variation from minimum to maximum
and the typical value (mean)) of water quality parameters (temperature,
conductivity, turbidity, maximum dissolved oxygen, minimum dissolved oxygen) in
wetlands of the mid-Murrumbidgee, Nimmie-Caira and south Redbank between
October 2014 and May 2015. .............................................................................................. 36
Figure 18 Line plots of dissolved organic carbon (DOC), Nitrate+Nitrite (NOx), total
dissolved phosphorus (TDP), total dissolved nitrogen (TDN) and Chlorophyll-a at larval
fish monitoring sites (DAI = The Dairy, NRD = Narrandera, EUB = Euroley Bridge, BRI =
Bringagee, YRR = near Yarradda Lagoon, MKR = near Carrathool) in the Mid-

x
Murrumbidgee River. Discharge data (bottom panel) is mean daily discharge for the
Narrandera and Carrathool gauges. ................................................................................. 42
Figure 19 Ecosystem metabolism in the Carrathool (blue) and Narrandera (black)
zones. Data are gross primary production (GPP), ecosystem respiration (ER) and the
ratio of primary production to respiration (PRrat). The horizontal line at y=1 on the
PRrat panel indicates the divide between net autotrophic production and net
respiration. Discharge data (bottom panel) are taken from the Narrandera and
Carrathool gauging stations. ............................................................................................... 43
Figure 20 Box plots (showing the full range of variation from minimum to maximum
and the typical value (mean)) of chlorophyll-a (chla), total nitrogen (TN), total
phosphorus (TP) and dissolved organic carbon (DOC) in wetland sites. Includes all
data collected across four sampling trips to each wetland between October 2014
and May 2015. The number of samples is determined by the presence of water
during sampling in the mid-Murrumbidgee (Gooragool n=1, Yarradda n=2,
McKenna’s n=0, Sunshower n=0), Nimmie-Caira (Avalon n=4, Eulimbah n=3, Nap
Nap n=3, Telephone Creek n=4) and Redbank (Mercedes n=3, Piggery n=4, Two
Bridges n=4, Waugorah n=4). .............................................................................................. 45
Figure 21 Benthic (upper graph) and pelagic (middle graph) microinvertebrate
densities (L-1) for 3 sites in the Narrandera zone (left graphs) and 3 sites in the
Carrathool zone (right graphs) of the Murrumbidgee River sampled from October
2014 to January 2015. Data are plotted as scatter plots with individual data points
for each site comprising a single composite sample. Benthic and pelagic samples
are presented on different scales, with benthic samples typically exhibiting densities
several orders of magnitude greater than pelagic samples. Discharge (lower graph)
is shown for Narrandera and Carrathool gauge. ............................................................. 53
Figure 22 Benthic copepod (upper graph) and cladoceran (middle graph) densities
(L-1) for 3 sites in the Narrandera zone (left graphs) and 3 sites in the Carrathool zone
(right graphs) of the Murrumbidgee River sampled from October 2014 to January
2015. Data are plotted as scatter plots with data points for each site comprising a
single composite sample. Discharge (lower graph) is shown for Narrandera (left) and
Carrathool (right) gauge. ..................................................................................................... 54
Figure 23 Benthic (left graphs) biovolume (length x width x density) for chydorid
cladocerans (upper graphs) and copepods (middle graphs) and macrothricid
xi
cladocerans (lower graphs) for 3 sites in the Narrandera zone (left graphs) and 3 sites
in the Carrathool zone (right graphs) of the Murrumbidgee River sampled from
October 2014 to January 2015. ........................................................................................... 56
Figure 24 Boxplots of copepod (first row), ostracod (second row), cladoceran (third
row), and total microinvertebrate (fourth row) benthic densities across time in each
zone. Data are means and standard errors of the four wetland sites (sometimes
fewer sites depending on when wetlands flooded and dried) sampled in each of the
three zones (mid-Murrumbidgee, Nimmie Caira, north Redbank, Redbank and the
Murrumbidgee River sites) on each sampling date. ........................................................ 58
Figure 25 Sites monitored during the 2014-15 return flows. Treatment sites (n=3) are
located downstream if the junction between the escape canal and the
Murrumbidgee River. Control sites are located upstream (n=2). An additional site is
located within the wetland immediately behind the Wynburn Escape. Environmental
water was delivered by inundating the North Redbank wetland complex by
providing inflows from the North. ........................................................................................ 66
Figure 26 Water depth in Wynburn Swamp measured in the canal below the
Wynburn Escape and discharge in the Murrumbidgee River between September
2014 and March 2015. Areas highlighted in blue indicate approximate beginning
and end times of Release 1 and Release 2. Vertical lines show monitoring dates.
Depth data was recorded hourly. Discharge is mean daily flow, adapted from the
NSW Water Info website (http://waterinfo.nsw.gov.au/). ............................................... 69
Figure 27 Water temperature and dissolved oxygen concentration at river (control
and Treatment) and wetland sites during the October and February return flows.
Data are recorded at 10 minute intervals, with fluctuations caused by daily cycles.
Areas highlighted in blue indicate approximate beginning and end times of Release
1 (October 2014) and Release 2 (February 2015). Vertical lines show monitoring
dates. ...................................................................................................................................... 70
Figure 28 Average water column phosphate, oxidised nitrogen (NOx), dissolved
organic carbon (DOC) and chlorophyll-a concentrations from the Murrumbidgee
River and the adjacent Wynburn Swamp. River sites are treatment and control
locations. Bars on river data are standard error. Wynburn Swamp data are from a
single site. Note that concentrations are shown on a Log10 scale. .............................. 71

xii
Figure 29 Densities of benthic (control and wetland) and pelagic (Escape)
microinvertebrates collected during the October and February return flows
monitoring. Control samples are the mean of two sites located in the Murrumbidgee
River upstream of the Wynburn Escape. Error bars are standard error. Note that
concentrations are shown on a Log10 scale. ................................................................... 73
Figure 30 Average gross primary production (GPP), ecosystem respiration (ER) and
the ratio of primary production to respiration (Prrat) for control (n=2) and treatment
(n=3) sites in the Murrumbidgee River during the two return flow actions. Bars are
standard error. ....................................................................................................................... 74
Figure 31 Locations of larval fish in-channel sampling sites on the Murrumbidgee
River, encompassing Narrandera (The Dairy (DAI), Narrandera (NRD) and Euroley
Bridge (EUB)) and Carrathool (Yarradda (YRR), Bringagee (BRI) and McKennas
(MKR)) hydrological zones.................................................................................................... 81
Figure 32 Larval drift net catch per unit effort (CPUE) across three sampling sites
within each hydrological zone (Narrandera and Carrathool) and six sampling events,
and the associated water level and water temperatures for these zones. Captures of
carp gudgeon and cod species are represented by larvae, and golden and silver
perch by eggs. ....................................................................................................................... 83
Figure 33 Larval light trap catch per unit effort (CPUE) across three sampling sites
within each hydrological zone (Narrandera and Carrathool) and six sampling events,
and the associated water level and water temperatures for these zones. Only
captures of larvae are represented. .................................................................................. 84
Figure 34 Location of fish community sites sampled in 2015 on the Murrumbidgee
River. Data from four Cat 1 sites (McKennas, Bringagee, Birdcage and Yarradda)
were used for this selected area evaluation. .................................................................... 92
Figure 35 Average catch per unit effort (CPUE) per site (+SE) of each fish species
within three zones of the Murrumbidgee River sampled in 2015. The white portion of
the bar for each species represents CPUE of young-of-year recruits, or CPUE of non-
mature individuals for short-lived species that reach sexual maturity within their first
year of life (Table 11). The grey portion of the bar represents CPUE of all other
individuals. .............................................................................................................................. 95

xiii
Figure 36 Average biomass per site (+SE) of each fish species within three zones of
the Murrumbidgee River sampled in 2015. ........................................................................ 98
Figure 37 Length-frequency distributions of the most commonly encountered large
bodied species captured in the Murrumbidgee River in 2015. The dashed line
represents length to denote new recruits (see Table 11). ............................................. 101
Figure 38 Length-frequency distributions of the most commonly encountered small
bodied species captured in the Murrumbidgee River in 2015. The dashed line
represents length to denote new recruits (see Table 11). ............................................. 102
Figure 39 Mean catch per unit effort (CPUE) (±SE) of fish species over the four sample
periods. Note that un-specked hardyhead and golden perch have been excluded
from this figure as there were less than 3 cases. Note the log10 scale. ...................... 104
Figure 40 Length-frequency distributions bony herring. The dashed line represents
length to denote new recruits (see Table 11). ................................................................ 106
Figure 41 Length-frequency distributions carp gudgeon. The dashed line represents
length to denote new recruits (see Table 11). ................................................................ 107
Figure 42 Length-frequency distributions common carp. The dashed line represents
length to denote new recruits (see Table 11). ................................................................ 108
Figure 43 Length-frequency distributions gambusia. The dashed line represents
length to denote new recruits (see Table 11). ................................................................ 109
Figure 44 Length-frequency distributions oriental weatherloach. The dashed line
represents length to denote new recruits (see Table 11). ............................................. 110
Figure 45 Mean species diversity (d)(±SE) within each zone over the four sampling
periods .................................................................................................................................. 119
Figure 46 Change in the percent cover of dominant species between 2010 and
2015. Data is drawn from (Wassens et al. 2011; Wassens et al. 2012b; Wassens et al.
2013a; Wassens et al. 2014b) ............................................................................................. 120
Figure 47 Changes in percentage cover of key amphibious (Casanova 2011) genera
in the Lowbidgee sites from the Nimmie-Caira (Avalon, Eulimbah, Telephone Creek,
Nap Nap)and Redbank (Mercedes, Piggery lake, Two bridges, Wagourah Lagoon).
................................................................................................................................................ 124
Figure 48 Mean (± SE) CPUE of tadpoles (top) and abundance of adult (bottom)
southern bell frogs, Perons tree frog and plains froglet across the four sampling
occasions. ............................................................................................................................. 131

xiv
Figure 49 Mean (± SE) CPUE of tadpoles (top) and abundance of adult (bottom)
barking marsh frogs, spotted marsh frog and inland banjo frog bell frogs................. 132
Figure 50 Maximum number of waterbird species recorded in each survey month in
the three wetland zones in the Murrumbidgee Catchment. Note that much of the
mid-Murrumbidgee zone was dry with only two sites receiving some inflows in
summer 2015. ....................................................................................................................... 139
Figure 51 Mean count of each waterbird functional group (adjusted to birds/ha) in
each survey month across the four wetland zones. Note that the mid-Murrumbidgee
zone did not receive inflows until summer 2015 and this was limited to two sites only.
................................................................................................................................................ 140
Figure 52 Classification and Regression Tree larval Cod species CPUE ....................... 160
Figure 53 Classification and Regression Tree of silver perch eggs and larvae CPUE . 161
Figure 54 Classification and Regression Tree of Golden perch eggs and larvae CPUE
................................................................................................................................................ 162
Figure 55 Classification and Regression Tree of fish eating waterbirds ........................ 163
Figure 56 Classification and Regression Tree of filter-feeding ducks ............................ 164
Figure 57 Total fish numbers in the three zones and four survey occasions ................ 165
Figure 58 Classification and Regression Tree of all fish species CPUE .......................... 166
Figure 59 Classification and Regression Tree of native fish CPUE abundance ........... 167
Figure 60 Classification and Regression Tree of exotic fish CPUE abundance ........... 168
Figure 61 Classification and Regression Tree of frog abundance ................................ 169
Figure 62 Classification and Regression Tree of tadpole abundance ......................... 170

xv
List of tables
Table 1 Summary of Commonwealth environmental watering actions and expected
outcomes. Also see Murrumbidgee Monitoring and Evaluation plan (M&E Plan)(Wassens,
Jenkins et al. 2014) ..................................................................................................................................... 3
Table 2 Murrumbidgee environmental water use by entitlement (updated to 30/06/14)
(Murrumbidgee 2014-15 Water use Acquittal Report) ........................................................................ 6
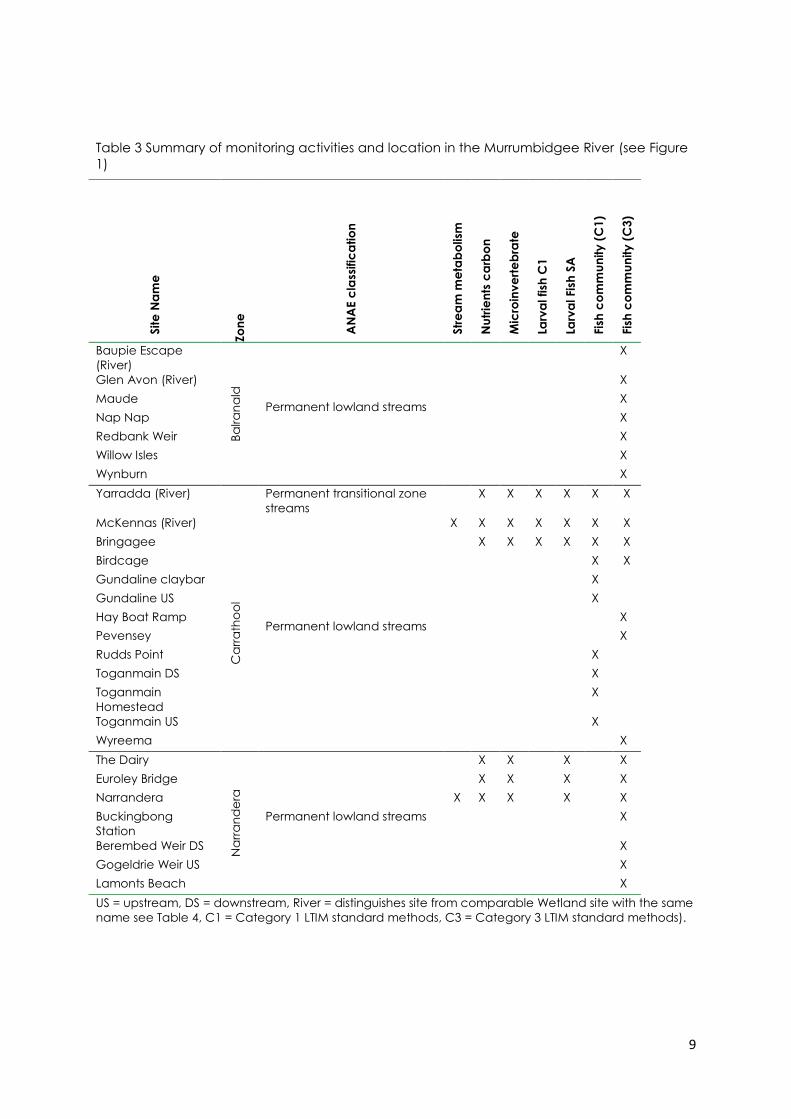
Table 3 Summary of monitoring activities and location in the Murrumbidgee River (see Figure
1) .................................................................................................................................................................... 9
Table 4 Summary of monitoring activities and locations across three wetland zones in the
Murrumbidgee floodplain (see Figure 2 .............................................................................................. 10
Table 5 Wetland sites for which boundaries were produced along with their ANAE data. ..... 14
Table 6 ANOVA results for densities of microinvertebrates, cladocerans, copepods and
ostracods in each zone, microhabitat (benthic vs pelagic) and survey period. ....................... 55
Table 7 ANOVA results for densities of microinvertebrates, cladocerans, copepods and
ostracods in each microhabitat (benthic vs pelagic) and survey period. .................................. 58
Table 8 Summary of return flow and river discharge during the four sample occasions. ......... 68
Table 9 Pseudo-F results from PERMANOVA analyses performed on nutrient, metabolism and
microinvertebrate data. Significance is indicated by *p-perm<0.05, p-perm<0.01, p-
perm<0.001, significant results are shown in bold. ............................................................................. 72
Table 10 Raw (unstandardised) total captures from larval drift nets (LDN) and light traps (LT)
separated by life history (LH) stage and sampling site pooled across all sampling events. ..... 85
Table 11 Size limits used to distinguish new recruits for each species. Values represent the
length at 1 year of age for longer-lived species or the age at sexual maturity for species that
reach maturity within 1 year. ................................................................................................................. 94
Table 12 Contributions of fish species abundance and biomass to variability among zones in
the Murrumbidgee River, determined through SIMPER analysis. Note that only species
contributing ≥10% to changes in community composition are included. .................................... 97
Table 13 Sustainable Rivers Audit (SRA) fish indices (mean ± SE) for each of the three
hydrological zones monitored in the Murrumbidgee River in 2015. ............................................... 99
Table 14 Length-frequency distribution pair-wise comparisons between hydrological zones for
the six most abundant fish species captured in the Murrumbidgee River in 2015. Significant
differences are indicated in bold. ...................................................................................................... 100
Table 15 SIMPER species contributions to differences between the three zones ..................... 103
Table 16 Length-frequency distribution pair-wise comparisons between the the September
and November ( pooled results) and the January-March (pooled sample results) for the six
most abundant fish species captured in wetlands of the Murrumbidgee catchment in 2015.
Bony herring were only recorded in sufficent numbers in 2015 in the mid-Mururmbidgee and
Nimmie-Caira as a result comparisons are Jan 15 - March 15. Significant differences are
indicated in bold. ................................................................................................................................... 105

xvi
Table 17 Summary of dominant vegetation communities and watering regimes across the 12
LTIM monitoring locations. .................................................................................................................... 118
Table 18 Simper comparisons between mid-Murrumbidgee sites containing water (wet) and
dry sites ..................................................................................................................................................... 121
Table 19 Simper comparisons between Nimmie-Caira and Redbank zones in the Lowbidgee
floodplain ................................................................................................................................................. 125

1
1 Introduction
This technical report provides a detailed assessment of ecological outcomes for
each of the indicators monitored under the Murrumbidgee selected area Long Term
Intervention Monitoring Project. Monitoring outcomes are evaluated in the
Murrumbidgee selected area synthesis report.
Environmental Watering actions and objectives 2014-15
Nine water use actions were identified during 2014-15 by the Commonwealth
Environmental Water Holder (CEWO 2014). Four of these actions were implemented
and three were monitored as part of the Mururmbidgee Long-Term Intervention
Monitoring Project in 2014-15 (

2
).
Action 1 – mid-Murrumbidgee River Wetlands (did not proceed)
Action 2 – mid-Murrumbidgee River Wetlands infrastructure assisted delivery
(implemented) aimed to refill wetlands in the mid-Murrumbidgee floodplain
that have infrastructure to allow delivery to these wetlands with the aim of
continued improvement in vegetation condition and provision of habitat for
wetland dependent fauna.
Action 3 – Murrumbidgee River Native Fish Fresh (did not proceed) no
Commonwealth environmental water specifically targeted these flows
Action 4 – mid-Yanco Creek Anabranches and Wetlands (not monitored)
aimed to maintain river red gum and other wetland vegetation by
reconnecting and refilling the anabranch creeks and lagoons located in the
mid-Yanco Creek system.
Action 5 – Restoring natural flow variability (did not proceed)
Action 6 – Lowbidgee wetlands (implemented) aimed to inundate wetlands
on the Lowbidgee floodplain to maintain, improve and potentially recover
wetland vegetation diversity and condition in lignum, black box, river red
gum and associated wetland understorey communities and for the provision
of habitat for wetland dependent fauna.
Action 7 – Western Lakes (not monitored) aimed to inundate wetlands and
lakes located on the western edge of the Lowbidgee floodplain with a focus
on the recovery of riparian and wetland vegetation and provision of
waterbird and aquatic fauna habitat.
Action 8 – Contingency to support significant breeding (not monitored) to
maintain wetland water levels and acceptable levels of water quality to
support the completion of significant waterbird breeding events
Action 9- Murrumbidgee River water quality and habitat - return flows for
2014-15 (implemented) aimed to contribute to maintenance or improvement
of water quality primarily to support native fish condition and reproduction by
returning flows from the North Redbank system.

3
Table 1 Summary of Commonwealth environmental watering actions and expected
outcomes. Also see Murrumbidgee Monitoring and Evaluation plan (M&E Plan)(Wassens et al.
2014a)
Target asset Expected outcomes for 2014-15 Basin Plan (bold) and longer
term objectives (M&E Plan)
LTIM MONITORED SITES/ACTIONS
Yarradda Lagoon
Action 2
Zones
Mid-Murrumbidgee
(Yarradda Lagoon)
Primary
– protect and maintain wetland and riparian
native vegetation
Secondary
– provide feeding habitat for waterbirds,
native fish, other aquatic vertebrates (turtles,
frogs) and invertebrates.
Vegetation diversity
Fish diversity
Waterbird diversity
Other vertebrate diversity
Microinvertebrates
Mid North Redbank and
Return Flows
(only the return flows
were monitored for this
action)
Action 9
Mid North Redbank
- protect, maintain, and in some cases
improve the condition and extent of
floodplain, riparian and wetland native
vegetation
- maintain and improve the diversity and
condition of native aquatic fauna including
fish, waterbirds, frogs, turtles and
invertebrates through maintaining suitable
habitat and providing/supporting
opportunities to move, breed and recruit
– support habitat requirements for waterbird,
frog and native fish
Return flows
- support ecosystem functions, such as
mobilisation, transport and dispersal of biotic
and abiotic material (e.g.
macroinvertebrates, nutrients and organic
matter) through longitudinal and lateral
floodplain-river connectivity
Water quality
Ecosystem function
Biotic dispersal and
movement
Sediment transport
Nutrient and carbon cycling
Microinvertebrates
Yanga National Park
Action 6
Zones
Redbank
(Mercedes, Piggery,
Two Bridges, Waugorah
Lagoon)
Nimmie-Caira
(Avalon, Nap Nap,
Eulimbah, Telephone
Creek)
Primary
- protect, maintain, and in some cases
improve the condition and extent of
floodplain, riparian and wetland native
vegetation
- maintain and improve the diversity and
condition of native aquatic fauna including
fish, waterbirds, frogs, turtles and
invertebrates through maintaining suitable
habitat and providing/supporting
opportunities to move, breed and recruit
– additional water supplied to support
identified waterbird (egret) breeding event
Secondary
– support ecosystem functions
– provide habitat for native fish, frogs and
other vertebrates
– support habitat requirements for waterbird,
frog and native fish
Vegetation diversity
Fish diversity
Waterbird diversity
Other vertebrate diversity
Microinvertebrates

4
Table 1 continued. Summary of Commonwealth environmental watering actions and
expected outcomes. Also see Murrumbidgee Monitoring and Evaluation plan (M&E
Plan)(Wassens et al. 2014a)
SITES/ACTIONS NOT MONITORED AS PART OF LTIM
Upper North Redbank Primary
- protect, maintain, and in some cases
improve the condition and extent of
floodplain, riparian and wetland native
vegetation
- maintain and improve the diversity and
condition of native aquatic fauna including
fish, waterbirds, frogs, turtles and invertebrates
through maintaining suitable habitat and
providing/supporting opportunities to move,
breed and recruit
Secondary
– support ecosystem functions
– support habitat requirements for waterbird,
frog and native fish
Vegetation diversity
Waterbird diversity
Other vertebrate diversity
Waterbird diversity
Fish diversity
Ecosystem function
Sandy Creek Primary
– protect and maintain wetland and riparian
native vegetation
Secondary
– provide feeding habitat for waterbirds
– provide feeding habitat for frogs
Vegetation diversity
Waterbird diversity
Other vertebrate diversity
Waterbird diversity
Juanbung Primary
– water stressed river gum floodplain and
riparian native vegetation
Secondary
– provide feeding habitat for waterbirds
– provide feeding habitat for frogs
Vegetation diversity
Waterbird diversity
Other vertebrate diversity
Waterbird diversity
Paika Lake Primary
– Maintenance of open water habitat for
waterbirds
Secondary
– inundate fringing aquatic vegetation
communities
– Support habitat requirements for waterbird,
frog and native fish
Vegetation diversity
Waterbird diversity
Fish diversity
Waterbird diversity
Yanco Creek Primary
- protect, maintain, and in some cases
improve the condition and extent of
floodplain, riparian and wetland native
vegetation
- maintain and improve the diversity and
condition of native aquatic fauna including
fish, waterbirds, frogs, turtles and invertebrates
through maintaining suitable habitat and
providing/supporting opportunities to move,
breed and recruit
Secondary
– Support habitat requirements for waterbird,
frog and native fish
– provide feeding longitudinal and lateral
connectivity
Vegetation diversity
Other vertebrate diversity
Fish diversity
Waterbird diversity
Biotic dispersal and
movement

5
Water use
The Lowbidgee wetlands in the Nimmie-Caira, north Redbank, south Redbank
(Yanga National Park), and Western Lakes zones as well as the Yanco Creek system,
Yarradda Lagoon and Sandy Creek in the mid-Murrumbidgee wetlands were
targeted for environmental watering during the 2014-15 period of the ecological
monitoring using a combination of environmental water holding entitlements:
Commonwealth Environmental Water (CEW which comprised of General and High
Security (GS and HS) and Lowbidgee and Murrumbidgee supplementary (SUPP)
entitlements), NSW Adaptive Environmental Water (AEW), planned NSW
Environmental Water Allocation (EWA), NSW The Living Murray (TLM) and NSW
Lowbidgee supplementary (SUPP) (Table 2). Watering of the Lowbidgee wetlands
occurred during winter and late spring-summer for the Nimmie-Caira using NSW
environmental water allocations whilst watering to Redbank wetlands occurred from
mid-Spring-through to Winter 2015 using a combination of CEW and NSW allocations.
The mid-north Redbank return flows occurred from Autumn 2014 to Summer 2015.
The Western Lakes were watered during aumtumn/winter 2015 while the mid-
Murrumbidgee watering occurred during summer (Yarradda) and autumn (Sandy
Creek) 2015 (OEH 2015) (Table 2 Figure 6b).

6
Table 2 Murrumbidgee environmental water use by entitlement (updated to 30/06/14)
(Murrumbidgee 2014-15 Water use Acquittal Report)
Water Use Volume (ML)
Wetland
Zone
Start – End
Date
Event Name NSW
AEW
NSW
EWA
NSW
LTIM
CEW
H GS
CEW
H
SUPP
NSW
SUPP
Total
Volume
delivered
(ML)
Nim
mie
-Ca
ira
06/07/14-
30/08/14
Nap Nap Swamp
to Waugorah Ck
630 18565 19195
04/07/14-
30/08/14
Uara Creek to
Yanga
21757
LSAL
21757
04/07/14-
30/08/14
North Caira
Floodways
7849
LSAL
7489
22/10/14-
31/12/14
Kia Lake 10000 10000
20/10/14-
28/02/15
Telephone Bank
Swamp
4930 4930
27/11/14-
28/02/15
Nimmie-Caira
Southern Bell Frog
Wetlands
2000 3113
LSAL
5113
23/03/15-
30/04/15
Nimmie Creek 343 343
Western
Lakes
25/05/15-
25/06/15
Paika Lake 1459 1535 8498 11492
Re
db
an
k
12/08/14-
31/01/15
Mid North
Redbank, return
flows
3136 13204 40000 56340
01/10/14-
30/06/15
Upper North
Redbank
6648 20000 26648
04/05/15-
29/06/15
Juanbung 4667 5688 10355
23/10/14-
31/03/15
Yanga National
Park
6280 19070 70000 4512
LSAL
99862
20/02/15-
13/04/15
South Yanga 7885 5893 13778
Yanco 23/06/15-
30/06/15
Yanco Creek 245 2462 1372 5732
Mid
-Mu
rru
mb
idg
ee
03/12/14-
31/01/15
Yarradda Lagoon 1150 1150
22/03/15-
01/04/15
Sandy Creek 130 250 380
12/09/14-
01/01/15
MIA wetlands 2472 2472
02/12/14-
01/01/15
Coonancoocabil
wetlands
720 720
09/02/15-
08/03/15
Old Man Creek 840 840
10/03/15-
01/04/15
Gras Innes and
Oak Creek
1278 1,278
Commonwealth environmental water contributed to eight watering actions within
the Murrumbidgee Valley in 2014-15. These actions were anticipated to achieve the
following expected outcomes:
protect, maintain, and in some cases improve the condition and extent of
floodplain, riparian and wetland native vegetation
maintain and improve the diversity and condition of native aquatic fauna
including fish, waterbirds, frogs, turtles and invertebrates through maintaining

7
suitable habitat and providing/supporting opportunities to move, breed and
recruit
support the habitat requirements of waterbirds
support the habitat requirements of native fish
support the habitat requirements of other vertebrates
support ecosystem functions, such as mobilisation, transport and dispersal of
biotic and abiotic material (e.g. macroinvertebrates, nutrients and organic
matter) through longitudinal and lateral hydrological connectivity
improve ecosystem and population resilience through supporting ecological
recovery and maintaining aquatic habitat.

8
2 Summary of monitoring activities -Murrumbidgee
Selected Area
Wetlands make up over 4 per cent (370,000 ha) of the Murrumbidgee Catchment,
with over 1000 wetlands identified (Murray 2008). Nationally important wetlands,
including the mid-Murrumbidgee and Lowbidgee floodplain, cover over 208,000 ha
(2.5 per cent of the total catchment area)(Hardwick et al. 2012). Monitoring
activities under the current program are stratified within broad ecological zones
(zones) that represent areas with common ecological and hydrological attributes.
In the Murrumbidgee River, monitoring activities are undertaken within three zones,
Narrandera (187km), Carrathool (358km) and Balranald (241km) (Figure 1). The major
monitoring emphasis is on the Narrandera and Carrathool zones. The LTIM monitoring
program consists of six core monitoring locations in the Murrumbidgee River in the
Narrandera (n=3) and Carrathool (n=3) zones targeting larval fish,
microinvertebrates, nutrients, carbon and Chlorophyll-a, with additional sites making
up the category 1 and category 3 fish community monitoring locations (Table 3; see
Figure 1).
On the floodplain six ecological zones have been identified; the mid-Murrumbidgee
wetlands (82,800 ha), Redbank (92,504 ha), Nimmie-Caira (98,138 ha), Pimpama–
Wagourah (55,451 ha), Fiddlers-Uara (75,285 ha), and Western Lakes (3459 ha)
(Wassens et al. 2014a). Monitoring for the LTIM program includes 12 fixed wetland
sites focused on three zones; the Redbank (n=4), Nimmie-Caira (n=4) and the mid-
Murrumbidgee (n=4) (Figure 2; Table 4). The wetland monitoring program covers
waterbird diversity, vegetation diversity, frogs, fish community, microinvertebrates,
nutrients, carbon and chlorophyll-a with monitoring undertaken four times per year
in September 2014, November 2014, January 2015 and March 2015.
9
Table 3 Summary of monitoring activities and location in the Murrumbidgee River (see Figure
1) Site
Na
me
Zo
ne
AN
AE c
lass
ific
atio
n
Str
ea
m m
eta
bo
lism
Nu
trie
nts
ca
rbo
n
Mic
roin
ve
rte
bra
te
Larv
al fish
C1
Larv
al Fis
h S
A
Fis
h c
om
mu
nity
(C
1)
Fis
h c
om
mu
nity
(C
3)
Baupie Escape
(River)
Ba
lra
na
ld
Permanent lowland streams
X
Glen Avon (River) X
Maude X
Nap Nap X
Redbank Weir X
Willow Isles X
Wynburn X
Yarradda (River) Permanent transitional zone
streams
X X X X X X
McKennas (River)
Ca
rra
tho
ol
Permanent lowland streams
X X X X X X X
Bringagee X X X X X X
Birdcage X X
Gundaline claybar X
Gundaline US X
Hay Boat Ramp X
Pevensey X
Rudds Point X
Toganmain DS X
Toganmain
Homestead
X
Toganmain US X
Wyreema X
The Dairy
Na
rra
nd
era
Permanent lowland streams
X X X X
Euroley Bridge X X X X
Narrandera X X X X X
Buckingbong
Station
X
Berembed Weir DS X
Gogeldrie Weir US X
Lamonts Beach X
US = upstream, DS = downstream, River = distinguishes site from comparable Wetland site with the same
name see Table 4, C1 = Category 1 LTIM standard methods, C3 = Category 3 LTIM standard methods).

10
Table 4 Summary of monitoring activities and locations across three wetland zones in the
Murrumbidgee floodplain (see Figure 2 Site
Na
me
Zo
ne
AN
AE c
lass
ific
atio
n
Nu
trie
nts
, c
arb
on
, c
hl a
Mic
roin
ve
rte
bra
te
Fis
h c
om
mu
nity
(C
3)
Fro
gs
Wa
terb
ird
Div
ers
ity
Ve
ge
tatio
n D
ive
rsity
Gooragool
Lagoon
mid
-Mu
rru
mb
idg
ee
Permanent floodplain wetland X X X X X X
McKennas
Lagoon
Intermittent river red gum
floodplain swamp
X X X X X X
Sunshower
Lagoon
Intermittent river red gum
floodplain swamp
X X X X X X
Yarradda Lagoon Intermittent river red gum
floodplain swamp
X X X X X X
Avalon Swamp
Nim
mie
-Ca
ira
Temporary floodplain lakes X X X X X X
Eulimbah Swamp Temporary floodplain wetland X X X X X X
Nap Nap Swamp Intermittent river red gum
floodplain swamp
X X X X X X
Telephone Creek Permanent floodplain wetland X X X X X X
Mercedes Swamp
Re
db
an
k
Intermittent river red gum
floodplain swamp
X X X X X X
Piggery Lake Permanent floodplain tall
emergent marshes
X X X X X X
Two Bridges
Swamp
Intermittent river red gum
floodplain swamp
X X X X X X
Waugorah
Lagoon
Permanent floodplain wetland X X X X X X

11
Figure 1 Distribution of riverine zones and key monitoring locations in the Murrumbidgee
Selected Area.

12
Figure 2 Distribution of wetland zones and key monitoring locations in the Murrumbidgee
Selected Area

13
3 Ecosystem responses to Commonwealth environmental
water
Southern bell frog at Avalon Swamp November 2014

14
3.1 Ecosystem type
Introduction
Project work associated with Ecosystem Type and Wetland Hydrology have been
closely linked during this first year of the LTIM program. A key objective of this work
has been to define wetland boundaries, which are required to guide much of the
fieldwork and analysis effort. While the Australian National Aquatic Ecosystem
(ANAE) database has been developed using the best available mapping and
attribute data (Brooks et al. 2014) further investigation to map wetlands and
describe their attributes has been necessary to produce accurate descriptions of
Murrumbidgee LTIM wetland field sites (Table 5). All wetland sites selected as field
sites in the Murrumbidgee LTIM were subject to the analysis to ensure a consistent set
of data across all sites.
Table 5 Wetland sites for which boundaries were produced along with their ANAE data.
Zone Vegetation
description Site ANAE ID ANAE Current Type
Re
db
an
k
Flooded
river red
gum forest
open spike
rush
wetlands
Piggery Lake 13317 Pp2.1.1: Permanent floodplain tall emergent
marshes
Mercedes Swamp 13315 Pt1.1.1: Intermittent River red gum floodplain
swamp
Two Bridges Swamp 13314 Pt1.1.1: Intermittent River red gum floodplain
swamp
Wagourah Lagoon 13311 Pp4.1: Permanent floodplain wetland
Nim
mie
-Ca
ira
lignum and
lignum-
black box
with river
red gum
fringing
permanent
creek lines
Avalon Swamp 8048 Lt2.1: Temporary floodplain lakes
Telephone Creek 13396 Pp4.1: Permanent floodplain wetland
Nap Nap Swamp 13397 Pt1.1.1: Intermittent River red gum floodplain
swamp
Eulimbah Swamp 13395 Pt4.1: Temporary floodplain wetland
Mid
-Mu
rru
mb
idg
ee
River red
gum forest
fringing
oxbow
lagoons
McKennas Lagoon 13308 Pt1.1.1: Intermittent River red gum floodplain
swamp
Yarradda Lagoon 33239 Pt1.1.1: Intermittent River red gum floodplain
swamp
Sunshower Lagoon 32870 Pt1.1.1: Intermittent River red gum floodplain
swamp
Gooragool Lagoon 32869 Pp4.1: Permanent floodplain wetland

15
In work completed this year, the wetland boundaries were accurately delineated
using remotely sensed light detection and ranging (LiDAR) data (Digital Terrain
Models, DTMs) and validated with modelled inundation data already produced by
NSW OEH, per the standard method, “If the ecosystem is not mapped then record
coordinates (GDA94) of the centre of the ecosystem and either locate compatible
GIS mapping or delineate the boundary of the ecosystem using remote sensed
data”.
With the wetland boundaries defined, detailed bathymetric maps for each wetland
were derived from the DTM and a series of metrics describing inundation patterns
were developed and will be further validated by ground-truthing in 2015-16. Using
these series, wetland hydrology data products will be produced from depth logger
data collected at each of the twelve LTIM wetland monitoring sites.
3.2 Wetland mapping
In the Murrumbidgee catchment, wetlands vary from large open water lakes and
small oxbow lagoons, with relatively well defined sills and boundaries, to shallow
vegetated swamps and marshes with complex bathymetry and poorly defined
boundaries. Within the oxbow lagoons of the mid-Murrumbidgee zone it is possible to
identify the perimeter of a lake or lagoon from a single date moderate resolution
satellite image such as SPOT-5 and Landsat 7 ETM+. In the Lowbidgee floodplain,
however, the perimeter of an individual wetland is ambiguous and not easily
distinguishable from a single image date, because at any one point in time there is a
mosaic of wetland vegetation types and a gradient of flooding. The presence of
levee banks and regulatory structures also influence flooding patterns.
A LiDAR derived 1m DTM representing a bare earth surface (without buildings or
vegetation) was used as the basis of wetland boundary measurements in the
Murrumbidgee Selected Area. Good quality LiDAR was captured between February
and September 2008 during a very dry period and is available to the project team
through NSW OEH. The spatial accuracy of the DTM is 0.60 m horizontal and 0.15 m
vertical, which provided sufficient accuracy to derive rates of rise and fall to within
0.2 m.
Rough boundary polygons were drawn around wetland areas guided by a
visualisation of the DTM within a Geographic Information System (GIS) incorporating

16
expert knowledge of the system. High elevation areas such as levees or river banks in
addition to natural breaks between adjacent wetland systems were incorporated
into this rough boundary. Using a novel set of algorithms produced using a suite of
software tools (ArcGIS 10.2.2, Python 2.7.5 and R 3.1.3) accurate wetland boundaries
based on the DTM were then determined. The series of procedures was consistent
for every wetland site. The wetland boundaries were validated using images
displaying inundation modelling based on time series of Landsat images, produced
in a completely independent process (Figure 3, Figure 4).
The full set of defined wetland boundaries overlaid on the ANAE wetland boundaries
map are displayed in Figure 5. While a good level of agreement was produced for
some of the wetlands, e.g. Avalon Swamp, and Yarradda Lagoon, a high level of
improvement was produced for many of the areas, particularly those that are
represented within the ANAE as arbitrary circles at the approximate locations of the
wetlands, e.g. Eulimbah Swamp, Nap Nap Swamp and Telephone Creek. These
accurate boundary shapefiles will be utilised in future spatial analyses of wetlands,
including modelling of hydrology metrics.
Further to the validation process, expert knowledge within the team was utilised to
assess ANAE classification types of the 12 wetland areas in conjunction with Landsat
imagery and flood frequency maps. Classification types as currently recorded within
the ANAE were found to be as accurate as could be conveyed (within the
constraints of the system) for all 12 wetland sites.

17
Figure 3 Wetland boundary for Nap Nap Swamp (Nimmie-Caira zone) (black solid line) with
bathymetry (coloured) shown with greyscale digital terrain map and rough boundary (red
solid line).
(a) (b)
Figure 4(a) Wetland boundary for Nap Nap swamp shown with (a) true colour Landsat image
and (b) flood frequency map of the surrounding area.

18
(a)Gooragool Lagoon (b) McKenna’s Lagoon
(c) Sunshower Lagoon (d)Yarradda Lagoon
(e)Avalon Swamp
(f)Eulimbah Swamp
Figure 5 Wetland boundaries derived using a digital terrain model compared to the ANAE
database wetland boundaries.

19
(g) Telephone Creek (h)Nap Nap Swamp
(i) Mercedes Swamp
(j) Two Bridges Swamp
(k) Piggery Lake
(l) Wagourah Lagoon
Figure 5 (cont) Wetland boundaries derived using a DTM compared to the ANAE database
wetland boundaries.

20
3.3 Hydrology
Wetland hydrology - Inundated areas
Nimmie-Caira
Environmental water events using NSW water holding entitlements targetted the
main floodways and wetlands of the Nimmie-Caira in July-August 2014 (see Table 2).
Included in these targets were the LTIM surveyed wetland sites (a) Telephone Creek,
(b) Nap Nap Swamp, (c) Avalon Swamp and (d) Eulimbah Swamp (Figure 6 and
Figure 7)
Figure 6 Distribution of inundated areas derived from Landsat satellite imagery dates in the
Nimmie-Caira wetland zone during environmental watering action periods (August 2014-April
2015) and in relation to surveyed wetlands: insets (a) Telephone Creek (b) Nap Nap Swamp,
(c) Avalon Swamp and (d) Eulimbah Swamp

21
Figure 7 Distribution of inundated areas in the LTIM surveyed wetlands of the Nimmie-Caira
wetland zone (a) Telephone Creek (b) Nap Nap Swamp, (c) Avalon Swamp and (d)
Eulimbah Swamp during environmental watering action periods between August 2014 and
June 2015.
Both Telephone Creek and Nap Nap Swamp were inundated to over 90 per cent of
their wetland boundary during August 2014 with areas in Nap Nap Swamp steadily
receding over the summer months (Figure 8). Telephone Creek was specifically
targetted between October 2014 and Febuary 2015, remaining more than 90 per
cent inundated to the end of January 2015 and at least 50 per cent inundated
during the winter. Avalon Swamp was inundated to almost 50 per cent of its area at
the end of January as a result of environmental watering to Southern Bell Frog
wetlands during the summer months (Table 2). Eulimbah Swamp was inundated to
almost 70 per cent of its area in July-August 2014 as a result of environmental
watering (inundated areas steadily receded to below 20 per cent during October
but increased again to just under 50 per cent of its area by the end of January 2015
as a result of environmental watering )(see Figure 8).

22
Figure 8 Percentage area inundated of the LTIM surveyed wetlands in the Nimmie-Caira
wetland zone of the Lowbidgee during NSW environmental water actions in 2014-15.
Redbank (including return flows)
The mid-North Redbank return flows watering action began mid-August and ended
at the end of January 2015 inundating a cumulative total area of floodplain of 4,452
ha (Table 2 and blue areas in south-west quarter of Figure 9). This was as a result of a
total of 56,340 ML of environmental water entitlements from CEW GS (40,000 ML),
NSW AEW (3,136 ML) and NSW EWA (13,204 ML). In the upper north Redbank a
mostly CEW GS watering action of 20,000 ML combined with 6,648 ML of NSW EWA
inundated a cumulative total area of 2,791 ha between October 2014 and June
2015 (Table 2).
South Redbank (Yanga National Park) was targeted for environmental watering
using a total of 99,862 ML mostly through CEW GS (70,000 ML) usage combined with
CEW SUPP (4,512 ML), NSW AEW (5,611 ML) and NSW EWA (19,739 ML). About a
cumulative 11,870 ha of the Yanga National Park was inundated during the period
from late October 2014 to the end of March 2015 (Table 2 and Figure 9). This
environmental water action inundated the surveyed LTIM wetlands sites Mercedes
Swamp, Two Bridges Swamp and Piggery Lake (Figure 10).

23
Figure 9 Distribution of inundated areas derived from Landsat satellite imagery dates in the
Redbank and Western Lakes wetland zone during environmental watering action periods
(August 2014-June 2015) and in relation to surveyed wetlands: insets (e) Waugorah Lagoon
(f) Mercedes Swamp, (g) Two Bridges Swamp and (h) Piggery Lake (see Figure 10)

24
Figure 10 Distribution of inundated areas in the LTIM surveyed wetlands of the Redbank
wetland zone (e) Waugorah Lagoon (f) Mercedes Swamp, (g) Two Bridges Swamp and (h)
Piggery Lake during environmental watering action periods between August 2014 and June
2015.
Both Two Bridges Swamp and Piggery Lake were almost fully (100 per cent)
inundated by late November 2014 (Figure 11). Piggery Lake retained a 90 per cent
inundated area for six months and in Two Bridges it was for two months steadily
receding over the next four months (Figure 11). In Mercedes Swamp, inundated
area peaked to almost 70 per cent of its boundary in late January 2015 and then
receded steadily over the next six months (see Figure 10 and Figure 11). Whilst
Waugorah Lagoon is located in the Redbank wetland zone, its inundation was as a
result of the Nimmie-Caira environmental watering action (Nap Nap Swamp to
Waugorah Creek) which occurred from July 2014 and August 2014 (Table 2) hence
the largest percentage area inundated (about 40 per cent) in July –August 2014 for
Waugorah Lagoon (see Figure 10 and Figure 11).

25
Figure 11 Percentage area inundated of the LTIM surveyed wetlands in the Redbank wetland
zone of the Lowbidgee from Commonwealth and NSW environmental water during 2014-15.
Western lakes
Paika Lake (and Paika Creek) were targetted for environmental watering in late
May – June 2015 using a combindation of water holder entitlements totalling
11,492ML (8,498 ML CEW general security, 1,459 ML NSW Adaptive Environmental
Water and 1,535 ML NSW The Living Murray) and inundated a cumulative total of 385
ha of wetland area (Table 2 and Figure 9).
Water depths
Water level loggers were deployed across all 12 wetlands. Where practical, depth
loggers were deployed using existing stations which are placed at the deepest point
of the wetlands in locations close to the main inflow locations. In some cases,
deeper locations within the wetlands exist, but were deemed to be too
disconnected from the main inflows to be selected for the depth logger locations.
In the Lowbidgee floodplain (Action 6) across the eight Lowbidgee wetland sites,
two are nominally permanent (Wagourah Lagoon in the Redbank and Telephone
Creek in the Nimmie-Caira zone), with both characterised by areas of deep
26
persistent water with large areas of connected, temporary floodplain. The remaining
sites are seasonally inundated with relatively short inter-flood periods. In 2014-15 the
inundation patterns varied between sites both within and between zones. In
September 2014, three sites, Piggery Swamp, Two Bridges in the Redbank zone and
Avalon Swamp and Eulimbah in the Nimmie-Caira zone were largely dry with small
residual pools (Figure 12). By November all of the wetlands in the Redbank and
Nimmie-Caira zone had received water, with water levels typically declining over
January and March 2015. Yarradda Lagoon in the mid-Murrumbidgee received
water in December 2014 and Gooragool Lagoon intermittently received draining
water from surrounding irrigation areas (see Figure 12). Sunshower and McKenna’s
lagoons in the mid-Murrumbidgee were not inundated during 2014-15.

27
Figure 12 Wetland hydrographs indicating the timing of inundation for individual wetlands as
demonstrated by a rapid rise in water depth.
28
River Hydrology
The Murrumbidgee River is heavily regulated and has a very well developed network
of gauges maintained by NSW DPI Water within the main river channel and key off-
takes (Sinclair Knight Merz 2011). For the purpose of the LTIM program, monitoring
zones within the Murrumbidgee Selected Area were specifically defined with a view
of reducing hydrological heterogeneity and aligning key monitoring activities with
the existing gauge network (Figure 13). Monitoring of water quality, nutrients, larval
fish and microinvertebrates is undertaken within two of these zones; Narrandera and
Carrathool.
Figure 13 Distribution of gauges across the Murrumbidgee selected area.

29
Figure 14 (a) Mean daily discharge in the Murrumbidgee River at Narrandera and Darlington
Point between 1 July 2010 to 30 June 2015 with base flows (dash-dot line) and upper and
lower commence to fill (CTF) levels. Horizontal bars show Commonwealth and NSW
environmental water actions in 2011-12, 2012-13, 2013-14 and 2014-15. (b) Mean daily
discharge in the Murrumbidgee River at Carrathool, Redbank Weir and downstream of
Maude Weir and on the North Redbank Channel at Glendee in relation to the timing of
environmental water delivery to wetland zones Nimmie-Caira (NC), Western lakes (WL) and
Redbank (RB) during survey period (1 July 2014 to 30 June 2015).
Environmental watering actions occurred throughout most of the 2014-15 watering
year (October 2014 to June 2015) which was the third year since widespread

30
flooding during 2012 (Figure 14). The Murrumbidgee flow gauges at Carrathool,
Redbank Weir and downstream of Maude Weir and on the North Redbank Channel
at Glendee show the 2014-15 flow volumes in relation to the timing of environmental
water delivery (Figure 14).
While the shapes of the hydrographs were broadly consistent between the two
monitoring zones, discharge was higher and more variable during the LTIM
monitoring periods between October 2014 and January 2015 (mean 7,844 ML/D, SD
± 1884) within the Narrandera zone than in the Carrathool zone (mean 3,913 ML/D,
SD ± 345)(Figure 15).
Figure 15 River discharge at Narrandera and Carrathool zone from 1 July 2014 to 30 June
2015, vertical lines indicate key in-channel monitoring periods.

31
3.4 Water quality
Outcomes summary
The physiochemical (also abiotic) properties of water are naturally variable over
time, reflecting changes in air temperature, discharge, patterns of wetting and
drying, aquatic photosynthesis and salinisation. Aquatic organisms present within a
wetland are adapted to tolerate a degree of variability in physicochemical
conditions (Poff et al. 1997), however exceeding tolerance limits can cause sub-
lethal impacts (i.e. impaired growth or reproduction) or mortality (Heugens et al.
2001; Bunn et al. 2002). In this manner, water quality is an important covariate
influencing the suitability of habitats for aquatic fauna.
During 2014-15, water quality (physicochemistry) was measured alongside both
wetland fish, frog and nutrient monitoring and river larval fish monitoring.
Environmental water was not specifically targeted at in-channel flows at locations
where annual monitoring was carried out. We expected water quality to improve at
wetland sites where environmental water was delivered.
Key findings
o Environmental watering actions contributed to improved water quality at sites
where residual drying had caused water quality to deteriorate

32
Introduction
The physiochemical (also abiotic) properties of water are naturally variable over
time, reflecting changes in air temperature, discharge, patterns of wetting and
drying, aquatic photosynthesis and salinisation. Aquatic organisms present within a
wetland are adapted to tolerate a degree of variability in physicochemical
conditions (Poff et al. 1997), however exceeding tolerance limits can cause sub-
lethal impacts (i.e. impaired growth or reproduction) or mortality (Heugens et al.
2001; Bunn et al. 2002). In this manner, water quality is an important covariate
influencing the suitability of habitats for native wetland fauna.
Methods
Water quality parameters, temperature (°C), electrical conductivity (EC, μS/cm),
turbidity (NTU), pH and dissolved oxygen (mg/L), were routinely measured in
association with both larval fish monitoring (fortnightly between October 2014 and
January 2015) and wetland monitoring (September 2014, November 2014, January
2015 and March-May 2015). At each site water quality was measured using a
calibrated water quality meter (Horiba U-52G). To capture the range of variability in
wetland dissolved oxygen, dissolved oxygen was measured continuously at ten
minute intervals at each wetland over twelve hours using a dissolved oxygen
datalogger (D-Opto, Zebra Tech).
To determine if return flows significantly increased concentrations of measured water
quality parameters, data were analysed using two-way permutational analysis of
variance (PERMANOVA; Anderson et al. 2008) with zone and trip date as fixed
factors. Data were not transformed prior to analysis. Resemblance matrices
calculated using a Euclidian distance measure. Post-hoc tests were used to further
isolate significant terms, using Monte-Carlo tests where numbers of unique
permutations were low. Results were considered significant at P<0.05. All data
analyses were performed using Primer 6 with PERMANOVA (Primer-E Ltd.).

33
Results
Mid-Murrumbidgee River
All river sites exhibited similar trends with respect to temperature, conductivity,
turbidity and dissolved oxygen. Discharge was higher and water temperature slightly
lower in the upstream Narrandera zone (DAI, NRD, EUB), relative to the downstream
Carrathool zone (BRI, YRR, MKR) (Figure 16). Daily river temperature increased
steadily between October 2014 and January 2015, and was above the threshold for
cod spawning (>16 oC) before sampling commenced on 20 October 2014.
Conductivity was within the expected range of values for inland waters (0.125 –
2.200 mS/cm; ANZECC water quality guidelines (2000)) across all river sites. Values fell
initially, declining until early December 2014 and then increased steadily for the
remainder of the study. It is not clear whether this increase was related to high flow
events (January 2015), reduced flow (February-April 2015) or because both high and
low flows were increasing conductivity. Dissolved oxygen remained high or
saturated throughout the study, declining slowly across time.

34
Figure 16 Time series plots of measured water quality parameters and river discharge (mean
daily flows) at larval fish monitoring sites (fortnightly measurements between 20 October 2014
and 1 January 2015). Shapes indicate sites from the Narrandera (triangle) and Carrathool
(circle) reaches. Additional monthly samples were collected at MKR as part of the Category
1 metabolism monitoring. Discharge measurements are for the gauges at Narrandera and
Carrathool.

35
Wetlands
During late September many wetlands contained residual water from previous years
watering actions. Overall, water quality was highly variable across time and
between sites, reflecting wetland condition, stage of drying and the long-term
hydrological regime of individual wetlands. Turbidity did not differ significantly
among zones (Pseudo-F = 2.6892, P-perm = 0.171), although values were typically
greater in the Nimmie-Caira. High conductivity and turbidity were observed at
Piggery Lake (27/9/14) and, to a lesser degree, Two Bridges Swamp (26/9/14), but
overall there were no significant differences in conductivity between zones (Pseudo-
F = 0.1011, P-perm = 0.894), or over time (Pseudo-F = 0.5971, P-perm = 0.655).
Subsequent environmental flows in early November saw water quality improve at
these sites. Nap Nap Swamp, which was inadvertently partially drained at the end of
November, recorded increased conductivity and turbidity during November and
January. Note that the site was partially rewetted during the intervening period.
Maximum daytime dissolved oxygen did not differ significantly among sites (Pseudo-
F = 2.8704 P-perm = 0.079). Overall, values were typically within the range tolerated
by most aquatic species (i.e. >4 mg L-1), with lower values recorded at Two Bridges
and Mercedes swamps. Minimum night time dissolved oxygen was significantly lower
at in Redbank compared with Nimmie-Caira (Pseudo-F = 5.7968, P-perm = 0.008;
pairwise P-perm = 0.005), becoming hypoxic (<2 mg L-1) for short periods. During the
single sample occasion at Gooragool Lagoon, minimum night time dissolved oxygen
was also hypoxic. As noted in 2013-14, diurnal hypoxia is common in forested
wetlands (Wassens et al. 2014b).

36
Figure 17 Boxplots (showing the full range of variation from minimum to maximum and the
typical value (mean)) of water quality parameters (temperature, conductivity, turbidity,
maximum dissolved oxygen, minimum dissolved oxygen) in wetlands of the mid-
Murrumbidgee, Nimmie-Caira and south Redbank between October 2014 and May 2015.

37
Discussion
Overall, observed water temperatures were lower across sampled wetlands in 2014-
15 than in 2013-14 (Wassens et al. 2014b), reflecting a milder summer. Extreme water
quality conditions (supersaturation of oxygen and high water temperature)
associated with warm weather were less common during the 2014-15 wetlands
sampling.
Providing environmental water to wetlands during 2014-15 led to an improvement of
water quality conditions at sites where residual water was in the latter stages of
drying. Desiccation leads to evapo-concentration of particles in suspension and
dissolved salts or compounds. The increased concentration of salt and particulates
can impact on wetland fauna through increased salinity and turbidity, while
increased nutrient loadings can boost microbial and algal productivity, causing
rapid changes to dissolved oxygen. Piggery Lake and Two Bridges Swamp were in
the latter stages of drying when environmental flows commenced in November
2014, and subsequent watering ameliorated potential impacts to wetland species.

38
3.5 Nutrients, carbon and productivity
Outcomes summary
Concentrations of nutrients, carbon and chlorophyll-a as well as rates of Gross
Primary Production (GPP) and Ecosystem Respiration (ER) are key covariates that
account for variability in primary producers (e.g. photosynthetic algae and plants)
and dependent higher-trophic indicator organisms such as invertebrates and fish
(Wassens et al. 2013a). Flow plays a critical role in supporting ecosystem metabolic
processes both in rivers and wetlands.
Samples of nutrients, carbon and chlorophyll-a were collected fortnightly between
October 2014 and January 2015 at six sites across the Narrandera and Carrathool
zones of the Murrumbidgee River. While in wetlands, concentrations of nutrients,
Dissolved Organic Carbon (DOC) and chlorophyll-a were sampled every 2 months
across ten sites between September 2014 and March 2015.
Relevant objectives relating to environmental water delivery to the Lowbidgee
Floodplain (Action 6) include the provision of habitat to support the survival and
maintain condition of native fish, waterbirds, and other aquatic vertebrates. In 2014-
15 there were no environmental watering actions specifically targeting in-channel or
wetland nutrients, carbon and chlorophyll-a and rates of GPP and ER. However,
environmental water deliveries to the Lowbidgee floodplain contributed to patterns
of in-channel hydrological variability, providing baseline information to help explain
the potential role of environmental flows in maintaining ecological beneficial
concentrations of nutrients, carbon and chlorophyll-a and rates of GPP or ER.
Key findings
o There were two notable peaks in nutrient levels which coincided with
increasing water levels in the Murrumbidgee River. This was explained by
increasing water levels during bulk water deliveries which resulted in the
inundation of dry sediments and the release of nutrients.
o Peak GPP and ER coincided with both freshes and low-flow events in-
channel, suggesting that the frequency of bankside sediment inundation may
be manipulated to promote enhanced productivity outcomes in-stream.

39
o The use of Commonwealth environmental water in the Lowbidgee wetlands
enabled the development of productive wetland ecosystems capable of
supporting diverse food webs, including algae and microinvertebrates that
support biota at higher trophic levels such as fish and waterbirds.
Introduction
Nutrients and carbon (and their chemical forms) are a key factor driving primary
productivity, for example the growth of photosynthetic algae and plants (Kobayashi
et al. 2013). This, in turn, feeds the complex food-web of algae and
microinvertebrates that support biota at higher trophic levels such as fish and
waterbirds. Communities of phytoplankton (diatoms and algae in the water column)
can expand rapidly when temperatures and nutrients increase, driving changes in
food resource availability. As producers of oxygen, changes in phytoplankton
abundance and activity can also affect water quality.
Environmental flows in both rivers and wetlands facilitate chemical and
physicochemical changes in aquatic ecosystems, in turn driving the availability of
nutrients and carbon, as well as the biomass and community composition of
phytoplankton (and other algae) (Robertson et al. 1999b; Kobayashi et al. 2009;
Kayranli et al. 2010). While excessive concentrations of nutrients and carbon can
sometimes contribute to a temporal decline in water quality, the ecological benefits
of environmental water to hydrologically stressed floodplain river systems outweighs
such potential extreme responses (Wassens et al. 2013a; Cook et al. 2015).
Commonwealth environmental watering actions relating to the mobilisation of
nutrients and energy include Actions 6 (watering wetlands in the Lowbidgee system)
“provision of habitat to support the survival and maintain condition of native fish,
waterbirds, and other aquatic vertebrates” and Action 9 (Murrumbidgee River water
quality and habitat). Environmental water was not specifically targeted at in-
channel flows at locations where annual monitoring was carried out, although the
delivery of environmental water to the Lowbidgee floodplain (sensu Action 6) will
have increased flows in the channel.
We expected that where environmental watering has contributed to small in-
channel freshes concentrations of nutrients, carbon and chlorophyll-a, as well as
ecosystem metabolism, would increase and that there would be modest

40
concentrations of C, N and P relative to previous water years. Action 9 is discussed
further in Section 3.7.
Methods
Nutrients, DOC and Chlorophyll-a were sampled fortnightly at six sites within the
Murrumbidgee River; three in the Narrandera Zone (Dairy Reserve, Narrandera and
Euroley Bridge) and three in the Carrathool Zone (Yarradda, Bringagee and
McKenna’s) between 20 October 2014 and 31 January 2015 (see Figure 1). Nutrients,
DOC and Chlorophyll-a were also sampled across three wetland zones – mid-
Murrumbidgee (n=4), Nimmie-Caira (n=4) and Redbank (n=4), with sampling
undertaken on four occasions (September 2014, November 2014, January 2015 and
March 2015)(see Figure 2). Two sites in the mid-Murrumbidgee were dry throughout
2014-15 and as a result water samples were only collected from two of the four
wetlands in this zone.
Methods for nutrient, carbon and chlorophyll-a sampling are described in (Wassens
et al. 2014a). Wetland water samples were analysed for chlorophyll-a, DOC, total
nitrogen and phosphorus. Unlike river samples, wetland nutrients were analysed in
the laboratory using Hach nutrient test kits (Hach Pacific PTY Ltd.).
Ecosystem metabolism was measured using the LTIM Category 1 open-system
method (Hale et al. 2014). Metabolism was measured at one site in the Carrathool
(October – April) and one site in the Narrandera zone (October – January)
concurrent with the larval fish monitoring and as part of the LTIM Category 1 and
Category 3 ecosystem metabolism monitoring. Because of the difference in LTIM
Category 1 and 3 monitoring periods, Category 3 data from Narrandera is only
available for a three month period coinciding with larval fish monitoring in this zone.
Differences in nutrient, DOC and chlorophyll-a concentrations among zones were
tested using a two-way permutational analysis of variance (PERMANOVA, (Anderson
et al. 2008)) with zone and trip number as fixed factors. Distance measures were
calculated using Euclidian distance. Data were not transformed prior to analysis.
Results were considered significant at p<0.05.

41
Results
River sampling – nutrients, carbon and chlorophyll-a
Over the three month sampling period samples from the Narrandera Reach had
higher concentrations of nitrogen (N) (Pseudo-F = 18.906, P-perm = 0.001) and
phosphorus (P) (Pseudo-F = 6.8759, P-perm = 0.001) and occasionally showed lower
concentrations of DOC than the Carrathool Reach (Pseudo-F = 6.2872, P-perm =
0.001). The ratio of nitrogen to phosphorus (see NPrat, Figure 19) is used to estimate
the relative availability of either N or P (Keck et al. 2012). Further examination
showed relatively high N: P ratios for the Murrumbidgee River (2014-15), indicating
that there was relatively less available phosphorus in the Narrandera zone than the
Carrathool zone (Figure 18).
DOC concentrations peaked across all sites in early January 2015, at the end of the
larval fish sampling program, coinciding with increased nitrogen and phosphorus in
the Narrandera reach. This peak in nutrients coincides with increased flow during
January which was more pronounced in the Narrandera zone than in the Carrathool
zone. Although Chlorophyll-a concentration was significantly higher in the
Carrathool zone (Pseudo-F = 7.3995, P-perm = 0.005), there was a high degree of
variability among sites. Overall concentrations were typically lowest at McKenna’s
(MKR) and highest at Yarradda (YRR) river sites, both of which are located in the
Carrathool zone.
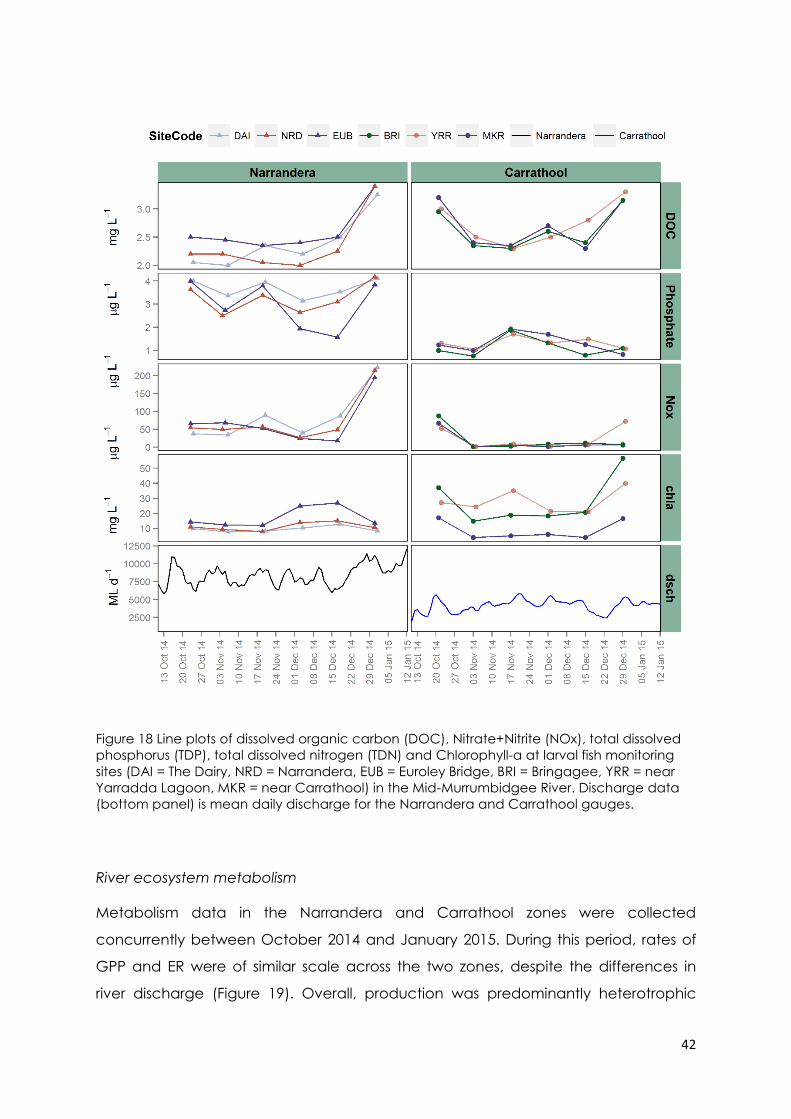
42
Figure 18 Line plots of dissolved organic carbon (DOC), Nitrate+Nitrite (NOx), total dissolved
phosphorus (TDP), total dissolved nitrogen (TDN) and Chlorophyll-a at larval fish monitoring
sites (DAI = The Dairy, NRD = Narrandera, EUB = Euroley Bridge, BRI = Bringagee, YRR = near
Yarradda Lagoon, MKR = near Carrathool) in the Mid-Murrumbidgee River. Discharge data
(bottom panel) is mean daily discharge for the Narrandera and Carrathool gauges.
River ecosystem metabolism
Metabolism data in the Narrandera and Carrathool zones were collected
concurrently between October 2014 and January 2015. During this period, rates of
GPP and ER were of similar scale across the two zones, despite the differences in
river discharge (Figure 19). Overall, production was predominantly heterotrophic

43
indicated by PRrat values of less than one, occasionally shifting briefly to net
autotrophy (late October, late December, mid-January, mid-February) as indicated
by PRrat values greater than one. The overall hydrological regime, which was
truncated by a peak flow event in mid-January, followed by an overall reduction in
flows, corresponded to a net increase in both GPP and ER in the Carrathool zone.
During mid-April 2015 discharge fell further, coinciding with a net increase in
productivity.
Figure 19 Ecosystem metabolism in the Carrathool (blue) and Narrandera (black) zones.
Data are gross primary production (GPP), ecosystem respiration (ER) and the ratio of primary
production to respiration (PRrat). The horizontal line at y=1 on the PRrat panel indicates the
divide between net autotrophic production and net respiration. Discharge data (bottom
panel) are taken from the Narrandera and Carrathool gauging stations.

44
Wetland nutrients, carbon and Chlorophyll-a
There was considerable variation in carbon concentrations and no consistent
differences among wetland zones (Pseudo-F = 0.775, P-perm = 0.548), over time
(Pseudo-F = 0.742, P-perm = 0.653). In general environmental water delivery (Action
6) reduced dissolved organic carbon (DOC), Nitrogen and Phosphorus
concentrations in the Redbank system. High nutrient and carbon concentrations
typically occurred in wetlands during their draw-down phase, either prior to
environmental water delivery in the Redbank system during September 2014, or later
in the season, as in the Nimmie-Caira. Overall chlorophyll-a concentrations mirrored
changes in nutrient and carbon availability, with no consistent differences between
zones (Pseudo-F = 1.438, P-perm = 0.243), or over time (Pseudo-F = 1.221, P-perm =
0.302). However chlorophyll-a peaked higher prior to environmental watering in the
Redbank zone and during draw down in the Nimmie-Caira zone contributing to a
significant interaction between zone and time (Pseudo-F = 3.524, P-perm = 0.029).

45
Figure 20 Box plots (showing the full range of variation from minimum to maximum and the
typical value (mean)) of chlorophyll-a (chla), total nitrogen (TN), total phosphorus (TP) and
dissolved organic carbon (DOC) in wetland sites. Includes all data collected across four
sampling trips to each wetland between October 2014 and May 2015. The number of
samples is determined by the presence of water during sampling in the mid-Murrumbidgee
(Gooragool n=1, Yarradda n=2, McKenna’s n=0, Sunshower n=0), Nimmie-Caira (Avalon n=4,
Eulimbah n=3, Nap Nap n=3, Telephone Creek n=4) and Redbank (Mercedes n=3, Piggery
n=4, Two Bridges n=4, Waugorah n=4).
Discussion
Mid-Murrumbidgee River
There were no direct environmental watering actions targeting in-channel habitats
during 2014-15. Nevertheless, volumes of environmental water delivered to wetlands
(Action 6) and inter-valley transfers are thought to have contributed to the overall
volume, timing and magnitude of flows. Moreover, data collected during 2014-15

46
provides an important benchmark for detecting responses in future years and for
planning future environmental watering actions.
Monitoring during 2014-15 revealed small but significant differences in both the
availability of resources (nutrients and energy) and subsequent ecological processes
between the two sampled river zones. Interestingly, concentrations of nutrients and
chlorophyll-a generally varied in the same direction across sites within each zone
suggesting that controls were operating at the zone scale (i.e. differences in flow,
water temperature, or water quality discussed in Section3.4 ). Flow is a critical driver
of metabolism (Marcarelli et al. 2010; Aristi et al. 2014). Although the observed
patterns appear to broadly coincide with different hydrology both within and
between zones, more data is required to understand the role of flow as a driver of
these processes.
The decline in nutrient concentrations from October to November 2014 was similar to
that observed in results from both 2012-13 and 2013-14 (Wassens et al. 2013a),
indicating that this may be a seasonal trend. The mid-Murrumbidgee contains many
fringing wetlands, riparian zones and flood-runners that can be connected to the
river by natural events, triggering aquatic processes at the water-sediment interface
and within the water-column (Baldwin et al. 2000; Knowles et al. 2012) and
transporting nutrients into the river channel with water returning to the river.
However, the lack of sufficient in-stream flows to engage adjacent riparian and
floodplain habitats during 2014-15 indicates other processes are acting on seasonal
nutrient dynamics.
Production in aquatic ecosystems can be limited by the availability of resources for
production (nutrients and carbon) or by other physicochemical factors including
temperature and light penetration. Overall, nutrient concentrations (especially PO4)
in the Carrathool reach were half that of the Narrandera reach. Phosphate (PO4) is
often reported to limit ecosystem production as is N limitation (Vink et al. 2005; Davis
et al. 2006). Chlorophyll-a concentrations were relatively high in the Carrathool zone
regardless of potential limiting-nutrient controls. This might be due to lower
discharge, and therefore shallower water depth and greater light penetration in the
Carrathool zone than in the Narrandera zone. However, data also shows that within
the Carrathool zone production by algae is consistently low at the MKR site relative

47
to the other two sites, indicating that some of these factors may vary among sites
within zones.
Overall, rates of primary production (carbon produced - GPP) and respiration
(carbon consumed – ER) observed during 2014-15 are less than half that reported for
the Murrumbidgee system by Vink et al. (2005). Vink et al. (2005) found overall low
net heterotrophy but a high contribution of phytoplankton to rates of primary
production in the Murrumbidgee River. They speculated that this was because
floodplain and riparian carbon inputs were either low or not biologically available as
a result of flow regulation. With the low primary productivity observed consistently
during 2014-15, perhaps further detailed studies are warranted to determine if these
different results between the present monitoring and Vink et al. (2005) reflect
different sampling methodologies, site selection, inter-annual variability, or a trend of
decline. Persistently low productivity points to potentially impaired ecosystem
processes that may impact on the entire food web.
Peak GPP and ER were observed in the Carrathool zone during late October 2014,
January and late February 2015, coinciding with both small flow peaks and periods
of low flow. These trends are not as apparent as those in the more variable
Narrandera zone. Rising discharge, even when contained within the channel, could
inundate dry sediment and with sufficient drying between wetting cycles it might
provide small pulses of nutrients. Conversely, low flows may increase light availability
and nutrient retention times (Hilton et al. 2006). Both of these processes are likely to
enhance aspects of ecosystem metabolism. The high flow periods during January
and late February were created by inter-valley transfers. If these kinds of flows are
able to increase rates of basic ecosystem functions, pulsed flows may provide a
means to promote productivity outcomes in regulated systems (sensu Watts et al.
2009).
These findings reveal low rates of production in the Murrumbidgee river overall as
well as important differences in ecosystem structure and function between the two
hydrological zones. With flow as a principal driver of these processes, we expect that
environmental water deliveries can be used for the benefit of riverine biological
communities, even by providing small to moderate freshes, and low flows, to
enhance productivity.
48
Ephemeral wetlands can experience a wide range of nutrient and water quality
conditions stemming from an initial pulse of nutrients upon inundation, milder
conditions as rates of uptake and transformation are stabilised, and through to
extreme conditions at the latter stages of drying due to evapoconcentration. The
hydrological cycle of wetlands creates a window of opportunity for biota to
capitalise on the boom of productivity that results from initial inundation before
declining water quality conditions make wetlands uninhabitable for many species.
During 2014-15, environmental watering of wetlands throughout the Murrumbidgee
Catchment created available wetland habitat through the provision of water, but
also ameliorated declining water quality at sites that were in the advanced stages
of drying. Moreover, at sites such as Nap Nap and throughout Redbank mid-season
top-up flows were able to restore or maintain conditions. Nutrient and DOC
concentrations remained relatively low across all watered sites, and were typically
much lower than those reported for the same sites during 2013-14 (Wassens et al.
2014b). This use of environmental water will have lengthened the time available for
species dependent upon water to complete their lifecycles (for example Sections
3.11 and 3.12)

49
3.6 Microinvertebrates
Outcomes summary
Microinvertebrates play a key role in floodplain river food webs, and respond
strongly to flow pulses and inundation, mediated by antecedent conditions and
season (Jenkins et al. 2003; Jenkins et al. 2007). Microinvertebrate communities were
monitored concurrently with larval fish in the Murrumbidgee River from October 2014
to January 2015, and in wetlands and the river from the Lowbidgee (Nimmie Caira,
Redbank) and mid-Murrumbidgee coinciding with wetland fish and tadpole
monitoring from September 2014 to May 2015. The key objectives of the
Commonwealth environmental watering actions in 2014-15 that relate to
microinvertebrates in wetlands were Action 2 (mid-Murrumbidgee) and Action 6
(Lowbidgee floodplain) to “provide feeding habitat for waterbirds, native fish, other
aquatic vertebrates (turtles, frogs) and invertebrates.” In 2014-15 there were no
targeted in-channel environmental watering actions. However, water deliveries
contributed to hydrological variability, providing baseline information to inform the
use of environmental flows to support food webs and maintain water quality in the
river.
Key findings
o Densities of benthic microinvertebrates in wetlands from the Nimmie Caira
were high in September and again in January 2015 along with the mid-
Murrumbidgee and Murrumbidgee River, while Redbank densities were
highest in November 2014. The high densities in spring relate to rapid
emergence and reproduction following delivery of Commonwealth
environmental water (Action 2 and 6), demonstrating the role of this water in
providing habitat to support the survival and maintain condition of native fish,
waterbirds, and other aquatic vertebrates.
o High peak densities in January 2015 of copepods and cladocerans in the mid-
Murrumbidgee wetlands, Nimmie Caira and Murrumbidgee River
demonstrate the importance of Commonwealth environmental water
providing an ongoing abundant food supply for native fish, filter-feeding

50
waterbirds and other vertebrates such as tadpoles during their critical growth
and reproductive periods.
o In the Murrumbidgee River microinvertebrate densities were higher in the
Carrathool than the Narrandera zone, largely due to the extremely high
densities at the Yarradda and McKennas sites in December (respective peaks
of 4886 and 3991 per litre). Densities above the critical threshold of 100/L to
support larval fish feeding were also observed in the Narrandera zone,
although peaks of copepods only occurred in the Carrathool zone.
Introduction
Microinvertebrate communities comprise a diverse array of taxa and life histories.
Within the microinvertebrates, microcrustacea can dominate biomass and are a
principle source of food for native larval fish in the Murrumbidgee. The density of the
major microcrustacean groups, such as copepods, cladocerans and ostracods can
differ significantly between wetlands and the river channel (Jenkins et al. 2013)
between the benthic (bottom) and pelagic (open water) microhabitats (King 2004),
and over time.
Assessing if microinvertebrate community density and composition differ markedly
between river and wetland habitats can be a useful indicator of the health of the
system and whether there is an adequate supply of prey to support river and
wetland food-webs. By monitoring microinvertebrate communities in river sites
nearby to wetlands, we can assess whether re-connection events lead to mixing of
riverine and wetland communities which may boost riverine productivity.
Commonwealth environmental watering actions relating to the productivity of
microinvertebrates include Actions 2 (infrastructure assisted delivery of water to
wetlands in the mid-Murrumbidgee) and 6 (watering wetlands in the Lowbidgee
system) include the “provide feeding habitat for waterbirds, native fish, other
aquatic vertebrates (turtles, frogs) and invertebrates”. Based on recent
environmental watering of these sites (2013-14), we hypothesised that environmental
water delivered to wetlands would transport microinvertebrates as well as trigger
their emergence and community establishment with densities and community
composition changing overtime in relation to wetland filling and draw-down. We

51
expected there would be modest bursts of microinvertebrate productivity relative to
previous water years.
Environmental water was not specifically targeted at in-channel flows at locations
where annual monitoring was carried out, although the delivery of environmental
water to the Lowbidgee floodplain (sensu Action 6) will have increased flows in the
channel. We hypothesised that environmental flows in late winter, spring and
summer will inundate previously dry habitats in wetlands and also in rivers (i.e.
backwaters, in-channel benches), releasing and transporting nutrients that
stimulates productivity and diversity of microinvertebrate communities. With this in
mind we aimed to detect whether peaks in the density of microinvertebrates are
matched to the timing of peak numbers of fish larvae.
Methods
Microinvertebrate samples were collected fortnightly from the six larval fish sampling
sites along the Murrumbidgee River (three sites in each of the Carrathool and
Narrandera zones) between 20 October 2014 and 1 January 2015 in association with
larval fish monitoring and from 10 wetlands in the lower (Nimmie Caira and
Redbank) and mid-Murrumbidgee over four surveys from September 2014 to May
2015 in association with fish and tadpole monitoring. Three additional river sites were
sampled to coincide with the wetland sampling. A survey was also undertaken in
May 2015 to sample wetlands in the Nimmie Caira that were not accessible in April
2015.
Benthic and pelagic samples were collected following the methods reported in
2012-13 (Wassens, Jenkins et al. 2014). In the laboratory, benthic and pelagic
microinvertebrate samples were poured into a Bogorov tray and enumerated with
the aid of a dissecting microscope (Leica M125) at a magnification of 32x to 80x.
Due to high densities and dense organic matter in many benthic wetland samples
we sub-sampled all samples (wetland and riverine) by dividing Bogorov trays into 44
cells (1.5 x 1.3 cm) and counting and measuring individuals in every second cell (50
per cent of sample processed). Prior to counting every second cell in pelagic
samples we also took a 10 per cent sub-sample due to high densities in wetlands (5
per cent of sample processed). This was done using a 30 mL syringe to draw a
sample from a 300 mL beaker stirred on a magnetic stirrer. Rose Bengal stain was
used in the field (wetland/river sites) and the laboratory (larval fish sites) to highlight

52
individuals in samples with excessive sediment present. Specimens were identified
with relevant guides to species where possible (Williams 1980; Smirnov et al. 1983;
Shiel et al. 1995; Shiel 1995). A maximum of 30 individuals of each taxa per sample
were measured for length and width. Due to observed consistency among the size
of nauplii, these were not measured and an average value was used.
Results
Both river and wetland sites were dominated by three key groups of
microinvertebrates, all microcrustacea: the copepods, cladocerans and ostracods.
Microinvertebrate densities were often higher in wetlands compared to river sites;
however peak river densities in January 2015 at larval fish monitoring sites in the
Carrathool zone of the Murrumbidgee River were as high as those observed in
wetlands.
Microinvertebrates at larval fish monitoring sites
The overall density from the six larval fish sites across six trips (36 samples) was 14,822.
Total microinvertebrate density was significantly higher in benthic than pelagic
microhabitats (Term 2, Table 6), however there was no significant difference
between zones (Term 1, Table 6) or across time (Term 3, Table 6, Figure 21). This trend
was reflected for the three key broad taxonomic groups; cladocerans, copepods
and ostracods (Table 6, Figure 22). Furthermore, the microhabitat trend was
consistent between zones and across time as indicated by the lack of significant
interactions (Terms 4-7, Table 6). The non-significant result for zone and time is likely
due to the influence of the extremely low density in all pelagic samples on the
analysis as well as the site specific high peaks. Despite this there were notable
differences between zones and over time (Figure 21 and Figure 22).
There were high peaks in benthic density (per litre), driven by pulses in copepods,
particularly cyclopoids and nauplii (early (1,355), mid (295) and late (504) December
at Yarradda, and mid (2,684) December 2014 at McKenna’s) and cladocerans,
particularly macrothricids (early December at Yarradda (3450), mid December at
McKennas (1180), late October (183), early November (241) and early December
2014 (798) at DAI) (Figure 21 and Figure 22).

53
Figure 21 Benthic (upper graph) and pelagic (middle graph) microinvertebrate densities (L-1)
for 3 sites in the Narrandera zone (left graphs) and 3 sites in the Carrathool zone (right
graphs) of the Murrumbidgee River sampled from October 2014 to January 2015. Data are
plotted as scatter plots with individual data points for each site comprising a single
composite sample. Benthic and pelagic samples are presented on different scales, with
benthic samples typically exhibiting densities several orders of magnitude greater than
pelagic samples. Discharge (lower graph) is shown for Narrandera and Carrathool gauge.

54
Figure 22 Benthic copepod (upper graph) and cladoceran (middle graph) densities (L-1) for 3
sites in the Narrandera zone (left graphs) and 3 sites in the Carrathool zone (right graphs) of
the Murrumbidgee River sampled from October 2014 to January 2015. Data are plotted as
scatter plots with data points for each site comprising a single composite sample. Discharge
(lower graph) is shown for Narrandera (left) and Carrathool (right) gauge.

55
Table 6 ANOVA results for densities of microinvertebrates, cladocerans, copepods and
ostracods in each zone, microhabitat (benthic vs pelagic) and survey period.
Term Microinvertebrate
density
Cladocera density Copepod density Ostracod
density
F p F p F p F p
1. Zone (ZO) 0.624 0.716 1.302 0.273 1.420 0.188 0.849 0.425
2. Microhabitat (MH) 40.558 0.001 24.148 0.001 18.196 0.001 11.454 0.001
3. Time (TI) 1.102 0.342 1.638 0.059 1.579 0.065 0.908 0.517
4. ZO x MH 0.726 0.647 0.226 0.96 1.042 0.312 0.547 0.618
4. ZO x TI 1.410 0.098 0.847 0.626 1.235 0.235 0.767 0.656
4. MH x TI 1.277 0.16 1.085 0.372 2.379 0.007 1.187 0.331
4. ZO x MH x TI 1.417 0.076 0.652 0.875 1.051 0.392 0.712 0.709
Three taxonomic groups contributed primarily to biovolume (a measure combining
length and width with density); copepods, chydroid cladocerans and macrothricid
cladocerans (Figure 23). Chydorid and macrothricid cladocerans contributed to
biovolume peaks at sites in both Narrandera and Carrathool zones (Figure 23). In
contrast copepods only contributed to peaks in the Carrathool zone, where
biovolume was an order of magnitude greater than contributed by chydorids
(Figure 23).

56
Figure 23 Benthic (left graphs) biovolume (length x width x density) for chydorid cladocerans
(upper graphs) and copepods (middle graphs) and macrothricid cladocerans (lower
graphs) for 3 sites in the Narrandera zone (left graphs) and 3 sites in the Carrathool zone
(right graphs) of the Murrumbidgee River sampled from October 2014 to January 2015.
Microinvertebrates at wetland sites
In the wetland study, a total of 30,657 microinvertebrates from 38 taxa were
recorded from benthic and pelagic habitats from 10 wetlands (103 samples).
Densities of microinvertebrates were significantly different among zones,
microhabitats and over time (Terms 1- 3, Table 7). Trends across time in wetlands
sampled in the Nimmie Caira, mid-Murrumbidgee and Murrumbidgee River differed
to those in the Redbank zone (Figure 24). In the Redbank zone, overall densities,
influenced primarily by copepods and ostracods, peaked in November 2014 and
then declined in January and March 2015 (Figure 24). In contrast, densities peaked
in the other two wetland zones and the Murrumbidgee River (Balranald zone) in

57
January 2015 (Figure 24). High densities were also recorded in the Nimmie Caira in
September 2014 (Figure 24). Densities were significantly higher in benthic habitats
compared to pelagic habitats (Term 2, Table 7).
Copepods made a significant contribution to density (up to 1000 per litre, Figure 24),
however cladocerans were also present in high densities (up to 500 per litre, Figure
24). Densities in the Murrumbidgee River also peaked in January 2015 (Figure 24)
Similarity Percentage (SIMPER) analysis supported findings from the density plots, with
nauplii dominating samples from all zones (39-62%) along with cyclopoids (28-33%).
In the Nimmie-Caira, calanoid copepods (8%), Moina micrura (1.5%) and ostracods
(1.42%) also occurred. A suite of 12 cladocerans (chydorids, daphnids, bosminids,
sidids and macrothricids) also contributed to similarity among samples, albeit less
than 1%. In the mid-Murrumbidgee wetlands, ostracods, sidids and moinids
contributed less than 1% to similarity due to the dominance of nauplii and cyclopoid
copepods. In the Redbank zone, nauplii and cyclopoids dominated samples, with a
suite of 16 taxa (calanoids, ostracods and 14 cladoceran taxa) contributing to
similarity. Although also dominated by nauplii (38.91%) and cyclopoids (29.04%), the
Murrumbidgee River community similarity included Bosmina meriodonalis (11%),
chydorids (7%) and a Macrothricid species Neothrix armata (8%).

58
Figure 24 Boxplots of copepod (first row), ostracod (second row), cladoceran (third row), and
total microinvertebrate (fourth row) benthic densities across time in each zone. Data are
means and standard errors of the four wetland sites (sometimes fewer sites depending on
when wetlands flooded and dried) sampled in each of the three zones (mid-Murrumbidgee,
Nimmie Caira, north Redbank, Redbank and the Murrumbidgee River sites) on each
sampling date.
Table 7 ANOVA results for densities of microinvertebrates, cladocerans, copepods and
ostracods in each microhabitat (benthic vs pelagic) and survey period.
Term Microinvertebra
te density
Cladocera
density
Copepod
density
Ostracod
density
Biovolume
F p F p F p F p F p
1. Zone (ZO) 3.3 0.001 2.075 0.036 4.801 0.001 4.666 0.001 4.164 0.001
2. Microhabitat
(MH)
2.317 0.043 1.74 0.157 1.777 0.117 3.946 0.014 2.827 0.022
3. Time (TI) 1.6 0.015 1.439 0.083 1.543 0.024 0.901 0.589 1.81 0.006
4. ZO x MH 1.206 0.232 1.055 0.39 1.154 0.3 1.949 0.071 1.899 0.028
4. ZO x TI 0.941 0.569 1.546 0.035 1.063 0.357 1.351 0.17 0.943 0.581
4. MH x TI 0.933 0.595 0.775 0.807 1.093 0.305 0.516 0.967 1.171 0.219
4. ZO x MH x TI 0.999 0.476 1.008 0.47 1.341 0.092 0.935 0.512 0.904 0.643

59
Discussion
There were no environmental watering actions directly targeting in-channel habitats
during 2014-15. Nevertheless, volumes of environmental water delivered to the
Lowbidgee wetlands (Action 6) and inter-valley transfers contributed to the overall
volume, timing and magnitude of flows. For example, the peaks in benthic
microinvertebrates at two of the larval fish sites in December 2014 and January 2015
coincided with inter-valley transfers that also matched peaks in chlorophyll-a and
nutrients. However, the largest peaks in microinvertebrate densities were observed in
the Carathool zone where overall discharge was lower and it is likely the January
2015 peak was due to a spike in temperature coupled with lower water levels. This
matches with the peak also being observed in wetlands from the Nimmie-Caira and
mid-Murrumbidgee at the same time. Data collected during 2014-15 provides an
important benchmark for comparison with past years, and detecting responses in
future years. The extremely high densities (>3000 per litre) recorded in the
Murrumbidgee River in December 2014 and January 2015 were unexpected for
riverine habitats.
The differences recorded between the Narrandera and Carrathool zones in
microinvertebrate community composition will help to provide insights into larval fish
recruitment as two of the three primary microcrustacean groups, macrothricids and
cyclopoids are key prey for larval Murray cod (King 2004). Both groups dominated
communities at the Carrathool sites with copepods numbers staying low and stable
across the Narrandera sites. Copepods were the dominant taxonomic group in all
sampled sites (river and wetland) in 2012-13 and 2013-14 (Wassens et al. 2014b) so it
was very surprising to not observe higher densities at Dairy, Narrandera and Euroley
sites. In the Murrumbidgee River, despite a shorter targeted sampling season in 2014-
15 (36 samples) the overall density from the six larval fish sites (14,822) was almost
triple the density in 2013-14 (50 samples) (Wassens et al. 2014b).
In wetlands, Commonwealth environmental water (Action 6) contributed peaks in
microinvertebrate densities in January 2015 in the Nimmie-Caira, and Lowbidgee
River, but not in the Redbank zone. It is likely that high temperatures in January
contributed to increased productivity in wetlands, although it is not clear why the
Redbank wetlands did not show this pattern. The peak in the Lowbidgee River sites
matches peaks observed in the independently sampled larval fish riverine sites.

60
Wetlands receiving Commonwealth environmental water via infrastructure in the
mid-Murrumbidgee (Action 2) had similar densities of microinvertebrates as those in
the Lowbidgee floodplain (Nimmie-Caira) and were higher than wetlands in the
Redbank zone, indicating that the mode of water delivery has little impact on
microinvertebrate density or diversity.
Environmental watering of the mid-Murrumbidgee and Lowbidgee systems in 2014-
15 facilitated ecosystem functioning, enhancing habitat suitability for high
ecological value species that rely on wetland food-webs.

61
3.7 Return flows
Outcomes summary
During 2014-15, parts of the north Redbank system were inundated with
Commonwealth environmental water (Action 6 and Action 9). A proportion of these
flows were allowed to flow back into the river (called “return flows”) from a regulator
located approximately half way between Redbank Weir and Balranald (the
Wynburn Escape). This use of environmental water aimed to “support ecosystem
functions, such as mobilisation, transport and dispersal of biotic and abiotic material
(e.g. macroinvertebrates, nutrients and organic matter) through longitudinal and
lateral floodplain-river connectivity”. We expected that this use of environmental
water would augment riverine nutrient and carbon concentrations and possibly
promote changes in ecosystem processes. Monitoring focussed on quantifying the
transfer of nutrients and microinvertebrates from wetlands into the Murrumbidgee
River and detecting subsequent ecological responses.
Return flows were delivered as two separate actions, one in October 2014, and the
other in February 2015. Each return flow was monitored on four separate occasions
(Before, During 1, During 2, After).
Key findings
o River discharge levels were high during both the return flows, and as a result
the nutrient levels in water being returned from wetlands was rapidly diluted
upon entering the river. The small release volumes, and short release intervals
of the return flows made it difficult to detect ecological responses
immediately downstream of the return flow point.
o Nevertheless we detected an increase in phosphate and DOC for up to 3km
downstream of the return flow in the Murrumbidgee River.
o We recommend return flows aim to increase dissolved organic carbon
concentrations to above 6 mg L-1 in the river to trigger metabolism responses
in the river.

62
Introduction
Returns flows are a means of replicating the two-way transfer of water, nutrients
energy and biota between rivers and floodplain that historically occurred during
moderate to high flows along the Murrumbidgee River (Page et al. 2005; Frazier et al.
2006). The ecological benefits of river-floodplain connections stem from
complementary processes that operate in both rivers and wetlands. Rivers provide
the necessary flows and seeding of water-dependent species (e.g. fish) that
reproduce in wetlands. These biota are then transferred along with nutrients and
carbon in energy to augment populations and processes in the river (Ward et al.
2001; Sheldon et al. 2002; Lyon et al. 2010).
The outcomes of return flows are influenced by three key factors: the condition of
the floodplain, timing of initial inundation and subsequent releases, and the volumes
of water leaving the wetlands relative to the discharge rates in the river. The
condition of the floodplain is particularly important and is influenced by the flooding
history (Jenkins and Boulton 2007), land-use and the degree of leaf litter
accumulation. This in turn influences the amount of carbon and nutrients released
during inundation (Robertson et al. 1999a) and the quality of vegetation
communities including the presence of rhizomes and seedbanks (Capon et al. 2006)
which can conversely determine rates of nutrient uptake and storage. These aspects
determine the suitability of habitat for floodplain fauna, as well as egg banks which
influence the density and composition of microinvertebrates across the floodplain
(Jenkins and Boulton 2007). Managing environmental water to restore connectivity
between wetlands and the river enables nutrient and carbon-rich water released
from accumulated leaf litter and woody debris to move from the floodplain into the
river (i.e. “return flows”), recreating some aspects of lost river-floodplain connectivity
on a small scale.
This section describes the outcomes of two small experimental return flows released
from the north Redbank wetland complex to the Lowbidgee River in 2014-15 under
Action 9. These flows were released to “support ecosystem functions, such as
mobilisation, transport and dispersal of biotic and abiotic material (e.g.
macroinvertebrates, nutrients and organic matter) through longitudinal and lateral
floodplain-river connectivity”. We expected that this use of environmental water
would:

63
- Increase nutrient concentrations downstream of the escape relative to
upstream control sites
- Reduce nutrient and carbon concentrations within the wetland
Depending on whether this resource provisioning was enough to stimulate
productivity in the river then we might also expect:
- Increased ecosystem metabolism through the addition of limiting nutrients,
increasing the concentration of water column chlorophyll-a and increasing
rates of primary production and respiration at downstream control sites
- Increase the density and species richness of microinvertebrate taxa in benthic
habitats of the Murrumbidgee River downstream of the escape relative to
upstream control sites
We evaluated these outcomes and discuss our findings with regard to ecological
outcomes and the potential management implications of similar events in the future.
Methods
Location
During 2014-15, return flows were released from the Wynburn escape as two discrete
actions, one during October 2014 and the other during February 2015. The Wynburn
escape regulator is perched within a levee on the northern bank of the
Murrumbidgee River near Balranald, NSW (Figure 25). It is constructed from concrete,
containing four 1.84m wide bays each with wooden boards that can be removed to
manipulate weir height. Discharge rates from the Wynburn escape can be
controlled by changing the height of the Wynburn Escape regulator or by adjusting
inflow rates into the wetland complex from any of multiple regulators along the north
Redbank canal.
Study design
Each of the 2014-15 return flows followed a separate strategy. During the October
2014 release the wetland was surcharged with environmental water, with releases
commencing after boards were removed from the Wynburn Escape on 8 October,
2014. Discharge rates from the Wynburn Escape were maintained by providing
constant inflows of environmental water, with return flows lasting for approximately 3
weeks. Flows in the river at this time were approximately 1,300 ML d-1.

64
The February 2015 return flow coincided with reduced river discharge (mean flow =
460 ML d-1), and was intended to drain water from the wetland complex without
top-up flows. High densities of macrophytes growing in the wetland at this time
restricted outflow volumes and the action was ceased after approximately 1.5
weeks due to insufficient water.
Monitoring of both return flows was conducted across six sites (Figure 25). One site
was located within Wynburn Swamp, in the North Redbank system, immediately
behind the Wynburn escape. Five river sites were located in the adjacent
Murrumbidgee River, two upstream and three downstream of the Wynburn Escape.
River sites were spaced at 1km intervals with the first downstream site located 1km
downstream of the escape point to allow for adequate mixing (D. Baldwin, pers.
com.). Sites were monitored once before (Before) each release, twice during
(During 1 and During 2), and once after (After). Samples were collected at
approximately fortnightly intervals during October and weekly during the shorter
release in February.
Prior to the October return flow, dissolved oxygen dataloggers (D-Opto, Zebra Tech)
were deployed at each of the six sites, monitoring dissolved oxygen and water
temperature continuously at ten minute intervals for the duration of each release
period. A single depth logger (UD-20-1, Hobo Pacific) was deployed in the wetland
immediately behind the regulator. Dissolved oxygen data were collected to
evaluate the risk of a hypoxic blackwater event in the Murrumbidgee River
associated with return flows and to calculate daily rates of ecosystem metabolism
following methods described in Section 3.5 Nutrients, carbon and productivity.
On each sample occasion, duplicate water samples were collected and later
analysed for water nutrients, chlorophyll-a and DOC following the methods
described in Section 3.5 and water quality were collected following the methods
described in Section 3.4 Water Quality. Benthic microinvertebrate samples were
collected and processed following the methods described in Section 3.6
Microinvertebrates. Discharge in the escape canal was estimated on each sample
occasion using an electromagnetic flow meter (Marsh McBirney Flow Mate 2000).

65
Data analysis
Metabolism data were affected by flow height changes, particularly during the
second shorter return flow, and data were only available for approximately 60 per
cent of days. Average rates of GPP and ER were calculated from all available data
for 1 week prior to each sample occasion, except for the During 1 sample for the
February release which was only 4 days after the previous sample.
Data were analysed using two-way permutational analysis of variance to determine
if return flows significantly increased concentrations of dissolved nutrients, DOC,
chlorophyll-a, microinvertebrates and rates of metabolism (PERMANOVA; Anderson
et al. 2008). Treatment (upstream control vs downstream treatment) and trip date
(Before, During 1, During 2 and After) were fixed factors. Resemblance matrices for
nutrient data were calculated using a Euclidian distance measure, Bray-Curtis
dissimilarity was used for microinvertebrate data. Data for each return flow were
analysed separately. Post-hoc tests were used to further isolate significant terms,
using Monte-Carlo tests where numbers of unique permutations were low. Results
were considered significant at P<0.05. Nutrient data were not transformed prior to
analysis, microinvertebrate data were log x+1 transformed to reduce the influence
of dominant species. All data analyses were performed using Primer 6 with
PERMANOVA (Primer-E Ltd.).

66
Figure 25 Sites monitored during the 2014-15 return flows. Treatment sites (n=3) are located
downstream if the junction between the escape canal and the Murrumbidgee River. Control
sites are located upstream (n=2). An additional site is located within the wetland
immediately behind the Wynburn Escape. Environmental water was delivered by inundating
the North Redbank wetland complex by providing inflows from the North.

67
Plate 1 The Wynburn Escape regulator photographed from the wetland (left of frame). The 50
m long escape canal is to the right of frame. The weir structure is overarched by a disused
bridge. Wooden boards are used to regulate weir height. At this time the escape was
approximately 15cm below spill-height.
Results
Release volumes
Wynburn Swamp was filled leading up to October 2014, reaching peak height
during late September (at approximately 1.25m). At this time the weir leaked a small
amount of water, estimated at less than 2 ML d-1. The first release commenced on 8
October 2014, with initial discharge rates estimated at approximately 90 ML d-1 on 8
October. At this time discharge in the receiving river was 1098 ML d-1, with wetland
water comprising ~ 7 per cent of river water below the release point. Return flows
were later decreased to protect the bankside levee, and remained at
approximately 3 per cent of river volume for the duration of the action (Table 8). The
total use estimated for the first release was 1,800 megalitres.
Multiple weir height changes meant that discharge during the second release
cannot be interpolated to unsampled discharges. Measured values ranged up to 49
ML d-1, falling sharply without top-up flows. These weir height changes are reflected
in the stepped profile of depth data seen in Figure 26. An increase in depth following

68
the cessation of flows on 13 February 2015 indicates that recharge rates were slower
than release rates.
Table 8 Summary of return flow and river discharge during the four sample occasions.
Release
number Sample date
Sample
occasion
Escape
discharge
River
discharge
% return flow
contribution to
river discharge
Release 1
October 2014
1/10/2014 Before 1 1349 0.0
14/10/2014 During 1 65.8 1126 2.9
21/10/2014 During 2 77.2 1074 3.6
12/11/2014 Before 1 1196 0.0
Release 2
February 2015
2/02/2015 Before 0 884 0.0
7/02/2015 During 1 49.4 578 4.3
13/02/2015 During 2 9.2 442 1.0
17/02/2015 After 0 462 0.0

69
Figure 26 Water depth in Wynburn Swamp measured in the canal below the Wynburn
Escape and discharge in the Murrumbidgee River between September 2014 and March
2015. Areas highlighted in blue indicate approximate beginning and end times of Release 1
and Release 2. Vertical lines show monitoring dates. Depth data was recorded hourly.
Discharge is mean daily flow, adapted from the NSW Water Info website (http://waterinfo.nsw.gov.au/).
Continuous water quality monitoring
Dissolved oxygen in Wynburn swamp ranged between hypoxic and saturated,
varying with diurnal cycles and temperature, reducing slowly across time (Figure 27).
Temperature increased across time in both the river and wetland, with peak
temperatures during early January and at times through February. Persistent daytime
hypoxia (DO <2mg L-1) was only observed in the wetland during the hot period in
January and late February when the wetland drew down. However, overall values
decreased below 4mg L-1 from December 2014 onwards. Dissolved oxygen levels in
the river were more stable, with little diurnal variability becoming more variable as
flow rates declined during early February.

70
Figure 27 Water temperature and dissolved oxygen concentration at river (control and
Treatment) and wetland sites during the October and February return flows. Data are
recorded at 10 minute intervals, with fluctuations caused by daily cycles. Areas highlighted in
blue indicate approximate beginning and end times of Release 1 (October 2014) and
Release 2 (February 2015). Vertical lines show monitoring dates.
Nutrient and carbon concentrations
Overall, nutrient and chlorophyll-a concentrations were greater in the wetland than
adjacent river habitats (without replicate wetland sites this cannot be tested; Figure
28). Wetland phosphate concentrations were highest in October 2014 but had
declined by February 2015. DOC and chlorophyll-a concentrations both appeared
higher in February than October.
On 14 October 2014 there was a spike in oxidised nitrogen (NOx) concentration
across all river sites, but not in the wetland. Peak NOx has been observed at
Murrumbidgee River sites during past monitoring (Wassens et al. 2014b).
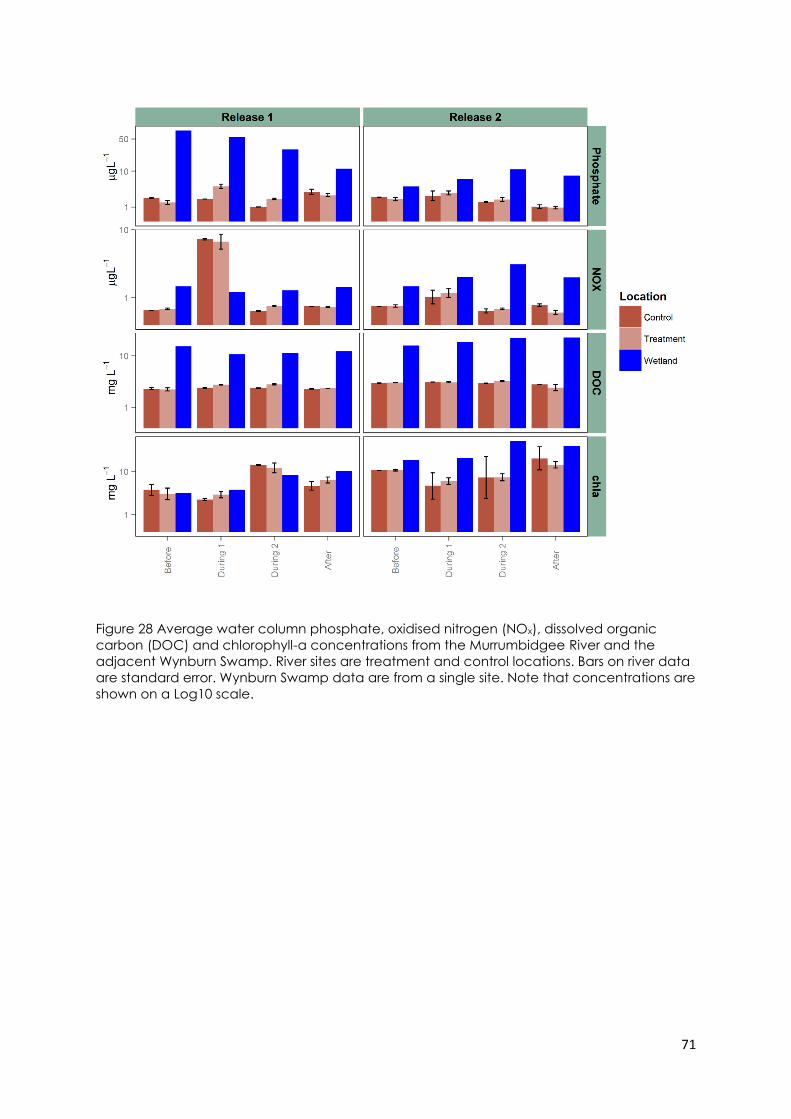
71
Figure 28 Average water column phosphate, oxidised nitrogen (NOx), dissolved organic
carbon (DOC) and chlorophyll-a concentrations from the Murrumbidgee River and the
adjacent Wynburn Swamp. River sites are treatment and control locations. Bars on river data
are standard error. Wynburn Swamp data are from a single site. Note that concentrations are
shown on a Log10 scale.

72
Table 9 Pseudo-F results from PERMANOVA analyses performed on nutrient, metabolism and
microinvertebrate data. Significance is indicated by *p-perm<0.05, p-perm<0.01, p-
perm<0.001, significant results are shown in bold.
Phosphate (PO4) was significantly more concentrated at treatment compared with
control sites on the two sample occasions during Release 1 (Table 9, pairwise P(MC)=
0.048 and 0.006 respectively; Figure 28). During Release 1 DOC was significantly more
concentrated at treatment compared with control sites on occasions During 1,
During 2 and After (Table 9, pairwise P(MC)= 0.015 , 0.016 and 0.031 respectively).
Though significant, the magnitude of differences (approximately 0.4 mg L-1) is
relatively small. No other interactions among treatment and trip number were
significant for either return flow (Table 9).
Benthic microinvertebrate communities
Community composition and densities of benthic microinvertebrates did not differ
significantly between treatment (downstream escape) and control (upstream
escape) sites across time during either release (Figure 29, Table 9). There appeared
to be higher total densities of chydorids, copepods and ostracods at treatment
Release # Return flow #1
October 2014
Return flow #2
February 2015
Model
Term Treat. Trip#
Treat.
X
Trip#
Treat. Trip#
Treat.
X
Trip#
Phosphate 5.910* 12.581*** 10.343** 0.235 10.269** 0.568
NOx N/A 40.778*** 0.034 0.002 7.939** 0.85
DOC 11.062** 7.5862** 4.228* 0.007 3.642* 1.333
Chlorophyll-a 0.049 41.394*** 0.46 0.7 3.074 0.383
Microinvert. Community
data 1.1222 2.190** 0.543 0.693 1.599* 0.59
Total Microinv. density 3.285* 3.762* 1.351 0.875 1.349 1.113
GPP <0.001 2.458 0.027 0.464 0.636 0.074
ER 0.084 1.437 0.046 0.763 0.943 0.166
Prrat 0.704 6.472** 0.225 0.120 2.851* 0.360

73
compared with control sites during 1 and after release 2. However, these differences
were not statistically significant. Conversely, during Release 1 there were significantly
higher densities of microinvertebrates at control sites (Table 9, Figure 29).
Figure 29 Densities of benthic (control and wetland) and pelagic (Escape)
microinvertebrates collected during the October and February return flows monitoring.
Control samples are the mean of two sites located in the Murrumbidgee River upstream of
the Wynburn Escape. Error bars are standard error. Note that concentrations are shown on a
Log10 scale.
Ecosystem metabolism
Overall, rates of gross primary production (GPP) and ecosystem respiration (ER) were
higher during February 2015 than October 2014. The ratio of primary production and
respiration differed significantly among sample occasions within each of the two

74
releases (Prrat, Figure 30). The Prrat was significantly lower at During 1 than During 2
and after for the first release (P-perm = 0.039 and 0.004 respectively) and significantly
than the Before sample for release 2. Lower. There was no significant difference in
GPP between treatment and control sites were observed during either release
(Table 9). Ecosystem respiration appeared to increase relative to GPP during the
latter stages of the February return flow. Though this trend was not significant, this
may be due to insufficient data.
Figure 30 Average gross primary production (GPP), ecosystem respiration (ER) and the ratio
of primary production to respiration (Prrat) for control (n=2) and treatment (n=3) sites in the
Murrumbidgee River during the two return flow actions. Bars are standard error.

75
Discussion
Managed return flows from the North Redbank wetland complex in 2014-15
contributed to increased phosphate and DOC in the adjacent river which
coincided with wetland water discharged during the October return flow. No
differences were observed during the February return flow and this is largely due to
much lower P concentration in the wetland following the extended period of
inundation, and the proportionally small volumes of water released during the
second return flow.
Downstream of the escape, the return flows contributed less than 7 per cent to total
river discharge at any time during either release. Despite the small release volumes
we detected an increase in riverine DOC and P. During October phosphate more
than doubled at downstream treatment sites, with differences were detected as far
as three kilometres downstream of the release point. There were no differences in
riverine DOC and Phosphate during the February release largely because the
concentrations in the wetlands were substantially reduced, possibly as a result of the
first return flow in October.
Ecological responses to return flows in the Murrumbidgee River are likely to scale with
the degree of nutrient enrichment. In this case the small volumes of water release
relative to the total river volume, meant that while significant differences in DOC
and Phosphate were achieved, the concentrations were not sufficient to drive a
measurable increase in productivity downstream of the release. In the Murray River,
Cook et al. (2014) reported a two-fold increase in GPP and a five-fold increase in ER
after unmanaged flooding across large areas of floodplain in 2011 that was
associated with an increase in river DOC concentrations from ~2 mg L-1 prior to the
release up to 5-6 mg L-1. During the present study, DOC concentration only
increased by approximately 0.4 mg L-1. There is a similar range of baseline carbon
concentrations (~2-3 mg L-1 DOC) in the Murray and Murrumbidgee Rivers and their
associated wetlands (10-15 mg L-1 DOC), suggesting an increase in DOC input, at
the right time of year, will elicit a response in the Murrumbidgee River. The
magnitude of this increase will depend on wetland DOC concentrations (which in
the North Redbank system can be as high as 36 mg L-1), discharge volumes (40-90
ML d-1) and river volumes (as low as 450 Ml d-1). We conclude that elevating riverine

76
DOC concentrations to the response range identified by Cook et al. (2015) (>5 mg L-
1) using small, managed releases is achievable in the Lower Murrumbidgee River.
Ecosystem responses to return flows (differences between treatment and control
sites for metabolism, chlorophyll-a or microinvertebrates) were not significant during
this study, although patterns indicate potential differences between control and
treatment sites during the February return flow. During the second release both
metabolism (GPP, ER) and microinvertebrate densities were higher in downstream
treatment sites compared to controls. It is possible that a key nutrient was added via
return flows, stimulating productivity even after the release had ended. However,
during the return flow in February there was a considerable fall in discharge,
coinciding with increased temperature that triggered an overall increase in
productivity in the channel that was not attributed to return flows. Control and
treatment reaches may have been responding differently to this change in flow
height in response to an unmeasured covariate (i.e. water depth, shading).
Although microinvertebrate responses were not significant during this study,
microinvertebrate densities, like nutrients, were recorded at lower densities than
observed previously. During 2013-14, Wassens et al. (2014b) reported average
benthic microinvertebrate densities in the North Redbank wetland complex of
approximately 200 individuals per litre, ranging above 1000 individuals per litre.
During 2014-15 densities in Wynburn Swamp were much lower, not exceeding 60
individuals per litre. Although the lower densities could reflect spatial variability within
the wetland, it appears most likely that microinvertebrates had an overall decrease
in the magnitude of response to flooding as the nutrient and carbon concentrations
were similarly reduced. Higher densities of microinvertebrates in the wetland are
more likely to see increased densities in the river associated with return flows.
Lessons learnt
The use of return flows to benefit riverine food webs hinges on better understanding
the existing impacts and constraints acting on ecosystems in regulated floodplain
rivers. There is evidence that productivity in the Murrumbidgee is relatively low (Vink
et al. 2005) and that providing nutrients can improve rates of ecosystem production
(Baldwin et al. 2014; Cook et al. 2015). However, the scale of intervention needed to
reintroduce the necessary productivity to support river food webs is not yet known. In
the Lower Murrumbidgee River system, return flows with a larger effect size could be

77
implemented by timing releases to coincide with peak nutrient and
microinvertebrate densities in wetlands, and with lower river volumes.
The 2014-15, return flows contributed to the removal of carbon and nutrients from
the North Redbank wetlands. While small inputs of nutrients and carbon are
beneficial, high levels of nutrient and carbon accumulation on the floodplain can
result in adverse water quality conditions, including persistent daytime hypoxia
(Wassens et al. 2014b). Our results suggest that successive years of watering has led
to a reduction in the amount of dissolved and available nutrients in floodplain
habitats culminating in an improvement in water quality conditions. The removal of
nutrients and carbon during the 2014-15 return flows is likely to have further
contributed to this improvement, lessening the magnitude of increased DOC and
reduced dissolved oxygen observed during the onset of warmer weather in February
2015.

78
3.8 Fish reproduction and larval fish
Outcomes summary
Flow plays a critical role in the early life-cycle of native fish, and aspects including
the duration, magnitude and timing of flows strongly influence adult spawning and
subsequent survival and growth of larvae. Six in-channel larval fish sampling events
were undertaken fortnightly between 20 October 2014 until 1 January 2015 at three
sites in each of two hydrological zones (Narrandera and Carrathool) in the
Murrumbidgee River. There were no direct in-channel environmental watering
actions targeting fish reproduction or recruitment undertaken in 2014-15. However,
environmental water deliveries to the Lowbidgee floodplain (Actions 6 and 9)
contributed to patterns of hydrological variability in the Murrumbidgee River,
providing baseline information to inform how environmental flows can be delivered
to support food webs and maintain water quality in the river.
Key findings
o At least seven native fish species (Australian smelt Retropinna semoni, carp
gudgeon Hypseleotris spp., golden perch Macquaria ambigua, Murray cod
Maccullochella peelii, silver perch Bidyanus bidyanus, trout cod
Maccullochella macquariensis and un-specked hardyhead Craterocephalus
stercusmuscarum fulvus) and two alien species (common carp Cyprinus
carpio and redfin perch Perca fluviatilis) spawned in the Murrumbidgee River
in 2014-15.
o Larval fish catches were dominated by cod (Maccullochella spp.; November
peak) and Australian smelt (November peak).
o Based on egg captures, multiple spawning events occurred for both golden
(November and December) and silver perch (December only). Golden perch
larvae were also captured.

79
Introduction
The larval stage is the most critical and vulnerable part of a fish’s life history. Larval
fish survival is highly dependent on hydrology which influences habitat availability
(Copp 1992), water temperature (Rolls et al. 2013), dispersal (Gilligan et al. 2003),
microinvertebrate abundance for first feed (King 2004) and increased nest site
inundation (Baumgartner et al. 2014). Commonwealth environmental water
allocations targeted to maintain hydrological conditions to support native fish
species have the capacity to positively influence reproductive opportunities for fish,
resulting in greater larval survival, and hence, increased recruitment to the wider
population. Understanding the critical links between flow, fish spawning and larval
fish survival can assist the management of environmental flows to support and
enhance native fish populations.
Use of a specifically designed hydrograph that targets groups of fish species based
on similar reproductive strategies could benefit different species in a given water
year (Devries et al. 1998; Baumgartner et al. 2014). For example, increased flows may
inundate river or wetland habitat needed by small-bodied generalist species or
large-bodied nesting species for reproduction, while also releasing nutrients and
increasing productivity of microinvertebrates, a key prey item for the first feed of all
species of native fish (Devries et al. 1998). Alternatively flow peaks may be used to
trigger reproduction directly in flow-dependant species such as golden (Macquaria
ambigua) and silver perch (Bidyanus bidyanus) (King et al. 2009b). This study aimed
to determine the seasonal timing of reproduction of native fish species within the
Murrumbidgee Catchment, and the biotic and abiotic factors associated with early
survival of fish larvae. The results represent the first year of a five year monitoring
program, although previous monitoring using similar methods and sites has occurred
over the preceding two years (Wassens et al. 2013a; Wassens et al. 2014b).
Methods
Larval fish were collected using methods described by Wassens et al. (2014). Larval
fish sampling was undertaken at six riverine sites, with three sites selected within each
of two hydrological zones (Figure 31). Eight larval drift nets and ten quatrefoil light
traps were set overnight at each riverine site. Equipment and methods were
consistent with those described by (Hale et al. 2014) with the exception that five
additional larval drift nets were set at each site to adequately detect commonly

80
encountered larvae such as Murray cod (Maccullochella peelii). Sampling was
undertaken fortnightly from 20 October 2014 until 1 January 2015, resulting in six
sampling events at each of the six sites. Eggs were live-picked and enumerated from
drift net samples in the field, and a subset of these were hatched in river water at
ambient temperatures so that larvae could subsequently be identified to species in
the laboratory. With the exception of juvenile Murray River crayfish (Euastacus
armatus) and freshwater yabby (Cherax destructor), entire samples collected from
both light traps and drift nets were preserved in 90 per cent ethanol for later
laboratory identification using keys described in (Serafini et al. 2004).
A sub-sample of 50 larvae hatched from live-picked eggs (comprising both golden
and silver perch) representing all possible combinations of sites and sampling events,
were submitted to the Australian Genome Research Facility (AGRF). Nucleic acid
extraction and subsequent verification of species assignment was based on dual-
direction sequencing following polymerase chain reaction (PCR) amplification.
Genetic assignment of golden and silver perch generally conformed to laboratory
identification based on morphological characteristics, and species assignment to
egg captures was scaled for each site and trip based on the ratios of hatched and
identified larvae. A sub-sample of ten larval cod (Maccullochella spp.) captured in
light traps from the Narrandera zone during the first two sampling events were also
submitted to AGRF to differentiate between Murray cod and trout cod
(Maccullochella macquariensis) captures, as both species occur within this zone. All
samples were confirmed to be Murray cod. Although, given that drift net samples
were not submitted for DNA, and represent the predominant method of capture,
samples were pooled at the genus level (i.e. (Maccullochella spp.) due to difficulties
with species identification, as per previous short-term intervention monitoring
(Wassens et al. 2013a; Wassens et al. 2014b).
Data were standardised to a single value per species, site, sampling event and
method (i.e. total catch for each species from a site was pooled by sampling
method) and are represented as catch per unit effort (CPUE; number of larvae per
light trap hour or the number of larvae per cubic metre of water filtered). Juveniles
and adults were excluded from analysis and reporting. Daily stream gauging data
from Narrandera (NSW DPI Water gauge 410005) and Carrathool (gauge 410078)
was used to represent daily water level changes in respective hydrological zones.
Water temperature was only available from the Narrandera gauge and this was also

81
used to represent water temperature in the Carrathool zone. Point measurements of
water quality (including water temperature) were also recorded at the time of
sampling and these are reported when presenting individual site results. To
determine differences in larval fish, CPUE between zones and over time data were
analysed using a two-way fixed factor (with zone and sampling event as factors)
Permutational Multivariate Analysis of Variance (PERMANOVA; Anderson et al.,
2008). Raw data were initially fourth root transformed and the results used to
produce a similarity matrix using the Bray-Curtis resemblance measure. All tests were
considered significant at P < 0.05.
Figure 31 Locations of larval fish in-channel sampling sites on the Murrumbidgee River,
encompassing Narrandera (The Dairy (DAI), Narrandera (NRD) and Euroley Bridge (EUB)) and
Carrathool (Yarradda (YRR), Bringagee (BRI) and McKennas (MKR)) hydrological zones.
Results
A combined total of 3,028 eggs, larvae, juvenile and adult fish were collected during
the 2014-15 sampling. Catches comprised at least seven native fish species
(Australian smelt Retropinna semoni, carp gudgeon Hypseleotris spp., golden perch,
Murray cod, silver perch, trout cod and un-specked hardyhead Craterocephalus
stercusmuscarum fulvus) and two alien species (common carp Cyprinus carpio and
redfin perch Perca fluviatilis) (Table 10). Additionally, early stage juvenile Murray
River crayfish and freshwater yabby were captured in drift nets. Cod species were
captured in the greatest abundance (n=809), and occurred at all combinations of

82
sites and using both methods. Australian smelt larvae were also abundant (n=506)
and were captured at all sites, although in light traps only. Both silver perch and
golden perch eggs were captured in both hydrological zones using drift nets. Silver
perch eggs were captured at all sampling sites and in a higher abundance (n=619)
than golden perch eggs (n=397) which were captured at three sites. Golden perch
larvae (post-flexion stage estimated at ~10–20 days post-hatch) were captured at
The Dairy (n=1) and Narrandera (n=41) sites in the Narrandera zone only.
Catch per unit effort of larvae and eggs differed significantly between hydrological
zones (Pseudo-F1,24 = 9.568, P <0.001), among sampling events (Pseudo-F5,24 = 10.409,
P <0.001), and between sampling events within zones (Pseudo-F5,24 = 4.077, P <0.001).
Distinct peaks were evident in the timing of collection of larvae and eggs of most fish
species in 2014-15. Carp gudgeon larvae were only sampled in the Carrathool zone,
and captures peaked in mid-late December when water temperatures exceeded
21 oC (Figure 32 and Figure 33). Conversely, cod species larvae captures peaked on
19–21 November 2014 in the Narrandera zone (water temperature range 20.8–21.3
oC) and 3–5 November 2014 in the Carrathool zone (20.6–21.5 oC) (Figure 32 and
Figure 33). Australian smelt captures exhibited multiple peaks in both hydrological
zones (Figure 33). Redfin perch larvae were only captured in the Carrathool zone,
once at Yarradda and once at Bringagee (Figure 33). Common carp larvae were
captured in both hydrological zones, although only at the beginning of the study
(Figure 33).
Silver perch eggs were collected from all sites in the Narrandera zone, and captures
peaked on 3 December 2014 (water temperature 23.1–23.5 oC; Figure 32). In the
Carrathool zone, silver perch eggs were also collected from all three sites, peaking
on the 1–2 December 2014 (25.1–25.8 oC; Figure 32). No silver perch larvae were
captured. Golden perch eggs were collected from one site (The Dairy) in the
Narrandera zone on the 20 November 2014 (20.8 oC), 4 December 2014 (23.3 oC)
and 18 December 2014 (24.4 oC) (Figure 32). Additionally, larvae in the post-flexion
stage were collected using light traps from two sites on the 19–20 November 2014
(Figure 33). In the Carrathool zone, golden perch eggs were collect from two sites
(Bringagee and McKennas) on the 17 November 2014 (21.5 oC; Figure 32). Golden
perch larvae were not captured in the Carrathool zone.

83
Figure 32 Larval drift net catch per unit effort (CPUE) across three sampling sites within each
hydrological zone (Narrandera and Carrathool) and six sampling events, and the associated
water level and water temperatures for these zones. Captures of carp gudgeon and cod
species are represented by larvae, and golden and silver perch by eggs.

84
Figure 33 Larval light trap catch per unit effort (CPUE) across three sampling sites within each
hydrological zone (Narrandera and Carrathool) and six sampling events, and the associated
water level and water temperatures for these zones. Only captures of larvae are
represented.

85
Table 10 Raw (unstandardised) total captures from larval drift nets (LDN) and light traps (LT) separated by life history (LH) stage and sampling site
pooled across all sampling events.
Hydrological zone
Narrandera Carrathool
The Dairy Narrandera Euroley Bridge Yarradda Bringagee McKennas
Species LH stage LDN LT LDN LT LDN LT LDN LT LDN LT LDN LT
Fish
native species
Australian smelt larvae 63 47 35 225 23 113
juveniles/adults 55 40 13 73 28 27
carp gudgeon larvae 1 71 31 1 11
juveniles/adults 14 1 1 1 4 2 60 2 9
cod species larvae 34 78 36 38 18 25 42 53 141 35 237 72
juveniles 1
golden perch eggs 48 330 19
larvae 1 41
silver perch eggs 84 172 264 75 6 18
trout cod juveniles 1
un-specked hardyhead juveniles/adults 1
unidentified eggs 5 16 10 7 18 6
larvae 83 20 2
alien species
common carp larvae 1 16 1
juveniles 1 2 1 9 1 6
redfin perch larvae 1
juveniles 1
Other
Murray River crayfish juveniles 2 3 2
freshwater yabby juveniles 1 1 3 1 5

86
Discussion
No targeted in-channel environmental watering occurred in the Murrumbidgee
River in 2014-15. Nevertheless, positive identification of spawning through the
capture of eggs, larvae and juveniles of at least seven native species of fish in 2014-
15, encompassing both the Narrandera and Carrathool hydrological zones,
represented an increase in the number of native species in comparison to previous
in-channel monitoring during short-term intervention projects. For example, in 2013-
14 Australian smelt, carp gudgeon and cod (Maccullochella spp.) larvae were
captured at in-channel sites, but no silver or golden perch were recorded (Wassens
et al. 2014b). Flat-headed gudgeon (Philypnodon grandiceps) larvae were
collected from wetland habitats in 2013-14, although sampling of these habitats did
not occur in 2014-15. In 2012-13 during targeted in channel environmental water
deliveries, Australian smelt, carp gudgeon and cod (Maccullochella spp.) larvae
were captured at in-channel sites (Wassens et al. 2013a). River blackfish (Gadopsis
marmoratus) larvae were also captured in 2012-13, although capture occurred at a
site (Berry Jerry) upstream of the current sampling range (Wassens et al. 2013a).
The timing of larval capture in 2014-15 was generally consistent with data from
previous short-term intervention monitoring projects, with respect to the collection of
cod species, Australian smelt and carp gudgeon (Wassens et al. 2013a; Wassens et
al. 2014b). Larval cod species have been the most abundant species captured over
the past three years of sampling in the Murrumbidgee River, demonstrating
consistent peaks in captures from early-mid November in all years (Wassens et al.
2013a; Wassens et al. 2014b). This synchronisation is an indication of consistent
spawning responses to broad stimuli such as temperature or day length, and is
characteristic of equilibrium species (King et al. 2013). The majority of larval cod
captured, both in this and the previous two short-term intervention monitoring
projects in the Murrumbidgee River, have been at either the post-flexion (~12 days
post-hatch) or more commonly metalarva (~16 days post-hatch) developmental
stage, at which point yolk-sac absorption has generally occurred and exogenous
feeding has commenced (Rowland 1983). Subsequently, while spawning may be
occurring independently of hydrological conditions, survival and growth from this
point forward relies on adequate densities of appropriate food resources. In 2014-15
microinvertebrate densities peaked in early December (up to almost 5000 per litre),

87
but there were densities above 100–200 per litre in the Narrandera zone in early
November when the catch of Murray cod larvae peaked (see Section 3.6).
Spawning of golden and silver perch occurred in both hydrological zones during
2014-15. While the collection of unidentified fish eggs occurred in both 2013-14 and
2012-13, spawning of these species has not been identified during previous
monitoring (Wassens et al. 2013a; Wassens et al. 2014b). Given the short hatch times
of both species (~ 36 hrs; Rowland (1983) ,Rowland (1984)) and generally discrete
spawning events, we would assume that fortnightly sampling underrepresents the
level of spawning intensity that occurred in 2014-15 in the Murrumbidgee River. A
high density of suitable prey was available to golden perch in the Carrathool zone in
December 2014 (see Section 3.6), as early stage larvae generally feed on small
cladocerans (Arumugam et al. 1992). However, silver perch larvae generally feed on
rotifers at first feed, and while rotifers were likely captured in the current study, their
abundance in samples was not quantified.
Both golden and silver perch have been observed to spawn and recruit during
within channel flows, and across a broader range of water temperatures than
originally thought (Humphries et al. 1999; Mallen-Cooper et al. 2003; Balcombe et al.
2006; Roberts et al. 2008; Ebner et al. 2009). However, the triggers that stimulate
within channel spawning remain contentious. For example, spawning of both
species has occurred independently of any discernible river level rise and at stable
bankfull summer irrigation flows in the Murray River (e.g. Gilligan et al. (2003); King et
al. (2005); Koster et al. (2014)). Interestingly, Zampatti et al. (2015) reported spawning
of golden perch from October-December 2013 in the Goulburn, mid and lower
Murray and lower Darling rivers coinciding with both the rising and descending limbs
of the hydrograph. Although, recruitment occurred only from the lower Murray and
Darling spawning events, and the fate of fish spawned in the remaining locations
remains unresolved (Zampatti et al. 2015). Recent evidence suggests long-distance
movements of juveniles may support extant populations where free-passage occurs,
or where barriers to passage are drowned out on high flow events e.g. (Zampatti et
al. 2015). This mechanism of dispersal is unlikely in the Murrumbidgee River given that
the large number of weirs without fishways limit passage and population mixing.
Subsequently, recruitment must therefore be occurring within the Murrumbidgee
River to support adult populations of both species, although the drivers of

88
recruitment, as well as key locations supporting juveniles, remain unknown and
represent an important knowledge gap that requires further investigation.

89
3.9 Fish communities
Outcomes summary
Two key Commonwealth environmental watering actions relating to fish
communities in the Murrumbidgee Catchment in 2014-15 were Actions 2 (mid-
Murrumbidgee wetlands) and Action 6 (watering wetlands in the Lowbidgee
system). Fish communities in three wetland zones (Nimmie-Caira, Redbank and mid-
Murrumbidgee) were sampled on four occasions in 2014-15 (September, November,
January and March). In-channel fish communities were sampled once in March 2015
across three river zones (Narrandera, Carrathool and Balranald).
Key findings
o Ten native species and four alien species were captured across three
hydrological zones in the Murrumbidgee River and in the three wetlands
zones in 2014-15. Zone differences were evident in species richness, and
species-specific abundance, biomass and size structure, although not for all
pairwise zone comparisons.
o Recruitment was evident in a number of native species. In the Murrumbidgee
River, Murray cod recruits were more abundant in the Carrathool zone, and
this potentially corresponds to the higher food resources available to larvae
at first feed in this zone compared with Narrandera. Despite spawning of
golden and silver perch in both the Narrandera and Carrathool zones, only
one silver perch recruit was captured (Carrathool zone) and no golden perch
recruits were captured.
90
Introduction
Native fish communities in the Murrumbidgee Catchment are severely degraded,
exhibiting declines in abundance, distribution and species richness (Gilligan 2005).
Further, alien species (specifically common carp Cyprinus carpio) have been
reported as occupying up to 90 per cent of the total biomass in some areas (Gilligan
2005). In addition, small-bodied floodplain species such as the Murray hardyhead
(Craterocephalus fluviatilis), southern pygmy perch (Nannoperca australis), southern
purple-spotted gudgeon (Mogurnda adspersa) and olive perchlet (Ambassis
agassizii) were historically abundant from Murrumbidgee River wetland habitats
(Anderson 1915; Cadwallader 1977) but are now considered to be locally extinct
from the mid and lower Murrumbidgee (Gilligan 2005).
River regulation has significantly contributed to native fish declines in the
Murrumbidgee Catchment. Reductions in the frequency and duration of small-
medium natural flow events prevent regular connections between the river and off-
channel habitats (Arthington et al. 2003). Loss of connectivity has reduced
permanent off channel habitats and prevented dispersal between river and
floodplain habitats, also resulting in a loss of natural flow cues for in-channel species.
The use of Commonwealth environmental water to restore more natural flow
characteristics can benefit native fish by proving cues that stimulate reproductive
behaviour, or by providing access to suitable breeding habitats and nursery areas
and maintaining off channel habitats e.g. (King et al. 2009a; Beesley et al. 2014).
Appropriate delivery of environmental water can also result in increased riverine
productivity, food resources (i.e. microinvertebrates) and water quality, as well as
facilitate longitudinal and lateral connectivity and dispersal (Koehn et al. 2014).
Positive changes in native fish species richness, abundance and biomass are then
predicted to occur.
The key Commonwealth environmental watering actions that relate to fish
communities in the Murrumbidgee Catchment in 2014-15 were Actions 6 (watering
wetlands in the Lowbidgee system). Specifically, the objective of Action 6 was to
provide wetland habitat to support the survival, and maintain condition, of native
fish, waterbirds, and other aquatic vertebrates. Environmental water was not
specifically targeted for riverine fish communities in 2014-15, although the delivery of
environmental water to the Lowbidgee floodplain (Action 6) contributed to an

91
increase in water levels downstream of Darlington point (Carrathool Zone). We
predicted that the changes in the river water levels produced during the delivery of
environmental water to floodplain wetlands in the Lowbidgee floodplain would
support native fish communities through the provision of appropriate water quality
and access to suitable habitats. In wetlands, we predicted that Action 6 would
provide reproduction and recruitment opportunities for native fish.
This monitoring program focused on benchmarking the fish community composition
(species richness, abundance and biomass) across river and wetland LTIM
monitoring sites and, where relevant, elucidates specific responses to
Commonwealth environmental water delivery.
Methods
Riverine fish
Fish community sampling was undertaken in February and March 2015. Data was
collected from 17 Murrumbidgee River sites spanning three hydrological zones
(Narrandera, Carrathool and Balranald; Figure 1). Sampling sites and methods
followed those in the Murrumbidgee Monitoring and Evaluation Plan for LTIM
Category 3 (Wassens et al. 2014a). Additionally, data collected from four sites
(Mckennas, Bringagee, Birdcage and Yarradda) as part of the Basin-Scale
evaluation (Hale et al. 2014) was subsampled for the first 12 electrofishing operations
(comparable effort to Category 3 methods), and bait trap captures were also
included.

92
Figure 34 Location of fish community sites sampled in 2015 on the Murrumbidgee River. Data
from four Cat 1 sites (McKennas, Bringagee, Birdcage and Yarradda) were used for this
selected area evaluation.
Data analysis
Three Sustainable Rivers Audit (SRA) fish community indicators (Nativeness,
Expectedness, Recruitment) and an overall Fish Condition Index were calculated for
each hydrological zone to quantify overall condition of the fish community
assemblage. Data were first portioned into recruits and non-recruits. Large-bodied
and generally longer lived species (max. age >three years) were considered recruits
when length was less than that of a one-year-old.
Small-bodied and generally short-lived species that reach sexual maturity in less than
one year were considered recruits when length was less than average length at
sexual maturity. Recruitment lengths were derived from published scientific literature
or expert opinion when literature was not available (Table 11).
Calculation of Sustainable Rivers Audit (SRA) fish indices.
Eight fish metrics were calculated using the methods described by (Robinson 2012).
These metrics were subsequently aggregated to produce three indicators
(Nativeness, Expectedness and Recruitment), and to derive an overall fish
community condition index. Metric and indicator aggregation used Expert Rules
analysis in the Fuzzy Logic toolbox of MatLab (The Mathworks Inc. USA) using the rule

93
sets developed by (Davies et al. 2010). Expectedness represents the proportion of
native species that are now found within the relevant catchment and altitudinal
zone, compared to a historical reference condition. This value is derived from two
input metrics; the observed native species richness over the expected species
richness at each site, and the total native species richness observed within the zone
over the total number of species predicted to have existed within the zone
historically (Robinson 2012). Nativeness represents the proportion of native
compared to alien fishes, and is derived from three input metrics; proportion native
biomass, proportion native abundance and proportion native species (Robinson
2012). Recruitment represents the recent reproductive activity of the native fish
community within each hydrological zone, and is derived from three input metrics;
the proportion of native species showing evidence of recruitment at a minimum of
one site within a zone, the average proportion of sites within a zone at which each
species captured was recruiting (corrected for probability of capture based on the
number of sites sampled), and the average proportion of total abundance of each
species that are new recruits (Robinson 2012). Aggregation of individual metrics into
relevant indicators was undertaken using the expert rule sets (Carter 2012). The three
indicators were subsequently aggregated to generate a weighted overall Fish
Condition Index (Carter 2012). Overall condition can be partitioned into five equal
categorical bands to rate the condition of the fish community as; “Good” (80–100),
“Moderate” (60–79), “Poor” (40–59), “Very Poor” (20–39), or “Extremely Poor” (0–19).
To determine differences in fish communities among hydrological zones, abundance
and biomass data were analysed separately using one-way fixed factor
Permutational Multivariate Analysis of Variance (PERMANOVA Anderson et al.
(2008)). Raw data were initially fourth root transformed and the results used to
produce a similarity matrix using the Bray-Curtis resemblance measure. All tests were
considered significant at P < 0.05. Where significant differences were identified, pair-
wise post-hoc contrasts were used to determine which zones differed. Similarity
percentage (SIMPER) tests were used to identify individual species contributions to
average dissimilarities between zones.
To determine differences in the length-frequency distributions (size-structure) among
hydrological zones, species-specific length distributions were analysed using two-
sample Kolmogorov-Smirnoff tests. These tests were only performed on the six most
abundant species when catches within a hydrological zone consisted of >20

94
individuals. The significance level for each comparison was set by dividing P = 0.05
by the number of comparisons for that species (i.e. 0.05 / 3 zones = 0.017 for all
species except bony herring as these were only captured in two hydrological zones)
(Neumann et al. 2007).
Table 11 Size limits used to distinguish new recruits for each species. Values represent the
length at 1 year of age for longer-lived species or the age at sexual maturity for species that
reach maturity within 1 year.
Species Estimated size at 1 year old or at sexual maturity (fork or total
length)
Native species
Australian smelt 40 mm (Pusey et al. 2004)
bony herring 67 mm (Cadwallader 1977)
carp gudgeon 35 mm (Pusey et al. 2004)
river blackfish 80 mm
golden perch 75 mm (Mallen-Cooper 1996)
Murray cod 222 mm (Gavin Butler, Unpublished data)
Murray-Darling rainbowfish 45 mm (Pusey et al. 2004: for M. duboulayi)
silver perch 75 mm (Mallen-Cooper 1996)
trout cod 150 mm
un-specked hardyhead 38 mm (Pusey et al. 2004)
Alien species
common carp 155 mm (Vilizzi et al. 1999)
gambusia 20 mm (McDowall 1996)
goldfish 127 mm (Lorenzoni et al. 2007)
oriental weatherloach 76 mm (Kun et al. 2009)
Results
Riverine fish
A total of 1,041 fish comprising ten native and three exotic species were captured
across 21 river sampling sites. This included three species listed as threatened (trout
cod (Maccullochella macquariensis) (endangered; Fisheries Management Act,
EPBC Act), silver perch (Bidyanus bidyanus) (vulnerable; Fisheries Management Act,
critically endangered; EPBC Act), Murray cod (Maccullochella peelii) (vulnerable;
EPBC Act)). Bony herring (Nematolosa erebi), common carp, Australian smelt
(Retropinna semoni) and carp gudgeon (Hypseleotris spp.) were the most abundant
species in the river sites (Figure 35). Less commonly recorded species with <10
individuals recorded during surveys included un-specked hardyhead
(Craterocephalus stercusmuscarum fulvus), trout cod, silver perch and river blackfish
(Gadopsis marmoratus). Un-specked hardyhead were captured at one site in each
hydrological zone. Trout cod were captured in the Narrandera zone only, at

95
Berembed and Dairy sites. Silver perch were captured at one site within each zone.
River blackfish were captured only at Berembed in the Narrandera zone.
Figure 35 Average catch per unit effort (CPUE) per site (+SE) of each fish species within three
zones of the Murrumbidgee River sampled in 2015. The white portion of the bar for each
species represents CPUE of young-of-year recruits, or CPUE of non-mature individuals for
short-lived species that reach sexual maturity within their first year of life (Table 11). The grey
portion of the bar represents CPUE of all other individuals.

96
The fish community assemblage differed significantly in abundance among
hydrological zones (Pseudo-F2,18 = 4.722, P <0.001; Figure 35). SIMPER analysis
indicated that the observed differences among zones were primarily driven by
variability in the abundance of bony herring, Australian smelt, carp gudgeon, Murray
cod and Murray-Darling rainbowfish, and contributions to differences were zone-
specific (Table 12). Pair-wise tests indicated that the abundance of the assemblage
was significantly different between Narrandera and Carrathool (t=2.559, P=0.001)
and Narrandera and Balranald (t=2.572, P<0.001), although not between Carrathool
and Balranald zones (t=1.221, P=0.194).
Common carp, Murray cod, golden perch (Macquaria ambigua) and bony herring
contributed the greatest overall biomass in 2015, with an average biomass per site
(and average percentage contribution) of 10,933 ± 1,644 g (64 ± 4%), 4,518 ± 1,645 g
(16 ± 4%), 1,465 ± 276 g (11 ± 2%) and 595 ± 267 g (7 ± 3%), respectively (Figure 36).
Biomass of the assemblage was significantly different among hydrological zones
(Pseudo-F2,18 = 8.217, P < 0.001). SIMPER analysis indicated that the observed
differences among zones were primarily driven by variability in the biomass of Murray
cod, bony herring, golden perch and common carp, and contributions to
differences were zone-specific (Table 12). Pair-wise tests indicated that the biomass
at sites was significantly different between all zone combinations (Narrandera-
Carrathool: t=2.561, P<0.001; Narrandera-Balranald: t=3.689, P<0.001; Carrathool-
Balranald: t=1.989, P=0.006).

97
Table 12 Contributions of fish species abundance and biomass to variability among zones in
the Murrumbidgee River, determined through SIMPER analysis. Note that only species
contributing ≥10% to changes in community composition are included.
Indicator Zone comparison Species Contribution
to difference
(%)
Zone with
greater
value
Abundance Narrandera-Carrathool bony herring 29 Carrathool
carp gudgeon 13 Carrathool
Narrandera-Balranald bony herring 22 Balranald
Murray cod 15 Narrandera
Australian smelt 13 Narrandera
Carrathool-Balranald Murray cod 18 Carrathool
Australian smelt 14 Carrathool
carp gudgeon 12 Carrathool
Murray-Darling rainbowfish 12 Carrathool
Biomass Narrandera-Carrathool bony herring 26 Carrathool
Murray cod 16 Narrandera
golden perch 15 Narrandera
common carp 11 Narrandera
Narrandera-Balranald Murray cod 31 Narrandera
bony herring 18 Balranald
common carp 12 Narrandera
golden perch 10 Narrandera
Carrathool-Balranald Murray cod 32 Carrathool
golden perch 17 Balranald

98
Figure 36 Average biomass per site (+SE) of each fish species within three zones of the
Murrumbidgee River sampled in 2015.

99
Overall Condition of the fish community was higher in the Carrathool zone
compared with Narrandera and Balranald zones, with Carrathool and Narrandera
rated as “Poor” and Balranald as “Very Poor” (Table 13). Recruitment and
Nativeness were highest in the Carrathool zone, although expectedness was highest
in the Narrandera zone (Table 13).
Table 13 Sustainable Rivers Audit (SRA) fish indices (mean ± SE) for each of the three
hydrological zones monitored in the Murrumbidgee River in 2015.
Hydrological
zone
Metric
Recruitment Nativeness Expectedness Overall condition
Narrandera 46.8 ± 0.0
(Poor)
70.0 ± 2.4
(Moderate)
49.2 ± 1.2
(Poor)
43.5 ± 0.7
(Poor)
Carrathool 61.3 ± 0.0
(Moderate)
75.2 ± 4.3
Moderate)
46.4 ± 2.4
(Poor)
49.5 ± 2.5
(Poor)
Balranald 46.9 ± 0.0
(Poor)
68.1 ± 3.7
(Moderate)
39.4 ± 3.3
(Very Poor)
36.8 ± 2.6
(Very Poor)
Differences in species-specific size-structure between hydrological zones were
evident for five of the six species examined, although not for all hydrological zone
comparisons (Table 14). Bony herring were not captured in the Narrandera zone,
and were proportionately smaller in the Balranald (mean (range) of 70 mm (30–272
mm)) compared with the Carrathool zone (117 mm (32–302 mm)) (Figure 37). Murray
cod were significantly smaller in the Carrathool (248 mm (54–604 mm)) compared to
the Narrandera zone (372 mm (50–1097 mm)), and comparisons with the Balranald
zone could not be made due to insufficient sample sizes. No differences in the
length-frequency of common carp existed between Narrandera and Carrathool
zones, although length-frequencies were significantly smaller in the Balranald zone
(271 mm (50–505 mm)) compared with both Narrandera (412 mm (90–610 mm)) and
Carrathool zones (403 mm (82–608 mm)) (Table 14, Figure 37). Murray-Darling
rainbowfish sizes did not differ among any hydrological zones (Table 14, Figure 38).
Carp gudgeon differed significantly between Narrandera (29 mm (20–45 mm)) and
Carrathool (33 mm (20–45 mm)), and between Narrandera and Balranald zones (33
mm (19–46 mm)), although there were no differences between Carrathool and
Balranald zones (Table 14, Figure 38). Similarly, Australian smelt differed significantly
between Narrandera (48 mm (25–73 mm)) and Carrathool (41 mm (30–59 mm)), and
between Narrandera and Balranald zones (41 mm (32–61 mm)), although there
were no differences between Carrathool and Balranald zones (Table 14, Figure 38).

100
Table 14 Length-frequency distribution pair-wise comparisons between hydrological zones for
the six most abundant fish species captured in the Murrumbidgee River in 2015. Significant
differences are indicated in bold.
Species
Zone comparison
Narrandera -
Carrathool
Narrandera -
Balranald
Carrathool -
Balranald
Z P Z P Z P
Australian smelt 3.041 <0.001 3.465 <0.001 0.424 0.994
bony herring - - - - 4.950 <0.001
carp gudgeon 2.051 <0.001 2.475 <0.001 0.424 0.994
common carp 0.990 0.281 3.182 <0.001 2.475 <0.001
Murray cod 2.263 <0.001 - - - -
Murray-Darling rainbowfish 0.849 0.468 0.707 0.699 0.354 1.000

101
Figure 37 Length-frequency distributions of the most commonly encountered large bodied
species captured in the Murrumbidgee River in 2015. The dashed line represents length to
denote new recruits (see Table 11).
n =0
n =72n =9n =151
n =46n =34n =126
n =49 n =81

102
Figure 38 Length-frequency distributions of the most commonly encountered small bodied
species captured in the Murrumbidgee River in 2015. The dashed line represents length to
denote new recruits (see Table 11).
n =65
n =43n =69n =47
n =35n =45n =30
n =27 n =38

103
Wetlands
A total of 38,979 fish comprising six native and four exotic species were captured
across 10 LTIM wetland sites that contained water between September 2014 and
May 2015. Carp gudgeon, bony herring and Australian smelt were the most
abundant native species (Figure 39) while gambusia, common carp and oriental
weatherloach (Misgurnus anguillicaudatus) were the most commonly recorded
exotic species. Fish communities differed significantly between the three wetland
zones (ANOSIM Global R 0.226, p =0.001).
Despite being filled via pump, fish were present in Yarradda lagoon with the
community dominated by bony herring and gambusia (Table 15). Exotic species
contributed the most to differences between the two Lowbidgee zones with
common carp, weatherloach and gambusia contributing to 92 per cent of
differences among sites in the Redbank Zone, while in the Nimmie-Caira zone
Common carp, gambusia, goldfish and Australian smelt contributed to differences.
The composition of fish communities did not change over the four sampling periods
(ANOSIM Global R 0.029, p = 0.213).
Table 15 SIMPER species contributions to differences between the three zones
Av.Abund Av.Sim Sim/SD Contrib% Cum.%
Nimmie-Caira
Average
similarity: 30.34
Common Carp
1.52
20.71 1.00 68.26 68.26
gambusia
0.41
3.24 0.65 10.68 78.94
Goldfish
0.33
2.35 0.49 7.75 86.69
Australian smelt
0.26
1.99 0.38 6.55 93.24
Group Redbank
Average
similarity: 28.39
Common Carp
1.18
8.99 0.80 31.65 31.65
oriental
weatherloach
1.24
8.97 0.71 31.60 63.25
gambusia
1.66
8.18 0.70 28.82 92.07
Group mid-
Murrumbidgee
Average
similarity: 6.41
bony herring
0.43
4.77 0.41 74.43 74.43
gambusia
0.39
1.64 0.41 25.57 100.00

104
Figure 39 Mean catch per unit effort (CPUE) (±SE) of fish species over the four sample periods.
Note that un-specked hardyhead and golden perch have been excluded from this figure as
there were less than 3 cases. Note the log10 scale.

105
Size structure
As the composition of fish communities differed between zones, difference in size
distributions in (September and November 2014) and (January and March 2015)
were compared within each zone using the Kolmogorov-Smirnov test. In the mid-
Murrumbidgee, bony herring were significantly smaller in January 2015 (four weeks
after initial fill) compared to March 2015 reflecting a shift towards larger individuals
with the March survey (Table 16, Figure 40). In the Lowbidgee, young-of-year carp
gudgeon were recorded late in the season in both the Nimmie-Caira and Redbank
zones indicated by a shift towards smaller individuals later in the season (Figure 41).
There was evidence of a breeding event by common carp and gambusia in both
the Redbank and Nimmie-Caira zones (Figure 42, Figure 43) as well as oriental
weatherloach in the Redbank zone, which is indicated by a bimodal distribution in
2014, with an increase in the frequency of larger individuals later in the season
(Figure 44).
Table 16 Length-frequency distribution pair-wise comparisons between the the September
and November ( pooled results) and the January-March (pooled sample results) for the six
most abundant fish species captured in wetlands of the Murrumbidgee catchment in 2015.
Bony herring were only recorded in sufficent numbers in 2015 in the mid-Mururmbidgee and
Nimmie-Caira as a result comparisons are Jan 15 - March 15. Significant differences are
indicated in bold.
Species
Mid-Murrubidgee Redbank Nimmie-Caira
Z P Z P Z P
Australian smelt - - - - 2.126 <0.001
bony herring 1.637 0.009 - - 6.739 <0.001
carp gudgeon - - 7.544 <0.001 5.873 <0.001
Murray-Darling rainbowfish - - 0.612 0.847 - -
Golden perch - - - - 0.408 0.996
common carp - - 0.315 <0.001 2.871 <0.001
Orientail weatherloach - - 5.117 <0.001 0.935 0.346
Goldfish - - 1.449 0.030 0.4573 <0.001
Gambusia 1.237 0.094 4.375 <0.001 0.455 0.986

106
Figure 40 Length-frequency distributions bony herring. The dashed line represents length to
denote new recruits (see Table 11).

107
Figure 41 Length-frequency distributions carp gudgeon. The dashed line represents length to
denote new recruits (see Table 11).

108
Figure 42 Length-frequency distributions common carp. The dashed line represents length to
denote new recruits (see Table 11).

109
Figure 43 Length-frequency distributions gambusia. The dashed line represents length to
denote new recruits (see Table 11).

110
Figure 44 Length-frequency distributions oriental weatherloach. The dashed line represents
length to denote new recruits (see Table 11).
Discussion
The current study provides a benchmark with which to compare changes in the fish
community assemblage composition across the Murrumbidgee system over the next
four years under the LTIM program. Ten native species were captured in the current
study of a total of 19 native species predicted to have occurred. Three threatened
species were captured in the Murrumbidgee River during sampling, although no
captures of any species resulted in range expansions from previous studies. Of the
remaining nine species predicted to have occurred in the lowland Murrumbidgee
Catchment, only recent catch records of flat-headed gudgeon (Philypnodon
grandiceps) and freshwater catfish (Tandanus tandanus) exist, with both

111
predominantly occurring in wetlands and off river habitats (Wassens et al. 2014b) DPI
Fisheries, Unpublished data). Of the remaining seven species, six are considered
locally extinct from the study area (flathead galaxias Galaxias rostratus, Macquarie
perch Macquaria australasica, Murray hardyhead, olive perchlet, southern purple
spotted gudgeon, southern pygmy perch) and one (shortheaded lamprey
Mordacia mordax) was likely a historical record of a vagrant (Gilligan 2005). A
number of these locally extinct species are off-channel specialists, and their
absence is likely due to long-term disconnection of wetlands and floodplain
habitats, in particular the loss of permanent wetlands and floodplain refuges.
Subsequently, it is important to recognise that any future watering of these off-
channel habitats is undertaken with realistic expectations that floodplain species
may not return. Future off-channel watering strategies should support long-term
watering plans that will enable conservation stocking or translocation, and the
subsequent re-establishment of resident populations of off-channel specialists.
River populations
The fish community composition of the lowland Murrumbidgee River differed among
hydrological zones in the current study. These differences were evident in species
richness, and species-specific abundance, biomass and size structure, although not
for all pairwise zone comparisons. It is likely that the extent of river regulation and
water delivery influence some of these differences, and indeed this was the premise
for the differentiation of hydrological zones in the current study. However, other
factors including physical habitat availability, barriers to passage, thermal pollution,
stocking, harvest, antecedent conditions and alien species have all contributed to
the current state of fish populations in the Murrumbidgee River (Gilligan 2005), and
indeed across the entire Murray-Darling Basin (Koehn et al. 2014; Lintermans et al.
2014). As such, while the results of environmental flow delivery will be monitored and
reported against under the LTIM program over the next four years, numerous
complementary actions are required to improve and restore native fish populations.
Recruitment
A number of longer-lived native species appear to be recruiting within the lowland
sections of the Murrumbidgee River and in wetlands. For example, bony herring

112
recruits were captured in both the Carrathool and Balranald zones, and in the mid-
Murrumbidgee wetlands although proportionately more recruits were present in the
Balranald zone. Despite being filled via an irrigation pump, bony herring were
relatively abundant in Yarradda Lagoon, with individuals >100mm present in the
wetland after it filled in mid-December. Bony herring spawn independently of
flooding, generally at water temperatures of 21–23 oC (Puckridge et al. 1990) and
are often abundant in both river and wetland habitats (Wassens et al. 2013a;
Wassens et al. 2014b, this study). Both the abundance and the proportion of bony
herring recruits appear to be higher in slower flowing, and less regulated locations
(Gehrke 1997; Pusey et al. 2004), a result consistent with this study. In the
Murrumbidgee River the abundance of Murray cod recruits was higher in the
Carrathool zone, compared with both the Narrandera and Balranald zones.
Spawning occurred in both Narrandera and Carrathool zones (See Section 3.8),
although the density of key prey items such as cladocerans and copepods
(Kaminskas et al. 2009) at first feed was substantially higher in the Carrathool zone
(see Section 3.6). We hypothesise that this contributed to higher survival and
subsequently a stronger recruitment event in this zone. Indeed Rowland (1992)
demonstrated lower survival of Murray cod larvae following initial delays in available
food and subsequent lower densities of microinvertebrates. Given that the species
spawns in response to day length and temperature cues, rather than flow,
elucidating the mechanisms driving prey availability for larvae and juveniles and
their links to flow represent an important component of the current LTIM program.
While spawning of golden perch and silver perch occurred during 2014-15, only one
silver perch recent recruit was captured in the Carrathool zone, and none were
captured in the Narrandera zone. Further, no golden perch recent recruits were
captured in the Murrumbidgee River, but small numbers of recruits were collected at
Telephone Creek, which is a permanent channel within the Nimmie-Caira zone.
Interestingly, a high density of appropriate first-feed food resources (generally small
cladocerans; (Arumugam et al. 1992) were available to golden perch in the
Carrathool zone and in the Nimmie-Caira wetlands (see Section 3.6). Previous studies
have reported spawning by golden perch in multiple river systems within a single
season, although limited recruitment in these same systems (Zampatti et al. 2015).
Others have identified that strong year-classes of both species occurs in non-flood
years e.g. (Mallen-Cooper et al. 2003), although the mechanisms contributing to

113
these stronger recruitment events remains unknown and represents an important
knowledge gap.
There was relatively high level of recruitment by exotic species in the Redbank and
Nimmie-Caira zones, Notably a cohort of oriental weatherloach at less than 20mm
were recorded in the Redbank zone, indicating that spawning may have occurred
either in the wetland, or in the river channel prior to reconnection of the wetlands in
October 2014.

114
3.10 Vegetation
Outcomes summary
The response of understorey vegetation communities to two environmental watering
actions was assessed in the mid-Murrumbidgee, Redbank and Nimmie-Caira zones
on four occasions (September 2014, November 2014, January 2015 and March-May
2015). Firstly, Action 2, environmental watering of mid-Murrumbidgee wetlands via
infrastructure (with the objective of “continue the recent improvements in wetland
vegetation condition”. The second (Action 6) was a Lowbidgee watering event
targeting wetlands in South Redbank (Yanga), North Redbank, Nimmie-Caira and
Fiddlers-Uara Creek system with the objective of “maintain, improve and in some
cases promote the recovery of wetland vegetation diversity and condition
(including lignum, black box and river red gums and associated understory
communities such as reeds, sedges and rushes)”. Monitoring of Objective 6 was
undertaken in the Redbank and Nimmie-Caira zones only. Dominant vegetation
communities surveyed within the mid-Murrumbidgee zone were open ox-bow
lagoons with fringing river red gum, with lignum swamps and lignum-black box
complexes in the Nimmie-Caira zone and river red gum forest and woodlands and
open, seasonally inundated spike rush wetlands in the Redbank zone.
Key findings
o The three wetland zones each support a distinct and diverse vegetation
community, demonstrating the importance of delivering environmental water
to a variety of wetland types across the Murrumbidgee Catchment.
o A key mid-Murrumbidgee species, Spiny mudgrass was recorded in Yarradda
Lagoon following environmental watering in 2014-15. This is the first record of
spiny mudgrass at Yarradda Lagoon since monitoring commenced in 2010.

115
Introduction
Plants growing in rivers, wetlands and floodplains are influenced by a range of
factors including climate, geomorphology and inundation history (Brock et al. 2003).
At a flow event scale the water regime controls hydrological conditions specific to a
site (depth, timing, duration, turbulence) interacting with the local climate
conditions such as temperature and light to influence the growth of plants (Brock et
al. 1997; Brock et al. 1999; Casanova et al. 2000; Capon et al. 2006). For these
reasons the vegetation communities of rivers, wetlands and floodplain are often
characterised by a great diversity of plant species and life-histories ranging from
entirely aquatic species, through to terrestrial colonising species which can colonise
wetlands and floodplains during dry periods.
The mid-Murrumbidgee wetland system contains a series of anabranches, prior
stream channels, and ox-bow lagoons which historically reconnected to the
Murrumbidgee River during winter and spring as a result of rainfall and snow melt
higher in the catchment (Frazier et al. 2005; Frazier et al. 2006; Murray 2008). The
construction of headwater dams and management of water for irrigation reduced
the frequency of these reconnections, particularly for wetlands higher on the
floodplain, (Frazier et al. 2006). The four wetlands included in this monitoring program
were historically either permanent, or annually inundated with infrequent periods of
complete drying (Murray 2008).
More recently, in the mid-Murrumbidgee the 2000-2010 drought combined with
increased water demand meant there were no flow periods high enough to
inundate the majority of wetlands in this system. Two of the sites monitored in this
zone Yarradda and Sunshower Lagoons received partial fills in 2005. A further site
Gooragool Lagoon is used as an off river storage for irrigation and so would have
received some inundation during the drought. Prior to 2001 Mckennas Lagoon was
inundated annually, but remained dry from 2001 until 2010. Following the drought all
four sites contained water from late 2010 until early 2013 (Wassens et al.). The rate of
recovery of aquatic vegetation communities was far slower than expected based
on seed bank assessments (Nielsen et al. 2012), with key species including spiny
mud-grass absent between 2010 and 2014 e.g. (Wassens et al. 2011; Wassens et al.
2012b).

116
Likewise river red gum has declined over a large-scale in wetlands, forest and
woodlands across the large flat, delta system comprising the Lowbidgee floodplain
(Wen et al. 2009). Areas of functional wetland have reduced over the past 50 years
as a result of upstream diversion for irrigation, and the construction of levees and
clearing of native vegetation (Kingsford et al. 2004b). Despite
significant hydrological alteration the Lowbidgee floodplain remains one
of Australia’s most significant wetland complexes (Kingsford, Brandis et al. 2004,
Kingsford and Thomas 2004)(Kingsford et al. 2004a). Some wetland areas in both the
Redbank and Nimmie-Caira were maintained in relatively good condition through
the 2000-2010 drought as a result of environmental water deliveries and the use of
Lowbidgee supplementary access licences for irrigation.
Methods
Surveys to assess the understory vegetation assemblage, diversity and cover were
conducted at 12 LTIM wetland sites across three wetland zones (Mid-Murrumbidgee
wetlands, Redbank and Nimmie- Caira) (Table 17). Understory vegetation at the
above sites was monitored every two months starting September 2014 and following
onto November 2014, January 2015 and March 2015 (note that the final Nimmie-
Caira sampling date was delayed until May 2015 due to access and safety issues).
Vegetation monitoring follows the methods described in (Wassens et al. 2014a).
Vegetation surveys are undertaken along permanent transects that start at the
highest point of the wetland and run towards the lowest (deepest point). Transects
are between 90 and 250 m long, with understorey and over story vegetation
assessed from 1m quadrats, spaced either 3 or 5 m apart along the transect. The
length of transects and distance between quadrats is determined by the
bathymetry and area of each wetland.
Commonwealth environment water was utilised at one of the four LTIM sites in the
mid-Murrumbidgee (Yarradda Lagoon). To test the assumption that environmental
watering contributed to achieving the watering objective “continue the recent
improvements in wetland vegetation condition” we compared data collected in
2014-15 (this study) data collected annually from 2010 (Wassens et al. 2011; Wassens
et al. 2012a; Wassens et al. 2013a; Wassens et al. 2014b). The period between 2010
and 2015 covered the first fill of the wetlands for five years (Yarradda Lagoon

117
received a partial fill in 2005) and includes two years where the wetland was dry
(2012-13 and 2013-2014).
To determine differences in plant communities between the three wetland zones
and over time, percent cover data were analysed separately using one-way fixed
factor Permutational Multivariate Analysis of Variance (PERMANOVA Anderson et al.
(2008)). Raw data were initially fourth root transformed and the results used to
produce a similarity matrix using the Bray-Curtis resemblance measure. All tests were
considered significant at P < 0.05. Where significant differences were identified, pair-
wise post-hoc contrasts were used to determine which zones differed. Similarity
percentage (SIMPER) tests were used to identify individual species contributions to
average dissimilarities between zones.

118
Table 17 Summary of dominant vegetation communities and watering regimes across the 12
LTIM monitoring locations.
Zone Description Sites Status 2004-15
Mid-
Murrumbidgee
(Action 2)
Open oxbow lagoons,
fringing River Red Gum
woodland. Highly altered
inundation regime.
Mckennas Dry
Sunshower Dry
Goorgogool Irrigation drainage
Yarradda Environmental water
(infrastructure assisted)
Nimmie-Caira
(Action 6)
Lignum, lignum-black box,
some River red gum fringing
permanent creek lines
Eulimbah Environmental water
Avalon Environmental water
Nap Nap Environmental water
Telephone
creek
Environmental water (main
creek is permanent)
Redbank
(Action 6)
River red gum forest, open
spike rush dominated
wetlands with fringing river
red gum
Mercedes Environmental water
Two Bridges Environmental water
Piggery lake Environmental water
Wagorah
lagoon
Environmental water (main
lagoon is permanent)
Results
Across all surveys a total of 169 predominantly understory plants were recorded,
including 122 native species and 47 exotic species. As expected composition of
vegetation communities differed significantly between each of the three monitoring
zones (mid-Murrumbidgee, Nimmie-Caira and Redbank) ANOSIM (Global R): 0.579,
p <0.0001).
Species diversity (d) also differed significantly between zones (GLM, f =8.382, p
<0.001), and over time (GLM, f =3.187, p=0.036), but there was no significant
interaction between zone and time (GLM, f =1.800, p =0.0128)(Figure 45). Within
each zone diversity (d) was significantly higher in September 2014 than in January
2015 surveys (Figure 45)(Sept-Jan Tukey HSD -1.989, p = 0.011), but diversity in
September 2014 was similar to November 2014 and March 2015.

119
Figure 45 Mean species diversity (d)(±SE) within each zone over the four sampling periods
Mid-Murrumbidgee watering event (Action 2)
Overall there were significant differences in the vegetation community composition
between the four mid-Murrumbidgee sites (ANOSIM Global r 0.573, p = 0.001) with
two sites (Sunshower and Mckennas) remaining dry throughout the 2014-15
monitoring period while two others Gooragool Lagoon (contained irrigation
drainage water) and Yarradda Lagoon (pumped environmental water) contained
some water.
As expected community composition has changed significantly between water
years reflecting wetting (2010-2012, 2014-2015) and drying (2013-14) patterns
(ANOSIM Global R): 0.727, p < 0.001). Importantly the key amphibious species, spiny
mud grass (Pseudoraphis spinescens) which was the dominant species at Yarradda
Lagoon during IMEF monitoring (Chessman 2003) was recorded for the first time
during these surveys (Figure 46).

120
Figure 46 Change in the percent cover of dominant species between 2010 and 2015. Data is
drawn from (Wassens et al. 2011; Wassens et al. 2012b; Wassens et al. 2013a; Wassens et al.
2014b)
SIMPER comparisons of wet and dry sites across the mid-Murrumbidgee in 2014-15
(Table 18) demonstrated clear differences between wet (Yarradda and Gooragool)
and dry sites (Mckennas and Sunshower). Dry sites were dominated by exotic weed
species including spear thistle (Cirsium vulgare), prickly lettuce (Lactuca serriola),
exotic grasses, and were undergoing river red gum encroachment (Eucalyptus
camaldulensis). Native terrestrial species including creeping saltbush (Atriplex
semibaccata), burr daisy (Calotis scapigera) and Riverina bluebell (Wahlenbergia
fluminalis) also occur. Wet sites were dominated by knotweed (Persicaria
decipiens), spiny mudgrass (Pseudoraphis spinescens) and common spikerush

121
(Eleocharis acuta). The culturally significant species common sneeze weed
(Centipeda cunninghamii) (Gukwonderuk, Budhaay) also made a significant
contribution to the differences between wet and dry sites and was relatively
common at wet sites Gooragool and Yarradda Lagoons.
Table 18 Simper comparisons between mid-Murrumbidgee sites containing water (wet) and
dry sites
Group Wet Group Dry
Species Av.Abund Av.Abund Av.Diss Diss/SD Contrib% Cum.%
Cirsium vulgare 0.6 1.78 3.96 0.97 5.16 5.16
Terrestrial grass 0.8 1.3 3.81 1.01 4.96 10.12
Persicaria decipiens 1.15 0.02 2.98 0.64 3.87 13.99
Pseudoraphis spinescens 0.96 0.1 2.79 0.73 3.64 17.63
Eleocharis acuta 1.32 0.45 2.75 1.08 3.58 21.2
Medicago polymorpha 0 1.17 2.45 0.58 3.19 24.39
Paspalum distichum 0.77 0.15 2.18 1.15 2.83 27.22
Eucalyptus camaldulensis 0.89 1.55 2.16 0.91 2.82 30.04
Cyperus eragrostis 0.88 0 2.16 0.9 2.81 32.85
Centipeda cunninghamii 0.79 0.42 2.1 1.11 2.74 35.59
Calotis scapigera 0.37 0.69 2.05 1.14 2.67 38.25
Panicum effusum 0.8 0 1.96 0.54 2.55 40.8
Chamaesyce drummondii 0.44 0.34 1.82 0.91 2.37 43.18
Alternanthera denticulata 0.75 0.12 1.65 0.97 2.15 45.33
Persicaria prostrata 0.4 0.3 1.54 0.85 2 47.33
Ludwigia peploides ssp. montevidensis 0.71 0 1.52 0.74 1.97 49.3
Juncus usitatus 0.66 0 1.48 1.04 1.92 51.22
Atriplex semibaccata 0.77 0.86 1.45 0.92 1.88 53.11
Polygonum aviculare 0.62 0.28 1.4 1.2 1.82 54.93
Senecio quadridentatus 0.08 0.47 1.38 0.85 1.8 56.73
Paspalidium jubiflorum 0.45 0.29 1.34 0.84 1.75 58.48
Lactuca serriola 0.2 0.63 1.33 1.13 1.73 60.22
Persicaria lapathifolia 0.5 0 1.22 0.57 1.59 61.81
Dysphania pumilio 0.43 0.18 1.19 0.81 1.55 63.36
Tragopogon porrifolius 0.5 0.18 1.15 1.29 1.5 64.86
Lythrum hyssopifolia 0.49 0 1.1 0.9 1.43 66.29
Senico runcinifolius 0.37 0.2 1.1 0.83 1.43 67.72
Sonchus oleraceus 0.1 0.41 0.99 1.01 1.29 69.01
Wahlenbergia fluminalis 0.07 0.4 0.98 1.25 1.28 70.29
Trifolium tomentosum 0.07 0.37 0.85 0.59 1.1 71.39
Trifolium arvense 0.08 0.36 0.83 0.59 1.08 72.48
Cynodon dactylon 0 0.32 0.82 0.5 1.07 73.55
Chenopodium curvispicatum 0.14 0.2 0.8 0.46 1.04 74.59
Conyza bonariensis 0.21 0.2 0.76 0.88 0.99 75.58
Bassia decurrens 0 0.25 0.76 0.62 0.99 76.56
Scleroblitum atriplicinun 0.03 0.26 0.73 0.76 0.95 77.51
Vittadinia cuneata 0 0.28 0.71 0.82 0.93 78.44
Forb 0.11 0.05 0.69 0.45 0.9 79.34

122
Two Bridges Swamp (transect 1) September 2014
Two Bridges Swamp (transect 1) November 2014
Plate 2 Rapid growth of common spikerush (E. acuta) at Two Bridges Swamp in the Redbank
system from September 2014 (left) to November 2014 (right).
Lowbidgee and Nimmie-Caira watering
In the Nimmie-Caira zone the four most abundant species were lignum
(Muehlenbeckia florulenta), water primrose (Ludwigia peploides ssp. Montevidensis),
common sneeze weed and nardoo (Marsilea drummondii), while in the Redbank
zone wetlands were dominated by tall spike rush (Eleocharis sphacelata), common
spike rush (Eleocharis acuta), azolla (Azolla filiculoides), and nardoo (Marsilea
drummondii). The composition of vegetation communities changed between the
four sampling occasions, although the relationship was relatively weak (ANOSIM
Global R 0.196, p =0.005). In the Redbank zone the majority of sites were dry in
September and communities were dominated by opportunistic annual species and
semi-aquatic species including common sneeze weed and swamp butter cup
(Ranunculus undosus). There was a strong response to watering at the majority of
Redbank sites (Plate 2), but the rate of change in the community was influenced by
water depth, and increases in the cover of aquatic vegetation was slower at larger
deeper sites such as Piggery Lake (Plate 3) compared to small shallow sites such as
Two Bridges and Mercedes Swamps (Figure 47). With the exception of Avalon
Swamp, the remaining Nimmie-Caira sites contained water in September and the

123
percentage cover of amphibious species peaked in January before declining as the
sites dried down.
Plate 3 Piggery Swamp, Redbank zone March 2015.

124
Figure 47 Changes in percentage cover of key amphibious (Casanova 2011) genera in the
Lowbidgee sites from the Nimmie-Caira (Avalon, Eulimbah, Telephone Creek, Nap Nap)and
Redbank (Mercedes, Piggery lake, Two bridges, Wagourah Lagoon).

125
Table 19 Simper comparisons between Nimmie-Caira and Redbank zones in the Lowbidgee
floodplain
Species Nimmie-
Caira
Av.Abund
Redbank
Av.Abund
Av.Diss Diss/SD Contrib
%
Cum.%
Eleocharis sphacelata 0 2.76 5.04 1.01 6.45 6.45
Muehlenbeckia florulenta 2.31 0.38 4.13 1.43 5.3 11.75
Azolla filiculoides 0.85 1.31 2.93 0.99 3.76 15.51
Eleocharis acuta 0.9 1.81 2.9 1.26 3.71 19.22
Ludwigia peploides ssp.
montevidensis
1.59 0.84 2.63 1.13 3.37 22.59
Marsilea drummondii 1.35 1.3 2.52 1.09 3.23 25.82
Eleocharis pusilla 1.07 1.15 2.27 1.23 2.91 28.73
Centipeda cunninghamii 1.48 0.82 2.2 1.22 2.82 31.55
Alternanthera denticulata 0.68 0.78 1.63 1.07 2.09 33.64
Paspalidium jubiflorum 0.75 0.55 1.58 1.14 2.02 35.67
Juncus usitatus 0.78 0 1.51 1.06 1.93 37.6
Heliotropium europaeum 0.61 0.23 1.34 0.9 1.72 39.32
Ranunculus undosus 0 0.66 1.2 0.55 1.54 40.86
Dysphania pumilio 0.56 0.14 1.12 0.86 1.43 42.29
Chenopodium nitrariaceum 0.39 0.3 1.07 0.86 1.37 43.66
Persicaria decipiens 0.36 0.44 1.04 1.04 1.34 45
Myriophyllum papillosum 0.42 0.35 1.02 1.01 1.31 46.31
Myriophyllum verrucosum 0.55 0 1 0.66 1.28 47.59
Grass 0.53 0.11 0.97 0.98 1.24 48.83
Marrubium vulgare 0.13 0.46 0.91 0.89 1.17 50
Ranunculus pumilio 0.21 0.37 0.91 0.48 1.16 51.16
Pratia concolor 0.38 0.33 0.9 1.09 1.15 52.31
Paspalum distichum 0.05 0.44 0.9 0.88 1.15 53.46
Sclerolaena muricata 0.1 0.38 0.86 0.67 1.1 54.57
Damasonium minus 0.09 0.46 0.83 0.64 1.07 55.63
Chlarophyte 0.03 0.41 0.83 0.56 1.06 56.69
Eucalyptus camaldulensis 0.31 0.37 0.81 1.21 1.04 57.73
Atriplex semibaccata 0.24 0.29 0.81 0.79 1.04 58.77
Rorippa eustylis 0.42 0.08 0.81 0.67 1.04 59.8
Brachycome basaltica 0.06 0.43 0.78 1.19 1 60.81
Verbena supina 0.4 0.02 0.78 0.94 0.99 61.8
Myriophyllum crispatum 0.3 0.19 0.77 0.68 0.98 62.78
Senico runcinifolius 0.41 0.13 0.75 1.33 0.97 63.75
Pseudoraphis spinescens 0.06 0.37 0.75 0.66 0.96 64.71
Mentha australis 0.38 0 0.73 0.85 0.94 65.64
Ammannia multiflora var. multiflora 0.29 0.1 0.71 0.59 0.91 66.55
Lythrum hyssopifolia 0.34 0.05 0.68 0.76 0.87 67.42
Asperula geminifolia 0.35 0 0.63 0.97 0.81 68.23
Marsilea hirsuta 0.21 0.14 0.63 0.54 0.8 69.03
Crassula helmsii 0.26 0.14 0.62 0.72 0.79 69.82
Typha spp. 0.04 0.3 0.61 0.61 0.78 70.61
Mimulus graculis 0.3 0.06 0.6 0.56 0.77 71.38
Cyperus difformis 0.26 0.08 0.59 0.66 0.76 72.13
Potamogeton tricarinatus auct. 0.13 0.23 0.58 0.68 0.75 72.88
Chamaesyce drummondii 0.13 0.25 0.58 0.88 0.74 73.62
Conyza bonariensis 0.24 0.15 0.58 0.82 0.74 74.36
Polygonum aviculare 0.3 0.03 0.57 0.77 0.74 75.09
Persicaria prostrata 0.27 0.03 0.57 0.58 0.73 75.83
Cirsium vulgare 0.13 0.27 0.57 0.75 0.73 76.56
Rhagodia nutans 0.2 0.14 0.57 0.6 0.73 77.28
Chenopodium album 0.08 0.26 0.57 0.51 0.72 78.01
Juncus flavidus 0.28 0 0.56 0.57 0.72 78.73
Goodenia heteromera 0.26 0 0.56 0.56 0.71 79.44
Eleocharis pallens 0.29 0 0.55 0.37 0.71 80.15

126
Discussion
Relatively small scale infrastructure assisted water deliveries have aided this recovery
at Yarradda Lagoon this year allowing for the reestablishment of spiny mudgrass.
Indeed, as the seedbank viability of spiny mudgrass is relatively short, it is likely that
the transfer of water to the lagoon via irrigation canals containing spiny mudgrass
may have facilitated its reintroduction to the lagoon. The wetlands of the mid-
Murrumbidgee have been subject to significant, long-term hydrological
modification. Following the natural flooding in 2010, rate of recovery of vegetation
communities has been extremely slow with a number of previously common
amphibious species including tall spike rush, common spike rush and spiny mudgrass
largely absent from the mid-Murrumbidgee wetlands between 2010 and 2014
(Wassens et al. 2011; Wassens et al. 2012a; Wassens et al. 2013a; Wassens et al.
2014b). Loss of perennial rhizomes and diminished seed banks are expected to have
contributed to the poor rate of recovery in the mid-Murrumbidgee as has been
recorded in other areas e.g. (Reid et al. 2011).
River red gum encroachment is a serious problem at dry sites in the mid-
Murrumbidgee with both McKennas and Sunshower Lagoons containing dense
stands of river red gum seedlings. Environmental watering is one of the principle
mechanisms for controlling river red gum encroachment into wetlands and is a high
priority for encroached sites in the mid-Murrumbidgee.
Compared to the mid-Murrumbidgee wetland systems, wetlands through the
Lowbidgee floodplain are in relatively good condition and support diverse, native
vegetation communities. The response to Commonwealth environmental watering is
rapid, indicating that perennial rhizomes are in good condition and that seedbanks
are viable. This is the first year of monitoring in the Lowbidgee systems and represents
a benchmark against which to assess long-term changes in vegetation communities.

127
3.11 Other vertebrate diversity- Frogs and Turtles
Outcomes summary
Frogs and their tadpoles are important components of wetland ecosystems. The
response of frogs to environmental watering is influenced by the timing and duration
of the inundation, as well as wetland characteristics such as aquatic vegetation
cover and flooding frequency. The Commonwealth environmental watering
objectives for the Murrumbidgee River system in 2014-15 related to frogs were Action
2 – mid-Murrumbidgee reconnection (infrastructure assisted) and Action 6 –
Lowbidgee – wetlands. Nine of the 12 LTIM monitoring wetlands received
environmental water in 2014-15, while one, Gooragool Lagoon in the mid-
Murrumbidgee received drainage water nearby from irrigation operations. The
remaining two wetlands, McKenna’s and Sunshower lagoons in the mid-
Murrumbidgee zone remained dry.
The key watering objectives related to frogs were to “Provide habitat to maintain
condition of waterbirds, native fish, other aquatic vertebrates (turtles, frogs) and
invertebrates” and “Provide habitat to support survival and maintain condition of
native fish, waterbirds and other aquatic vertebrates (frogs).” The maintenance of
frog communities and population through the Murrumbidgee Catchment relate to
longer term Basin Plan objectives of maintaining biodiversity. Overall, five frog
species were recorded breeding across the ten LTIM monitoring sites.
Key findings
o Environmental watering, using NSW EWA, targeted known habitats of the
southern bell frog (Litoria raniformis) in the Nimmie-Caira zone (Action 6).
Calling and tadpoles of southern bell frogs and other frog species were
recorded at all four LTIM monitoring wetlands in the Nimmie-Caira, indicating
that these flows were successful in created breeding opportunities for this
nationally vulnerable species, and other floodplain frog species.
o Commonwealth environmental watering targeted one wetland (Yarradda
Lagoon) in the mid-Murrumbidgee wetland systems (Action 2). Inland banjo
frog (Limnodynastes interioris) adults and tadpoles were recorded in this

128
wetland for the first time since monitoring commenced in 2010. Large
numbers of Peron’s tree frog (Litoria peronii) tadpoles were also recorded.
Introduction
Frogs are important components of floodplain wetlands. Both adults and tadpoles
can comprise a significant proportion of aquatic biomass and therefore provide key
energy resources for wetland predators including waterbirds, aquatic invertebrates
and snakes (Gibbons et al. 2006; Chan et al. 2009; Connelly et al. 2011). Most frog
species in the mid and lower Murrumbidgee catchment wetlands prefer still or slow
moving water, particularly for breeding. Environmental watering actions targeting
wetlands can provide benefits for frogs and their tadpoles and are important to the
survival of flow-specialist species, such as the vulnerable southern bell frog (Litoria
raniformis).
The Commonwealth watering objectives for the Murrumbidgee River system in 2014-
15 relating to frogs were Action 2 – mid-Murrumbidgee reconnection (infrastructure
assisted) and Action 6 – Lowbidgee – wetlands in Yanga, North Redbank, Nimmie-
Caira and Fiddlers-Uara Creek system. Adult frogs and their tadpoles were
monitored at 10 wetlands receiving Commonwealth environmental water in the
mid-Murrumbidgee, Redbank and Nimmie-Caira zones. In both cases, the watering
action aimed to: “Provide habitat to maintain condition of waterbirds, native fish,
other aquatic vertebrates (turtles, frogs) and invertebrates.” Specifically, we
predicted that:
environmental watering will support species richness in each zone,
environmental watering will promote calling behaviour indicative of breeding
activity followed by tadpole occurrence, and
environmental water coinciding with the breeding window of southern bell
frogs will trigger breeding activity, e.g. the presence of calling males and
tadpoles.
Methods
Adult frogs were surveyed for presence and calling behaviour during timed
nocturnal searches at 10 wetland sites (Nimmie-Caira, n = 4, Redbank, n = 4, and
Mid-Murrumbidgee n = 2) on four occasions between September 2014 – May 2015.

129
Tadpoles were monitored alongside the wetland fish surveys (see Section 3.9) using a
combination of small (n=2) and large fyke (n=2) nets set overnight. Adults frogs were
surveyed along two timed 20 minute transects after dark, the number of calling
individuals was recorded at 5 minute intervals during the transect survey as well as
the average number recorded (for full details see (Wassens et al. 2014a). Monitoring
for frogs and tadpoles was undertaken at the 10 LTIM monitoring sites that contained
water during the study period. The two other LTIM monitoring sites (Sunshower and
Mckennas, both mid-Murrumbidgee) were dry and consequently not surveyed for
tadpoles or adult frogs.
One of the mid-Murrumbidgee sites (Gooragol Lagoon), received a small amount of
water which had drained from surrounding irrigation area and was only deep
enough to survey for tadpoles in November 2014. Yarradda Lagoon received
Commonwealth environmental water in December 2014.
Results
Overall, 2,212 adult frogs (seen and heard) and 1,100 tadpoles of six species were
recorded between September 2014 and May 2015 across 10 LTIM monitoring sites,
with two sites remaining dry throughout 2014-15.
Adult barking marsh frogs (Limnodynastes fletcheri), spotted marsh frogs
(Limnodynastes tasmaniensis), plains froglets (Crinia parinsignifera) were recorded in
all three zones. Peron’s tree frogs (Litoria peronii), inland banjo frogs (Limnodynastes
interioris) were less widespread, while the vulnerable southern bell frog (Litoria
raniformis) had the most restricted distribution, only occurring across the four
Nimmie-Caira sites.
As expected the abundance of southern bell frog adults was significantly higher in
the Nimmie-Caira zone, with no individuals recorded in either the Redbank or mid-
Murrumbidgee zones (GLM 16.045, p <0.001), abundance was highest in November
coinciding with the start of the breeding period, contributing to slight, but not
significant interaction between zone and time (GLM 11.429, p =0.076)(Figure 48).
Southern bell frog tadpoles were most abundant in January, with small numbers also
recorded in November.
Peron’s tree frog adults and tadpoles were most abundant in the mid-
Murrumbidgee, with high numbers recorded in January following environmental

130
watering of Yarradda Lagoon (Action 2). Inland banjo frog adults and tadpoles
were recorded in Yarradda lagoon, the first record of this species at this site since
monitoring commenced in 2010.
Spotted and barking marsh frogs were most abundant through the Redbank systems
with comparatively high numbers of adults and tadpoles recorded (Figure 49). The
barking marsh frog in particular was comparatively rare in the Nimmie-Caira and
mid-Murrumbidgee contributing to significant differences between zones (GLM
33.160, P < 0.00), reflecting this species preference for frequently inundated
waterbodies. Spotted and barking marsh frog tadpoles are indistinguishable and are
therefore grouped as Limnodynastes sp. Limnodynastes tadpoles were most
abundant in November and January through the Redbank zone with relatively small
numbers recorded through the Nimmie-Caira and Redbank (see Figure 49).
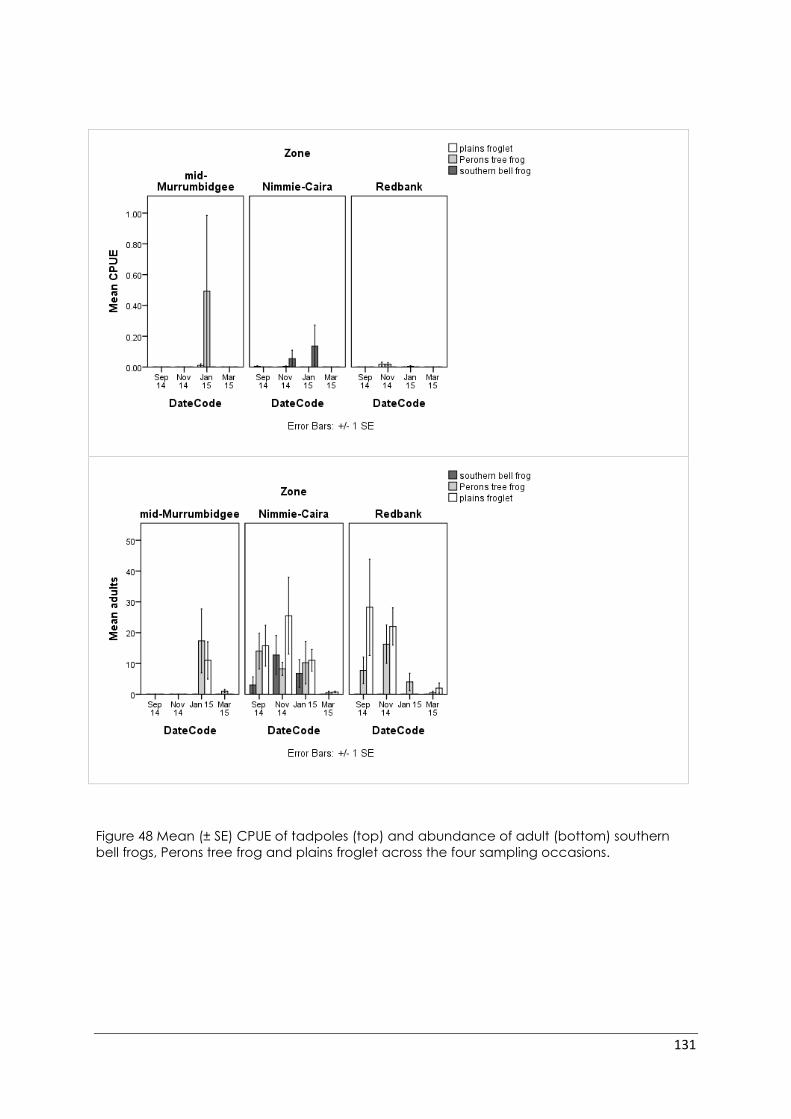
131
Figure 48 Mean (± SE) CPUE of tadpoles (top) and abundance of adult (bottom) southern
bell frogs, Perons tree frog and plains froglet across the four sampling occasions.

132
Figure 49 Mean (± SE) CPUE of tadpoles (top) and abundance of adult (bottom) barking
marsh frogs, spotted marsh frog and inland banjo frog bell frogs.

133
Turtles
Two species of freshwater turtles were recorded in the LTIM wetland sites that held
water in 2014-15. In total, 28 individuals were recorded, nearly all of which were the
eastern long-necked turtles which were recorded at all 10 LTIM wetland sites (27
turtles). One broad shell turtle was recorded at one site only (Wagourah Lagoon,
Redbank). No recent hatchlings were recorded, however, based on size at sexual
maturity (160 mm in female and 145 mm in male eastern long-neck turtle (Kennett et
al. 1990), carapace lengths indicated eight of the 28 individuals collected were not
yet sexually mature. The smallest individuals were recorded at Nap Nap Swamp (84
mm, Nimmie-Caira) and Two Bridges swamp (90 mm, Redbank).
Discussion
Three frog species were recorded breeding in Yarradda Lagoon following
infrastructure mediated delivery of environmental water (Action 2). Peron’s tree frogs
and inland banjo frogs with smaller numbers of spotted marsh frogs. This is the first
record of inland banjo frogs in Yarradda Lagoon and the first record of this species in
the mid-Murrumbidgee LTIM sites. The abundance of Limnodynastes tadpoles were
slightly lower than in previous years (Wassens et al. 2012a; Wassens et al. 2013a;
Wassens et al. 2014b), however large numbers of Peron’s tree frog tadpoles were
recorded in January 2015 and inland banjo frog tadpoles were recorded in March
2015.
Six species of frogs were recorded across the Nimmie-Caira and Redbank zones
during the 2014-15 Commonwealth environmental watering action (Action 6) with
evidence of breeding activity for all species (calling males heard and/or tadpoles
caught). The composition of frog communities differed between the two zones, with
southern bell frog recorded at all four sites in the Nimmie-Caira, but not in any
Redbank wetlands during 2014-15. Environmental water was delivered to wetlands in
the Nimmie-Caira and Redbank zones where the southern bell frog had been
recorded in 2012-13 and 2013-14 water years (Wassens et al. 2014b). Southern bell
frogs were recorded calling at environmental watering sites in September,
November 2014 and January 2015 following environmental watering. There has
been a gradual decline in southern bell frog abundances at Redbank sites relative
to previous years e.g. (Wassens et al. 2010; Spencer et al. 2011b), and no southern
bell frogs recorded at watering sites in the Redbank zone in 2014-15.

134
Environmental watering can promote amphibian calling behaviour indicated by
breeding activity followed by tadpole occurrence and recently metamorphosed
frogs at LTIM wetlands, though the species which are active will vary depending on
the timing of the watering event e.g. (Wassens 2010a; Wassens 2010b; McGinness et
al. 2014). The focus on late spring and summer watering in recent years has
appeared to increase breeding outcomes for the vulnerable southern bell frog in
the Nimmie-Caira, with numbers of southern bell frogs recorded higher than in 2013-
14 (Wassens et al. 2014b). There has been a general positive recovery of this species
following successive years of environmental watering in the Nimmie-Caira see
(Spencer et al. 2011a; Wassens et al. 2013a; Wassens et al. 2013b).
Southern bell frogs have highly specialised habitat requirements, preferring
seasonally inundated wetlands with areas of warm, shallow water (Wassens et al.
2008; Wassens et al. 2010). As in previous years tadpoles were recorded in November
and January, which is characteristic of this summer breeding species. The Nimmie-
Caira zone is an important area for the vulnerable southern bell frogs which have
been consistently recorded calling at Telephone Creek, Eulimbah, Nap Nap and
Avalon swamps, with tadpoles caught at Nap Nap swamp in 2014-15.
Complementary nocturnal surveys for adult frogs by NSW OEH and CEWO staff, also
identified calling by southern bell frogs at an additional three sites across the
Nimmie-Caira which neighbour the LTIM wetlands. In contrast, no southern bell frogs
were observed at wetlands in Redbank in 2014-15 which is consistent with a decline
in this zone, previous 2013-14 only small numbers a few individuals were recorded at
Mercedes Swamp and Paul Coates Swamp (North Redbank) during previous water
years. In 2001 southern bell frogs were abundant through the Redbank system and
the causes of the decline of this species is unclear. Current monitoring shows water
quality parameters are broadly consistent between Redbank and Nimmie-Caira
zones (see Section 3.4) although minimum DO was significantly lower in the Redbank
zone. More research is needed to examine whether DO may be a driver of the
decline in southern bell frogs. The establishment of oriental weatherloach
populations in the Redbank zone since 2013 might also have contributed to southern
bell frog declines these relationships have never been fully established. The barking
marsh frog and spotted marsh frog continue to dominate the frog communities at
the deeper, more persistent wetlands within the Redbank zone.

135
In the mid-Murrumbidgee (Action 2), infrastructure assisted delivery of environmental
water had a strong positive effect on frog communities, with breeding by Peron’s
tree frog and inland banjo frog recorded at this wetland for the first time since
monitoring commenced in 2011 (Wassens et al. 2012b; Wassens et al. 2013a;
Wassens et al. 2014b). Tadpole abundances were higher in Yarradda then in
Gooragool lagoons, possibly because the duration of inundation resulting from
irrigation drainage water was not sufficient to sustain tadpole growth and
development.

136
3.12 Waterbird Diversity
Outcomes summary
Wetlands in the Murrumbidgee Catchment are widely recognised for their
importance for waterbirds, providing breeding habitat for colonially-nesting
waterbirds and habitat for waterbird species listed as threatened under the
Commonwealth EPBC Act 1999 or under migratory bird agreements Australia has
with Japan (JAMBA), China (CAMBA) and the Republic of Korea (ROKAMBA). In
2014-15 the key objective of the Commonwealth environmental watering actions in
the Murrumbidgee Catchment in relation to waterbirds was to “provide habitat for
waterbirds, native fish and other aquatic vertebrates” across Actions 2 and 6
watering actions, where Action 2 involved the use of infrastructure to reconnect
parts of the mid-Murrumbidgee wetlands and Action 6 aimed to inundate large
parts of the Lowbidgee floodplain. We undertook quarterly ground surveys for
waterbirds in the mid-Murrumbidgee, Nimmie-Caira and Redbank zones in 2014-15
alongside wetland fish, frog, microinvertebrate and nutrient monitoring the 12
Murrumbidgee LTIM wetland sites. The results of these surveys were used to assess
waterbird species diversity, abundance and breeding activity, and their responses to
the delivery of Commonwealth environmental water. These surveys followed on from
quarterly monitoring of waterbirds across the Murrumbidgee Catchment since 2008.
The 2014-15 surveys were complemented by coincident surveys by NSW OEH and
CEWO staff during the same time period across a greater spread of sites in the three
zones and the neighbouring Western Lakes. We expected local increases in the
abundance and diversity of waterbird species, including species of conservation
significance (i.e. threatened species, and JAMBA, CAMBA and ROKAMBA species),
and some small scale colonial waterbird breeding in response to Commonwealth
environmental watering in 2014-15.
Key findings
o 36 waterbird species were observed across the 12 Murrumbidgee LTIM
wetland survey sites. This compares with at least 58 waterbird species
recorded over the preceding 2008-14 monitoring period. Waterbird diversity

137
and abundance peaked in the January 2015 surveys when the extent of
flooding was greatest.
o Under Action 2 Yarradda Lagoon received water in December 2014, with
influxes of pink-eared ducks (Malacorhynchus membranaceus) recorded.
o In the Lowbidgee floodplain (Action 6) two species listed Eastern great egret
sharp-tailed sandpiper on two or more international bilateral migratory bird
agreements (JAMBA, CAMBA and ROKAMBA) were recorded in wetlands
that received Commonwealth environmental water in 2014-15.
o Two species were recorded breeding at the LTIM monitoring sites in the
Lowbidgee floodplain, the grey teal (Anas gracilis) and Pacific black duck
(Anas superciliosa)
Introduction
Waterbirds are highly mobile and can feed on a wide range of flora and fauna,
moving between wetlands in response to drying and flooding phases to maximise
feeding and breeding opportunities (Roshier et al. 2001; Kingsford et al. 2002; Roshier
et al. 2002). As a group, waterbirds are an important part of aquatic ecosystems and
their diversity and abundance can be linked to multiple wetland components
including aquatic vegetation cover, and microinvertebrate density and fish
abundance. The mid-Murrumbidgee and Lowbidgee wetlands are recognised as
nationally significant habitat for waterbirds, supporting nationally threatened species
and species listed under international migratory bird agreements. During large floods
the Lowbidgee wetlands can also support some of the largest colonies of nesting
waterbirds in the Murray-Darling Basin (Bino et al. 2014).
Methods
Ground surveys to assess waterbird species diversity, maximum abundance and
breeding activity were conducted at the 12 LTIM wetland survey sites spread across
the mid-Murrumbidgee, Nimmie-Caira and Redbank zones. Methods followed those
employed previously to survey waterbirds in the Murrumbidgee Catchment and are
documented in (Wassens et al. 2014a).

138
Waterbird species were separated into eight functional groups as per (Hale et al.
2014) (see Appendices) to investigate differences in bird assemblages among the
surveyed wetlands. The total abundance of each functional group per hectare was
calculated for each survey based on known coverage of each site in relation to the
wetland boundaries determined in Section 3.3. Across the 12 wetland survey sites
approximately 152 ha of wetlands were surveyed in Redbank zone, 198 ha in the
Nimmie-Caira zone and 104 ha in the mid-Murrumbidgee zone. Multivariate analyses
(PRIMER 2002) were used to investigate differences in waterbird species
assemblages in the wetlands sites before and after Commonwealth environmental
watering, and with sites that did not receive environmental water in 2014-15.
Results
Waterbird diversity
In total 5,703 waterbirds from 36 waterbird species were recorded during the 2014-15
surveys of the Murrumbidgee wetland sites. This included the national endangered
Australasian bittern (Botaurus poiciloptilus) (EPBC Act), and Eastern great egret
(Ardea modesta) and sharp-tailed sandpiper (Calidris acuminata) which are listed
under two or more international migratory bird agreements (see Appendices).
Total waterbird diversity and abundance varied across the wetland zones in
response to varying patterns of flooding. Sites in the Nimmie-Caira zone supported
the most diverse waterbird assemblages (30 species) compared to the Redbank (25
species) and mid-Murrumbidgee (17 species) sites which received environmental
watering later in the 2014-15 water year. As some sites dried down exposing
shallower habitat and other sites received inflows over summer and autumn, the
overall diversity of waterbirds increased (Figure 50).
Two of the mid-Murrumbidgee sites were dry for 2014-15 (Sunshower or McKennas
lagoons) and therefore no waterbirds were observed. Inflows into the other two Mid-
Murrumbidgee sites, Yarradda (Action 2) and Gooragool lagoons in summer
provided habitat for filter-feeding ducks such as pink-eared ducks that often move
to wetlands on re-flooding to exploit peaks in invertebrate prey.
The composition of waterbird communities, based on waterbird functional groups,
differed between the three zones (ANOSIM R 0.2, p <0.01). Overall, ‘dabbling and
filter-feeding ducks’ were the most abundant group comprising more than 31 per

139
cent of waterbird abundance followed by ‘large wading birds’ (25%), ‘diving ducks,
aquatic gallinules and swans’ (22%), and ‘fish-eating (Piscivores)’ (13%) and the
remaining four waterbird groups (9%) (Figure 51, see Appendices). ‘Dabbling and
filter-feeding ducks’ (grey teal (Anas gracilis) and Pacific black duck (Anas
superciliosa) predominately) and ‘fish-eating (Piscivores) waterbirds’ (little black
cormorant (Phalacrocorax sulcirostris) and white-faced heron (Egretta
novaehollandiae) predominately) were also the most widespread functional groups
across the surveyed wetlands. Both groups were observed at 10 of the surveyed
wetlands which held water over 2014-15.
Figure 50 Maximum number of waterbird species recorded in each survey month in the three
wetland zones in the Murrumbidgee Catchment. Note that much of the mid-Murrumbidgee
zone was dry with only two sites receiving some inflows in summer 2015.

140
Figure 51 Mean count of each waterbird functional group (adjusted to birds/ha) in each
survey month across the four wetland zones. Note that the mid-Murrumbidgee zone did not
receive inflows until summer 2015 and this was limited to two sites only.
Across all zones the abundance of ‘fish-eating birds’, and ‘dabbling and filter-
feeding ducks’ contributed most to the similarities among sites in all survey periods.
The peaks in abundance in dabbling ducks and fish-eating birds over January and
March 2015 across the mid-Murrumbidgee and Nimmie-Caira zones contributed to
the most site differences. ‘Large-wading birds’ (ibis, egrets, for example) formed a
larger proportion of the waterbird communities in the Nimmie-Caira and Redbank
sites (Figure 51).
Waterbird breeding
Observed waterbird breeding was limited across the survey sites, with only observed
grey teal and Pacific black duck observed with broods of young.

141
Discussion
Waterbird breeding was not monitored as part of the 2014-15 LTIM program.
However small-scale egret, heron and cormorant breeding was reported following
aerial and ground surveys by NSW OEH and CEWO staff at seven sites across the
Lowbidgee floodplain, including Two Bridges Swamp, in the Redbank system and
Telephone Creek in the Nimmie-Caira. Waterbird breeding, including the total
number of nesting birds and number of active breeding sites is linked to the total
flooded area, large-scale waterbird breeding does not occur in years when only
small areas are inundated.
Several approaches to environmental water management can be taken to
maximise outcomes for waterbirds depending on the water availability scenario for
a given water year. Overall waterbird diversity was lower than in previous years
(Wassens et al. 2013a; Wassens et al. 2014b), reflecting the relatively small volumes of
environmental water utilised in the Nimmie-Caira and Redbank zones. Using
environmental flows to inundate large areas, covering a range of wetland types to
varying depths can cater for the water requirements of a range of waterbird species
and therefore maximise waterbird diversity outcomes (Bino et al. 2014). Creating a
diversity of habitats including areas of shallow water and muddy wetland margins
can also support species such as sharp-tailed sandpipers recognised on
international migratory agreements (JAMBA, CAMBA and ROKAMBA) as observed
over summer months in parts of the Nimmie-Caira.
Timing flows to inundate these types of shallow habitats in spring with a long draw-
down phase over autumn has the potential to provide feeding habitat for migratory
shorebirds during both their southward and northward migrations (Kingsford et al.
2005), as well as potentially stimulating high densities of microinvertebrates prey for
filter feeding ducks. In all cases considering the historical wetting and drying regime
is essential for each wetland type so that they can be watered to maximise the
associated wetland vegetation and the food sources on which waterbirds depend.
In years of median water availability winter-spring watering can prime the system for
potential breeding later in spring-summer months as seen in 2014-15. The use of
contingency allowances to support waterbird breeding in the Redbank zone can be
crucial for ensuring the colony sites and surrounding foraging habitats are flooded
for long enough to allow birds to fledge their young successfully. This approach can

142
also keep key breeding and feeding sites in ‘event-ready’ condition in intervening
years between large-scale natural flooding, particularly in parts of the Nimmie-Caira
floodways and associated feeding grounds which traditionally can support some of
the largest ibis colonies in Australia. In these wetter years the benefits of watering in
the previous intervening years and/or months can allow waterbirds to build
condition so they can readily exploit breeding opportunities and ensure abundant
food sources are available to support their successful breeding.

143
4 References
Anderson, H.K. (1915) Rescue Operations on the Murrumbidgee River. The Australian
Zoologist 1, 157-160.
Anderson, M., Gorley, R.N., and Clarke, K.R. (2008) 'Permanova+ for Primer: Guide to
Software and Statistical Methods.' (PRIMER-E Plymouth.)
ANZECC water quality guidelines (2000) 'Australia and New Zealand guidelines for
fresh and marine water quality '. In
(Australian and New Zealand environment and conservation council and
Agriculture and resource management council of Australia and New Zealand)
Available at
http://www.mincos.gov.au/publications/australian_and_new_zealand_guidelines_fo
r_fresh_and_marine_water_quality
Aristi, I., Arroita, M., Larrañaga, A., Ponsatí, L., Sabater, S., von Schiller, D., . . . Acuña,
V. (2014) Flow regulation by dams affects ecosystem metabolism in Mediterranean
rivers. Freshwater Biology 59(9), 1816-1829.
Arthington, A.H., and Pusey, B. (2003) Flow restoration and protection in Australian
rivers. River Research and Applications 19(5-6), 377-395.
Arumugam, P., and Geddes, M. (1992) Selectivity of microcrustacean zooplankton
by golden perch (Macquaria ambigua) larvae and fry in laboratory studies.
Transactions of the Royal Society of South Australia 116(1), 29-34.
Balcombe, S.R., Arthington, A.H., Foster, N.D., Thoms, M.C., Wilson, G.G., and Bunn,
S.E. (2006) Fish assemblages of an Australian dryland river: abundance, assemblage
structure and recruitment patterns in the Warrego River, Murray-Darling Basin. Marine
and Freshwater Research 57, 619-633.
Baldwin, D.S., and Mitchell, A.M. (2000) The effects of drying and re-flooding on the
sediment and soil nutrient dynamics of lowland river–floodplain systems: a synthesis.
Regulated Rivers: Research & Management 16(5), 457-467.

144
Baldwin, D.S., Whitworth, K.L., and Hockley, C.L. (2014) Uptake of dissolved organic
carbon by biofilms provides insights into the potential impact of loss of large woody
debris on the functioning of lowland rivers. Freshwater biology 59(4), 692-702.
Baumgartner, L.J., Conallin, J., Wooden, I., Campbell, B., Gee, R., Robinson, W.A.,
and Mallen‐Cooper, M. (2014) Using flow guilds of freshwater fish in an adaptive
management framework to simplify environmental flow delivery for semi‐arid riverine
systems. Fish and Fisheries 15(3), 410-427.
Beesley, L., King, A.J., Gawne, B., Koehn, J.D., Price, A., Nielsen, D., . . . Meredith, S.N.
(2014) Optimising environmental watering of floodplain wetlands for fish. Freshwater
Biology 59(10), 2024-2037.
Bino, G., Steinfeld, C., and Kingsford, R.T. (2014) Maximizing colonial waterbirds'
breeding events using identified ecological thresholds and environmental flow
management. Ecological Applications 24(1), 142-157.
Brock, M.A., and Casanova, M.T. (1997) Plant life at the edge of wetlands:
ecological responses to wetting and drying patterns. In Frontiers in ecology: building
the links. (Eds. N Klomp and I Lunt). (Oxford, UK)
Brock, M.A., Nielsen, D.L., Shiel, R.J., Green, J.D., and Langley, J.D. (2003) Drought
and aquatic community resilience: the role of eggs and seeds in sediments of
temporary wetlands. Freshwater Biology 48(7), 1207-1218.
Brock, M.A., Smith, R.G.B., and Jarman, P.J. (1999) Drain it, dam it: alteration of water
regime in shallow wetlands on the New England Tableland of New South Wales,
Australia. Wetlands Ecology and Management 7(1), 37-46.
Brooks, S., Cottingham, P., Butcher, R., and Hale, J. (2014) 'Murray-Darling Basin
aquatic ecosystem classification: Stage 2 report. .' (Peter Cottingham & Associates
report to the Commonwealth Environmental Water Office and Murray-Darling Basin
Authority,: Canberra.)
Bunn, S.E., and Arthington, A.H. (2002) Basic principles and ecological consequences
of altered flow regimes for aquatic biodiversity. Environmental Management 30(4),
492-507. [In English]

145
Cadwallader, P.L. (1977) 'J.O. Langtry's 1949-50 Murray River investigations.' (Fisheries
and Wildlife Division, Victoria)
Capon, S.J., and Brock, M.A. (2006) Flooding, soil seed bank dynamics and
vegetation resilience of a hydrologically variable desert floodplain. Freshwater
Biology 51(2), 206-223.
Carter, S. (2012) 'Sustainable Rivers Audit 2: Metric Processing System Report
prepared bynEnvironmental Dynamic.' (Murray Darling Basin Authority: Canberra.)
Casanova, M.T. (2011) Using water plant functional groups to investigate
environmental water requirements. Freshwater Biology 56(12), 2637-2652.
Casanova, M.T., and Brock, M.A. (2000) How do depth, duration and frequency of
flooding influence the establishment of wetland plant communities? Plant Ecology
147(3), 237-250.
Chan, L.M., and Zamudio, K.R. (2009) Population differentiation of temperate
amphibians in unpredictable environments. Molecular Ecology 18(15), 3185-3200.
Chessman, B. (2003) 'Integrated monitoring of environmental flows: state summary
report 1998-2000.' (NSW Department of Infrastructure, Planning and Natural
Resources: NSW)
Commonwealth Environmental Water Office (2014) 'Commonwealth environmental
water use Actions 2014-15: Murrumbidgee River Valley.' (Commonwealth of
Australia: Canberra)
Connelly, S., Pringle, C.M., Whiles, M.R., Lips, K.R., Kilham, S., and Brenes, R. (2011) Do
tadpoles affect leaf decomposition in neotropical streams? Freshwater Biology 56(9),
1863-1875.

146
Cook, R.A., Gawne, B., Petrie, R., Baldwin, D.S., Rees, G.N., Nielsen, D.L., and Ning,
N.S.P. (2015) River metabolism and carbon dynamics in response to flooding in a
lowland river. Marine and Freshwater Research, -.
Copp, G.H. (1992) Comparative microhabitat use of cyprinid larvae and juveniles in
a lotic floodplain channel. Environmental Biology of Fishes 33(1-2), 181-193.
Davies, P.E., Harris, J.H., Hillman, T.J., and Walker, K.F. (2010) The Sustainable Rivers
Audit: assessing river ecosystem health in the Murray–Darling Basin, Australia. Marine
and Freshwater Research 61(7), 764-777.
Davis, J.R., and Koop, K. (2006) Eutrophication in Australian Rivers, Reservoirs and
Estuaries – A Southern Hemisphere Perspective on the Science and its Implications.
Hydrobiologia 559(1), 23-76. [In English]
Devries, D.R., Stein, R.A., and Bremigan, M.T. (1998) Prey selection by larval fishes as
influenced by available zooplankton and gap limitation. Transactions of the
American Fisheries Society 127(6), 1040-1050.
Ebner, B.C., Scholz, O., and Gawne, B. (2009) Golden perch Macquaria ambigua
are flexible spawners in the Darling River, Australia. New Zealand Journal of Marine
and Freshwater Research 43(2), 571-578.
Frazier, P., and Page, K. (2006) The effect of river regulation on floodplain wetland
inundation, Murrumbidgee River, Australia. Marine and Freshwater Research 57(2),
133-141.
Frazier, P., Page, K., and Read, A. (2005) Effects of flow regulation in flow regime on
the Murrumbidgee River, South Eastern Australia: an assessment using a daily
estimation hydrological model. Australian Geographer 36(3), 301-314.
Gehrke, P. (1997) Species richness and composition of freshwater fish communities in
New South Wales rivers. Fish and Rivers in Stress. The New South Wales Rivers Survey,
New South Wales Fisheries Office of Conservation, Co-operative Research Centre for
Freshwater Ecology, Cronulla, NSW.

147
Gibbons, J.W., Winne, C.T., Scott, D.E., Willson, J.D., Glaudas, X., Andrews, K.M., . . .
Rothermel, B.B. (2006) Remarkable amphibian biomass and abundance in an
isolated wetland: Implications for wetland conservation. Conservation Biology 20(5),
1457-1465.
Gilligan, D. (2005) Fish communities of the Murrumbidgee catchment: status and
trends. NSW Department of Primary Industries. Fisheries final report series(75), 138.
Gilligan, D., and Schiller, S. (2003) Downstream transport of larval and juvenile fish.
Fisheries Final Report Series No. 50, 66pp.
Hale, J., Stoffels, R., Butcher, R., Shackleton, M., Brooks, S., and Gawne, B. (2014)
Commonwealth Environmental Water Office Long Term Intervention Monitoring
Project - Standard Methods.
Hardwick, L., and Maquire, J. (2012) 'Environmental water needs of the Lower
Murrumbidgee (Lowbidgee) floodplain: Discussion Paper 1 - Approach and
ecological considerations.' (NSW Office of Water)
Heugens, E.H.W., Hendriks, A.J., Dekker, T., Straalen, N.M.v., and Admiraal, W. (2001)
A review of the effects of multiple stressors on aquatic organisms and analysis of
uncertainty factors for use in risk assessment. Critical Reviews in Toxicology 31(3), 247-
284.
Hilton, J., O'Hare, M., Bowes, M.J., and Jones, J.I. (2006) How green is my river? A new
paradigm of eutrophication in rivers. Science of The Total Environment 365(1–3), 66-
83.
Humphries, P., King, A.J., and Koehn, J.D. (1999) Fish, flows and floodplains: links
between freshwater fishes and their environment in the Murray-Darling River System,
Australia. Environmental Biology of Fishes 56(1), 129-151.
Jenkins, K.M., and Boulton, A.J. (2003) Connectivity in a dryland river: short-term
aquatic microinvertebrate recruitment following floodplain inundation. Ecology
84(10), 2708-2723.

148
Jenkins, K.M., and Boulton, A.J. (2007) Detecting impacts and setting restoration
targets in arid-zone rivers: aquatic micro-invertebrate responses to reduced
floodplain inundation. Journal of Applied Ecology 44(4), 823-832.
Jenkins, K.M., Iles, J., Smith, J., Kingsford, R.T., Forrest, M., and Rayner, T. (2013)
'Monitoring of ecosystem responses to the delivery of environmental water in the
Lower Murrumbidgee River and wetlands, 2011-2012.' (Australian Wetlands, Rivers
and Landscapes Centre. Prepared for Commonwealth Environmental Water)
Kaminskas, S., and Humphries, P. (2009) Diet of Murray cod (Maccullochella peelii
peelii)(Mitchell) larvae in an Australian lowland river in low flow and high flow years.
Hydrobiologia 636(1), 449-461.
Kayranli, B., Scholz, M., Mustafa, A., and Hedmark, Å. (2010) Carbon Storage and
Fluxes within Freshwater Wetlands: a Critical Review. Wetlands 30(1), 111-124.
Keck, F., and Lepori, F. (2012) Can we predict nutrient limitation in streams and
rivers? Freshwater Biology 57(7), 1410-1421.
Kennett, R.M., and Georges, A. (1990) Habitat Utilization and Its Relationship to
Growth and Reproduction of the Eastern Long-Necked Turtle, Chelodina longicollis
(Testudinata: Chelidae), from Australia. Herpetologica 46(1), 22-33.
King, A., Tonkin, Z., and Mahoney, J. (2009a) Environmental flow enhances native fish
spawning and recruitment in the Murray River, Australia. River Research and
Applications 25(10), 1205-1218.
King, A.J. (2004) Density and distribution of potential prey for larval fish in the main
channel of a floodplain river: pelagic versus epibenthic meiofauna. River Research
and Applications 20(8), 883-897.
King, A.J., Crook, D.A., Koster, W.M., Mahoney, J., and Tonkin, Z. (2005) Comparison
of larval fish drift in the Lower Goulburn and mid-Murray Rivers. Ecological
Management & Restoration 6(2), 136-139.

149
King, A.J., Humphries, P., and McCasker, N.G. (2013) Reproduction and early life
history. In Ecology of Australian Freshwater Fishes. pp. 159-193. (CSIRO Publishing:
Melbourne)
King, A.J., Tonkin, Z., and Mahoney, J. (2009b) Environmental flow enhances native
fish spawning and recruitment in the Murray River, Australia. River Research and
Applications 25(10), 1205-1218.
Kingsford, R.T., and Auld, K.M. (2005) Waterbird breeding and environmental flow
management in the Macquarie Marshes, arid Australia. River Research and
Applications 21(2-3), 187-200.
Kingsford, R.T., Brandis, K., Thomas, R.F., Crighton, P., Knowles, E., and Gale, E. (2004a)
Classifying landform at broad spatial scales: the distribution and conservation of
wetlands in New South Wales, Australia. Marine and Freshwater Research 55(1), 17-
31.
Kingsford, R.T., and Norman, F.I. (2002) Australian waterbirds - products of the
continent's ecology. Emu 102, 47-69.
Kingsford, R.T., and Thomas, R.F. (2004b) Destruction of wetlands and waterbird
populations by dams and irrigation on the Murrumbidgee River in arid Australia.
Environmental Management 34(3), 383-396.
Knowles, L., Iles, J., Lu, Y., Kobayashi, T., and Wen, L. (2012) Phosphorus dynamics in
an ephemeral wetland ecosystem after re-flooding. Environmental Modelling &
Software 35(0), 31-37.
Kobayashi, T., Ralph, T., Ryder, D., and Hunter, S. (2013) Gross primary productivity of
phytoplankton and planktonic respiration in inland floodplain wetlands of southeast
Australia: habitat-dependent patterns and regulating processes. Ecological
Research, 1-11. [In English]
Kobayashi, T., Ryder, D., Gordon, G., Shannon, I., Ingleton, T., Carpenter, M., and
Jacobs, S. (2009) Short-term response of nutrients, carbon and planktonic microbial
communities to floodplain wetland inundation. Aquatic Ecology 43(4), 843-858.

150
Koehn, J.D., Copeland, C., and Stamation, K. (2014) The future for managing fishes in
the Murray‐Darling Basin, south‐eastern Australia. Ecological Management &
Restoration 15(s1), 1-2.
Koster, W.M., Dawson, D.R., O'Mahony, D.J., Moloney, P.D., and Crook, D.A. (2014)
Timing, frequency and environmental conditions associated with mainstem-tributary
movement by a lowland river fish, golden perch (Macquaria ambigua). PloS one
9(5).
Kun, W., Qu-fei, L., Qian, L., Fang, C., and Hai-jun, X. (2009) Primary study on the age
and growth of Misgurnus anguillicaudatus and Paramisgurnus dabryanus in the area
of Suzhou. Journal of Shanghai Ocean University 5, 007.
Lintermans, M., Lyon, J.P., Hames, F., Hammer, M.P., Kearns, J., Raadik, T.A., and Hall,
A. (2014) Managing fish species under threat: case studies from the Native Fish
Strategy for the Murray‐Darling Basin, Australia. Ecological Management &
Restoration 15(s1), 57-61.
Lorenzoni, M., Corboli, M., Ghetti, L., Pedicillo, G., and Carosi, A. (2007) Growth and
reproduction of the goldfish Carassius auratus: a case study from Italy. In Biological
invaders in inland waters: Profiles, distribution, and threats. pp. 259-273. (Springer)
Lyon, J., Stuart, I., Ramsey, D., and O’Mahony, J. (2010) The effect of water level on
lateral movements of fish between river and off-channel habitats and implications
for management. Marine and Freshwater Research 61(3), 271-278.
Mallen-Cooper, M., and Stuart, I.G. (2003) Age, growth and non-flood recruitment of
two potamodromous fishes in a large semi-arid/temperate river system. River
research and applications 19(7), 697-719.
Mallen-Cooper, M.G. (1996) Fishways and freshwater fish migration on South-Eastern
Australia.
Marcarelli, A.M., Kirk, R.W.V., and Baxter, C.V. (2010) Predicting effects of hydrologic
alteration and climate change on ecosystem metabolism in a western U.S. river.
Ecological Applications 20(8), 2081-2088.

151
McDowall, R.M. (1996) 'Freshwater fishes of south-eastern Australia.' (Reed)
McGinness, H.M., Arthur, A.D., Ward, K.A., and Ward, P.A. (2014) Floodplain
amphibian abundance: responses to flooding and habitat type in Barmah Forest,
Murray River, Australia. Wildlife Research 41(2), 149-162.
Murray, P. (2008) 'Murrumbidgee wetlands resource book.' (Murrumbidgee
Catchment Management Authority: New South Wales)
Neumann, R.M., and Allen, M.S. (2007) Size structure. In Analysis and interpretation of
freshwater fisheries data. (Eds. CS Guy and ML Brown) pp. 375-421. (American
Fisheries Society: Bethesda, Maryland)
Nielsen, D., Podnar, K., Watts, R., and Wilson, A. (2012) Empirical evidence linking
increased hydrologic stability with decreased biotic diversity within wetlands.
Hydrobiologia, 1-16.
Page, K., Read, A., Frazier, P., and Mount, N. (2005) The effect of altered flow regime
on the frequency and duration of bankfull discharge: Murrumbidgee River, Australia.
River research and applications 21, 567-578.
Poff, N.L., Allan, J.D., Bain, M.B., Karr, J.R., Prestegaard, K.L., Richter, B.D., . . .
Stromberg, J.C. (1997) The natural flow regime. BioScience 47(11), 769-784.
PRIMER (2002) PRIMER 5 for Windows. Version 5.2.9. (PRIMER-E Ltd.)
Puckridge, J.T., and Walker, K.F. (1990) Reproductive Biology and Larval
Development of a Gizzard Shad, Nematalosa erebi (Gϋnther) (Dorosomatinae:
Teleostei), in the River Murray, South Australia. Australian Journal of Marine
Freshwater Research 41, 695- 712.
Pusey, B., Kennard, M., and Arthington, A. (2004) 'Freshwater fishes of north-eastern
Australia.' (CSIRO publishing)

152
Reid, M., and Capon, S. (2011) Role of the soil seed bank in vegetation responses to
environmental flows on a drought-affected floodplain. River Systems 19(3), 249-259.
Roberts, J.J., and Rahel, F.J. (2008) Irrigation canals as sink habitat for trout and other
fishes in a Wyoming drainage. Transactions of the American Fisheries Society 137(4),
951-961.
Robertson, A.I., Bunn, S.E., Boon, P.I., and Walker, K.F. (1999a) Sources, sinks and
transformations of organic carbon in Australian floodplain rivers. Marine and
Freshwater Research 50(8), 813-829.
Robertson, A.I., Bunn, S.E., Walker, K.F., and Boon, P.I. (1999b) Sources, sinks and
transformations of organic carbon in Australian floodplain rivers. Marine and
Freshwater Research 50(8), 813-829.
Robinson, W.A. (2012) 'Calculating statistics, metrics, sub-indicators and the SRA Fish
theme index: A Sustainable Rivers Audit Technical report.' (Consultancy report to the
Murray-Darling Basin Authority)
Rolls, R.J., Growns, I.O., Khan, T.A., Wilson, G.G., Ellison, T.L., Prior, A., and Waring, C.C.
(2013) Fish recruitment in rivers with modified discharge depends on the interacting
effects of flow and thermal regimes. Freshwater Biology.
Roshier, D.A., Robertson, A.I., and Kingsford, R.T. (2002) Responses of waterbirds to
flooding in an arid region of Australia and implications for conservation. Biological
Conservation 106(3), 399-411.
Roshier, D.A., Robertson, A.I., Kingsford, R.T., and Green, D.G. (2001) Continental-
scale interactions with temporary resources may explain the paradox of large
populations of desert waterbirds in Australia. Landscape Ecology 16(6), 547-556.
Rowland, S. Diet and feeding of Murray cod (Maccullochella peelii) larvae. In
'Proceedings of the Linnean Society of New South Wales', 1992, pp. 193-201

153
Rowland, S.J. (1983) Spawning of the Australian freshwater fish Murray cod,
Maccullochella peeli (Mitchell), in earthen ponds. Journal of Fish Biology 23, 525-534.
Rowland, S.J. (1984) The hormone-induced spawning of silver perch, Bidyanus
bidyanus (Mitchell)(Teraponidae). Aquaculture 42(1), 83-86.
Serafini, L.G., and Humphries, P. (2004) Preliminary guide to the identification of
larvae of fish, with a bibliography of their studies, from the Murray-Darling Basin. In
Taxonomy Workshop. (Cooperative Research Centre for Freshwater Ecology: Lake
Hume Resort)
Sheldon, F., Boulton, A.J., and Puckridge, J.T. (2002) Conservation value of variable
connectivity: aquatic invertebrate assemblages of channel and floodplain habitats
of a central Australian arid-zone river, Cooper Creek. Biological Conservation 103(1),
13-31.
Shiel, R., and Dickson, J. (1995) Cladocera recorded from Australia.
Shiel, R.J. (1995) 'A guide to identification of rotifers, cladocerans and copepods
from Australian inland waters.' (Co-operative Research Centre for Freshwater
Ecology Canberra)
Sinclair Knight Merz (2011) 'Environmental Water Delivery: Murrumbidgee Valley.'
(Prepared for Commonwealth Environmental Water, Department of Sustainability,
Environment, Water, Population and Communities: Canberra.)
Smirnov, N.N., and Timms, B. (1983) A revision of the Australian Cladocera
(Crustacea). Rec. Aust. Mus. Suppl 1, 1-132.
Spencer, J., Thomas, R., Wassens, S., Lu, Y., Wen, L., Iles, J., . . . Saintilan, N. (2011a)
Testing wetland resilience: monitoring and modelling of flows in the Macquarie
Marshes and Lowbidgee wetlands in 2009-11. NSW Office of Environment and
Heritage and Charles Sturt University.

154
Spencer, J., Thomas, R., Wassens, S., Lu, Y., Wen, L., Iles, J., . . . Saintilan, N. (2011b)
'Environmental flow monitoring in the Lowbidgee wetlands and Macquarie Marshes
in 2009-10. Testing wetland resilience: monitoring the response of iconic wetlands to
re-flooding following historic drought project.' (NSW Department of Environment,
Climate Change and Water: Sydney)
Vilizzi, L., and Walker, K.F. (1999) Age and growth of the common carp, Cyprinus
carpio, in the River Murray, Australia: validation, consistency of age interpretation,
and growth models. Environmental Biology of Fishes 54(1), 77-106.
Vink, S., Bormans, M., Ford, P.W., and Grigg, N.J. (2005) Quantifying ecosystem
metabolism in the middle reaches of Murrumbidgee River during irrigation flow
releases. Marine and Freshwater Research 56(2), 227-241.
Ward, J.V., Tockner, K., Uehlinger, U., and Malard, F. (2001) Understanding natural
patterns and processes in river corridors as the basis for effective river restoration
Regulated Rivers: Research and Management 17 (6), 311-323.
Wassens, S. (2010a) Flooding regimes for frogs in lowland rivers of the Murray-Darling
Basin In Ecosystem Response Modelling in the Murray-Darling Basin. (Eds. N Saintilann
and IC Overton) pp. 213-228. (CSIRO Publishing Canberra)
Wassens, S. (2010b) Frogs. In Floodplain wetland biota in the Murray-Darling Basin:
Water and habitat requirements. . (Eds. K Rogers and TJ Ralph) pp. 253-274. (CSIRO
Publishing: Canberra)
Wassens, S., and Amos, C. (2011) 'Assessing the resilience of frog communities within
River Red Gum forest: Report to New South Wales Office of Environment and
Heritage.' (Institute of Land, Water and Society: Albury)
Wassens, S., Hall, A., Osborne, W., and Watts, R.J. (2010) Habitat characteristics
predict occupancy patterns of the endangered amphibian Litoria raniformis in flow-
regulated flood plain wetlands. Austral Ecology 35(8), 944-955.
Wassens, S., Jenkins, K., Spencer, J., Bindokas, J., Kobayashi, T., Bino, G., . . . Hall, A.
(2013a) Monitoring of ecosystem responses to the delivery of environmental water in
the Murrumbidgee River and connected wetlands, 2012-13. Final report 2

155
Commonwealth Environmental Water Office. Institute for Land, Water and Society,
Charles Sturt University.
Wassens, S., Jenkins, K., Spencer, J., Thiem, J., Kobayashi, T., Bino, G., . . . Hall, A.
(2014a) 'Murrumbidgee Monitoring and Evaluation Plan ' (Commonwealth of
Australia Canberra)
Wassens, S., Jenkins, K., Spencer, J., Wolfenden, B., Ocock, J., Thiem, J.D., . . . Hall , A.
(2014b) 'Monitoring and evaluating ecological responses to Commonwealth
environmental water use in the Murrumbidgee River Valley, in 2013-14. Final Report.'
(Commonwealth Environmental Water Office and Charles Sturt University Canberra,
Albury)
Wassens, S., Spencer, J., and Lenon, E. (2013b) 'Assessment of the status of Southern
bell frogs in the Lower Murrumbidgee after major flooding in 2010-12.' (Institute for
Land, Water and Society and Office of Environment and Heritage: Albury and
Sydney)
Wassens, S., and Spencer, J.A. (2012a) 'Monitoring of ecosystem responses to a
major natural flood in Autumn 2012 ' (Institute for Land, Water and Society, Charles
Sturt University for Department of Sustainability, Environment, Water, Population and
Communities Albury)
Wassens, S., Watts, R.J., Jansen, A., and Roshier, D. (2008) Movement patterns of
southern bell frogs (Litoria raniformis) in response to flooding. Wildlife Research 35(1),
50-58.
Wassens, S., Watts, R.J., Spencer, J.A., Howitt, J., McCasker, N.A., Griese, V., . . . Hall,
A. (2012b) Monitoring of ecosystem responses to the delivery of environmental water
in the Murrumbidgee system. Report 2 prepared for Commonwealth Environmental
Water Office. Institute of Land, Water and Society, Charles Sturt University.
Watts, R., Allan, C., Bowmer, K.H., Page, K.J., Ryder, D.S., and AWilson, A.L. (2009)
Pulsed Flows: a review of environmental costs and benefits and best practice.
National Water Commission, Canberra.

156
Wen, L., Ling, J., Saintilan, N., and Rogers, K. (2009) An investigation of the
hydrological requirements of River Red Gum (Eucalyptus camaldulensis) Forest, using
Classification and Regression Tree modelling. Ecohydrology 2(2), 143-155.
Williams, W.D. (1980) 'Australian freshwater life: the invertebrates of Australian inland
waters.' (Macmillan Education AU)
Zampatti, B.P., Wilson, P.J., Baumgartner, L., Koster, W., Livore, J.P., McCasker, N., . . .
Ye, Q. (2015) 'Reproduction and recruitment of golden perch (Macquaria ambigua
ambigua) in the southern Murray-Darling Basin in 2013-2014: an exploration of river-
scale response, connectivity and population dynamics.' (South Australian Research
and Development Institute (Aquatic Sciences): Adelaide)

157
5 Appendices

158
1. Wetland-dependent bird species recorded during surveys of the Murrumbidgee in 2014-15
Family Common Name^ Scientific Name Functional Group# CAVS Code
Accipitridae Whistling kite Haliastur sphenurus Raptors CAVS: 0228
Accipitridae White-bellied sea-eagle Haliaaetus leucogaster Raptors CAVS: 0226
Acrocephalidae Australian reed-warbler Acrocephalus australis Reed-inhabiting passerines CAVS: 524
Alcedinidae Azure kingfisher Ceyx azureus Piscivores CAVS: 0319
Anatidae Australasian shoveler Anas rhynchotis Dabbling and filter-feeding ducks CAVS: 0212
Anatidae Australian shelduck Tadorna tadornoides Grazing ducks CAVS: 0207
Anatidae Australian wood duck Chenonetta jubata Grazing ducks CAVS: 0202
Anatidae Black swan* Cygnus atratus Diving ducks, aquatic gallinules and swans CAVS: 0203
Anatidae Grey teal* Anas gracilis Dabbling and filter-feeding ducks CAVS: 0211
Anatidae Hardhead Aythya australis Dabbling and filter-feeding ducks CAVS: 0215
Anatidae Musk duck Biziura lobata Diving ducks, aquatic gallinules and swans CAVS: 0217
Anatidae Pacific black duck* Anas superciliosa Dabbling and filter-feeding ducks CAVS: 0208
Anatidae Pink-eared duck Malacorhynchus membranaceus Dabbling and filter-feeding ducks CAVS: 0213
Anatidae Plumed whistling-duck Dendrocygna eytoni Grazing ducks CAVS: 0205
Anhingidae Australasian darter* Anhinga novaehollandiae Piscivores CAVS: 8731
Ardeidae Australasian bittern Botaurus pociloptilus Piscivores CAVS: 0197
Ardeidae Eastern great egret* Ardea modesta Piscivores CAVS: 8712
Ardeidae intermediate egret* Ardea intermedia Piscivores CAVS: 0186
Ardeidae Little egret* Egretta garzetta Piscivores CAVS: 0185
Ardeidae Nankeen night-heron* Nycticorax caledonicus Piscivores CAVS: 0192
Ardeidae White-faced heron Egretta novaehollandiae Piscivores CAVS: 0188
Ardeidae White-necked heron Ardea pacifica Piscivores CAVS: 0189
Charadriidae Black-fronted dotterel Elseyornis melanops Australian-breeding Charadriiform shorebirds CAVS: 0144
Charadriidae Masked lapwing Vanellus miles Australian-breeding Charadriiform shorebirds CAVS: 0133
Charadriidae Red-capped plover Charadrius ruficapillus Australian-breeding Charadriiform shorebirds CAVS: 0143
Charadriidae Red-kneed dotterel Erythrogonys cinctus Australian-breeding Charadriiform shorebirds CAVS: 0132

159
Pelecanidae Australian pelican Pelecanus conspicillatus Piscivores CAVS: 0106
Phalacrocoracidae Great cormorant* Phalacrocorax carbo Piscivores CAVS: 0096
Phalacrocoracidae Little black cormorant* Phalacrocorax sulcirostris Piscivores CAVS: 0097
Phalacrocoracidae Little pied cormorant* Microcarbo melanoleucos Piscivores CAVS: 0100
Podicipedidae Australasian grebe Tachybaptus novaehollandiae Piscivores CAVS: 0061
Podicipedidae Hoary-headed grebe Poliocephalus poliocephalus Piscivores CAVS: 0062
Rallidae Black-tailed native-hen Tribonyx ventralis Rails and shoreline gallinules CAVS: 0055
Rallidae Eurasian coot Fulica atra Diving ducks, aquatic gallinules and swans CAVS: 0059
Recurvirostridae Black-winged stilt Himantopus himantopus Australian-breeding Charadriiform shorebirds CAVS: 0146
Scolopacidae Sharp-tailed sandpiper Calidris acuminata Migratory Charadriiform shorebirds CAVS: 0163
Threskiornithidae Australian white ibis* Threskiornis molucca Large wading birds CAVS: 0179
Threskiornithidae Royal spoonbill Platalea regia Large wading birds CAVS: 0181
Threskiornithidae Straw-necked ibis Threskiornis spinicollis Large wading birds CAVS: 0180
Threskiornithidae Yellow-billed spoonbill Platalea flavipes Large wading birds CAVS: 0182
* Breeding activity: species recorded nesting and/or with young. ^ Status: J = JAMBA, C = CAMBA, R = ROKAMBA (International migratory bird
agreements Australia has with Japan, China, and Republic of Korea, respectively), E = endangered under Commonwealth EPBC Act 1999.
Nomenclature taken from Christidis and Boles (2008). # Functional groups as per Hale et al. (2014).

160
2. Classification and Regression Tree (CART) analysis
We undertook a Classification and Regression Tree (CART) approach to identify key
thresholds that determine the occurrence of larvae and eggs of key fish species for
both drift and light traps. We considered a range of factors including hydrology,
water temperature, dissolved organic carbon (DOC), chlorophyll a, and
microinvertebrates (see Table 3).
Cod species
Cod species were captured in the greatest abundance (n=809), and occurred at all
sites. The CART model for combined total drift net and light traps of cod species
showed a temperature threshold, with larval cod species more abundant once
temperature was greater than or equal to 22
Figure 52 Classification and Regression Tree larval Cod species CPUE
Silver Perch
Silver perch eggs (n=619) were collected from all sites in the Narrandera zone, and
captures peaked on 3 December 2014 In the Carrathool zone, silver perch eggs
were also collected from all three sites, peaking on the 1–2 December 2014. No silver
perch larvae were captured. The CART analysis confirmed water temperature as a
key factor driving spawning by Silver perch, with the model identifying a single split
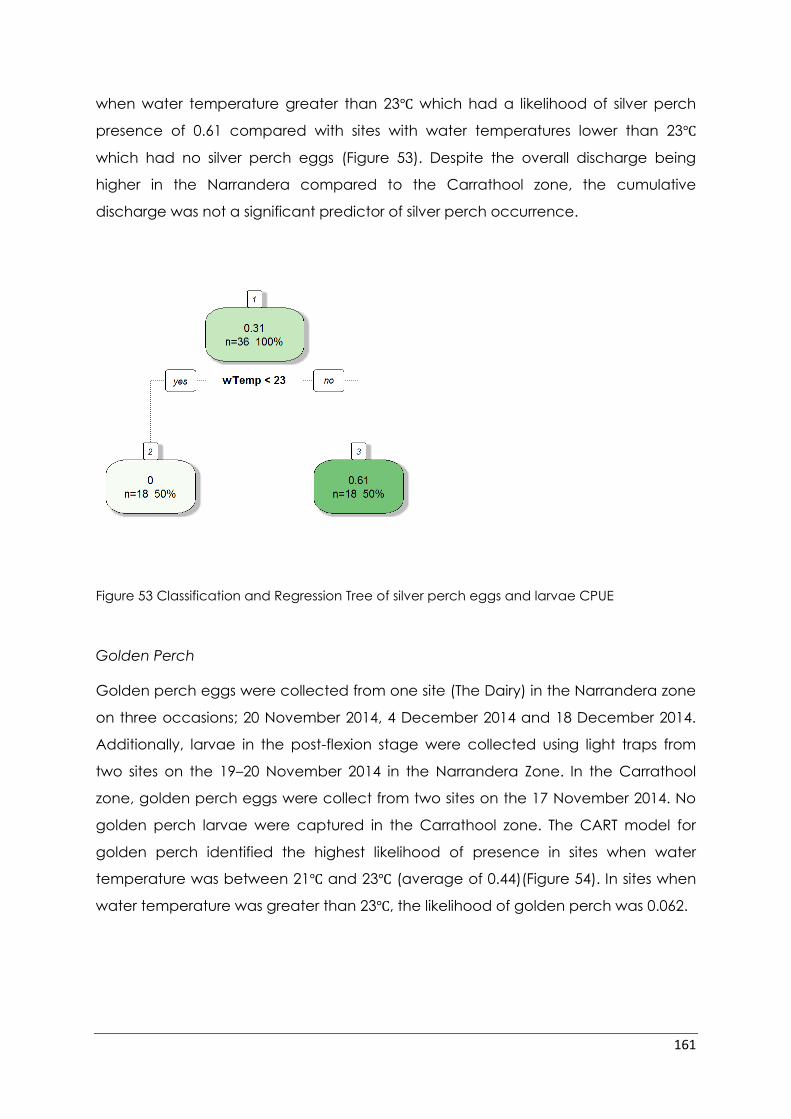
161
when water temperature greater than 23 which had a likelihood of silver perch
presence of 0.61 compared with sites with water temperatures lower than 23
which had no silver perch eggs (Figure 53). Despite the overall discharge being
higher in the Narrandera compared to the Carrathool zone, the cumulative
discharge was not a significant predictor of silver perch occurrence.
Figure 53 Classification and Regression Tree of silver perch eggs and larvae CPUE
Golden Perch
Golden perch eggs were collected from one site (The Dairy) in the Narrandera zone
on three occasions; 20 November 2014, 4 December 2014 and 18 December 2014.
Additionally, larvae in the post-flexion stage were collected using light traps from
two sites on the 19–20 November 2014 in the Narrandera Zone. In the Carrathool
zone, golden perch eggs were collect from two sites on the 17 November 2014. No
golden perch larvae were captured in the Carrathool zone. The CART model for
golden perch identified the highest likelihood of presence in sites when water
temperature was between 21 and 23 (average of 0.44)(Figure 54). In sites when
water temperature was greater than 23 , the likelihood of golden perch was 0.062.

162
Figure 54 Classification and Regression Tree of Golden perch eggs and larvae CPUE
The occurrence and abundance of fish, frogs and waterbirds in wetlands targeted
with environmental water is often driven by availability of key hydrological and
biological resources including the area of wetland inundated, water depths and
food resources. To determine if the environmental watering actions achieved critical
thresholds required to support native fish, frog and waterbirds, we employed a
Classification and Regression Tree (CART) approach.
Waterbirds
Overall, 36 waterbird species were observed across the 12 Murrumbidgee LTIM
wetland survey sites. Waterbird diversity and abundance peaked in the January
2015 surveys when the extent of flooding was greatest. Under Action 2 Yarradda
Lagoon received water in December 2014, with large numbers of pink-eared ducks
Malacorhynchus membranaceus recorded. In the Lowbidgee floodplain (Action 6)
two species listed on two or more international bilateral migratory bird agreements
(JAMBA, CAMBA and ROKAMBA), the Eastern great egret (Ardea modesta) and
sharp-tailed sandpiper (Calidris acuminate) along with the nationally endangered

163
Australasian bittern (Botaurus poiciloptilus) (EPBC Act), were recorded. Overall fish
eating waterbirds and dabbling ducks were the most abundant functional groups.
Water depth was a key parameter influencing the abundance of fish easting
waterbirds through wetlands in the mid-Murrumbidgee and Lowbidgee floodplain,
The CART analysis identified, wetlands with water depth greater than 0.51 m, had a
far higher abundances of fish-eating waterbirds (average abundance of 17 birds)
compared shallow, drying wetlands (average abundance 0.26 birds) (Figure 55).
While water depth was the key driver determining the abundance of fish eating
waterbirds, Food availability was also an important driver of waterbird abundance,
with wetlands where total fish abundance (CPUE) greater than 13 fish supporting
having a greater abundance of fish-eating birds (on average 29 fish-eating
waterbirds) compared to sites where lower fish CPUE was recorded (on average 8
fish-eating waterbirds) (Figure 55).
Figure 55 Classification and Regression Tree of fish eating waterbirds
In contrast, water depth was not a significant driver of the abundance of filter-
feeding ducks species, such as pink-eared ducks and Australasian shovelers Anas
rhynchotis but the availability of food resources mainly benthic microinvertebrates
was the key driver for the number of this group of waterbirds. Based on the CART
model, sites that had total benthic bio-volume over 40,000,000 had an average filter-
feeding duck abundance of 40 (total 437) while in sites with lower benthic bio-
volume, average duck abundance was 0.18 (Figure 56).

164
Figure 56 Classification and Regression Tree of filter-feeding ducks
Fish
In wetlands a total of 38,979 fish comprising six native and four exotic species were
captured across 10 LTIM wetland sites that contained water between September
2014 and May 2015. Carp gudgeon, bony herring and Australian smelt were the
most abundant native species, while gambusia, common carp and oriental
weatherloach were the most commonly recorded exotic species (Figure 57). Despite
being filled via pumping, fish were present in Yarradda lagoon (Action 2) with the
community dominated by bony herring and gambusia. Fish communities differed
significantly between the three wetland zones (ANOSIM Global R 0.226, p =0.001). In
the Redbank zone, relatively high numbers of oriental weatherloach were observed
in November and January, while the native Carp gudgeon were most abundant in
January and March 2015. In Nimmie-Caira, fish numbers were dominated by Carp
gudgeon and with smaller numbers of common carp.

165
Figure 57 Total fish numbers in the three zones and four survey occasions
When both native and exotic species were considered together, the availability of
water is the key predictor of fish CPUE, with no fish recorded when water depth were
below the critical 0.24m (Figure 58. Once some level of inundation has been
achieved, the abundance of fish in the wetlands increased markedly once
environmental watering had inundated the wetland to more than 0.84 (84%) of its
total area CPUE (46, n=7), while in wetlands where the proportion of inundation was
less than 84%, fish CPUE was 15. Of those, sites with water temperature lower than
23 had an average fish CPUE of 20 while sites with water temperature higher than
23 had an average fish CPUE of 7.4.

166
Figure 58 Classification and Regression Tree of all fish species CPUE
Native fish
When considered separately, the CART model for native fish indicate greater
sensitivity to water depth, compared to the previous model where all species are
combined. Native fish CPUE was highest water depth was greater than 0.91m
(compared to 0.24m for all species model), within these wetlands water temperature
lower than 24 (average 23 CPUE), (Figure 59). In sites with water temperatures lower
than 24 average native CPUE was 6.2. In sites with water depth lower than 0.91m
average CPUE was 2.3 and those between 0.91m and 0.26m had average CPUE of
5.9.

167
Figure 59 Classification and Regression Tree of native fish CPUE abundance
Exotic fish
The proportion of the wetland inundated had a significant effect on the abundance
of exotic species, with exotic fish species more abundant in wetlands that were only
partially inundated (less than 0.8) (Figure 60). Of these wetlands with higher exotic fish
CPUE, deeper wetlands had higher CPUE than did wetlands less than 0.24m, broadly
reflecting the response of all fish species to wetland inundation.

168
Figure 60 Classification and Regression Tree of exotic fish CPUE abundance
Frogs and tadpoles
Overall, 2,212 adult frogs (seen and heard) and 1,100 tadpoles of six species were
recorded between September 2014 and May 2015 across 10 LTIM monitoring sites,
with two sites remaining dry throughout 2014-15. Adult barking marsh frogs
(Limnodynastes fletcheri), spotted marsh frogs (Limnodynastes tasmaniensis), plains
froglets (Crinia parinsignifera) were recorded in all three zones. Peron’s tree frogs
(Litoria peronii), inland banjo frogs (Limnodynastes interioris) were less widespread,
while the vulnerable southern bell frog (Litoria raniformis) had the most restricted
distribution, only occurring across the four Nimmie-Caira sites.
Commonwealth environmental watering targeted known habitats of the southern
bell frog (Litoria raniformis) in the Nimmie-Caira zone (Action 6). Calling and tadpoles
of southern bell frogs and other frog species were recorded at all four LTIM
monitoring wetlands in the Nimmie-Caira, indicating that these flows were successful
in created breeding opportunities for this nationally vulnerable species, and other
floodplain frog species. Commonwealth environmental watering targeted one
wetland (Yarradda Lagoon) in the mid-Murrumbidgee wetland systems (Action 2).

169
Inland banjo frog (Limnodynastes interioris) adults and tadpoles were recorded in
this wetland for the first time since monitoring commenced in 2010. Large numbers of
Peron’s tree frog (Litoria peronii) tadpoles were also recorded.
Frogs
Water temperate influenced the abundance of frogs, with just 36 of the 2,157
individuals recorded, occurring in wetlands with water temperate below 17 . The
majority of individuals were recorded in wetlands once water temperature
exceeded 25 (average abundance was 112 compared to water temperatures
between 17 and 25 had frog abundance of 56 (n=24), (Figure 61). In those sites, a
third split was identified when water PH was lower than 7.7, where frog abundance
was 72 compared with 29.
Figure 61 Classification and Regression Tree of frog abundance
Tadpoles
While the abundance of adult frogs were influenced by water temperature, frog
breeding outcomes were most strongly linked to inundation area, with the average
tadpole abundance highest once environmental watering of wetlands had

170
achieved wetlands inundation above 0.65 (65% of the total wetland area) (Figure
62). Some breeding did occur at sites with lower levels of inundation, including
Yarradda Lagoon in the mid-Murrumbidgee, and in these instances the abundance
of tadpoles was higher when wetlands had higher when the pelagic bio-volume
was greater than 11,000,000 where tadpole abundance was 0.41 compared with
0.034.
Figure 62 Classification and Regression Tree of tadpole abundance

171


