Commonwealth of Virginia Compensation and Health Benefits Department of Human Resource Management House Appropriations Committee Compensation and Retirement Subcommittee General Assembly Building, Richmond, VA January 13, 2011
Transcript
Commonwealth of VirginiaCompensation and Health Benefits
Department of Human Resource Management
House Appropriations CommitteeCompensation and Retirement Subcommittee
General Assembly Building, Richmond, VAJanuary 13, 2011
Compensation
January 13, 2011 3
State Employee Salary FY10 – FY12
Budget Proposal
Requires a 5% employee contribution to retirement plan effective July 2011
Provides a 3% salary increase effective July 2011
Provides up to a 2% potential bonus effective December 2011 if certain operational efficiency and spending reduction targets are met
January 13, 2011 4
Classified Employees
Salaries
Average salary $41,941
Median Salary $37,432
Lowest Salary $15,371
Highest Salary $236,086
Source: PMIS data as of June 30 and December 31, 2010
January 13, 2011 5
Classified Employees
Pay Bands
Source: PMIS data as of September 2, 2010
Minimum Maximum Number Percent
1 15,371$ 31,548$ 2,696 3.90%
2 20,082$ 41,214$ 9,817 14.21%
3 23,999$ 49,255$ 23,466 33.97%
4 31,352$ 64,347$ 17,346 25.11%
5 40,959$ 84,062$ 11,626 16.83%
6 53,510$ 109,818$ 3,513 5.09%
7 69,907$ 143,470$ 404 0.58%
8 91,324$ 187,430$ 199 0.29%
9 119,308$ MARKET 15 0.02%
EMPLOYEESBANDS RANGE
Pay Band 3 has the most employees
January 13, 2011 6
State Employee Salary Comparison
Market Increases
Percent Increase
Fiscal Year
Source: Appropriation Acts
State employee salary increases lag the market
0
1
2
3
4
5
6
7
96 97 98 99 00 01 02 03 04 05 06 07 08 09 10
StateMarketLinear (State)Linear (Market)
January 13, 2011 7
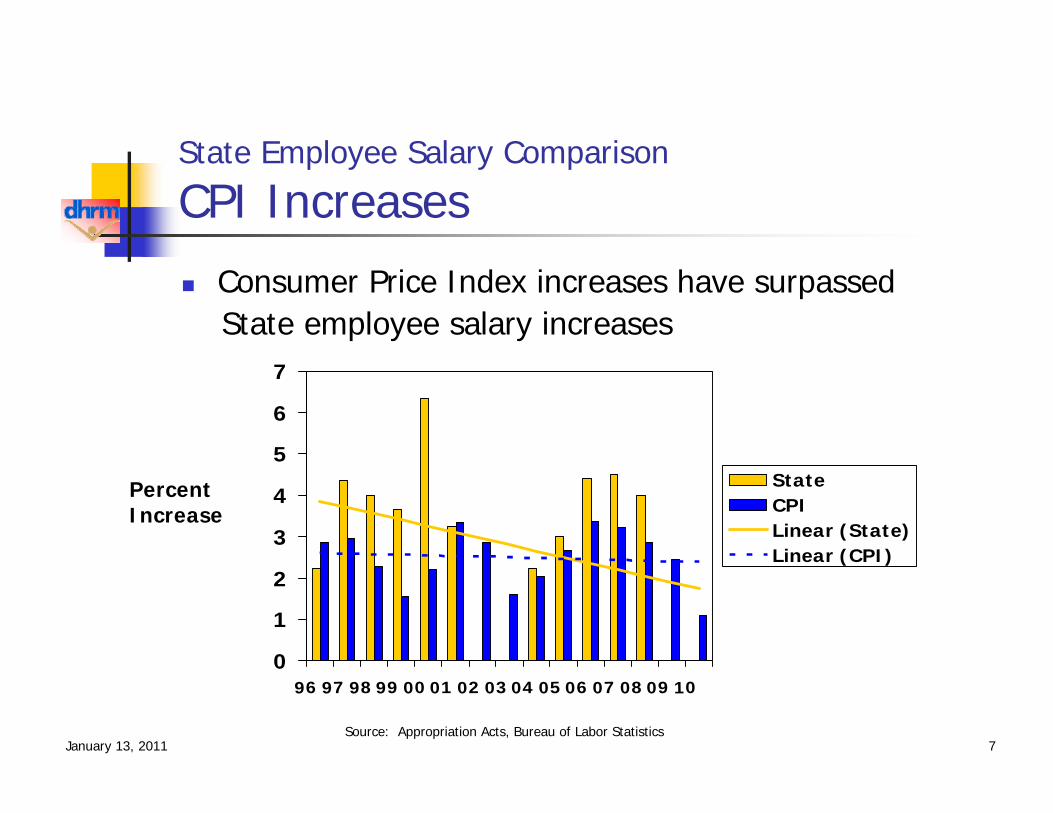
State Employee Salary Comparison
CPI Increases
Consumer Price Index increases have surpassedState employee salary increases
0
1
2
3
4
5
6
7
96 97 98 99 00 01 02 03 04 05 06 07 08 09 10
StateCPILinear (State)Linear (CPI)
Source: Appropriation Acts, Bureau of Labor Statistics
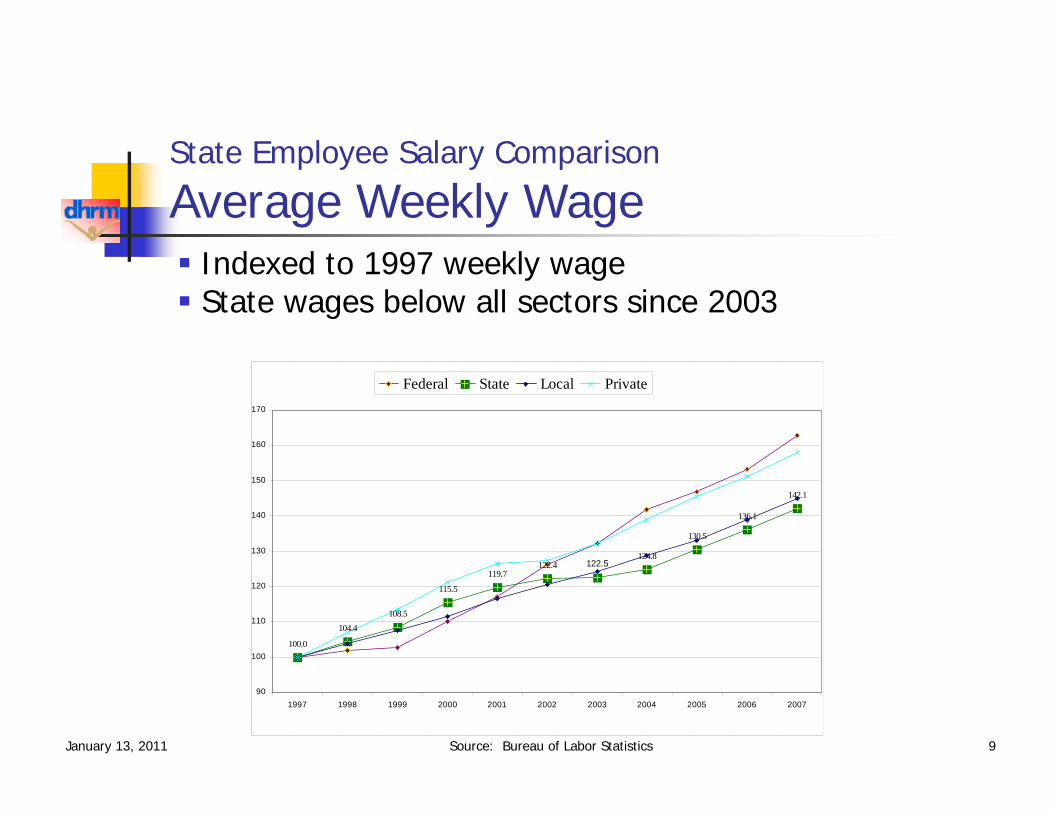
Average Weekly Wage Indexed to 1997 weekly wage State wages below all sectors since 2003
Source: Bureau of Labor Statistics
January 13, 2011 10
State Employee Salary Comparison
Selected Localities
State dropped below the locality average in FY 08
Source: DHRM survey
Locality FY-05 FY-06 FY-07 FY-08 FY-09
Richmond City 3.00% 3.00% 3.00% 3.00% 3.00%
Charlottesville 3.00% 4.00% 4.00% 4.00% 4.00%
Montgomery County 5.50% 4.80% 2.50% 6.77% 5.50%
Fairfax County 4.32% 4.37% 4.40% 4.98% 4.98%
Chesterfield County 4.00% 3.00% 4.00% 5.25% 5.25%
Norfolk 4.00% 4.00% 4.50% 4.50% 3.50%
Chesapeake 3.00% 4.00% 4.00% 4.50% 4.50%
Augusta County 4.00% 4.00% 3.83% 3.06% 3.06%
Locality Average 3.85% 3.90% 3.78% 4.51% 4.22%
State Employees 3.00% 4.40% 4.50% 4.00% 0.00%
BASE SALARY INCREASES
January 13, 2011 11
State Employee Salary Comparison
National Market
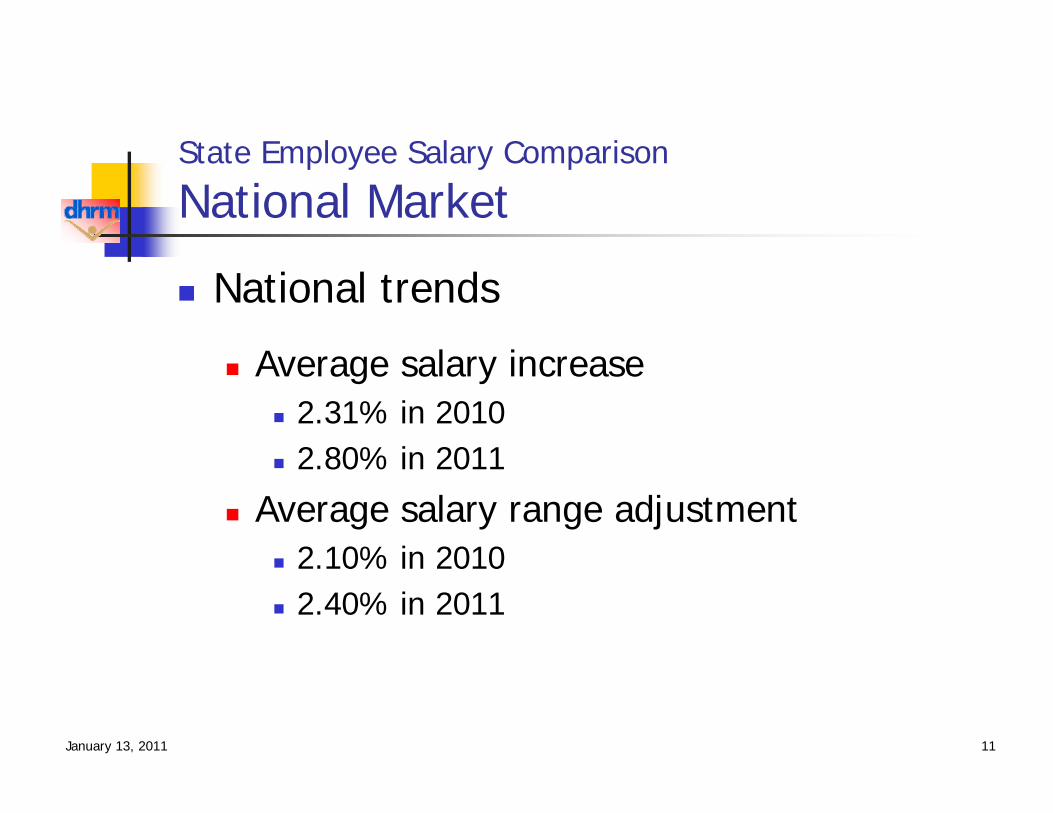
National trends
Average salary increase 2.31% in 2010 2.80% in 2011
Average salary range adjustment 2.10% in 2010 2.40% in 2011
January 13, 2011 12
State Employee Salary Comparison
Pay Compression
Salary compression New employees demand market rate State salaries on average are below market New hires potentially paid more than
experienced employees Lack of funding to address the issue
Salary inequities
Virginia State Employee Loan Program (VSELP)
January 13, 2011 14
VSELP
Program Design
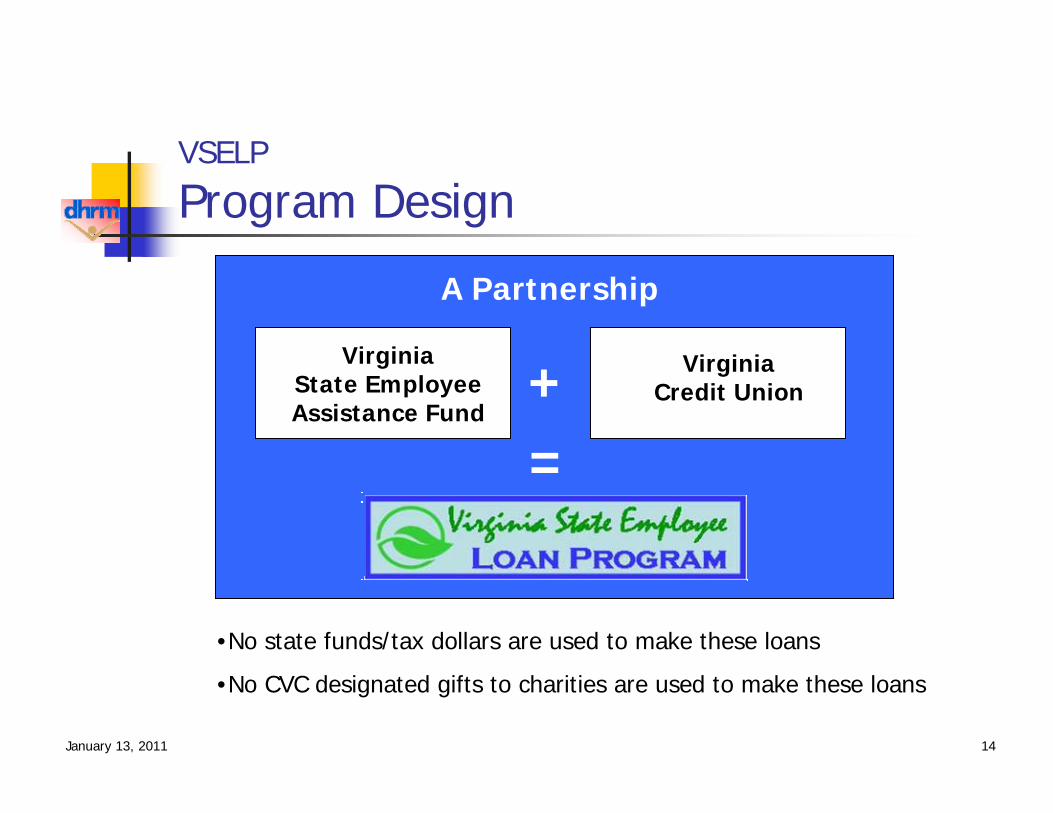
•No state funds/tax dollars are used to make these loans
•No CVC designated gifts to charities are used to make these loans
=+
A Partnership
VirginiaState EmployeeAssistance Fund
VirginiaCredit Union
January 13, 2011 15
VSELP
Program Design
Pilot program Loan
Borrow from $100 to $500 in $100 increments Up to 6 months to repay No more than 2 loans per calendar year APR of 24.99% with no fees
Eligibility Must be a non-probationary, salaried state employee Must be a VACU Member with no adverse VACU history Must successfully complete the online financial education module
Repayment Employee authorizes direct deposit from payroll into VACU account Employee sets up automatic debit from VACU account to repay loan
January 13, 2011 16
VSELP
Statistics for 18 months
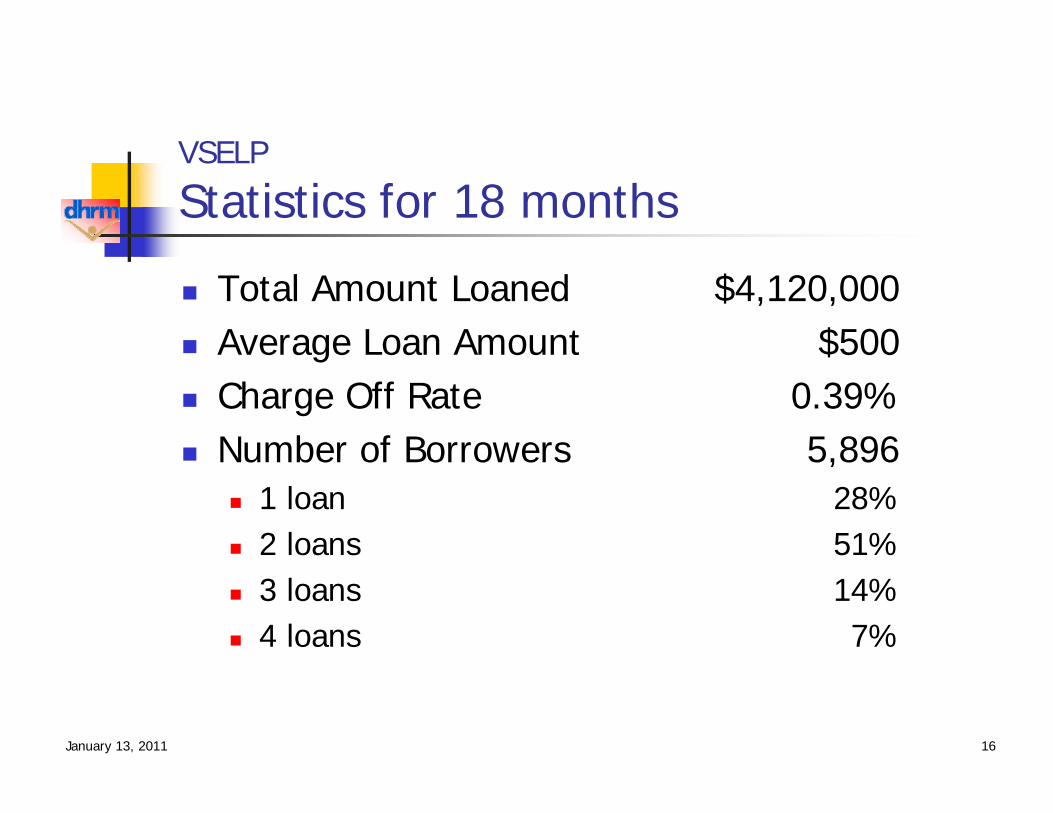
Total Amount Loaned $4,120,000 Average Loan Amount $500 Charge Off Rate 0.39% Number of Borrowers 5,896
1 loan 28% 2 loans 51% 3 loans 14% 4 loans 7%
January 13, 2011 17
VSELP
Customer Survey Results Most survey respondents said that easy
access to loan application and funds, confidentiality, and repayment plan were important or very important.
The educational component was helpful. Many respondents would have liked to
borrow a greater amount.
What is most important on this type loan?
12716317Easy repayment
1428211Confidentiality
12525112Ease of Application
12918214Provides Access to Loan Funds
Very ImportantImportant
Slightly ImportantN/ALoan Characteristic
12716317Easy repayment
1428211Confidentiality
12525112Ease of Application
12918214Provides Access to Loan Funds
Very ImportantImportant
Slightly ImportantN/ALoan Characteristic
$1000 - $1999 28
(22%)N/A6%
$500 was enough12 (9%)
$501-$75017 (13%)
$751 - $1000
65 (50%)
What should be the maximum loan value?
Great: Made me Rethink
my finances -95 (58%) I knew most
of this/review -
50 (31%)
N/A (4%) Somewhat Useful - 8
(5%)
Not Useful 4 (2%)
How useful was the financial education course?
Health Benefits
January 13, 2011 19
Recommend no premium change for FY 2012
PlanCurrent Monthly
Cost
Employee Employer
Employee Only $44 $393
Employee Plus One $105 $703
Family $154 $1,027
Health Benefits FY 12
Premiums
January 13, 2011 20
Health Benefits Plan Design
National Health Reform Impact
Effective January 1, 2011 Medical flexible reimbursement accounts no longer
reimburse OTC drug expense Retiree Medicare Part D premiums reduced due to 50%
discount on brand name drugs in “donut hole” Effective July 1, 2011
Children up to age 26 eligible for coverage Adds several covered preventive services
Abdominal aortic aneurysm screening Obesity screening and counseling
Minor changes in processes for claim reviews and appeals
January 13, 2011 21
Health Benefits
National Health Reform
Early Retiree Reinsurance Program (ERRP) HHS has approved state application Reimburse individual claims of $15,000 - $90,000
Use of ERRP funds Cannot be used for general fund expenses Will be used to reduce health cost trend rate for employees
and early retirees beginning in FY 2012
Filing for ERRP funds Health program will file for FY 10 claims in 1Q2011
Anticipate $2.5 million reimbursement
Quarterly filing thereafter until ERRP funds depleted
January 13, 2011 22
Health Benefits
Health Insurance Fund (HIF)
Since FY 2009, employee and employer premium increases offset by excess reserves in HIF
Projected “ HIF burn-down” has slowed Renegotiated contracts resulted in savings Improved medical trend both nationally and for state program Lower utilization of services by state employees
At current “burn-down,” non-Medicare HIF balance projected at $115 million in July 2012, down from $236 million in July 2009
January 13, 2011 23
Health Benefits
Actuarial Audit Budget language requires DHRM to conduct an actuarial
audit of the state employee health insurance program Procure actuarial services for peer review of benefits
liabilities and contribution strategies to include: Actuarial methodologies and accuracy of reports Funding strategies Rate setting methodologies IBNR (incurred but not reported) liability assumptions Actuarial models to determine impact of plan changes and
monitor claims experience Comparison of fully insured rates to those in marketplace Actuarial results of GASB 43 and 45
Estimate peer review cost of $350,000
January 13, 2011 24
Health Benefits
COVA Connect Pilot Public-private partnership launched in Hampton Roads
selected zip codes in FY10 10 percent of covered employees placed in pilot area Extras added to COVA Connect to engage employees,
drive better health outcomes and reduce costs Optima Health administers all except dental benefits
8,100 employees identified with chronic conditions 23.6% member engagement rate is 2% higher than
Optima book of business Financial incentive pilot program launch
January 13, 2011 25
Health Benefits
COVA Connect Satisfaction Survey Employee satisfaction survey conducted in summer 2010 Overall plan satisfaction rate at 51% compared to 95% for
COVA Care plan Change management issues
Compressed timeline for initial communication Lack of choice Provider network Perceived difference in pharmacy cost
Working with Optima Health to resolve network and pharmacy issues
Communications increased on coverage and benefits
January 13, 2011 26
Health Benefits
TRICARE Supplemental Health Insurance Provide option for TRICARE supplemental health insurance plan for
non-Medicare eligible military retirees
Recent federal legislation permits employers to offer voluntary TRICARE supplemental coverage on a pre-tax basis
Employer contribution not permitted Legislation required to permit TRICARE supplemental
coverage under the state’s IRC Section 125 cafeteria plan HB 1761(Cox)
RFP for procurement of TRICARE supplemental coverage vendor anticipated in 1Q 2011
Special enrollment in 2011 for eligible state employees
January 13, 2011 27
Resources
Department of Human Resource Managementhttp://www.dhrm.virginia.gov