21
| Date post: | 12-Feb-2017 |
| Category: |
Technology |
| Upload: | decisive |
| View: | 238 times |
| Download: | 1 times |
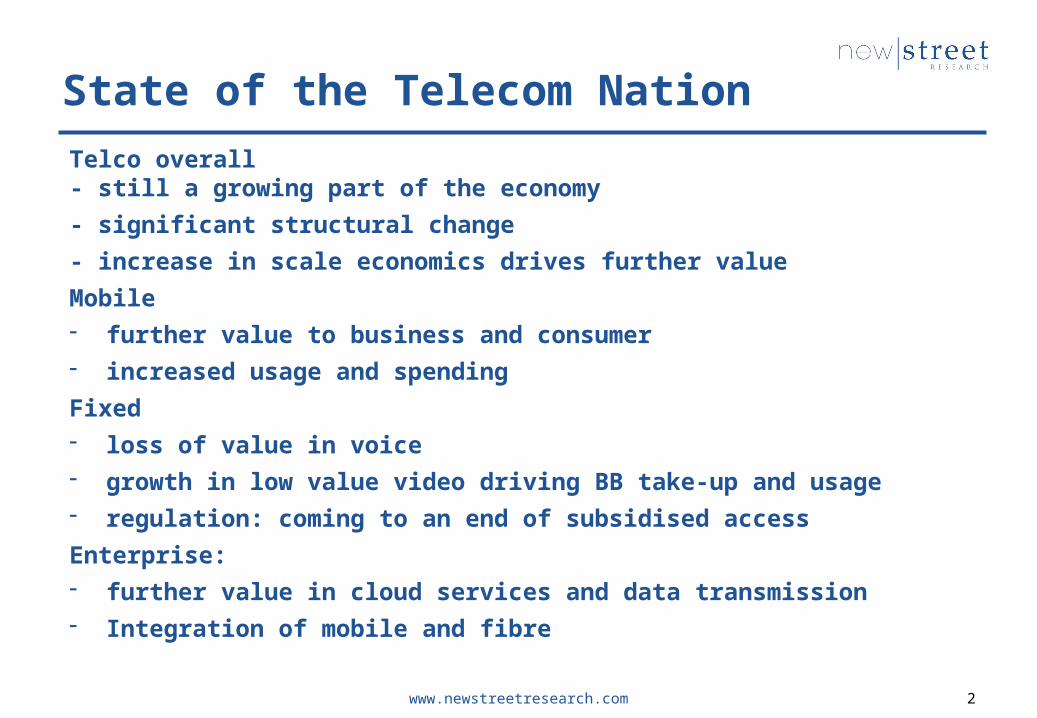
State of the Telecom NationTelco overall- still a growing part of the economy- significant structural change- increase in scale economics drives further valueMobile- further value to business and consumer- increased usage and spendingFixed- loss of value in voice- growth in low value video driving BB take-up and usage- regulation: coming to an end of subsidised accessEnterprise:- further value in cloud services and data transmission- Integration of mobile and fibre
www.newstreetresearch.com 2

State of the Telecom Nation
www.newstreetresearch.com 3
-
5,000
10,000
15,000
20,000
25,000
30,000
Telstra Optus TPG VOC NBN
Est Revenue FY16F
-4,000
-2,000
0
2,000
4,000
6,000
8,000
10,000
12,000
Telstra Optus TPG VOC NBN
Est EBITDA FY16F
-
1,000
2,000
3,000
4,000
5,000
6,000
Telstra Optus TPG VOC NBN
Est Capex FY16F
-25.0%-20.0%-15.0%-10.0%-5.0%0.0%5.0%
10.0%15.0%20.0%25.0%
Telstra Optus TPG VOC NBN
ROIC FY15
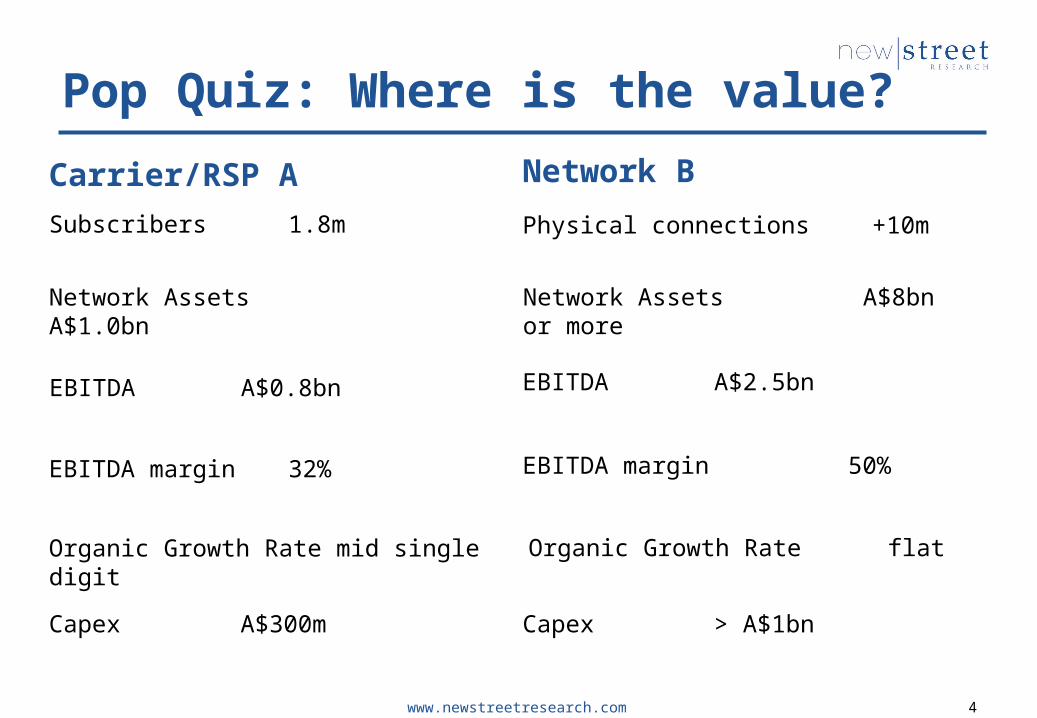
Pop Quiz: Where is the value?Carrier/RSP A
www.newstreetresearch.com 4
Network BSubscribers 1.8m Physical connections +10m
Network Assets A$1.0bn Network Assets A$8bn or more
EBITDA A$0.8bn EBITDA A$2.5bn
EBITDA margin 32% EBITDA margin 50%
Organic Growth Rate mid single digit Organic Growth Rate flat
Capex A$300m Capex > A$1bn

Mobile – Does 5G imply a two carrier mobile market?
www.newstreetresearch.com 5Source: NSR estimates, Company report
1H14 2H14 1H15 2H15 1H16 2H16FTelstra 51.6% 52.9% 53.8% 53.8% 53.3% 53.4%Optus 29.6% 29.5% 29.5% 29.7% 29.7% 29.6%Vodafone 18.8% 17.6% 16.7% 16.6% 16.9% 17.0%
0%
10%
20%
30%
40%
50%
60%Mobile service revenue market share
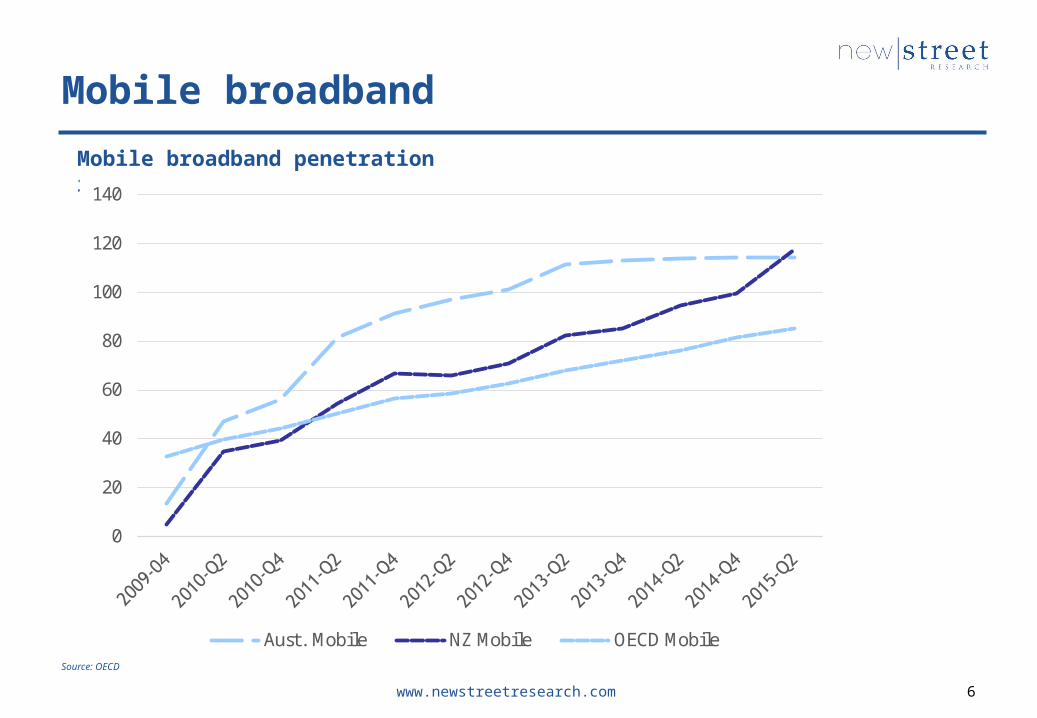
Mobile broadband
www.newstreetresearch.com 6
Mobile broadband penetration rates
Source: NSR, OECD Broadband Portal Feb 2016
0
20
40
60
80
100
120
140
Aust. Mobile NZ Mobile OECD MobileSource: OECD

Fixed broadband
www.newstreetresearch.com 7
Fixed broadband penetration rates
Source: NSR, OECD Broadband Portal Feb 20160
5
10
15
20
25
30
35
Aust. Fixed NZ Fixed OECD FixedSource: OECD
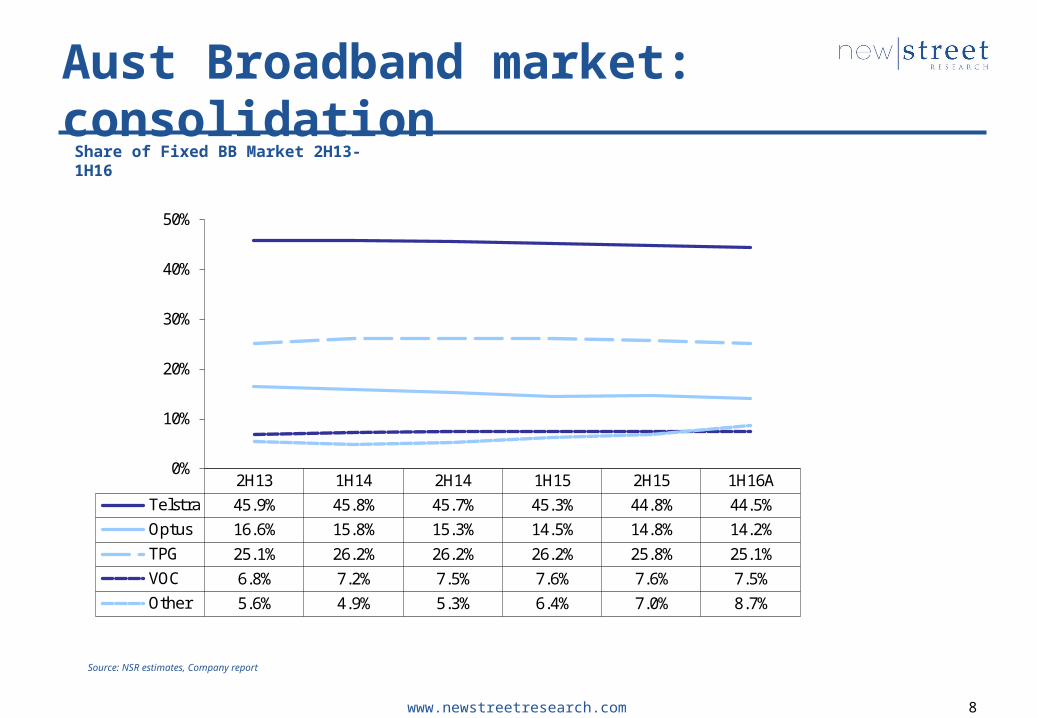
Aust Broadband market: consolidation
www.newstreetresearch.com 8
Share of Fixed BB Market 2H13-1H16
Source: NSR estimates, Company report
2H13 1H14 2H14 1H15 2H15 1H16ATelstra 45.9% 45.8% 45.7% 45.3% 44.8% 44.5%Optus 16.6% 15.8% 15.3% 14.5% 14.8% 14.2%TPG 25.1% 26.2% 26.2% 26.2% 25.8% 25.1%VOC 6.8% 7.2% 7.5% 7.6% 7.6% 7.5%Other 5.6% 4.9% 5.3% 6.4% 7.0% 8.7%
0%
10%
20%
30%
40%
50%
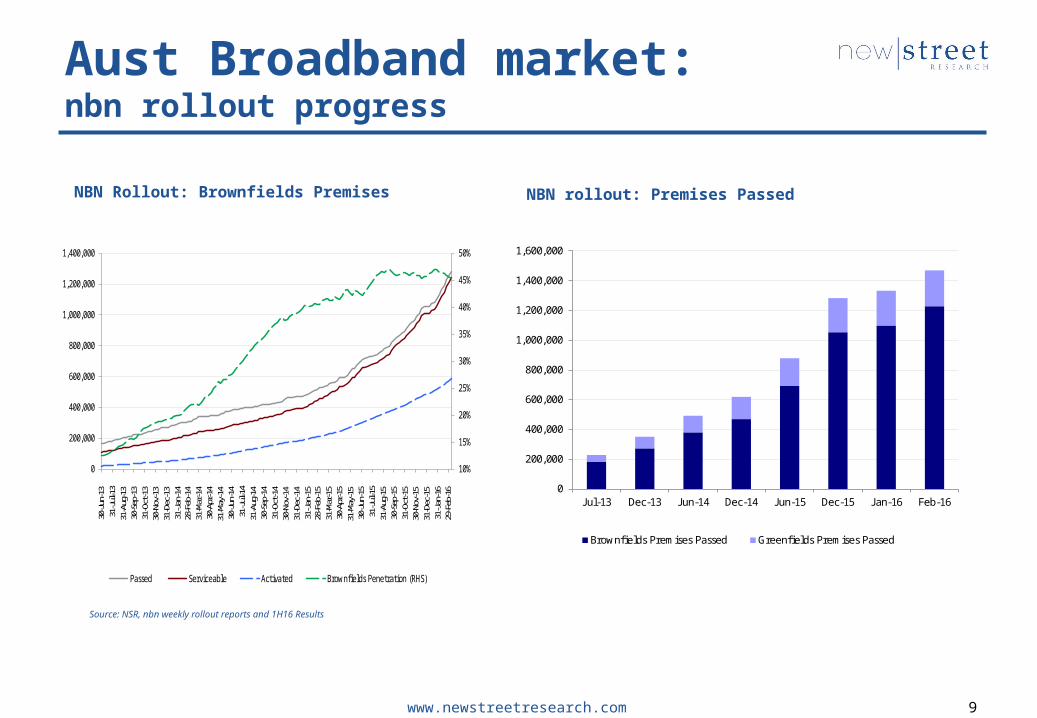
Aust Broadband market: nbn rollout progress
www.newstreetresearch.com 9
NBN Rollout: Brownfields Premises NBN rollout: Premises Passed
Source: NSR, nbn weekly rollout reports and 1H16 Results
10%
15%
20%
25%
30%
35%
40%
45%
50%
0
200,000
400,000
600,000
800,000
1,000,000
1,200,000
1,400,000
30-Jun
-13
31-Jul-1
331
-Aug
-13
30-Sep
-13
31-O
ct-1
330
-Nov
-13
31-D
ec-1
331
-Jan
-14
28-F
eb-1
431
-Mar
-14
30-A
pr-1
431
-May
-14
30-Jun
-14
31-Jul-1
431
-Aug
-14
30-Sep
-14
31-O
ct-1
430
-Nov
-14
31-D
ec-1
431
-Jan
-15
28-F
eb-1
531
-Mar
-15
30-A
pr-1
531
-May
-15
30-Jun
-15
31-Jul-
1531
-Aug
-15
30-Sep
-15
31-O
ct-1
530
-Nov
-15
31-D
ec-1
531
-Jan
-16
29-F
eb-1
6
Passed Serviceable Activated Brownfields Penetration (RHS)
0
200,000
400,000
600,000
800,000
1,000,000
1,200,000
1,400,000
1,600,000
J ul-13 Dec-13 J un-14 Dec-14 J un-15 Dec-15 J an-16 Feb-16
Brownfields Premises Passed Greenfields Premises Passed

Australian Broadband market: Impact of NBN now begins to take shape
www.newstreetresearch.com 10
Indicative NBN RSP Market Share: FY15A, 1H16A
Source: NSR estimates, Company Reports.
* TPG subscribers adjusted pro-rat to net adds to 30 June and 31 Dec. TPG nbn subs as at 31 Jan is 194k, indicative nbn share of 24.7% at 31 Jan
** M2 now included with Vocus, prior to 1H16 included in “Other RSP”
NBN Share FY15 1H16 FY15 1H16TLS 211 329 118 43.5% 44.7% 47.1%TPG* 122 183 61 25.1% 24.8% 24.3%Optus 54 88 34 11.1% 12.0% 13.6%VOC** n.a. 40 40 n.a. 5.5% n.a.Other RSP 99 96 n.a. 20.3% 13.0% n.a.NBN Premises Activated 486 736 250 100.0% 100.0% n.a.
Subscribers (k) Net Adds (k)
Indicative NBN Share Indicative Share Net Adds
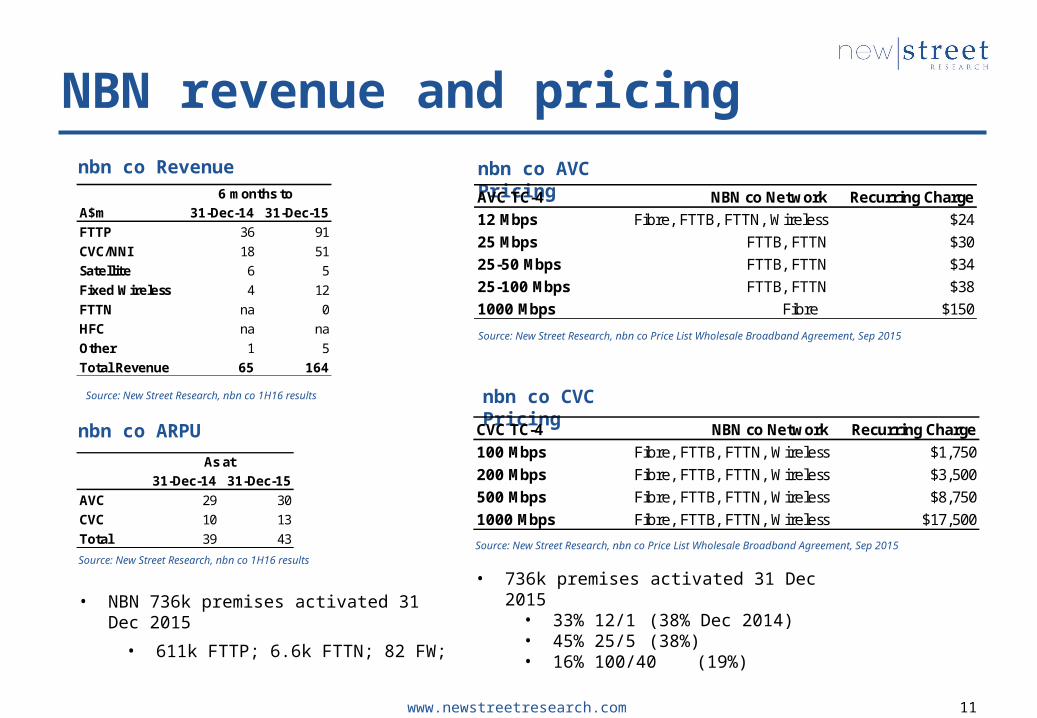
NBN revenue and pricing
www.newstreetresearch.com 11
Source: New Street Research, nbn co 1H16 results
nbn co Revenue
nbn co ARPU
Source: New Street Research, nbn co 1H16 results
nbn co AVC Pricing
Source: New Street Research, nbn co Price List Wholesale Broadband Agreement, Sep 2015
nbn co CVC Pricing
Source: New Street Research, nbn co Price List Wholesale Broadband Agreement, Sep 2015
A$m 31-Dec-14 31-Dec-15FTTP 36 91CVC/NNI 18 51Satellite 6 5Fixed Wireless 4 12FTTN na 0HFC na naOther 1 5Total Revenue 65 164
6 months to
31-Dec-14 31-Dec-15AVC 29 30CVC 10 13Total 39 43
As at
AVC TC-4 NBN co Network Recurring Charge12 Mbps Fibre, FTTB, FTTN, Wireless $2425 Mbps FTTB, FTTN $3025-50 Mbps FTTB, FTTN $3425-100 Mbps FTTB, FTTN $381000 Mbps Fibre $150
CVC TC-4 NBN co Network Recurring Charge100 Mbps Fibre, FTTB, FTTN, Wireless $1,750200 Mbps Fibre, FTTB, FTTN, Wireless $3,500500 Mbps Fibre, FTTB, FTTN, Wireless $8,7501000 Mbps Fibre, FTTB, FTTN, Wireless $17,500
• NBN 736k premises activated 31 Dec 2015
• 611k FTTP; 6.6k FTTN; 82 FW;
• 736k premises activated 31 Dec 2015• 33% 12/1 (38% Dec 2014)• 45% 25/5 (38%)• 16% 100/40 (19%)

NBN ICRA already at over A$6.0bn
www.newstreetresearch.com 12
2009 2010 2011 2012 2013 2014 20150
1,000
2,000
3,000
4,000
5,000
6,000
7,000
Revenue ABBRR ICRA

Fixed Line: post Vertigan game changeTraditional network diseconomies of distance and population density
www.newstreetresearch.com 13
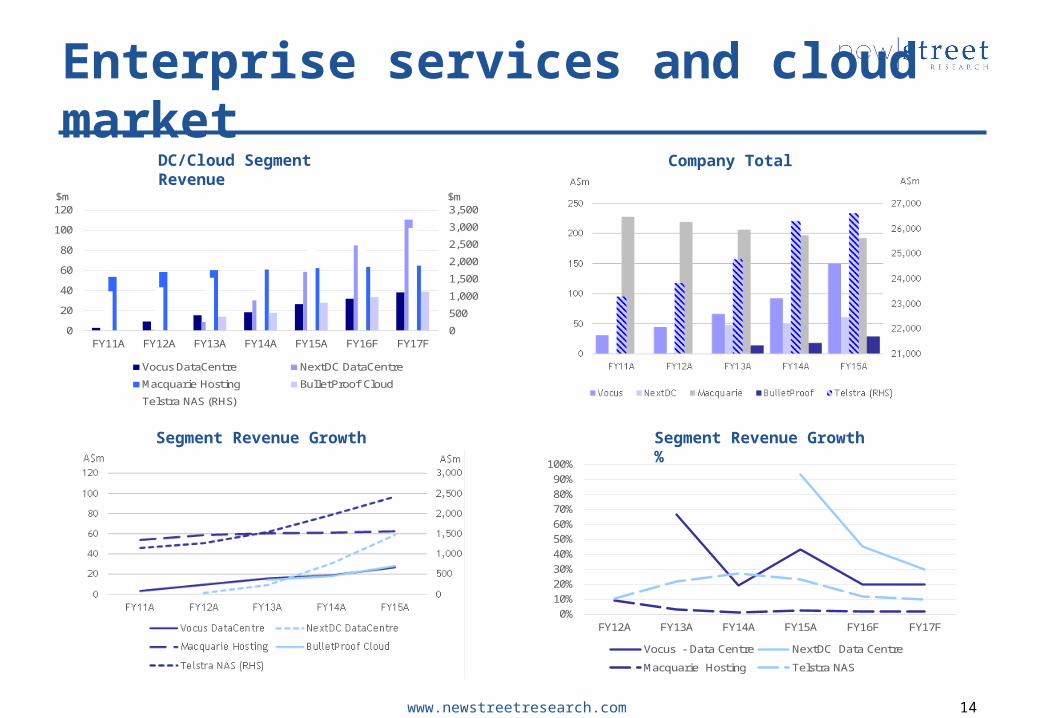
Enterprise services and cloud market
www.newstreetresearch.com 14
05001,0001,5002,0002,5003,0003,500
020406080
100120
FY11A FY12A FY13A FY14A FY15A FY16F FY17F
$m $m
Vocus DataCentre NextDC DataCentreMacquarie Hosting BulletProof CloudTelstra NAS (RHS)
DC/Cloud Segment Revenue
Company Total Revenue
0%10%20%30%40%50%60%70%80%90%
100%
FY12A FY13A FY14A FY15A FY16F FY17FVocus - Data Centre NextDC Data CentreMacquarie Hosting Telstra NAS
Segment Revenue Growth $
Segment Revenue Growth %

State of the Telecom NationTrend towards 2 or 3 full service playersand specialist (niche) RSPs
• Telstra: Ongoing leader in mobile, fixed and cloud/data• NBN: Value likely to be c50% of A$49bn-56bn spending • Optus: Maintaining position in mobile, losing ground in
fixed• Vodafone: Stopped the decline but lacks a case for next
stage• TPG: iiNet last big fixed line acquisition. Integration w VHA?
End of regulated subsidised access prices• Vocus: What role for a fourth player? Without mobile• Nextgen: What role for a fourth player? Without mobile• SpeedCast: Attractive satellite economics: growth by
acquisition• Small RSPs: Niche opportunities in mobile services and data
centrewww.newstreetresearch.com 15
Submarine Cable west coast routeDemand for new Australia-Asia subsea cable• Existing west coast cable is reaching end of design life: Sea-Me-We3 • Repairs, data transmission, latency, redundancy• Other Australian international cables all East Coast• Growth in data traffic and expected developments in demand for video
content
Three proposed west coast for the second west coast cable – Perth-Singapore…• APX West Cable System (APX), supported by SubPartners• Australia-Singapore Cable (ASC) NextGen and non-binding deal with
Vocus• Trident Sub-Sea Cable (TSC), private equity so far, has Indonesian
landing rights, looking for funding
…and one more proposal bypasses Asia to go straight to Middle East• Australia West Express (AWE) sponsored by GoTo Networkswww.newstreetresearch.com 16

Pop Quiz: Where is the value?Services or infrastructure?
Carrier/RSP A TPG
www.newstreetresearch.com 17
Network B TLS CANSubscribers 1.8m Physical connections +10m
Network Assets A$1.0bn Network Assets A$12bn
EBITDA A$775m EBITDA A$3.4bn
EBITDA margin 32% EBITDA margin 50%
Organic Growth Rate mid single digitOrganic Growth Rate mature
Capex A$300m Capex > A$1bn
Value A$9.4bn Value A$8.0bn
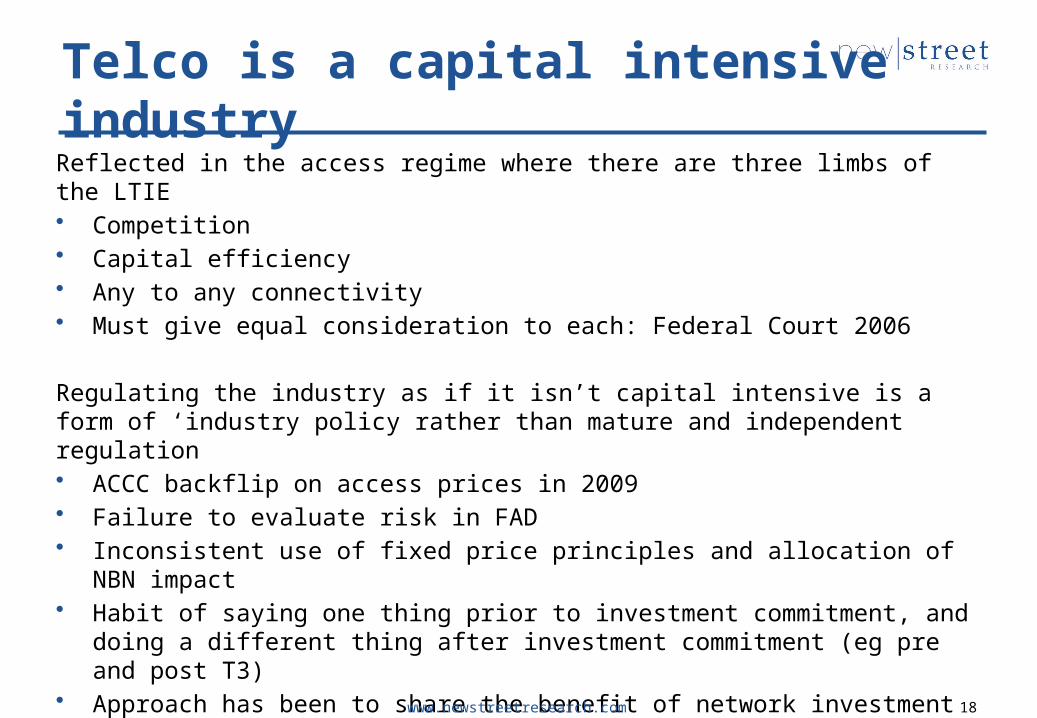
Telco is a capital intensive industryReflected in the access regime where there are three limbs of the LTIE• Competition• Capital efficiency• Any to any connectivity• Must give equal consideration to each: Federal Court 2006
Regulating the industry as if it isn’t capital intensive is a form of ‘industry policy rather than mature and independent regulation• ACCC backflip on access prices in 2009• Failure to evaluate risk in FAD• Inconsistent use of fixed price principles and allocation of NBN impact• Habit of saying one thing prior to investment commitment, and doing a
different thing after investment commitment (eg pre and post T3) • Approach has been to share the benefit of network investment but not
the riskACCC approach to access regulation has more in common with the automobile industry of the 1960s and 1970s than independent regulation
www.newstreetresearch.com 18
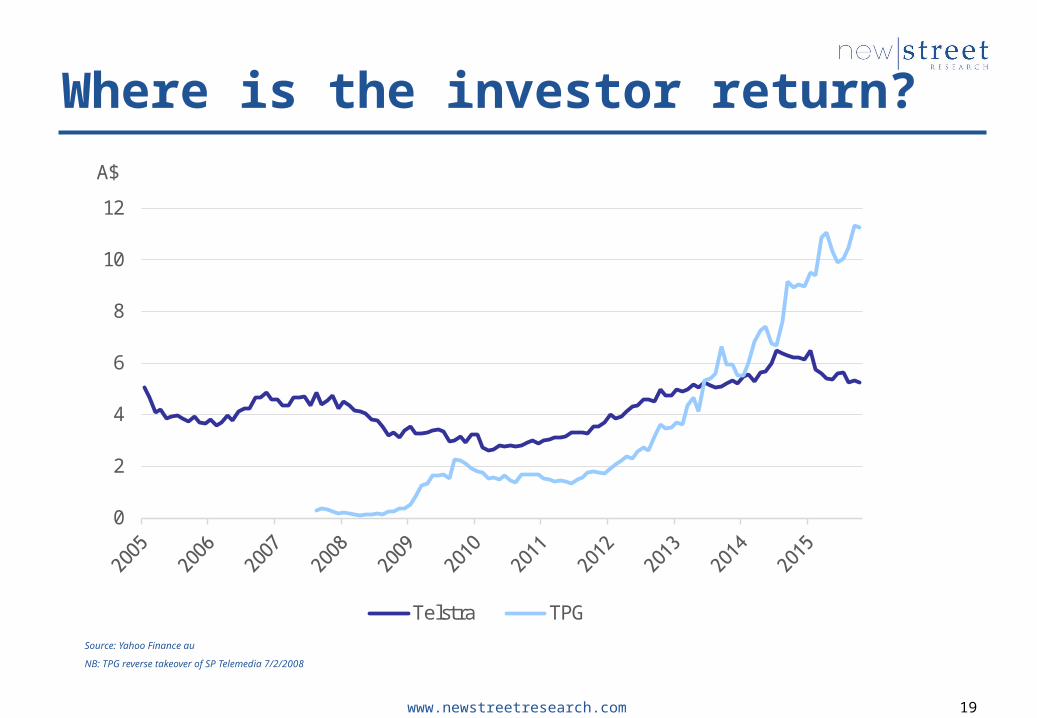
Where is the investor return?
www.newstreetresearch.com 19
Source: Yahoo Finance au
NB: TPG reverse takeover of SP Telemedia 7/2/2008
0
2
4
6
8
10
12A$
Telstra TPG
20
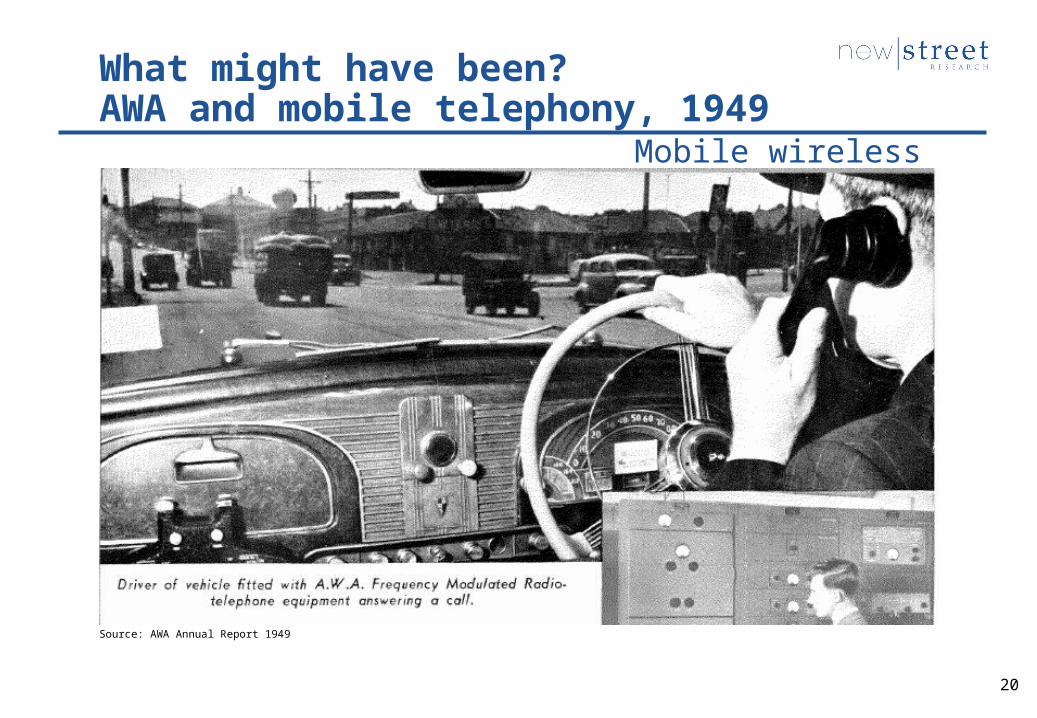
What might have been? AWA and mobile telephony, 1949
Source: AWA Annual Report 1949
Mobile wireless

www.newstreetresearch.com 21
This report was produced by New Street Research LLP. 11 Austin Friars, London EC2N 2HG
This document has been communicated to its clients by New Street Research LLP in accordance with its terms and conditions. This document is confidential and should not be communicated to persons other than the clients of New Street Research LLP.
The document is directed only to investment professionals, as defined in section 19 of the Financial Services and Markets Act 2000 (Financial Promotion) Order 2001, and other persons to whom financial promotions may be lawfully communicated. The services provided by New Street Research LLP will only be provided to such persons. Persons who do not have professional experience in matters relating to investments should not rely on the contents of this document. New Street Research LLP is authorised and regulated in the conduct of its designated investment business in the United Kingdom by the Financial Services Authority. The contents of this document are subject to updating, completion, revision, further verification and amendment. The value of shares and other investments and the income derived from them may go down as well as up, and you may not get back the full amount you originally invested.
© 2016. New Street Research LLP.