Linköping Studies in Science and Technology Dissertation No. 1018 Communication and Networking Techniques for Traffic Safety Systems by Ioan Chisalita Department of Computer and Information Science Linköpings universitet SE-581 83 Linköping, Sweden Linköping 2006
Transcript
Linköping Studies in Science and Technology
Dissertation No. 1018
Communication and Networking Techniques for
Traffic Safety Systems
by
Ioan Chisalita
Department of Computer and Information Science
Linköpings universitet
SE-581 83 Linköping, Sweden
Linköping 2006
Abstract
Accident statistics indicate that every year a significant number of casualties and extensive
property losses are recorded due to traffic accidents. Consequently, efforts are directed towards
developing passive and active safety systems that help reduce the severity of crashes, or prevent
vehicles from colliding with one another. To develop these systems, technologies such as sensor
systems, computer vision and vehicular communication have been proposed. Safety vehicular
communication is defined as the exchange of data between vehicles with the goal of providing
in-vehicle safety systems with enough information to permit detection of traffic dangers. Inter-
vehicle communication is a key safety technology, especially as a complement to other
technologies such as radar, as the information it provides cannot be gathered in any other way.
However, due to the specifics of the traffic environment, the design of efficient safety
communication systems poses a series of major technical challenges.
In this thesis we focus on the design and development of a safety communication system that
provides support for active safety systems such as collision warning and collision avoidance.
We begin by providing a method for designing the support system for active safety systems.
Within our study, we investigate different safety aspects of traffic situations. For performing
traffic investigations, we have developed ECAM, a temporal reasoning system for modeling and
analyzing accident scenarios.
Next, we focus on the communication system design. We investigate approaches that can be
applied to implement safety vehicular communication, as well as design aspects of such systems,
including networking techniques and transmission procedures. We then propose a new solution
for vehicular communication in the form of a distributed communication protocol that allows the
vehicles to organize themselves in virtual clusters according to their common interest in traffic
safety. To disseminate the information used for organizing the network and for assessing
dangers in traffic, we develop an anonymous context-based broadcast protocol that requires the
receivers to determine whether they are the intended destination for sent messages based on
knowledge about their current situation in traffic. This communication system is then augmented
with a reactive operation mode, where warnings can be issued and forwarded by vehicles. A
vehicular communication platform that provides an implementation framework for the
communication system, and integrates it within a vehicle, is also proposed. Experiments have
been conducted, under various conditions, to test communication performance and the system’s
ability to reduce accidents. The results indicate that that the proposed communication system is
able to provide a reliable and timely exchange of safety information between vehicles.
i
Acknowledgments
My primary thanks are directed to my supervisor, Professor Nahid Shahmehri, for introducing
me to research work in the area of vehicular communication and giving me the opportunity of
performing the work presented in this thesis. Her support and guidance were always available
and were crucial for the outcome of the work.
Several other persons have contributed to the thesis. I would especially like to thank: Associate
Professor Patrick Lambrix for his valuable comments on the work and discussions on formal
modeling; Dr. Johan Åberg for providing in many occasions comments on the work; Associate
Professor Wlodek Drabent for comments on formal modeling; Brittany Shahmehri, for proof-
reading the thesis. Also, I would like to thank everybody else that helped me during this work.
I would like to thank all my colleagues at IISLAB (Laboratory for Intelligent Information
Systems) not only for their professional help, but also for their support and friendship. In this
respect, I want to mention the other Ph.D. students at IISLAB (during 2000-2006), with whom I
shared the every-day problems of the graduate student life.
Both on professional and non-professional level I would like to thank my family for helping me
get a solid education and for supporting me in many ways and in many occasions. A special
thanks to my wife, Simona, for always being there for me and for her understanding and
support. I would also like to mention my daughter Alexandra, who brightens up my life.
Thanks also to my friends for making life more enjoyable.
The work presented in this thesis has been carried out at IISLAB, Department of Information
and Computer Science (IDA), Linköpings universitet, and was partially financed by ECSEL
(Excellence Center in Computer Science and Systems Engineering in Linköping).
2. Designing the support system for active safety systems.................................................7
2.1 Active safety systems............................................................................................................................. 7 2.1.1 Background.................................................................................................................................. 7 2.1.2 Technologies for developing active safety systems................................................................ 7 2.1.3 Collaborative active safety systems........................................................................................ 10
2.2 Design method for realizing the support system ............................................................................ 11 2.3 Accident modeling and vehicular communication ......................................................................... 12
2.3.1 ECAM - Event Calculus for Accident Modeling................................................................... 13 2.3.2 ECAM – case study ................................................................................................................... 19 2.3.3 Vehicular communication and ECAM ................................................................................... 28
3. Safety communication system analysis ............................................................................35
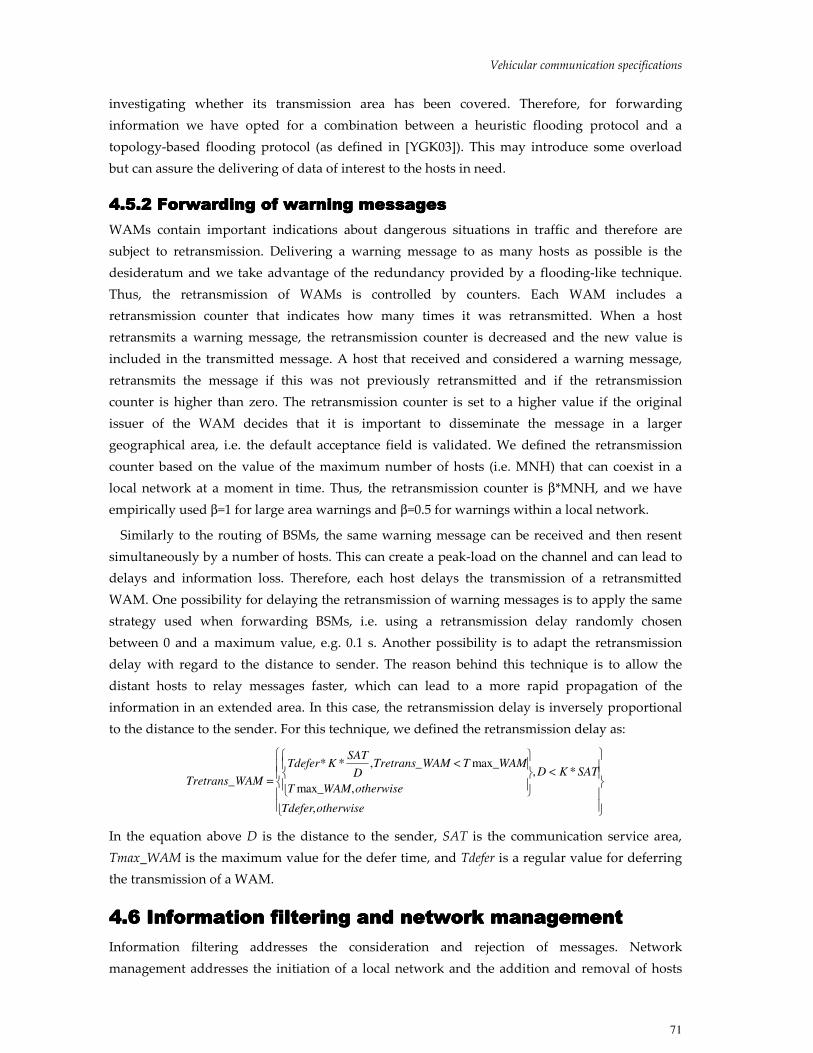
4.5 Information forwarding ...................................................................................................................... 67 4.5.1 Forwarding of basic safety messages ..................................................................................... 68 4.5.2 Forwarding of warning messages........................................................................................... 71
4.6 Information filtering and network management............................................................................. 71 4.6.1 Parameters.................................................................................................................................. 72 4.6.2 Decision techniques .................................................................................................................. 74
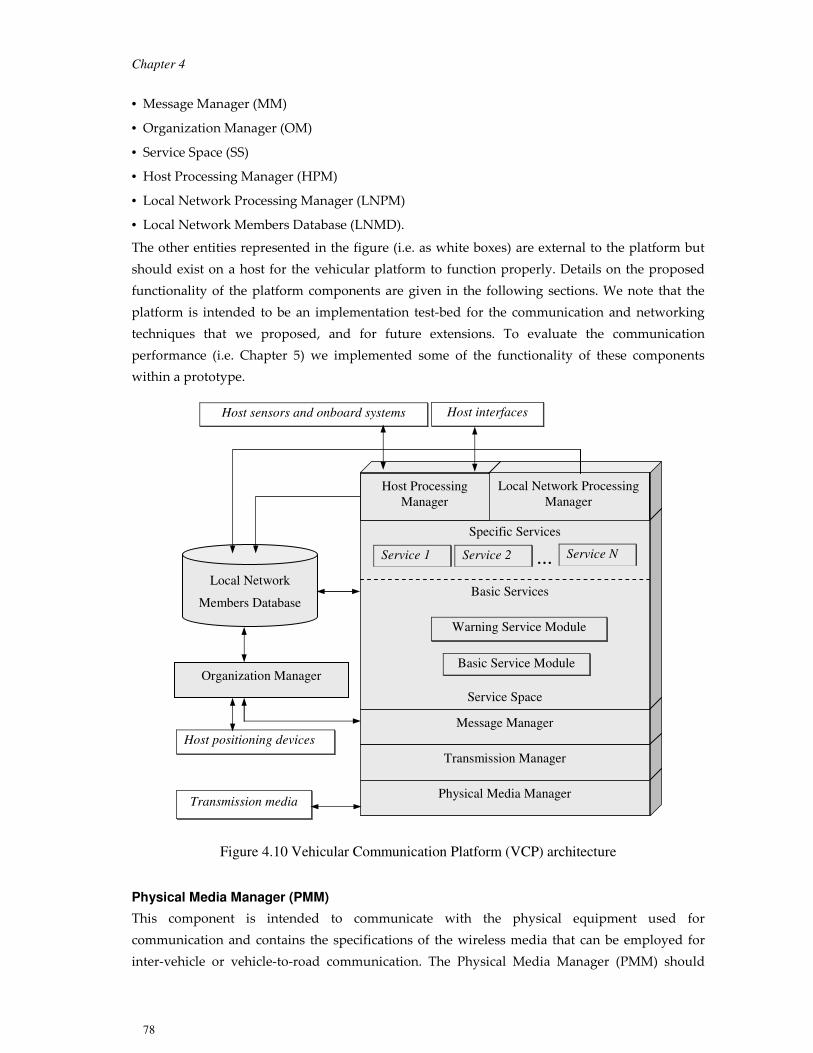
4.7 An integrated vehicular communication platform.......................................................................... 77 4.7.1 Design principles....................................................................................................................... 77 4.7.2 Vehicular communication platform (VCP)............................................................................ 77
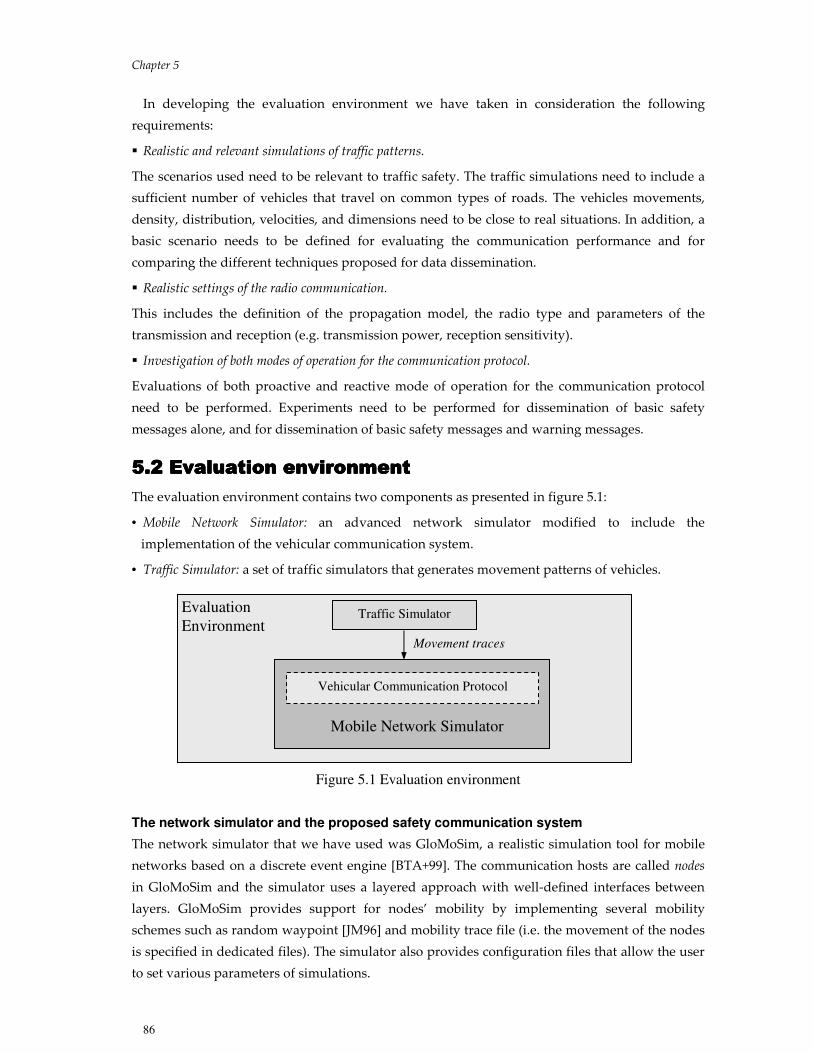
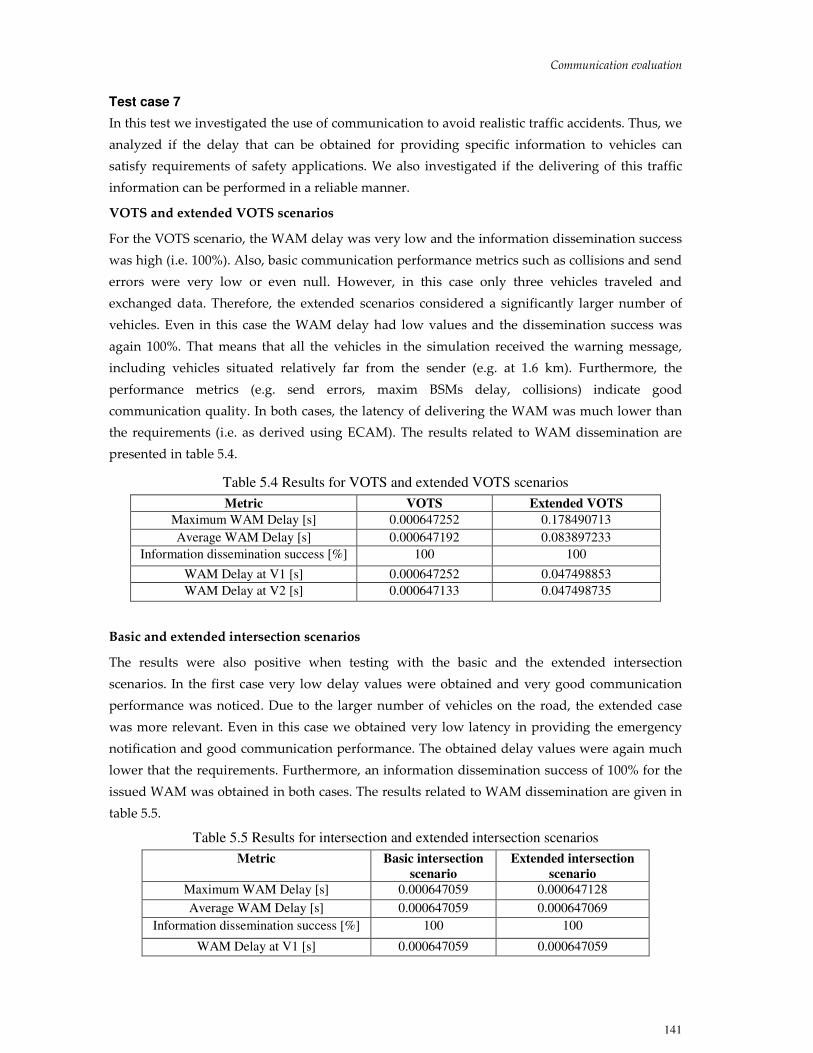
5. Communication evaluation................................................................................................. 85
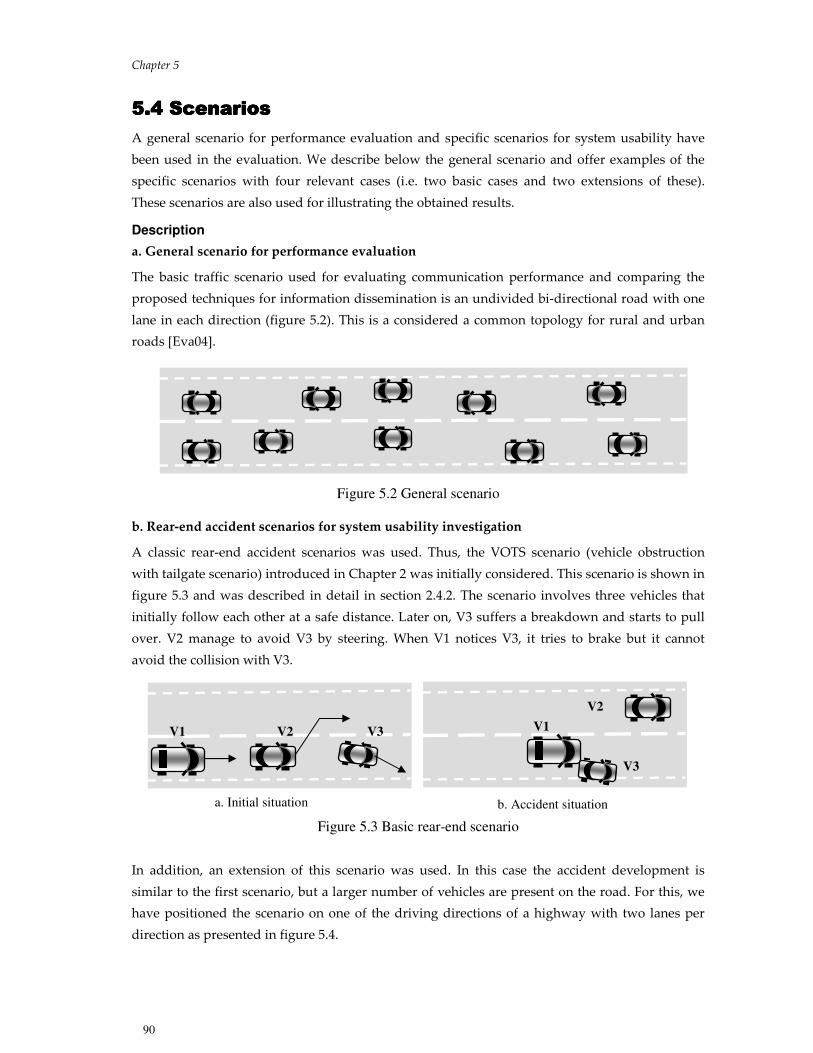
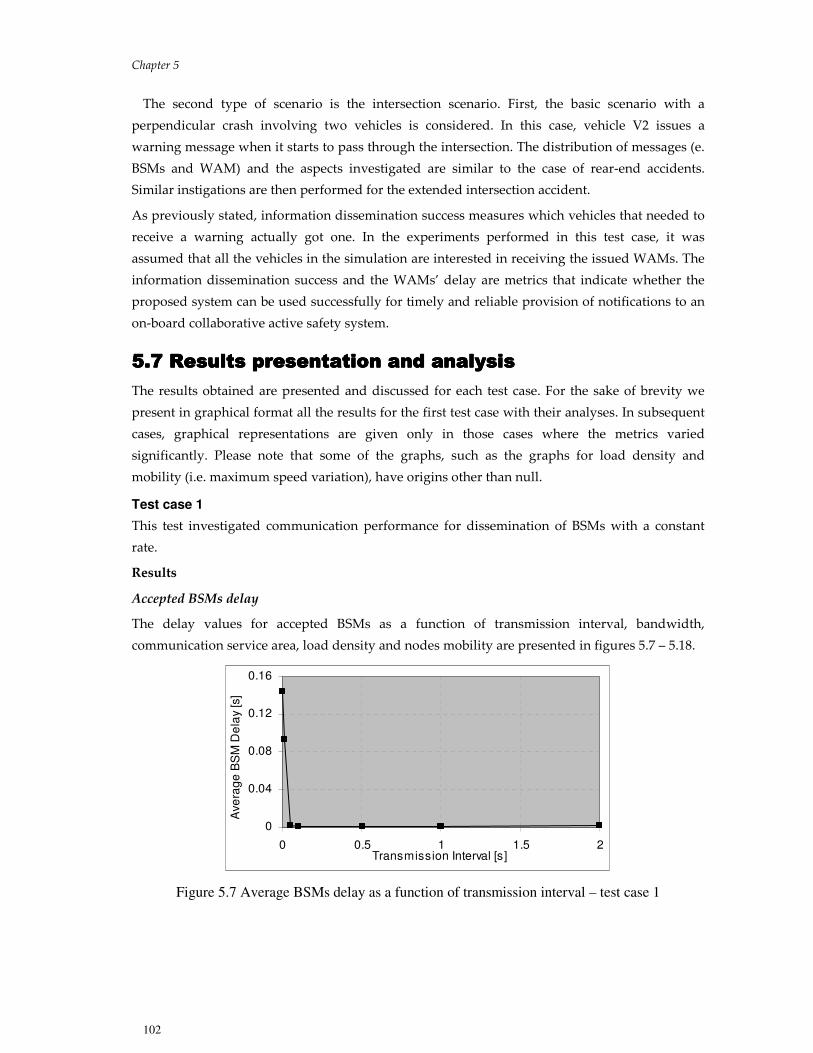
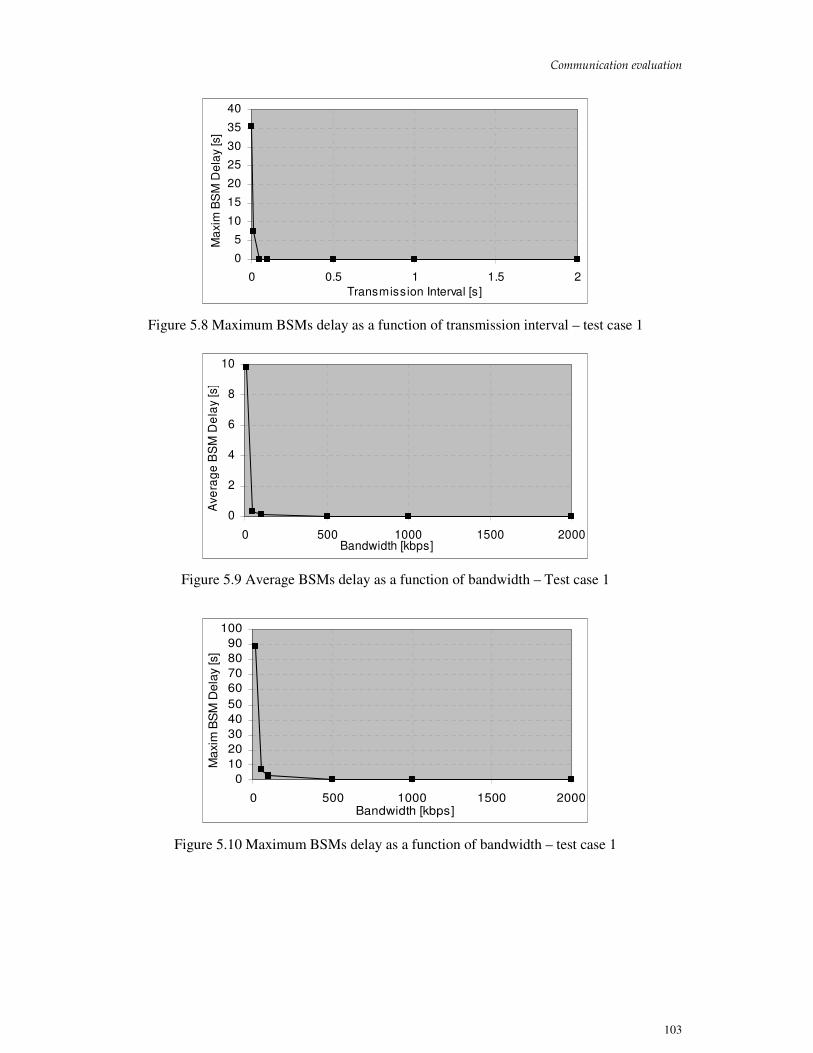
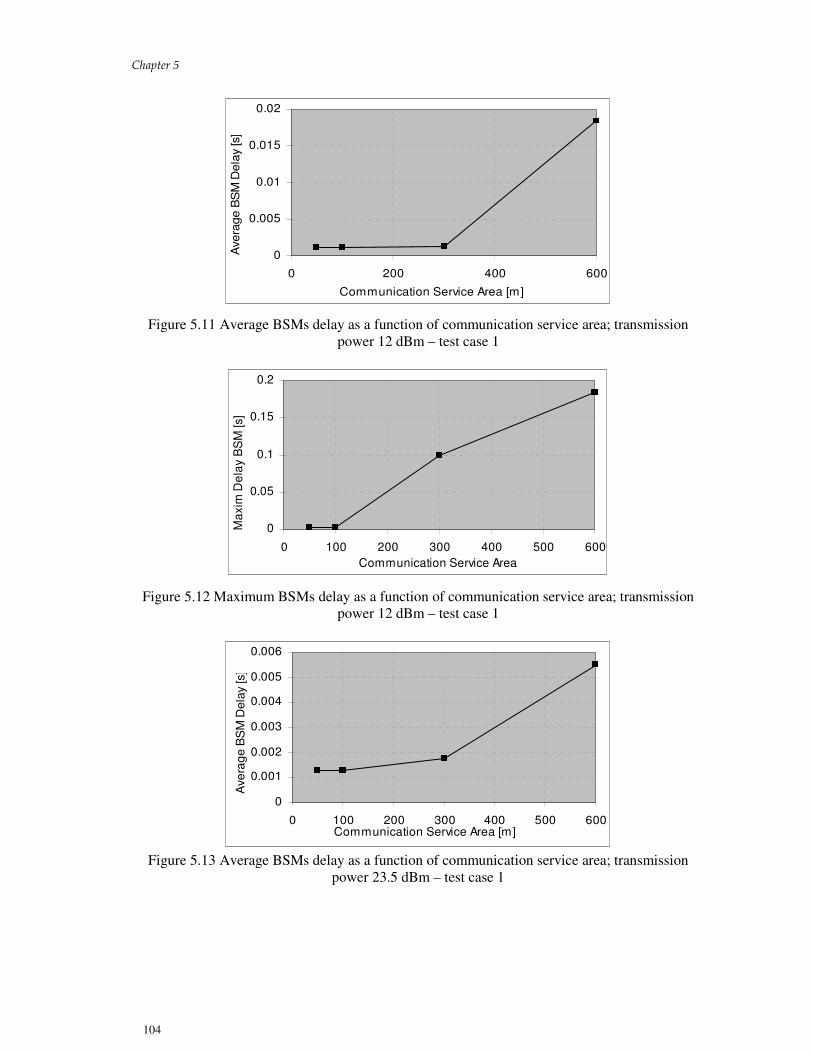
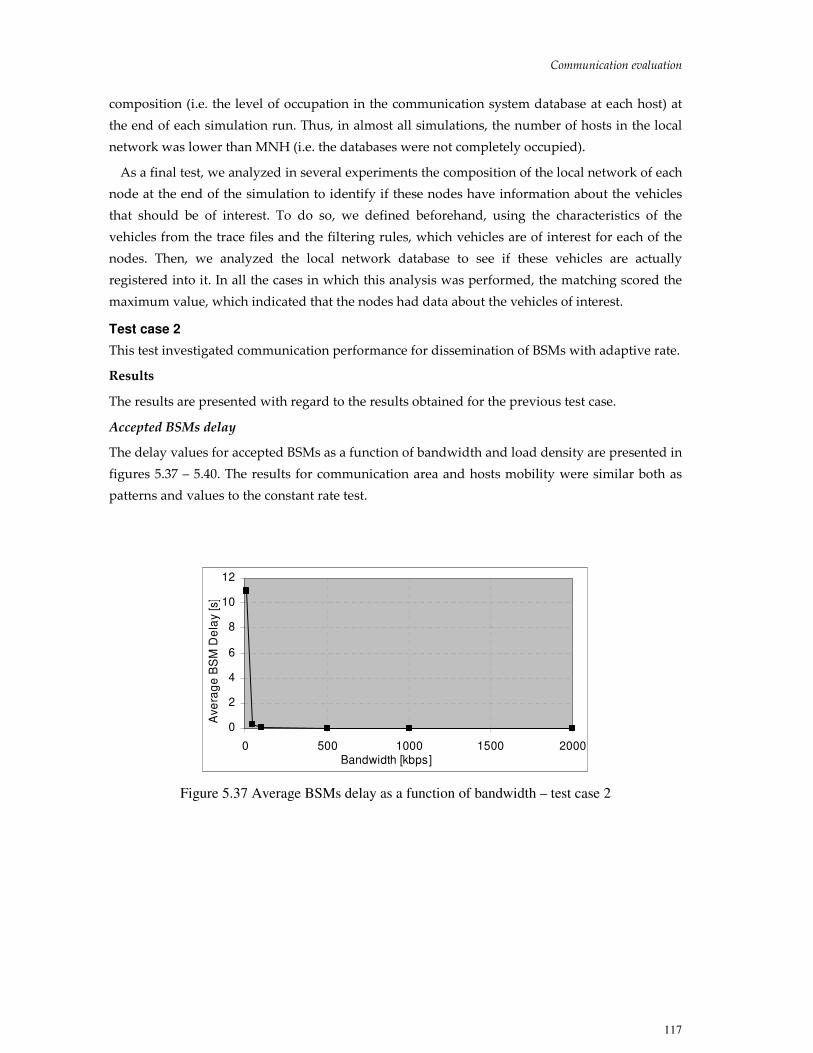
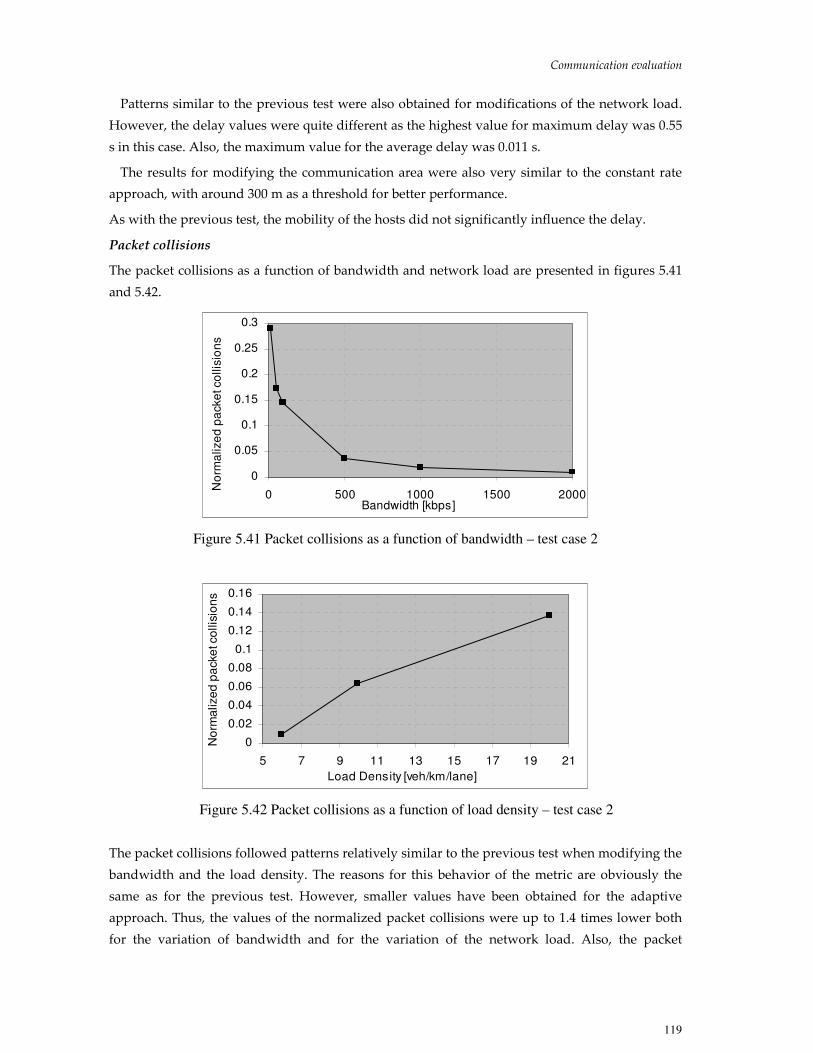
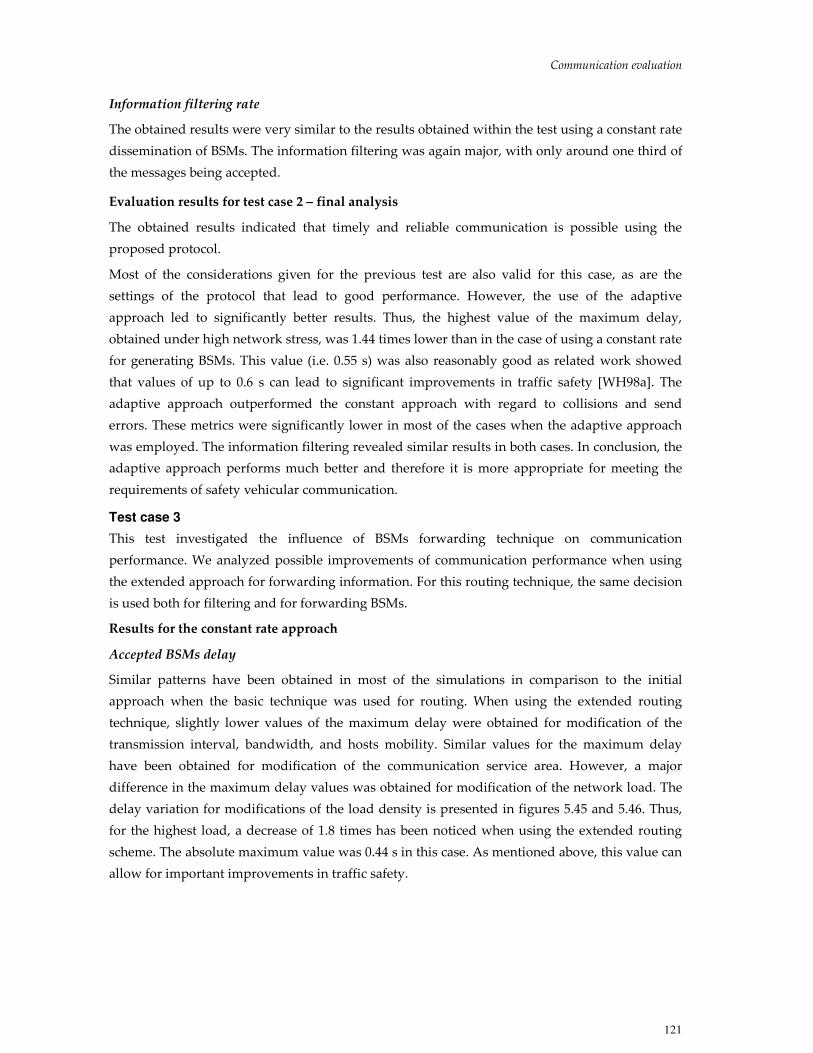
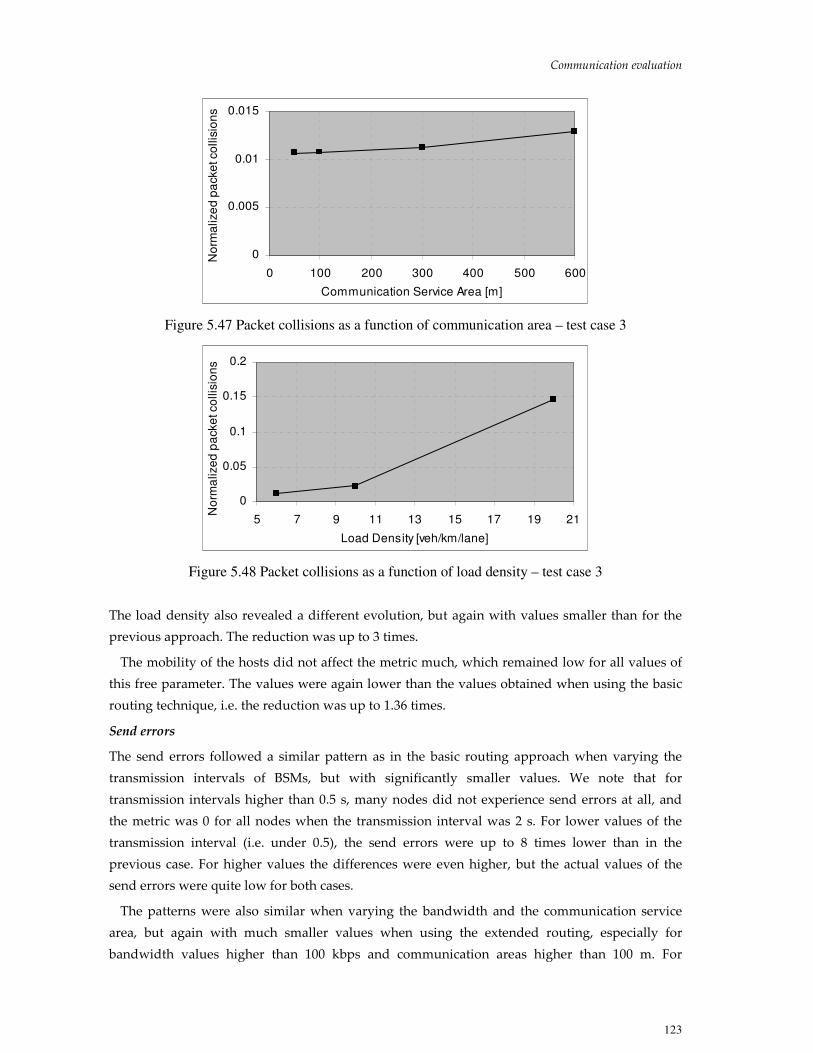
5.1 Evaluation goals and method............................................................................................................. 85 5.2 Evaluation environment...................................................................................................................... 86 5.3 Metrics and free parameters ............................................................................................................... 87 5.4 Scenarios................................................................................................................................................ 90 5.5 Baseline settings.................................................................................................................................... 96 5.6 Test cases ............................................................................................................................................... 98 5.7 Results presentation and analysis .................................................................................................... 102 5.8 Final remarks ...................................................................................................................................... 142
6. Related work ........................................................................................................................ 145
6.1 Traffic information dissemination ................................................................................................... 145 6.2 Network organization........................................................................................................................ 149 6.3 MAC schemes for vehicular communication ................................................................................. 150 6.4 Direct Short Range Communication (DSRC).................................................................................. 151
Active safety systems are intended to proactively prevent vehicles from colliding with each other
or with other objects. They collect and analyze information extracted from the environment
surrounding a vehicle to identify dangers in traffic [Bis00, AVN00]. These systems are designed
to provide assistance to the driver for better completion of driving tasks. They also contribute to
the increase of the driver’s situational awareness by providing information about traffic
situations. Active safety systems act towards avoiding accidents by alerting the driver to a
potential danger, and might eventually employ automatic actions such as emergency braking or
steering. An example of early active safety systems is the Adaptive Cruise Control (ACC) system
that uses radar sensors to help drivers maintain a safe distance between vehicles [Jon01]. Active
safety systems can also be connected with passive safety systems. Examples include systems that
offer support to passive systems by anticipating an imminent collision using radar technology.
Based on this data, the passive systems (e.g. seat belt, airbag) can be activated in advance, which
can lead to a reduction of the severity of injuries that the vehicle’s occupants may suffer. An
example of such passive-active system is the Toyota Pre-crash Safety System [Toy02].
The proposals for active safety systems can be categorized according to the type of support
provided to the driver as [Jon02]:
• Information delivery systems: control the content and the presentation of notifications. These
systems present the driver with information that can increase his/her situation awareness and
let the driver take the appropriate measures.
• Automatic control systems: delegate driving tasks to the driver and to the vehicle. These systems
aim at providing more support to the driver by employing automatic actions on the part of the
vehicle. However, attention needs to be given to the transfer of tasks from humans to vehicles,
since unknown problems may arise.
2.1.2 Technologies for developing active safety systems2.1.2 Technologies for developing active safety systems2.1.2 Technologies for developing active safety systems2.1.2 Technologies for developing active safety systems
Many research areas such as sensors, kinematics, positioning, information systems, and
communication networks can contribute to the development of efficient active safety systems.
We discuss in the following three technologies that were considered the most promising for
implementing safety systems: radar and laser sensor systems, computer vision, and
communication systems [Jon01].
Chapter 2
8
Sensor systems
Since the ultimate goal of active safety systems is to keep vehicles from colliding with each other
and with other objects, vehicles can be equipped with devices that can identify the presence of
nearby obstacles. Such devices are usually radar sensors or lidar sensors (i.e. sensors based on
laser) that can detect obstacles that exist around a vehicle and may interfere with its traveling
path [Bre00, Jon01]. Standard radar systems use sensors that send narrow microwave beams that
are reflected by objects and received back by the radar system [Wol95]. Based on this
information, the relative position and speed of other objects can be determined. Lidar systems
use light beams for the same purpose.
The major limitation associated with sensor systems is their local perception [AVN00]. This is
due to the fact that sensor systems usually require a line-of-sight (LOS) for object detection
[MH02]. They cannot detect distant or hidden objects (i.e. objects that are not in the LOS), and
therefore may not be able to provide information about more complex traffic situations.
Several other problems arise with the utilization of sensor systems, both with regard to their
operation modes and the state of the art of the technology. For example, lidar sensors are
considered less appropriate because rain and snow affect their functionality. The accumulation of
dust and mud may even make them unusable [Jon01]. Issues such as cost, sensor integration
within vehicles (i.e. this may require modification of the car body), and regulatory aspects
addressing frequency spectrum also need to be considered when developing sensors for vehicles.
For instance, radar systems on 76 -77 GHz, which were initially used in adaptive cruise control
systems, are currently considered less appropriate due to their high cost. Consequently,
proposals for new radar systems on 24 GHz have been made [IST02]. However, due to their
smaller operation range, radar systems on 24 GHz may not be so effective in cases that require
the detection of more distant obstacles.
Computer vision
Another technology that has been considered for improving traffic safety is computer vision. One
important safety application addresses collision avoidance where vehicles use vision to detect
obstacles such as pedestrians and other vehicles that may interfere with the traveling path of a
vehicle [FH02a]. Another important type of application using computer vision addresses the
monitoring of vehicle movement based on elements characteristic to roads, such as lane markers
[NSG+04, NDM+05]. In these applications, stereo cameras are used to monitor the environment
around a vehicle and image processing is employed to determine the occurrence of dangerous
situations, such as when a vehicle approaches the lateral side of a road unsafely [CAC02]. These
systems then alert the driver to such situations.
However, as with the utilization of sensor systems, limitations related to the local perception of
vehicles (e.g. LOS object detection and monitoring) can also apply to active safety systems based
on computer vision.
We note that computer vision can also be used to monitor driver condition. In such an
application, video cameras analyze the driver by monitoring behavior-related features such as
eye movement. This gives indications about the driver’s capacity for paying attention to road
Designing the support system for active safety systems
9
conditions and successfully fulfilling driving tasks. An application that has received much
attention is the determination of the state of drowsiness of a driver [USDT99, HMS+02].
Vehicular communication systems
Relying on data from local sensors is an inherent weakness of active safety systems based on
sensors and computer vision. Local sensors have limited utility in detecting objects that are not in
the line of sight, such as vehicles entering an intersection [MH02]. One solution to these
limitations is to equip vehicles with communication capabilities, allowing the exchange of traffic
safety information. Using communication, a vehicle can then obtain data about vehicles that are
not detected by sensors (e.g. radar) or by computer vision systems. Consequently, the
information gathering ability of a vehicle is extended. Considering this advantage, it was
predicted that vehicular communication would have a major impact on the development of
active safety systems that could effectively reduce the number and severity of crashes [AF96,
Jon01]. Additionally, it was envisioned that a variety of safety services, such as collision warning,
collision avoidance, or traffic jam notifications could be provided to the driver when vehicles
have communication capabilities [WH98a, AVN00, MSN00, KBS+01, AMF+02].
We note that communication networks for vehicles can be formed only by vehicles, or by
vehicles and servers located on the roadside. Thus, two types of vehicular communication were
defined [MKO00]:
• Vehicle-to-Road Communication (VRC): exchange of data between vehicles and communication
servers located on the roadside. Even if data needs to be exchanged between two vehicles, this
is performed via a roadside server (fig 2.1).
• Inter-Vehicle Communication (IVC): direct exchange of data between vehicles (fig 2.2).
Figure 2.1 Vehicle-to-Road Communication example
Figure 2.2 Inter -Vehicle Communication example
Communication
Server
Chapter 2
10
2.1.3 Collaborative active safety systems 2.1.3 Collaborative active safety systems 2.1.3 Collaborative active safety systems 2.1.3 Collaborative active safety systems
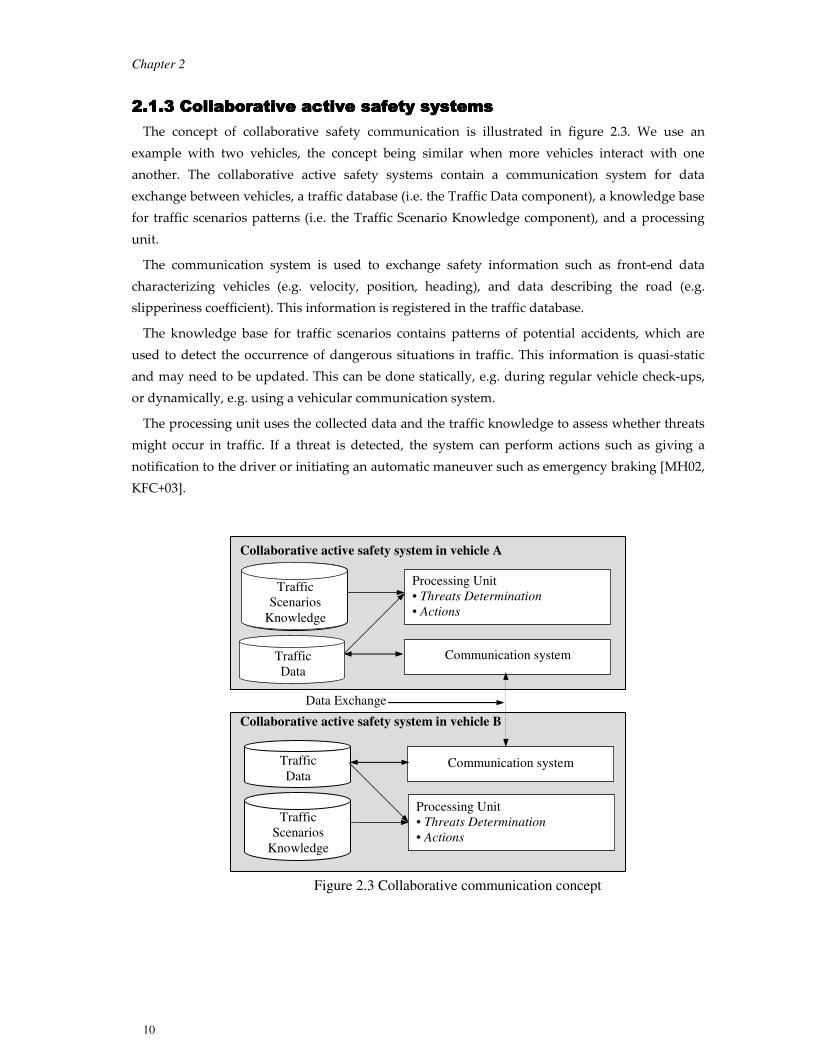
The concept of collaborative safety communication is illustrated in figure 2.3. We use an
example with two vehicles, the concept being similar when more vehicles interact with one
another. The collaborative active safety systems contain a communication system for data
exchange between vehicles, a traffic database (i.e. the Traffic Data component), a knowledge base
for traffic scenarios patterns (i.e. the Traffic Scenario Knowledge component), and a processing
unit.
The communication system is used to exchange safety information such as front-end data
characterizing vehicles (e.g. velocity, position, heading), and data describing the road (e.g.
slipperiness coefficient). This information is registered in the traffic database.
The knowledge base for traffic scenarios contains patterns of potential accidents, which are
used to detect the occurrence of dangerous situations in traffic. This information is quasi-static
and may need to be updated. This can be done statically, e.g. during regular vehicle check-ups,
or dynamically, e.g. using a vehicular communication system.
The processing unit uses the collected data and the traffic knowledge to assess whether threats
might occur in traffic. If a threat is detected, the system can perform actions such as giving a
notification to the driver or initiating an automatic maneuver such as emergency braking [MH02,
KFC+03].
Figure 2.3 Collaborative communication concept
Processing Unit
• Threats Determination
• Actions
Communication system
Traffic
Data
Collaborative active safety system in vehicle A
Communication system Traffic
Data
Traffic
Scenarios
Knowledge
Collaborative active safety system in vehicle B
Data Exchange
Traffic
Scenarios
Knowledge
Processing Unit
• Threats Determination
• Actions
Designing the support system for active safety systems
11
2.2 Design method for realizing the support system 2.2 Design method for realizing the support system 2.2 Design method for realizing the support system 2.2 Design method for realizing the support system
This section introduces a generic design method that we propose to realize the support systems
for active safety systems. This method focuses on the important aspects of supporting a vehicular
safety system, which leads to an in-depth design of the support system. The designer is thus able
to specify the relevant set of requirements, identify appropriate solutions for the system
components, and analyze limitations of the system. In this thesis the method was applied when
designing the communication system that is part of a collaborative safety system.
Figure 2.4 provides a graphic representation of the components that we identified as essential
to analyze, and how the results of the analyses were used.
Figure 2.4 Design method
We analyzed traffic scenarios to determine accident dynamics and identify when dangerous
situations might occur. The accidents patterns that we addressed here are similar to those that
should be recorded in the component Traffic Scenarios Knowledge of collaborative active safety
systems (i.e. in figure 2.3). Requirements on exchange of traffic data (i.e. data registered within
the Traffic Data component) such as delivery latency, information content and size were derived
from these analyses. The spatial and temporal relevance of data were also investigated, e.g. the
set of vehicles that have data of interest for a subject vehicle, or when relevant information needs
to be provided to a vehicle to increase the odds of avoiding a collision. We further investigated
how accidents could be avoided by applying specific actions in traffic, and we also evaluated
whether an active safety system using communication can be used to induce these actions. To
perform these analyses we developed a temporal reasoning system that allows investigation of
the time development of traffic scenarios and the effect of inter-vehicular communication on
accident avoidance. This system is presented in the last section of this chapter.
Requirements analysis
Traffic environment
Traffic scenarios Active safety systems
Analysis of support system
impact on accident avoidance
Support system design
Analysis of approaches for
the support system Design components
analysis
Chapter 2
12
The vehicular environment imposes certain unique constraints on the reliable exchange of
safety information. We defined requirements specific to this environment for data exchange
between vehicles and for network management. Examples of these requirements include
information dissemination latency, service area size, and frequency of providing traffic data.
The next aspect that we focused on was the operation mode of active safety systems. We used
currently proposed systems for defining a general set of requirements and analyzed how they
applied to systems using communication. Generic requirements such as on system availability,
data exchange properties (e.g. reliability, latency) and communication cost were then defined.
We underline that the requirements on vehicular communication derived from our analyses
addressed not only communication performance (e.g. data rate, latency), but also functional
aspects (e.g. service area, system availability), and economic aspects (e.g. operation and
deployment costs). These requirements were used to assess the applicability of current
communication approaches to develop a safety communication system. Systems based on
satellite networks, cellular networks, infotainment infrastructures deployed on the roadside and
systems using direct data exchange were investigated. The requirements were also used to
analyze design components of communication systems such as operation modes, networking
techniques or data transmission procedures. Based on these analyses, we have selected several
features to be integrated within a proposal for a safety communication system.
We note that the proposed design method can help realize other support systems for active
safety systems, e.g. radar systems. In these cases, the analyses need to be changed or extended,
but some of the results presented here can be reused.
In the following, we introduce the reasoning system developed for traffic scenarios analyses.
Details on the other analyses defined within the design method are presented in the following
chapters.
2.3 Accident modeling and vehicular communication2.3 Accident modeling and vehicular communication2.3 Accident modeling and vehicular communication2.3 Accident modeling and vehicular communication
The analysis of accidents helps in identifying elements that affect traffic conditions, the relations
between these elements, and how they may contribute to the occurrence of dangerous situations
[NSS+03]. Based on the results of such analyses, more efficient crash countermeasures can be
developed. Descriptions of accidents are usually provided in the form of official reports
compiled by public safety agencies such as the police. Enhanced versions of such reports, where
the information is reorganized, are provided for research purposes by governmental
organizations such as the U.S. National Highway Transport Administration [USC05]. Such
official reports usually contain detailed descriptions of accidents and include narratives and
sketches of accidents. They also include information about the consequences of crashes in terms
of injuries and property damage. Usually, the reports also include characteristics of the involved
vehicles (e.g. size, airbag status, type of brake) and the description of pre-crash environmental
and driver-related data (e.g. roadway profile, driver distraction). Although these reports are
extensively used for statistically describing traffic aspects, they can be difficult to use for deriving
causal relations that provide indications about how an accident occurred, and what actions can
Designing the support system for active safety systems
13
be taken to avoid it [MST01, USC03]. This method of describing accidents is also static, and
allows only a limited investigation of the patterns related to the dynamics of crashes.
Consequently, there is a need for organizing and dynamically analyzing the information
contained by the above-mentioned reports. Thus, it is necessary to develop a means for
identifying preconditions that describe how a traffic situation develops into an accident
[USDT99, IST02, NSS+03]. It is also important to be able to investigate what data should be
provided to safety systems located in vehicles for these to efficiently act to avoid possible
collisions. Furthermore, it should be possible to investigate when and how this information
should be delivered [KLP+99, TCE+00, PAO01, MH02].
One way to dynamically analyze accidents is the simulation of scenarios using classical traffic
simulators. Examples of simulators that integrate advanced vehicle dynamics and driving
behaviors are presented in [SBH97, RO99, ER01]. However, high-performance simulators are
usually not accessible for public use. Common open-source simulators have several drawbacks
that make their utilization less appealing. First, many of them are difficult to modify and are
resource extensive. Other simulators include algorithms that cannot represent exactly the states
within time-developing situations, such as in specific accidents. For example, some of these
simulators work with fixed time steps for updates (e.g. typically 1-second intervals) [BBA98].
Several event-based simulators are also available for use [BBA98]. However, those that we tried
to employ (e.g. SIMNET and FLEXSIT-II) were dedicated to other types of analyses, and could
not be easily adapted for studying traffic scenarios involving crashes.
Considering the difficulties above, we decided to use formal logic to create an easy-to-use and
efficient reasoning system that can integrate elements given in official reports of accidents. This
system was designed to perform dynamical accident analyses for identifying relationships that
are of particular interest in developing safety systems. The modeling of accidents using a formal
logic also provides the possibility of formal verifications.
2.3.1 ECAM 2.3.1 ECAM 2.3.1 ECAM 2.3.1 ECAM ---- Event Event Event Event Calculus for Accident ModelingCalculus for Accident ModelingCalculus for Accident ModelingCalculus for Accident Modeling
Selected formalism
The sequence of traffic-related events, the relationships between them, and the relationships
between consecutive traffic situations determine if a collision takes place or not. Therefore, a
formal system for modeling traffic scenarios needs to offer the possibility of specifying relations
between traffic situations and actions that occur in traffic (e.g. driving maneuvers). The
formalism used by such a system should then allow temporal reasoning about situations and
changes. It should also allow the representation of preconditions for events to happen, the
specification of when they happen and how they affect a traffic situation. Since events can occur
simultaneously, concurrency should be considered. A formal system for modeling accidents
should also be able to model a wide variety of aspects and conditions related to traffic situations.
Given these requirements, we selected Event Calculus (EC) [KS86, Sha99] as the logic for our
reasoning system. Event Calculus is a logical framework for temporal reasoning about situations,
events, and changes that has the capacity to model event-based systems with time-specific
behavior [CM00, EFD+02]. The time development of traffic situations under certain conditions
Chapter 2
14
can be seen as such a system. Event Calculus allows the easy specification of time relations
between situations and events, which is essential for describing traffic accidents. Furthermore,
the development of accidents is driven by events, and Event Calculus integrates by default the
eventing mechanism. The specification of concurrent actions is also possible. Event Calculus is
also general enough to specify any type of event-based system [CM00].
Event Calculus has been successfully applied for developing systems in diverse applications
areas. An example is the use of Event Calculus for specifying a patient monitoring system
[CMD+94]. Systems for defining policies for adaptive mobile communication systems [EFD+02],
and systems for policy analyses were also proposed [BLR03]. Event Calculus was also used for
system description and control [CM00, CBC01]. However, the systems presented in these works
were strongly dependent on the specific application area. For instance, the system in [CM00]
describes the operation of a gas heater by modeling its components and possible states (e.g.
lighter, warm up state). Consequently, we could not adapt previous systems for modeling
accidents.
Other logical formalisms can be considered for developing systems similar to the one proposed
by us. An example is the Situation Calculus that allows reasoning about actions and their effects
on the world [RN95, PR99b]. However, this formalism specifies a sequential occurrence of actions
and does not allow the specification of the moment when an action takes place or the
specification of the development of a situation under concurrent actions [McC02]. In the
development of a collision, the time when a certain event occurred is important. Also, numerous
events may take place at the same time. Therefore, formalisms such as Situation Calculus did not
serve our purpose well enough. The logic framework of Features and Fluents, proposed in
[San94] could also be the basis for constructing a system for modeling and analyzing accident
scenarios. For instance, such a system may be constructed using the Fluent Calculus [Bra98] that
was developed using the above-mentioned framework. The formalism specified in the Features
and Fluents framework is similar in many aspects to Event Calculus [Bra98, Sha99]. However, it
provides a representation of continuous changes that is more complex than in Event Calculus
[Sha95]. Since we aimed at constructing an easy-to-use system for modeling and analyzing
accident scenarios, we decided to base the development of the system on Event Calculus. The use
of a formalism based on the Features and Fluents framework can be subject to future
investigations.
Event Calculus entities
We introduce below the entities defined within the specifications of Event Calculus (based on
[Sha99]):
• Events: actions that occur at a moment in time or during a time interval.
• Fluents: entities that modify their state as the result of the occurrence of actions. Examples are
the value of a quantity such as the velocity of a vehicle, or a proposition such as “vehicle x is
braking”. The modification of the state of a fluent is due to events. Thus, a fluent has time
duration and is initiated and terminated by events. A fluent holds when it is true (e.g. a
Designing the support system for active safety systems
15
proposition is correct). A fluent does not hold at the time the event that initiates it happens, but
holds at the time the event that terminates it happens.
• Predicates: entities that specify when events take place or indicate the state of fluents at different
time points. Event Calculus provides a basic set of predicates and allows the definition of new
predicates.
• Constraints (state constraints, effect constraints, and causal constraints): entities that define, using
predicates, diverse relations between fluents, and between fluents and events. For example, the
occurrence of two events at the same time that determines a modification of the state of a fluent
can be described using constraints.
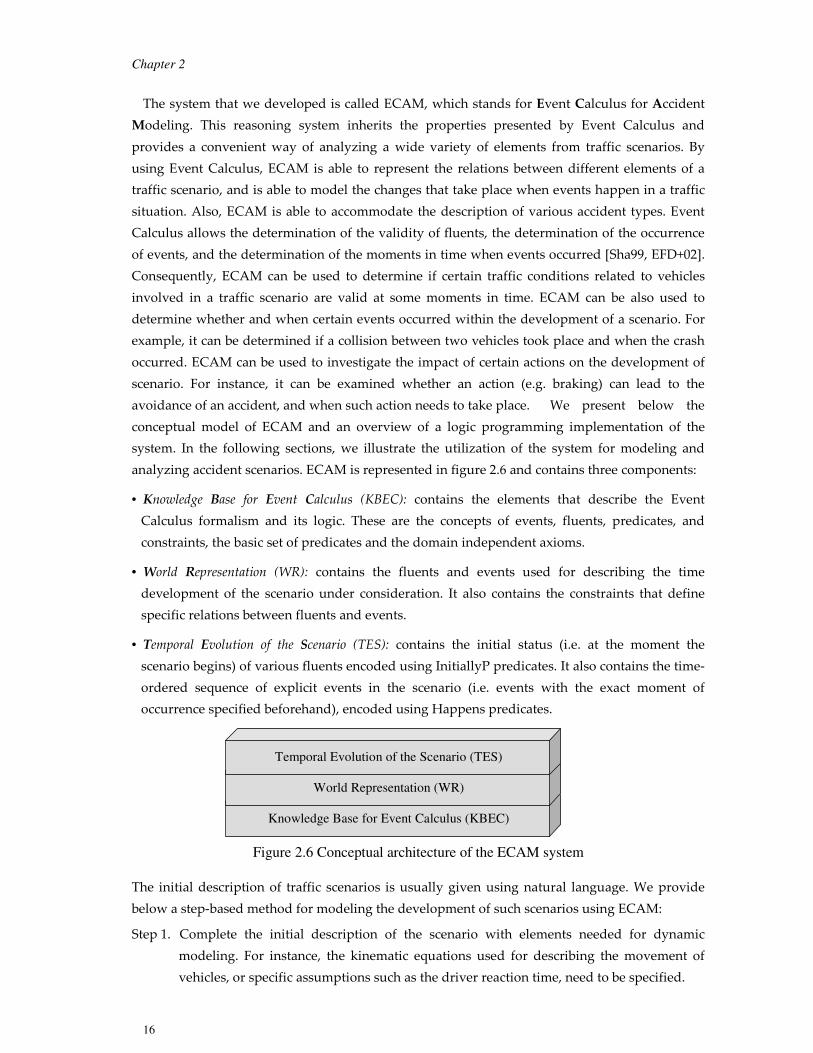
ECAM – a modeling system based on Event Calculus
The reasoning system
The reasoning system that we propose for describing and analyzing traffic scenarios provides an
Event Calculus-based logical framework for time-developing situations. The set of predicates
and domain independent axioms provided by Event Calculus that we used in our work are
presented in figure 2.5. Throughout this chapter, we use ∧∧∧∧, ∨∨∨∨, ¬¬¬¬ for And, Or and Negation.
Notations such as =, <, >, +, -, * and / denote equality, inequality, and calculus relations.
Figure 2.5 ECAM - Predicates and Axioms
We should mention that the original specifications of Event Calculus (e.g. [KS86]) are able to
provide only a discrete representation of changes. Therefore, in our work we have used the
extension of Event Calculus proposed by Shanahan [Sha90, Sha99]. This provides the possibility
of representing not only discrete, but also continuous changes, such as the variation of the speed
of a vehicle. Thus, in our approach the varying entities (e.g. speed, acceleration, distances) take
values from a one-dimensional quantity space (e.g. speed can take values from 0 to 200 km/h),
and they are quantitatively represented when modeling traffic scenarios.
Predicates:
• InitiallyP(f) – fluent f holds from time 0 (i.e. the initial moment).
• Happens (e ,t) – event e occurs at time t.
• Initiates (e, f, t) – fluent f is initiated by event e at time t and starts to hold immediately after t.
• Terminates (e, f, t) – fluent f is terminated at time t by event e and ceases to hold immediately after t.
• t1<t2 – time point t1 is before time point t2 (temporal order).
• HoldsAt (f, t) – fluent f holds at time t.
• Clipped (t1,f,t2) – fluent f is terminated at some time t between times t1 and t2, where t1<t<t2.
• Trajectory (f1,t1,f2,dt) – if fluent f1 is initiated at time t1, then fluent f2 becomes true at time t1+dt.
Designing the support system for active safety systems
19
2.3.2 ECAM 2.3.2 ECAM 2.3.2 ECAM 2.3.2 ECAM –––– case study case study case study case study
We have modeled and analyzed various accident scenarios using the ECAM system. These
scenarios were selected from the most representative types of accidents, i.e. the accidents that
appear most frequently in traffic (e.g. [USDT99, SITC01]). These types of accidents were:
• Rear-end accidents, e.g. crashes implying a vehicle driven by an inattentive or distracted driver that strikes the rear end of another vehicle.
• Intersection accidents, e.g. angle crashes at cross-roads due to vehicles that run “stop” or “give way” signs.
• Lane change accidents, e.g. crashes due to a change lane maneuver executed by a vehicle that does not notice the presence of another vehicle in the lane it moves into.
When modeling accidents with ECAM we used the descriptions of collisions given in research
addressing crash analyses (e.g. [KLP+99, NSS01, MH02, SSN03, KCF+03]). We illustrate in the
following the development of the ECAM system by the use of an example. Thus, we model and
analyze a rear-end accident scenario.
View obstruction followed by tailgate scenario (VOTS)
VOTS - Scenario Description (Step 1)
In the following we provide an example of the use of ECAM for modeling an accident scenario
classified as rear-end. This scenario can be categorized as view obstruction followed by tailgate
(VOTS) [KLP+99]. The scenario involves 3 vehicles, V1, V2, and V3 as presented in Figure 2.9.
The development of events is as follows. At time t0 the vehicles follow each other at a distance
considered safe, as presented in Figure 2.9 a. Vehicle V1 is considered not to be aware of V3 since
its view is blocked by vehicle V2. At some time t1 vehicle V3 suffers a breakdown and starts to
pull over. At time t2 after t1, V2 realizes the problem facing V3 and executes an evasive
maneuver to avoid V3 (indicated by the arrow in Figure 2.9.a). This maneuver is considered
successful. At time t3 after this maneuver, V1 starts to realize the situation of V3 and tries to
execute an emergency braking. Due to the short separation distance between V1 and V3, the
maneuver is unsuccessful and V1 collides with V3 (Figure 2.9 b). We note that we also modeled
the same type of accident on a bi-directional road with two lanes per direction, where a larger
number of vehicles were present on the road (i.e. 25). However, for simplicity we offer here the
basic version of the scenario.
Figure 2.9 View obstruction followed by tailgate scenario (VOTS)
The modification of the speed and acceleration of vehicles is due to driving maneuvers such as
braking, pulling over, or acceleration. In this scenario, average values were considered for
b. Accident situation a. Initial situation
V1
V2
V3
V1 V2 V3
Chapter 2
20
acceleration between events that determined significant modifications. The motion equations that
define the movement of the vehicles are presented below. In all formulas, the distance is
expressed in [m], the speed in [m/s] and the acceleration and deceleration in [m/s2]. Negative
values were used for deceleration.
We considered that the separation distance between two vehicles x and y, when x follows y, is
safe when it is higher than a threshold R calculated based on the characteristics of the two
vehicles [KCF+03]. Thus, R is calculated as the sum of the delay time range (DTR) and the
braking on set range (BOR) as presented below (adapted from [KCF+03]).
[ECS1.0] R= DTR + BOR. DTR and BOR are calculated as:
DTR = (Vx-Vy)*t_delay+0.5*(Ax-Ay)*t_delay2
BOR =2 (Vxp-Vyp)
-2*(Axr-Ayr)
In the equations above, Vx and Vy are the speed values, and Ax and Ay are the acceleration or
deceleration values of vehicles x and y. The time interval t_delay is the sum of the reaction time of
the driver and the braking systems lag. The reaction time of the driver is the interval between the
moment the driver notices an event in traffic and the moment the driver acts accordingly. The
braking system lag is the time between the application of the brake (pedal) and the application of
the brakes (shoes) on the wheel. Vxp and Vyp are the predicted velocity values for vehicles x and
y after the delay time t_delay has passed. Ayr is the deceleration of y and Axr is an approximation
of the expected deceleration of x. We note that within the modeling of the scenario we calculated
the predicted safe distance when the reaction delay time has passed (i.e. DTR is null), and we
used a value of -9 m/s2 for the emergency braking deceleration of a vehicle (i.e. Axr).
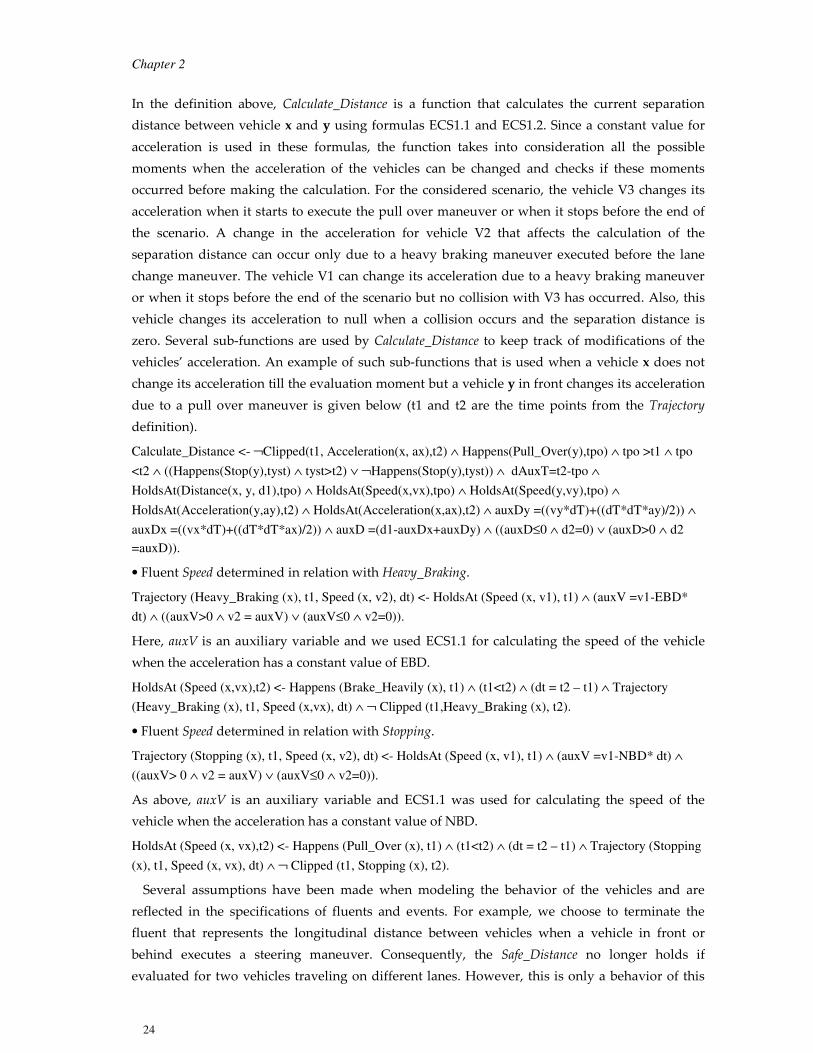
The calculations of speed values and separation distance between two vehicles are based on
classical kinematic equations (e.g. [Phy03]). Thus, for a vehicle traveling with a constant
acceleration A between time points t1 and t2, the speed at t2 is calculated as:
[ECS1.1] V2 = V1+ A*(t2-t1),
V1 and V2 are the speed values of the vehicle at times t1 and t2 respectively. If the distance
between two vehicles x and y at time t1 is D1 and x is traveling with acceleration Ax and y with
acceleration Ay between t1 and t2, then at time t2 the distance between x and y is:
[ECS1.2] D2 = D1 – AuxDx + AuxDy, where AuxDx = (Vx*DT)+0.5*(DT2*Ax) and AuxDy =
(Vy*DT)+0.5*(DT2*Ay) with DT =t2-t1.
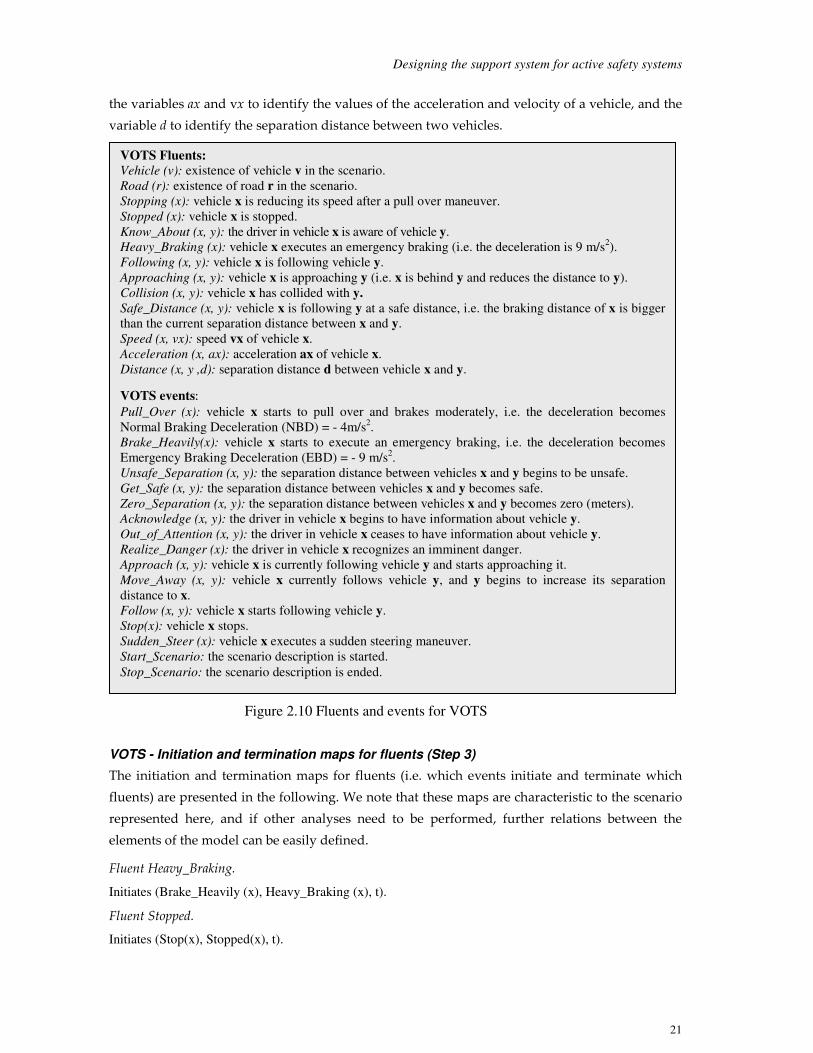
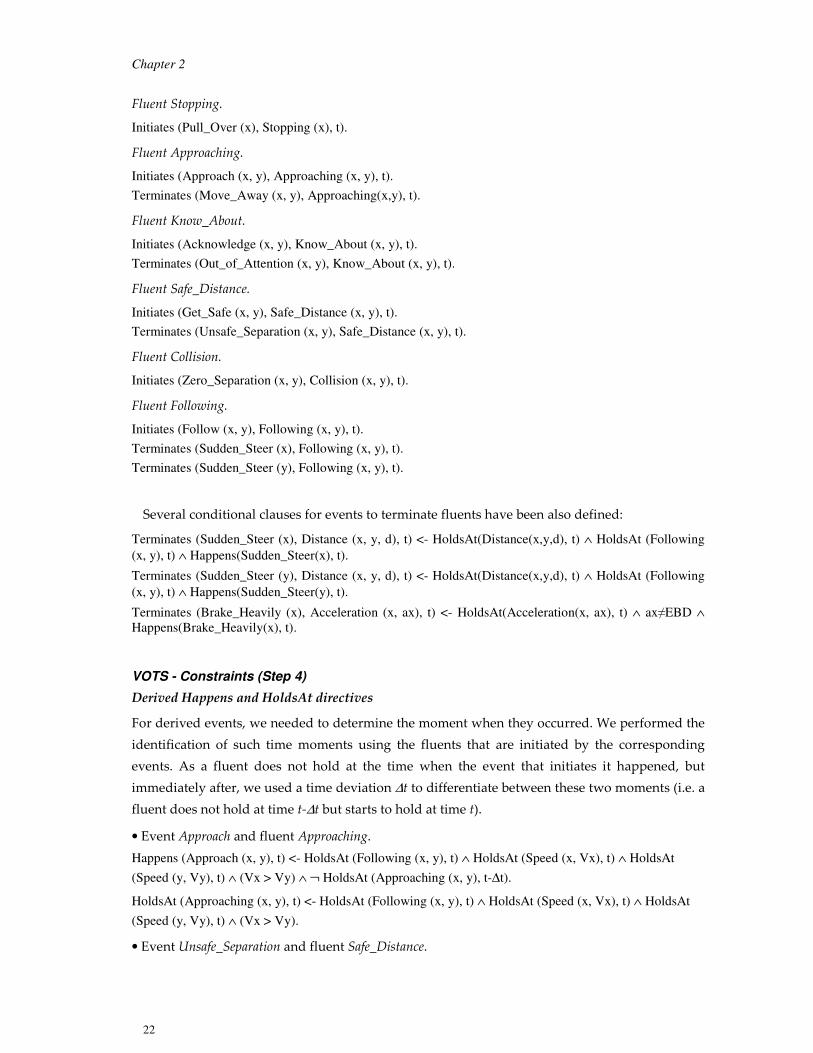
VOTS - ECAM fluents and events (Step 2)
The set of fluents and events used for modeling the VOTS scenario is presented in Figure 2.10.
We note that this set was also intended to provide the possibility of modeling other rear-end
accidents related to VOTS. In our definitions, we used the constants NBD for Normal Braking
Deceleration (i.e. - 4 m/s2) and EBD for Emergency Braking Deceleration (i.e. -9 m/s2). We used
Designing the support system for active safety systems
21
the variables ax and vx to identify the values of the acceleration and velocity of a vehicle, and the
variable d to identify the separation distance between two vehicles.
Figure 2.10 Fluents and events for VOTS
VOTS - Initiation and termination maps for fluents (Step 3)
The initiation and termination maps for fluents (i.e. which events initiate and terminate which
fluents) are presented in the following. We note that these maps are characteristic to the scenario
represented here, and if other analyses need to be performed, further relations between the
2.3.3 Vehicular communication and ECAM 2.3.3 Vehicular communication and ECAM 2.3.3 Vehicular communication and ECAM 2.3.3 Vehicular communication and ECAM
Even if vehicular communication is generally thought to have a high potential for supporting
active safety systems (e.g. [AF96, AVN00]), it may not be effective in all traffic situations. For
example, communication may have little impact in helping avoiding lane departure accidents.
Therefore, it is necessary to be able to identify in which traffic scenarios communication can be
efficiently used. Since traffic situations differ a great deal one from another, it is important to be
able to determine specific requirements that traffic scenarios impose on a communication system
used as support for the safety system. It is thus important to investigate when certain
information needs to be sent in specific scenarios for avoiding accidents. For example, if two or
more vehicles may be in danger of colliding at an intersection, it needs to be determined when a
warning should to be issued for the vehicles to efficiently make use of it. In order to avoid
accidents or at least reduce their consequences, it is also necessary to investigate the relations
between the time development of traffic scenarios and different actions that can be taken in
traffic (e.g. braking, steering). For instance, during a specific scenario a braking maneuver that
takes place at a certain moment may lead to the avoidance of an accident. Using an active safety
system that integrates communication, it would be possible to issue a warning that allows such
maneuver to happen (i.e. the braking).
In the following, we focus on vehicular communication as the enabling technology for
supporting active safety systems. More specifically, we address the following issues:
• Analyze how accidents can be avoided via diverse actions and investigate if communication
can be used to enable such actions.
• Investigate the quantitative impact of scenario conditions (e.g. velocities, driver reaction time)
on accident avoidance.
• Determine requirements on information transfer that need to be fulfilled by vehicular
communication to be effective in accident avoidance.
Communication concepts in ECAM
We assumed that the vehicles are equipped with communication devices and are able to
exchange data describing their situation in traffic. This data contains information about the
current movement characteristics of a vehicle such as speed, acceleration or heading, and
information about certain events related to traffic that are detected by a vehicle, such as a traffic
jam or an accident. We further assumed that communication fulfills certain performance
requirements with regard to the dissemination of such information between vehicles. Proceeding
from these assumptions, we can also assume that important data sent by a vehicle is always
received by other vehicles that have an interest in it. However, we introduced a delay in
receiving such information and thus model at a high level the consequences of possible flaws in
the communication system, such as loss of data (which then needs to be retransmitted), and data
delivery latency due to medium access control, multihop communication, or sending and
receiving processes.
We further assumed that an active safety system acting as a driving assistant is installed in
each vehicle and analyzes data received from other vehicles to present the drivers with warnings
Designing the support system for active safety systems
29
about dangers in traffic. We also assumed that the drivers pay attention to the information
presented by the assistant system and can employ defensive driving measures according to these
warnings. However, the drivers need a certain amount of time to understand the information
presented and react to it. For simplicity, we included in this interval the time needed for a system
in the vehicle to perform an action based on driver’s maneuvers (e.g. braking system lag).
In the following, we use the VOTS example to illustrate how communication concepts can be
integrated within ECAM. We define additional events and fluents that describe at a high level
the communication between vehicles. We also add constraints describing new relations between
fluents and events.
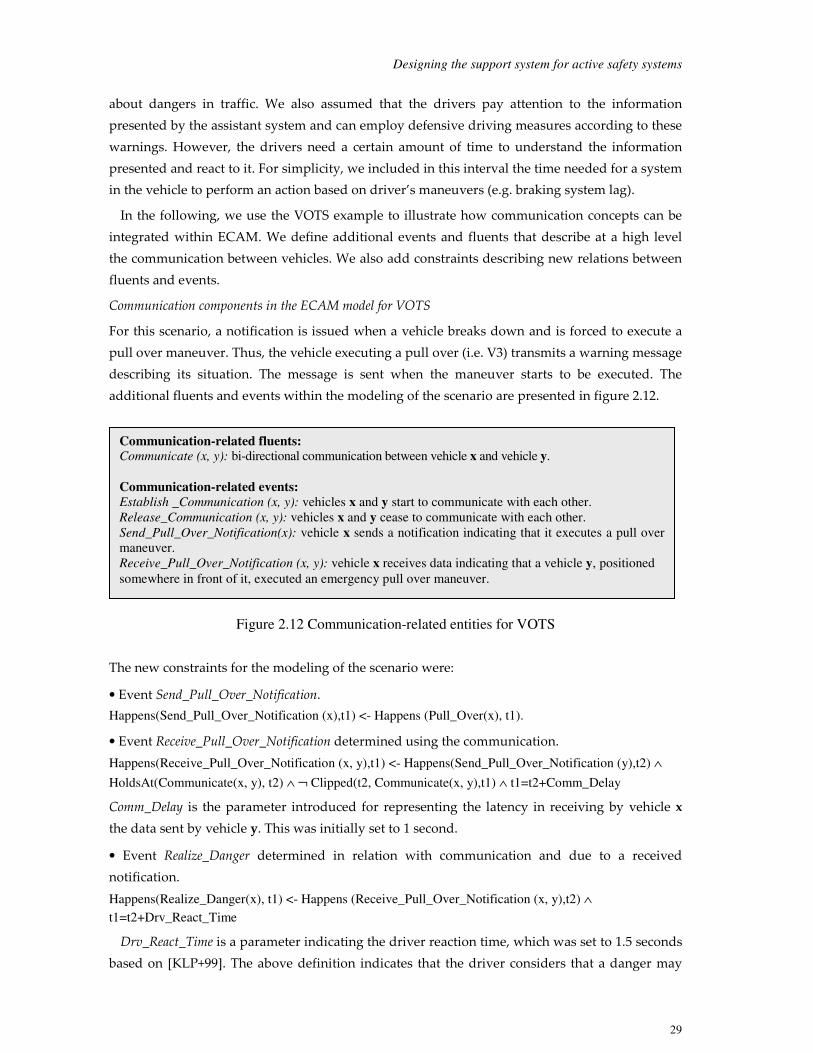
Communication components in the ECAM model for VOTS
For this scenario, a notification is issued when a vehicle breaks down and is forced to execute a
pull over maneuver. Thus, the vehicle executing a pull over (i.e. V3) transmits a warning message
describing its situation. The message is sent when the maneuver starts to be executed. The
additional fluents and events within the modeling of the scenario are presented in figure 2.12.
Figure 2.12 Communication-related entities for VOTS
The new constraints for the modeling of the scenario were:
• The content of exchanged data needs to assure fast processing and should be relevant for traffic
safety (e.g. [AF96, HBE+01]).
Active safety systems requirements
The operation modes of collaborative active safety systems impose specific requirements on the
functionality of a safety communication system. Using crash avoidance research (e.g. [KLP+99,
TCE+00, PJL+00, ZKV00, KCF+03]), we have defined a set of high-level requirements for active
safety systems. We discuss here how these requirements relate to vehicular communication. The
generic requirements for active safety systems are presented in the following.
• Active safety systems must be reliable and must be efficient in determining dangers in traffic
and performing actions accordingly.
When communication is used for supporting the safety systems, the data exchange between
vehicles needs to be performed in a reliable and timely manner. Delay values as much as few
seconds need to be achieved for the data to be transferred from a system installed on a vehicle to
the system installed on another vehicle. The type and amount of information that is exchanged is
determined by the data needed by the safety systems for performing analyses of traffic
Chapter 3
38
situations. The safety information can extend over several hundred bytes at one instance and if it
is provided regularly, a channel bandwidth of at least several hundreds of kbps may be required.
• Active safety systems must be accurate and must provide effective support to the driver.
For vehicular communication, this requirement is primary reflected in the need for timely
exchange of accurate information between vehicles. To effectively help the driver, the safety
system needs to produce accurate and comprehensive notifications (e.g. [Alb99, ZKV00]).
Consequently, the type of data exchanged using vehicular communication depends on the
information that needs to be presented to the driver.
• Active safety systems should not lead to the mental overload of the driver.
Research in driving behavior indicated that drivers are able to successfully cope with secondary
tasks such as the use of safety systems that issue warnings [IIK+02, AHK+02]. However, the
presentation of warnings should not distract or overload the driver. The content of notifications
and the method of presenting them are certainly important. Thus, a wide variety of interfaces
such as audio (e.g. chimes, voice), video (head-up display, car computer display, rear/side mirror
display) or tactile (e.g. seat vibration, brake pulse) are currently under investigation (e.g. [ZKV00,
TCE+00, KCF+03]). Furthermore, the safety system needs to issue notifications early enough for
the driver to be able to employ maneuvers that help in avoiding or mitigating collisions. We note
that driver reaction time between 1 and 3 seconds should be taken in consideration [KLP+99].
The safety system also needs to assure a small number of false and nuisance alarms [GMC+00,
BKP+02]. If a large number of warnings are presented to the driver or if they are presented too
early, the driver’s confidence in the system degrades significantly [KLP+99, TCE+00]. These
factors require the safety system to have accurate data early enough to be able to perform traffic
analyses and employ actions. For safety systems that integrate communication, this translates
again into the need of having a reliable and timely data exchange.
• Active safety systems need to operate in a wide variety of traffic situations.
When communication is used as support for the safety system, the above requirement demands
the utilization of a communication system that is able to function on different roads, in different
areas, and under a wide variety of traffic conditions (e.g. network load, weather conditions,
terrain topology).
• Active safety systems need to be economically feasible.
The successful deployment of active safety systems requires the development of systems with
reasonable costs. For safety systems that integrate communication, this aspect addresses both the
cost of the equipment mounted on vehicles, and the infrastructures related to roads that may
need to be developed. We note that solutions designed to improve traffic safety can be
technically feasible, but not economically feasible. For instance, a system using sign-to-vehicle
communication that implements collision warning functions at intersections was considered less
appropriate for current deployment due to high costs [LMFS97].
Safety communication system analysis
39
Requirements derived from accident analyses
The study of accidents makes it possible to identify specific functional requirements on the use of
communication systems that support on-board safety systems. In our study we analyzed
accidents both theoretically, based on relevant literature (e.g. [USDT99, SITC01, NSD01, NSS+03,
NSS01, USC03, Eva04]), and also via simulations using the ECAM system introduced in the
previous chapter. The following requirements were identified:
• The data exchanged between vehicles needs to describe in detail the traffic situation in the
proximity of a subject vehicle. Information such as position, heading, speed and status of the
vehicle is essential. This information can extend over several hundreds bytes. As traffic data
needs to be provided frequently, and a large number of vehicles may exchange it, low transfer
rates (e.g. tens or few hundreds kbps) may not be appropriate. Furthermore, the use of specific
notifications for describing hazards in traffic (e.g. a vehicle stopped in the driveway) can have a
significant impact on avoiding collisions.
• All traffic data needs to fulfill strict requirements on latency. Values of several seconds may be
enough to avoid simple accidents such as rear-end scenarios involving a small number of
vehicles. However, in more complex situations and for the majority of traffic accidents values,
values that are minimally lower than 1 s are needed for multihop communication. Moreover,
values that can lead to high efficiency of safety systems would preferably be under 0.6 s.
• The required communication area can vary from tens to hundreds of meters, e.g. 80 meters to
700 meters. In most cases, several hundreds meters are needed for assuring the possibility of
avoiding accidents. Additionally, values over 800 meters are usually not needed, and values
less than 50-60 meters are usually too small to provide a real opportunity for avoiding a crash.
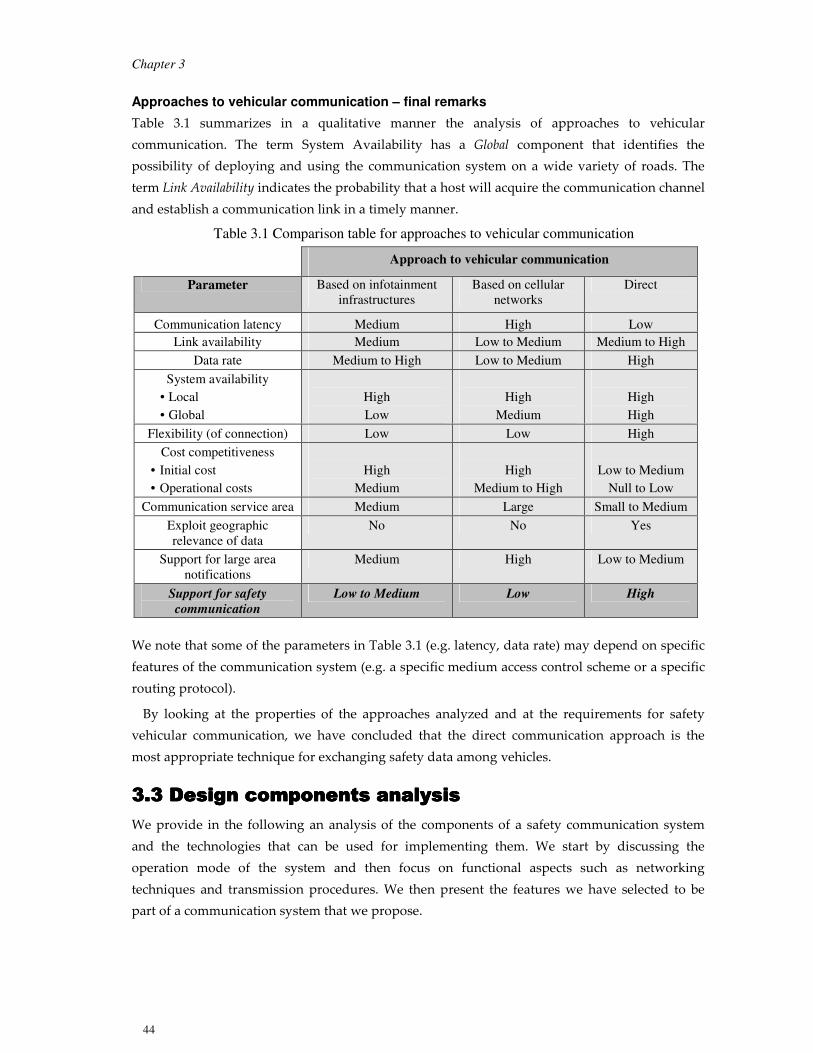
3.2 Approaches to vehicular communication3.2 Approaches to vehicular communication3.2 Approaches to vehicular communication3.2 Approaches to vehicular communication
We provide in the following an analysis of proposals for developing vehicular communication
systems, with consideration given to the safety functionality of the communication system that is
integrated in collaborative safety system.
Based on the specific operations performed for disseminating traffic information, the proposals
for vehicular communication can be categorized into four main approaches:
• Vehicular communication using satellite systems.
• Vehicular communication based on infotainment infrastructures (e.g. gateways mounted on
the roadside).
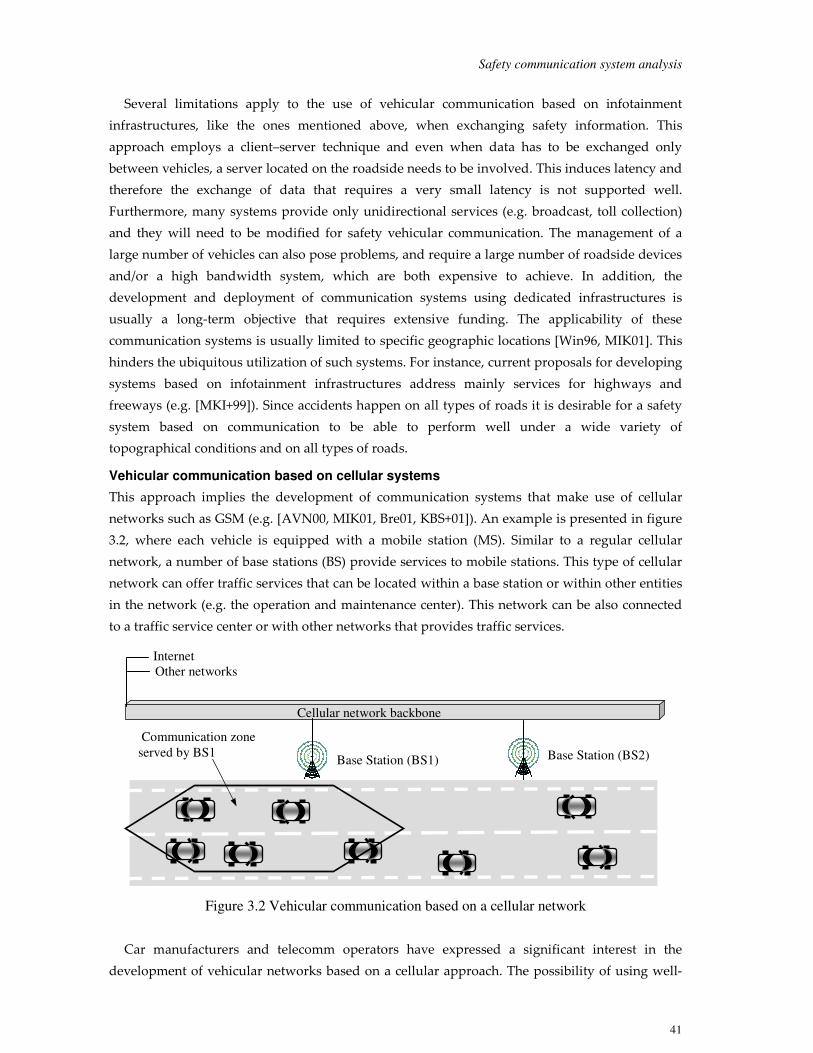
• Vehicular communication based on cellular systems.
• Direct vehicular communication.
We studied these approaches to identify the level of support they could provide for
implementing safety communication. Aspects of particular interest were the possible
performance of the communication system (e.g. data rate, latency, link availability), the
availability and the cost of the system, and the possibility for the system to integrate special
features (e.g. specific service area, use of geographical data). We do not include in the analysis
Chapter 3
40
below the use of satellite networks since it is generally considered that the large delays, high
costs, and possible low performance did not recommend them for implementing collaborative
safety applications [NTF96]. The considerations regarding the other three approaches are
presented in the following. The conclusions are then summarized using a qualitative comparison
table.
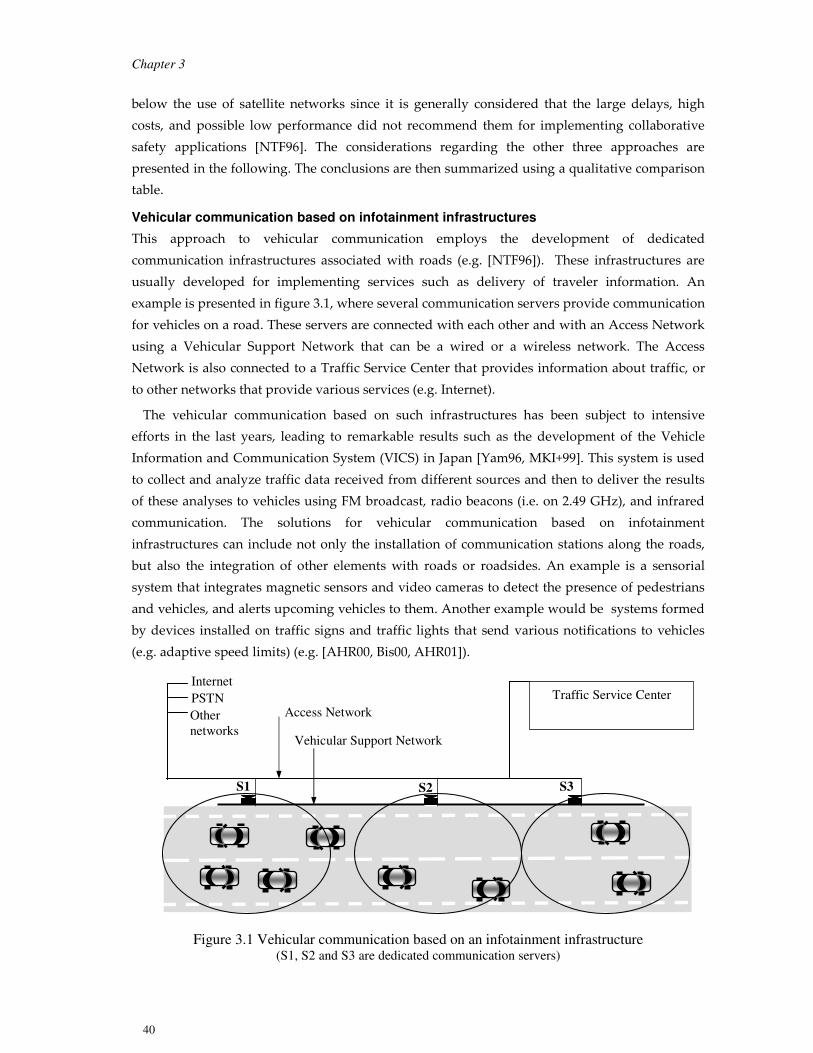
Vehicular communication based on infotainment infrastructures
This approach to vehicular communication employs the development of dedicated
communication infrastructures associated with roads (e.g. [NTF96]). These infrastructures are
usually developed for implementing services such as delivery of traveler information. An
example is presented in figure 3.1, where several communication servers provide communication
for vehicles on a road. These servers are connected with each other and with an Access Network
using a Vehicular Support Network that can be a wired or a wireless network. The Access
Network is also connected to a Traffic Service Center that provides information about traffic, or
to other networks that provide various services (e.g. Internet).
The vehicular communication based on such infrastructures has been subject to intensive
efforts in the last years, leading to remarkable results such as the development of the Vehicle
Information and Communication System (VICS) in Japan [Yam96, MKI+99]. This system is used
to collect and analyze traffic data received from different sources and then to deliver the results
of these analyses to vehicles using FM broadcast, radio beacons (i.e. on 2.49 GHz), and infrared
communication. The solutions for vehicular communication based on infotainment
infrastructures can include not only the installation of communication stations along the roads,
but also the integration of other elements with roads or roadsides. An example is a sensorial
system that integrates magnetic sensors and video cameras to detect the presence of pedestrians
and vehicles, and alerts upcoming vehicles to them. Another example would be systems formed
by devices installed on traffic signs and traffic lights that send various notifications to vehicles
The vehicular network can be mainly organized using a client-server [Tan04], or a peer-to-peer
[Gon01] approach.
The client-server approach implies that there is a central entity (i.e. a server) that regulates the
communication. When some service is needed, the clients contact the server, which provides the
requested service. This approach implies that a server is located on the roadside or one of the
vehicles assumes the role of the server. If a server is used, the vehicles need to communicate via
this server, which induces latency. As mentioned in the previous section, an extensive
infrastructure containing and linking the servers then needs to be built on all roads where the
service is provided. If the vehicles act as servers, they have to announce their existence to the
clients and then provide the services requested by them. The procedure of selecting and
replacing the server can be complex, and may involve extensive use of communication. This can
hinder or delay the exchange of traffic data. Furthermore, a server as the service provider
represents a bottleneck that can easily become saturated if many vehicles need the same service
at the same time. This is the case when all vehicles traveling on the same road sector solicit the
use of a safety service. In addition, the willingness of the car owner to let his/her vehicle act as a
server may be an issue.
Safety communication system analysis
47
The P2P networking approach does not require any centralized control to manage the network
behavior. Traditional P2P technology specifies that the communicating parties interact as equals
and there are no central units for managing the exchange of information [Gon01]. Mobile peer-to-
peer technology defines the application of the P2P networking approach in mobile environments
[KSP+01], such as in the vehicular environment. Several features recommend the use of this
technology for vehicular networking:
• Equal communicating hosts: assures that the communicating hosts have the same opportunity to send and receive safety-related data.
• Flexible interconnectivity: facilitates the direct establishment of the communication links between hosts, and thus the fast exchange of data within the network.
• Community-based communication: defines the virtual grouping of hosts that have similar interests.
A network formed by vehicles can be based on previous information or can be ad-hoc.
In a network based on previous information, the vehicles have communicated sometime
before, e.g. using a negotiation phase where vehicles select the communication partners. This
method usually implies that the communicating vehicles met each other in the past and kept data
about each other. However, keeping information about all the possible vehicles would not be
feasible. Also, vehicles may need data from vehicles they have not met before. Furthermore,
additional delays may occur when selecting the communication partners.
Ad-hoc connectivity implies a dynamic establishment of communication links between hosts
that do not need to have any previous information about each other. This type of connectivity
assures high flexibility of the link management, and allows the spontaneous establishment and
ending of the communication. Furthermore, it provides self-organization and supports the
safety information on a regular basis. Additionally, they can issue dedicated messages when
significant events occur in traffic.
Due to the benefits of direct communication, this method was chosen as the primarily means
for data exchange. However, by acknowledging the advantages of using a road infrastructure
when one exists, we have considered a unified view of the vehicular communication by merging
inter-vehicle communication with vehicle-to-road communication. We still call this direct
communication, as in this case the vehicles communicate directly one to another, but can also
have a direct communication with some devices installed on the roadside. Thus, vehicles
traveling on roads and fixed communication entities that can be located on the roadsides are
considered part of the same vehicular network and can communicate using the same protocol.
We emphasize that the vehicles can communicate with an infrastructure but the communication
is not based on such infrastructure.
We have selected short-range radio communication due to its advantages for exchanging
safety data among vehicles. We have not opted for a specific wireless media because we aimed at
developing a system that is able to use different technologies if this is needed. Nevertheless,
certain requirements regarding transmission properties such as medium access, propagation, and
interference need to be fulfilled by the media employed. Current systems working in microwave
and millimeter-wave bands (e.g. around 2.4 GHz, 5.9 GHz, 60 GHz or 76 GHz) are the most
suitable for implementing vehicular communication. Examples of advantages provided by such
systems are narrow radio beams, reduced interference, and the possibility of having a wide band
data transmission [FAT99]. Differences exist between these systems in terms of their Quality of
Service (QoS). However, they are generally considered well adapted for supporting
communication in the vehicular environment [ONS+00].
As a networking technique, we have opted for the mobile P2P. However, since we also allow
VRC, we see the network more as a hybrid P2P network, where the hosts have the possibility of
soliciting specific services from dedicated hosts (i.e. servers that can be located on the roadside).
This network is formed in an ad-hoc manner.
The selected transmission procedure was scoped broadcast due to its advantages over the other
procedures, and the possibility of realizing a communication system that takes advantage of the
specific environment where the exchange of data takes place. Thus, we propose techniques for
network management and information dissemination that take into consideration the current
traffic situation of the communicating hosts.
As the concept for communication, we have opted for communication using contextual
information. This is because one of the most dominant characteristics of the vehicular
environment is that vehicles react and coordinate their driving maneuvers according to their
traffic situation, and according to actions performed by nearby vehicles. This creates a unique
need for situation awareness that we intended to provide support for in our vehicular
communication system.
51
4. Vehicular communication specifications
We present in this chapter the communication and networking techniques that we propose for
organizing the vehicular network and for exchanging safety data in the vehicular environment.
We also introduce a vehicular communication platform intended to provide an implementation
framework for these techniques, and to integrate the resulting communicating system within a
vehicle.
4.1 Overview of networking and communication 4.1 Overview of networking and communication 4.1 Overview of networking and communication 4.1 Overview of networking and communication
The communication needs to provide timely and reliable exchange of safety data among vehicles.
Random establishment of communication and frequent link failures need to be considered.
Frequent transmission of data by a significant number of vehicles located in a small area needs to
be accommodated. Forwarding of data may also be necessary. Additionally, the vehicles should
be able to select the important information from the received data. The vehicles should also be
able to send both regular data describing their current view of the traffic, and emergency
notifications about hazards in traffic.
Considering the above factors, we apply two methods for controlling the dissemination of
safety information in the vehicular environment. First, we define an organization of vehicles in
virtual clusters, which help in managing the vehicular network. These clusters are created and
maintained according to the current interest in traffic safety of the vehicles. Second, we design a
special communication protocol, an anonymous context-based broadcast protocol. This is a
scoped broadcast where vehicles send safety data and the receivers need to determine if they are
the intended destination of the received data. For this, the receivers use a context-based filtering
of information. The filtering is based on a set of rules defined using research results in crash
analyses and guidelines for developing active safety systems. In this thesis, we illustrate the
protocol operation with a basic set of rules as a proof-of-concept. We present below an overview
of the network organization and the communication protocol. The following sections give details
on the specific techniques that we have developed.
Vehicular network organization is essential for obtaining scalable and reliable communication.
However, due to the very large number of vehicles, a system for tracking them all would be
unfeasible. Additionally, only vehicles that are in close proximity one to another usually provide
useful information [ZKV00]. Furthermore, a vehicle would not benefit by having data about a
very large number of vehicles [AG96]. A solution that matches traffic dynamics is the
organization of vehicles in manageable clusters. Therefore, we propose that the hosts (e.g.
vehicles) organize themselves into Local Networks (LN) in which they exchange safety
information. We define a local network as a community of hosts that share a common interest in
the current traffic situation. A host belonging to a local network maintains information about
other hosts from the same local network. However, for determining changes in the local network,
a host also needs to analyze data sent by hosts not currently belonging to the same local network.
A formal definition of local networks is provided below. We define a set V of vehicles equipped
Chapter 4
52
with communication devices and a set F of fixed hosts such as servers that can communicate with
vehicles. A local network is defined as the set of hosts H that share a common interest in traffic
safety. This interest is defined as a set of conditions that model a traffic situation in which the
hosts exist at a given moment. Examples of such conditions are the separation distance between
vehicles, the driving orientation and the velocity of vehicles, and the characteristics of the road
on which the vehicles travel (e.g. slipperiness). The formal definition of a local network LNi is:
LNi⊆ F ∪ V, i ∈ N (N is the set of natural numbers)
The protocol functionality relies on the following rules for information management:
Rule I. Acceptance of a message by a host. Received basic safety messages and warning messages
can be accepted if the information filtering indicates that they contain data of interest.
The information contained by accepted messages is written in a database associated with
the communication protocol. Messages that were already accepted or are older than the
currently accepted messages received from the same senders are dropped. All messages
that are not accepted are dropped.
Rule II. Local maintenance of data describing senders. A host H maintains data about a sender host S
as long as within a time interval T_record another BSM from S is received by H. If this
event does not happen and the time interval T_record has passed, the host H removes all
information about host S. When a new BSM is received by H and the information
contained by it is recorded, the time interval T_record related to this record is
reinitialized.
Rule III. Generation and transmission of Basic Safety Messages. A host H generates for transmission
basic safety messages at short regular intervals. A timer Tint_BSM is associated with the
generation of these messages and is initialized each time a BSM is transmitted. When this
timer triggers, a new BSM is generated for transmission. If, due to medium access, a BSM
cannot be transmitted until a new BSM is generated, the old BSM is erased and the new
BSM is considered for transmission.
Rule IV. Transmission of messages other than Basic Safety Messages. Messages other than BSMs are
transmitted as the result of events that occurred in traffic.
Rule V. Forwarding of messages. Basic safety messages can be forwarded based on specific
methods that depend on the organization of the vehicular network. Warning messages
are also subject to retransmission.
Rule VI. Priority of messages. Warning messages and basic safety messages sent by a subject host
have the highest priority. Routed BSMs and retransmitted WAMs have lower priority
and are sent after high priority messages.
Rule I is employed because the basic safety messages contain the information necessary for a
receiver to determine if a sending host is of interest. Additionally, a host is allowed by default to
accept any received warning message. However, the protocol can be configured to specify the
conditions that need to be fulfilled for a host to accept warning messages. These settings are
introduced when we present the safety information content and digest. Rule II is used to avoid
the maintenance of stale data about hosts that are not of interest anymore. Rule III assures that a
host regularly provides the other hosts with up-to-date data describing its view of traffic
conditions. Rule IV is used to generate notifications about dangerous events or other events of
interest that may occur in traffic. Rule V is employed because there are situations when
information forwarding is needed to provide the hosts with more complete traffic data. Rule VI is
employed because any subject host is primarily interested in successfully sending its own
Chapter 4
56
messages (i.e. BSMs and WAMs) so the other traffic participants can acquire timely knowledge of
its characteristics and situation in traffic. If a WAM and a BSM compete for transmission, we
choose to let the WAM be transmitted first. This is because the WAM describes a danger that
already exists.
The conceptual representation of the protocol functionality for reception of messages and for
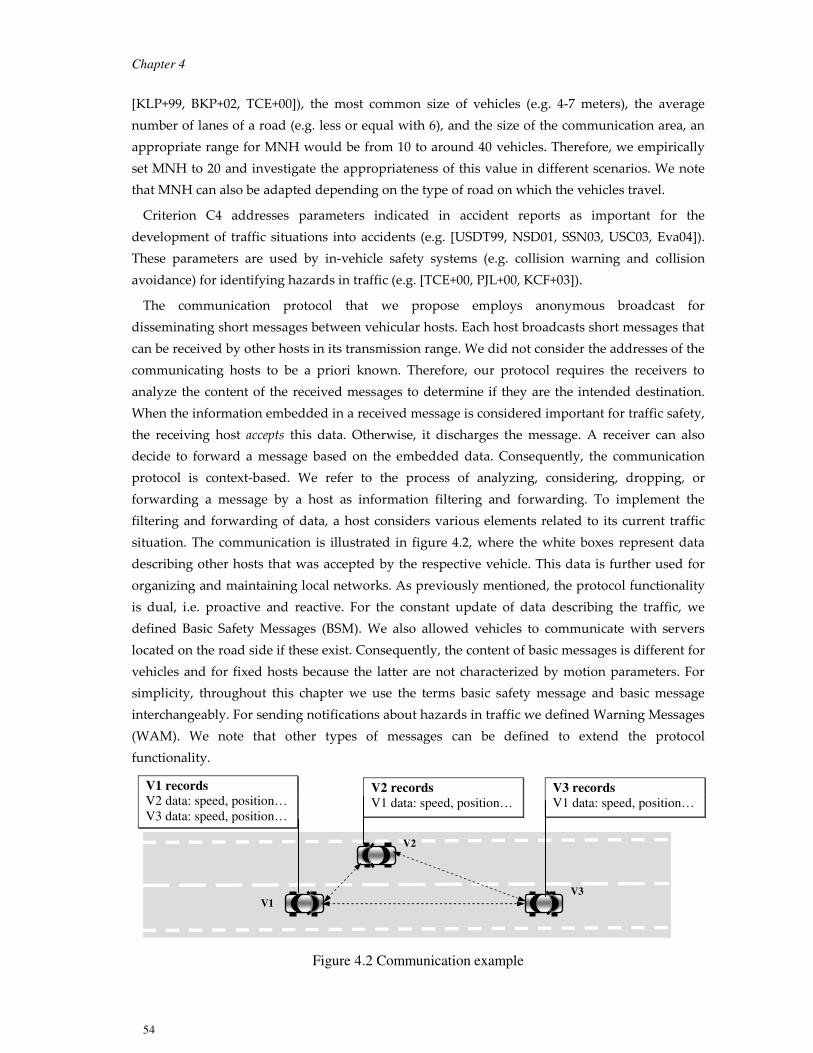
transmission of BSMs and WAMs is presented in figure 4.3 and 4.4 respectively.
Figure 4.3 Communication protocol functionality - message reception
Figure 4.4 Communication protocol functionality – message transmission
The procedures used by a host for accepting, sending, and forwarding messages make use of the
information recorded in the database associated with the communication protocol. Therefore, the
database is updated at very short intervals (i.e. 5 ms) with data describing the subject host. In
addition, the database is updated when a message is accepted, and when a message is issued by
the subject host.
All messages that need to be sent, with the exception of basic safety messages generated by the
subject host, are recorded in a dedicated queue of the communication protocol. This is because
they may not be transmitted immediately due to transmission problems such as medium access,
or they need to wait until higher priority messages are transmitted. The queue is divided into
Transmitted BSM
BSM routing
mechanism
Create and send
BSM
Tint_BSM timer
Transmitted WAM Retransmitted WAM Routed BSM
Create and send
WAM Resend
WAM?
Expired
timer?
YES
Accepted BSM Accepted WAM
YES
Received message
NO
YES
Timeout
data? Communication system timer
YES
Drop message Information filtering Data of interest?
Write data in database Delete outdated records
Communication
system database
Vehicular communication specifications
57
four sections: one for WAMs sent by the subject host, one for retransmitted WAMs, one for
routed BMSs, and one for other messages if they are defined. Each section operates following the
FIFO (first-in-first-out) model, and the transmission of messages from the queue is controlled by
their priority. As previously mentioned, WAMs and BSMs issued by the subject host, which have
the highest priority, are sent before any other messages. Then, retransmitted WAMs and routed
BSMs are transmitted. Each section of the queue has an associated timer that controls its
operations. Thus, when a section is not empty, it tries to empty itself after a short interval (i.e.
0.01 s), which is measured by the associated timer. However, the messages are transmitted only if
their priority allows this, and certainly, if the transmission medium can be used. Each section of
the queue continues to try to empty itself until no messages are left. Old messages are usually
erased after a time interval, which is dependant on the protocol implementation. We note that
other control elements (e.g. specific timers) can be associated with the queue when specific
methods are used for sending messages. For instance, we defined specific time randomizers
associated with the sections where routed BSMs and retransmitted WAMs are recorded. These
timers are used by the information forwarding techniques. For practical reasons, the sections of
the queue are limited in size. If they overflow, the oldest message from the section is removed
and the current message is inserted.
BSMs generated by the subject host are intended to be sent immediately after they have been
issued. However, this may not be possible due to problems in accessing the transmission
medium. Therefore, a generated BSM is kept in a one-dimensional transmission buffer. If a new
BSM is generated and the buffer is not empty, i.e. an older BSM was not yet transmitted, the
content of the buffer is erased and the new message is written into it.
4.3 Network operations and organization4.3 Network operations and organization4.3 Network operations and organization4.3 Network operations and organization
Network operations overview
The management of local networks is done via specific network operations that consider data
provided by the filtering mechanism, data registered in the communication system database, and
timeout information provided by the system timer. These operations are:
• Initiate a local network
• Add a host to a local network
• Remove a host from a local network
An overview of the network management is given in figure 4.5.
Figure 4.5 Network management overview
Network management
Communication system timer Communication
system database Information filtering
Network operations
Chapter 4
58
Vehicular network organization
We define and discuss here two conceptual methods for organizing the vehicular network. These
methods are focused on the individual and the associative nature of the traffic; we call them host-
oriented organization and cluster-based organization.
Host-oriented organization is based on the individual nature of a host focused on avoiding
accidents. Within this method, each host defines, constructs, and maintains its own local
network. In case of a vehicle, this network is initiated as soon as it enters the traffic. For a fixed
host, the network is initiated when this host becomes operational. Within this approach, each
host takes the role of an organizer host by analyzing the information received from other hosts
and deciding which of them should belong to its own local network. This group of hosts is
continuously updated. The removal of hosts from a local network is time-based, i.e. if the
information describing a host is not updated in a time interval, this host is removed. When
employing the host-oriented approach, the local networks corresponding to different hosts can
overlap. In addition, the hosts are responsible for sustaining the global traffic awareness by
forwarding some of the information received. An example is presented in figure 4.6. In this case,
each vehicle creates its local network according to its current interest in traffic safety. For
example, V1 and V3 are part of V2’s local network, but only V3 is part of V4’s local network.
Figure.4.6 Host-oriented organization example
Cluster-based organization is based on the associative nature of the traffic for forming distinct
groups of hosts with a similar interest in traffic safety. Thus, the hosts deciding that their traffic
safety can benefit from such an association form local networks. An example of four vehicles
traveling on a road with a divider is presented in figure 4.7. Here, V1, V2 and V3 decide to form a
local network. V4, which travels on the other side of the road, is not part of this local network
since its traffic data is of no immediate interest for the other three vehicles.
Figure.4.7 Cluster-based organization example
Local network V4 Local network V1
V1 V2
V3 V4
Local network V2 Local network V3
Local network V1, V2, V3
V1 V2 V3
V4
Vehicular communication specifications
59
Within the cluster-based organization, each host belonging to a local network has to maintain
information about all the other hosts from the local network. Therefore, each host needs to be
provided with management functions for joining, leaving, or initiating a local network. A basic
method for joining and establishing local networks is using time constrains. Thus, if a host enters
the traffic and does not receive within a time interval information of interest about a currently
formed local network, it initiates a new one. Otherwise, the host joins an existing local network.
As mentioned before, host membership to a local network is interest-dependent. Thus, a host can
choose to join another local network if the data sent by hosts belonging to it is considered more
valuable than data sent by the members of the local network in which the vehicle is currently
registered. When a member leaves a local network, the other hosts need to remove the data
associated with the departing host. This can be done using a time-based method, or issuing a
leaving announcement. The sending of a leaving announcement has several drawbacks. Due to
the frequent fragmentation of the network, such notifications may need to be sent very often.
This may lead to an overload on communication and can hinder the reception of more important
data. Also, the leaving notification may not reach some hosts if the network is fragmented.
Therefore, we consider more appropriate the basic time-based method that requires a host to
remove the records associated with other hosts if the data describing them is not updated within
a time interval. An extension of the cluster-based organization is to allow the hosts to be
members of more than one cluster. This approach can allow better analyses of complex traffic
situations but impose difficulties in managing local networks, as a host needs to have data about
hosts from different local networks. Since a host aims to keep data about all members of a local
network but the composition of the network is limited (and implicitly the number of hosts a
subject host can keep data about is also limited), additional network management functions are
needed.
The host-oriented organization considers each host to be responsible for organizing its own
local network according to its singular interest. The cluster-based organization assumes a group
of hosts is collaborating to organize a local network. These hosts aim at maintaining consistent
group membership throughout the local network. The establishment and maintenance of local
networks is more flexible within the host-oriented organization, since every host decides whether
or not to register sender hosts. Thus, operations such as joining or exiting a local network are not
necessary. We note that these procedures can be quite complex in the cluster-based approach, as
the hosts need to collaborate to establish and maintain the local network. Additionally, a strict
cluster-based organization may not always accurately represent the safety needs of vehicles in
traffic. For example, hosts situated at the borders of local networks may not benefit from data
sent by hosts that are part of adjacent local networks. This is because the hosts maintain only data
sent by members of the same local network. This situation can be improved by using multiple
memberships and forwarding of information between local networks.
In both approaches, situations can exist in which a host is not able to directly receive
information of importance for its traffic safety due to communication problems (e.g. packet
collision, shadowing). Therefore, we provided the hosts with the capability to retransmit, when
necessary, received safety data. We note that in both cases this can pose difficulties, as the hosts
Chapter 4
60
may need to identify other hosts that do not have data about one another. Within the cluster-
based approach this may be simpler to implement as a member of a cluster should have
information about all the other members. Still, when the cluster is formed the vehicles that
should be part of it may be not included if their communication partners do not try to resend
their data. To keep the hosts informed about dangerous situations in traffic, we allowed them, by
default, to accept warning messages sent even by hosts that are not part of their local network.
Warning messages can, however, also be set to be delivered only within a local network.
Considering the issues mentioned above, we decided to focus on the development of a safety
communication system using the host-oriented approach. We note that work has also been done
on the cluster-based approach, but more investigations are needed to assure proper operations.
Consequently, we see this approach as subject for future work.
In the rest of this chapter, we present details on the techniques proposed for implementing data
communication and network management with consideration given to the host-oriented network
organization.
4.4 Safety information4.4 Safety information4.4 Safety information4.4 Safety information
As previously mentioned, our protocol uses basic safety messages (BSMs) for proactive
operations and warning messages (WAMs) for reactive operations. The size of each type of
messages and the format of the message fields are implementation-dependant. BSMs include
information used by safety systems (e.g. collision warning and avoidance) to determine if a
dangerous situation has occurred or could occur in traffic in the near future. Thus, the content of
these messages was defined considering the information needed by safety systems and data
relevant to assessing the possibility that accident could happen [MH02, KCF+03, KLP+99,
TCE+00, ZKV00, Eva04]. However, since it is possible for future systems to need or use
additional data, we provided a reserved field in the message structure where such information
can be encoded.
We note that the large majority of events in traffic should be determined using the data
included in BSMs. Therefore WAMs should mainly address those situations where an explicit
notification can significantly help increase traffic safety or traffic convenience. An example of
such a situation is a major vehicle failure that makes this particular vehicle dangerous to other
traffic participants. As presented below, we included in BSMs information about vehicle status.
We also provided the possibility of including additional data about the vehicles’ components
(e.g. brake and steering wheel status). Still, in case of sudden failure of a vehicle, it is appropriate
to rapidly warn the nearby vehicles, as this helps in obtaining a more efficient response to the
situation. Another example in which WAMs are useful is an indication about a traffic jam that
can be used to reduce the impact wave on the traffic, avoid sudden braking of a vehicle, and
allow a driver to choose an alternate route to a destination. We note that the generation and
transmission of emergency notifications is closely related to the functionality of the onboard
safety system. Such a system is responsible for determining when danger occurs and when
notifications need to be sent. The safety system should also specify how a warning message
Vehicular communication specifications
61
should be send, e.g. its frequency and time validity, in order for the data provided via this
notification to be valuable for other vehicles. Therefore, in our protocol we have mostly focused
on supporting the efficient distribution of warning messages rather than providing specific
techniques for disseminating WAMs in particular situations. This is because covering the whole
range of such situations would be infeasible. We also believe that the specific processing of
warnings should be part of the functionality of the safety systems rather than part of the
communication system. Thus, we provide a general mechanism for issuing warnings, which can
be further specified for different safety applications.
Warning messages (WAM) can be generated when emergency situations occur in traffic. The
sending and forwarding of warning messages are regulated by the functionality of the safety
systems located in a vehicle. These systems are also responsible for settings the parameters in the
warning messages and indicating if the warnings should be delivered locally, i.e. within the local
network of the sender, or should be delivered in an area beyond the local network. It is of great
importance to achieve a strong correlation between the detection of hazards and the generation
of warnings. Thus, there are situations when vehicles may not need to issue notifications on their
own, but only relay WAMs received from other vehicles. This helps to avoid communication
channel overload. For example, when a vehicle is stopped in a driveway, the vehicles
approaching it significantly reduce their velocities. As a consequence, they can generate
notifications to warn upcoming vehicles. These notifications are further relayed by the receiving
vehicles. Vehicles that are at some distance from the event can experience the same speed
reduction and can issue their own WAMs. Obvious, this increases the load on the channel as the
new and the older messages (i.e. the forwarded messages) coexist in the network. However, if the
vehicles corroborate the reduction of their speed with the reception of the notification about the
stopped vehicle, they can refrain from transmitting their (own) notifications. New transmission is
unnecessary because new notifications would refer to the same event and other vehicles should
be informed about it via the initial WAM and its retransmissions. However, special attention
needs to be given to such processing and the identification of situations when explicit
notifications should not be sent so as to avoid leaving vehicles uninformed.
To generate warnings, we have identified two main approaches: singular generation and
continuous generation. The first approach specifies that a WAM is issued when the safety system
identifies an existing dangerous situation in traffic. This message is then repeated a small number
of times, (e.g. 3-5) to increase the probability of being received by other hosts. The second
approach specifies that when the safety system in the vehicle identifies a dangerous situation, an
initial WAM is issued. Copies of this message are generated until the situation is not considered
dangerous anymore, or until it is assumed that the vehicles that needed to receive the notification
were informed. In this case, the overload of the channel can be higher than in the previous
approach. If a large number of vehicles detect the dangerous situation and start to issue WAMs
continuously, the overload of the channel will be significant. Therefore, in this case we have
considered the application of rate reduction algorithms that adapt the transmission rate of
WAMs using an empirical additive or multiplicative rate adaptation. This implies that the
transmission rate is modified with an implementation-dependant factor that is added or
multiplied to a fixed rate value. A similar approach has been taken in [YLZ+04] with positive
results. We note that we did not apply the same approach as for BSMs due to the differences in
generation and transmission of WAMs and BSMs. Thus, warning messages can be delivered in
Chapter 4
66
an area larger than the extent of a local network, and they are usually accepted and forwarded by
a host. The dynamic of propagating these messages and their rate of multiplication needs to
provide the hosts in an extended area with information in a very short time. Vehicles facing
emergency situations tend to travel with similar velocities, e.g. high and then low velocities in
the case of an accident on a highway. Even when the vehicle travels at a low speed, a warning
message still needs to be delivered as fast as possible as it indicates a situation that can constitute
an immediate danger. Therefore, a rate adaptation algorithm using the velocities of the vehicles
cannot be considered appropriate.
We note that the second approach can be considered a special case of the first approach in
certain situations. For instance, even if a vehicle needs to issue warnings about the same static
event as the above-mentioned vehicle stopped in the driveway, these WAMs can be considered
different as they have a different moment of transmission. In this work we have mainly focused
on the transmission of WAMs using the singular approach, especially when analyzing the
communication system efficiency in specific accident scenarios. For the continuous approach, we
have investigated the dissemination of WAMs at a constant rate when particular vehicles detect
hazards in traffic.
As previously mentioned, a host usually accepts a received warning message. However, the
protocol can be configured so that the receivers perform filtering of WAMs. To allow this, two
options are included within warning messages. The first option addresses the acceptance of
notifications issued by hosts from the same local network. It is possible to issue warnings that
should be received only if the sender is part of the receiver’s local network. To implement this,
we provided a field default acceptance in WAMs, which is by default set to true but can be
invalidated. True means that the WAM can be accepted by any host. False means that the WAM
can be accepted only by hosts from the same local network. The second option to allow filtering
rates the degree of urgency represented by the dangerous situation that required the WAM to be
sent. Thus, warning messages contain an indication of the criticality of the event. We used this
term to indicate how dangerous a certain traffic situation is at a moment in time. Two parameters
are used to describe criticality of a dangerous situation: the criticality type and the criticality level.
The criticality type provides a high-level description of the situation. We defined two types of
criticality: imminent, meaning that a dangerous situation will immediately occur, and existing,
meaning that a dangerous situation already happened. The criticality level is a parameter that
provides the possibility of setting a numeric value (e.g. 1–5) to indicate the level of emergency
associated with a dangerous situation. The criticality level and type can then be used when
deciding if a warning message should be accepted by a host.
The WAM structure is presented in table 4.3. These messages contain the sender identity and
the moment when the message was sent. These two fields uniquely identify the transmitted
message. The messages also contain the position of the dangerous situation or event, and a short
description of it. We note that the position of the dangerous situation or event is considered
similar to the position of the host that issued the warning if this host is a vehicle. If the sender is a
fixed host, the position of the dangerous event can differ from the position of the sender. For
instance, if a broken vehicle exists on the road and the fixed host sends notifications about this
Vehicular communication specifications
67
vehicle, the position of the vehicle is included in the message. We defined several descriptors for
dangerous situations: existing accident, obstacle on the road, traffic jam, high possibility of collision,
highly slippery road, vehicle breakdown, and undefined danger. Other information included in the
WAM messages is the criticality type and level, the retransmission counter, and the default
acceptance indication. As with BSM, a reserved field, i.e. OED, is allocated for future use.
Table 4.3 Warning Message
4.4.3 Other messages4.4.3 Other messages4.4.3 Other messages4.4.3 Other messages
Other types of messages can be defined and used within the vehicular network. To illustrate, we
offer a proposal for infotainment messages. These messages can contain data about services and
resources offered by hosts, and other information of general interest. We defined two categories
of infotainment messages, the resources/services-oriented messages and the general interest messages.
These messages have lower priority that BSMs and WAMs.
The resources/services-oriented messages also contain two types of messages, the resources/services
discovery messages and the resources/services advertising messages. The discovery messages are request
messages sent by hosts that would like to use certain services and resources offered by other
hosts. These messages contain the sender identity and the list of requested services and
resources. They also contain additional identification and authentication data about the requester
host. The advertising messages are inviting messages that indicate resources and services available
on different hosts. These messages contain the sender identity and a list of offered services and
resources with a short description.
The general interest messages contain data describing points of interest related to traffic (e.g.
nearest medical center). These messages contain the sender identity, the information identity,
and the information content.
We note that this is only an example of possible extensions of the protocol, and the work
presented in this thesis focuses exclusively on the safety operation of communication.
4.5 Information forwarding4.5 Information forwarding4.5 Information forwarding4.5 Information forwarding
We provide below details on the techniques defined for forwarding information within the
vehicular network. We alternately refer to these techniques as routing or retransmission.
TID - Type identifier
SID = Sender host identity
SitPS = Dangerous situation position
SndTime= Sending moment of the warning message
RtrCnt = Retransmission counter
DSD= Dangerous situation description
CrT = Criticality type
CrL = Criticality level
DA = Default acceptance
OED – other emergency data (field
reserved)
TID SID SitPS SndTime RtrCnt DSD CrT CrL DA OED
Chapter 4
68
4.5.1 Forwarding of basic safety messages4.5.1 Forwarding of basic safety messages4.5.1 Forwarding of basic safety messages4.5.1 Forwarding of basic safety messages
The vehicular network is organized in local networks where hosts exchange data. The hosts
employ anonymous broadcast to disseminate short messages, and only the messages containing
relevant data are accepted. Due to the broadcast characteristic of the communication protocol
and the dynamic self-management of the network, the need for routing is reduced to those cases
in which the hosts cannot directly receive data of interest from each other. Still, such situations
can occur if the hosts are too far one from another or due to transmission problems that affect the
radio wave propagation (e.g. shadowing, multi-path propagation, interference and collisions). In
figure 4.8 an example is offered, in which the communication between V1 and V3 is hindered by
truck T. We call the routing between hosts belonging to the same local network intra-network
routing.
Figure 4.8 Example of situation when routing is needed
Besides routing within a local network, there are situations when forwarding of information can
be performed between local networks. We call this type of routing inter-networks routing. This
routing should not be usually required due to the proposed network organization. Still, the inter-
networks routing may be needed to implement services that require the delivery of information
beyond the boundaries of a local network. For example, long-distance accident notifications may
require inter-networks routing. However, the communication characteristics and possible
complexity of implementation limit the applicability of such routing. Since we employ short-
range communication, the lack of coverage between local networks may also be a considerable
problem. One solution would be to deploy a sufficient number of fixed hosts on the roadside and
use them to deliver messages over larger areas by relaying information between neighboring
local networks created by these fixed hosts. In our proposal we have also considered a special
form of inter-networks routing by allowing hosts from a local network to accept warning
messages sent by hosts from other local networks when these messages indicate major dangers in
traffic.
In the following, we focus on intra-network routing and present our proposals with
consideration given to the development of the communication network using the host-oriented
approach.
Intra-network routing
In our proposed protocol, we used a scoped broadcast for delivering messages. This is still a
broadcast protocol; therefore a simple solution for routing can be classical flooding (e.g. [WC02]).
This specifies that each host re-broadcasts each message received from other hosts if the message
V1 V3 T
V2
Vehicular communication specifications
69
has not been previously received. However, this solution is highly inefficient due to problems
such as redundancy, contention, collisions, and bandwidth congestion (e.g. [TNC+02]).
Since we propose a context-oriented broadcast where the receivers must determine if they are
the intended destination of messages, no identities of destinations are present in messages.
Therefore, for forwarding information we employ the same strategy, namely to require the
receivers to determine if a message should be retransmitted. Thus, a host accepts only messages
that are of interest and these messages can also be routed, if necessary.
Given the specifics of the vehicular environment, we propose a routing technique using a
mediation mechanism based on the characteristics of the hosts that can directly communicate
with each other. Each host indicates within its BSMs the identities of the other hosts it knows
about, and which are part of the same local network. These indications are recorded in the
database associated with the communication system, and are used by the mediation mechanism
to decide whether a message should be retransmitted. When a BSM is accepted by a subject host,
the mediation mechanism will also detect if the message needs to be routed. This decision is
made by determining if the sender of the message could be of interest to some members of the
subject host’s local network that are not aware of the original sender at the moment the message
was accepted by the subject host. We call these members non-informed hosts. The subject host
identifies the non-informed hosts by analyzing its local network database. An example of intra-
network routing is presented in figure 4.9 where vehicles V1, V2, and V3 are equipped with
vehicular communication devices, whereas the truck T is not. The truck also hinders the direct
communication between V1 and V3. In this example, V2 detects that V1 and V3 can be interested
in each other’s data and retransmits this information.
Figure 4.9 Inter-network routing example for host-oriented organization
To determine if the sender may be of interest for the non-informed hosts, different strategies
can be applied. A basic approach would be to analyze the relative distance between the sender
and the hosts recorded in the subject host database. Analyses of traffic situations revealed that
there may be a high probability that two vehicles (i.e. the sender and a host in the database) that
are of interest for the subject host and are located close enough to each other will have interest in
each others’ data. When a BSM is accepted, the mediation mechanism then needs to check if there
are hosts that do not have data about the sender and are located within a certain distance from
the sender. We used as the basis for the distance threshold the size of local networks (i.e. the
Service Area Threshold) since a host will not consider data from hosts situated outside the
communication service area. The rule used for implementing the mediation mechanism in this
V1 V3 T
V2
Local network V2
Chapter 4
70
case is presented below. Let us consider that the subject host maintains data about senders from
the set S, and receive a basic safety message from A. If the subject host accepts this message, it
will resend it if the following rule holds:
Routing rule: ∃ B∈S, B≠A, and Dist(A,B) ≤ SAT, where Dist(A,B) is the Euclidean distance between A
and B.
However, there may be situations when the above technique leads to extensive forwarding of
information. Therefore, we also propose a more restrictive routing technique, then compare the
performance of both techniques within the evaluation. An extended routing scheme is to apply
an algorithm similar to the one used to determine if a sender is of interest for a subject host. Such
an algorithm uses the distance comparison as above, but extends the analysis by investigating
other parameters such as the relative heading or the possibility that two vehicles will meet in an
intersection. The complete algorithm for determining that a sender is of interest is presented in
the section Information filtering and network management. The algorithm for routing is a slightly
simplified version of the filtering technique as it checks whether two hosts may have an interest
in each other, but did not register or deregister hosts from the local network database. The
algorithm runs until a host that has interest in this sender is found, or until all the hosts in the
database are analyzed. Let us again assume that a subject host maintains data about a number of
senders from the set S and receives a basic safety message from a sender A. If the subject host
accepts this message, it will retransmit it if the following rule holds:
Routing rule: ∃ B∈S, B≠A, and B has interest in A data.
A problem related to routing of BSMs is that the same message can be forwarded at the same
moment by a number of hosts close to each other. This will lead to a peak-load on the channel
and can consequently reduce the communication quality. It can thus lead to information loss,
especially when the medium access scheme does not provide a method to efficiently reduce the
effects of transmission problems such as the hidden terminal. To alleviate the consequences of
such problems, we randomize the moment of forwarding BSMs. Thus, before forwarding a
message, a host waits a random amount of time. This interval is selected between 0 and the
current transmission rate of BSMs.
Forwarding of information increases the load on the communication channel. For reducing
such a load, previous work proposed algorithms for delivering messages between vehicles that
require a vehicle to wait an interval to determine if its transmission area has been mainly covered
by transmissions from other hosts [SFL+00]. If this is the case, the respective host refrains from
transmission. However, data provided by BSMs needs to be available at hosts as soon as possible,
and waiting only adds to the delay in providing this information. In addition, due to the highly
dynamic traffic environment, refraining from transmission based on analysis of received
messages cannot be applied in all traffic situations. As also indicated in [Brie00], there are
situations where the hosts that need certain data will not be able to receive it because the hosts
responsible for retransmitting it did not provided the respective data, assuming that other hosts
had already provided it. For example, when shadowing hinders the exchange of data, a host may
not be able to correctly estimate that the transmissions from other hosts were successful by
Vehicular communication specifications
71
investigating whether its transmission area has been covered. Therefore, for forwarding
information we have opted for a combination between a heuristic flooding protocol and a
topology-based flooding protocol (as defined in [YGK03]). This may introduce some overload
but can assure the delivering of data of interest to the hosts in need.
4.5.2 Forwarding of warning messages4.5.2 Forwarding of warning messages4.5.2 Forwarding of warning messages4.5.2 Forwarding of warning messages
WAMs contain important indications about dangerous situations in traffic and therefore are
subject to retransmission. Delivering a warning message to as many hosts as possible is the
desideratum and we take advantage of the redundancy provided by a flooding-like technique.
Thus, the retransmission of WAMs is controlled by counters. Each WAM includes a
retransmission counter that indicates how many times it was retransmitted. When a host
retransmits a warning message, the retransmission counter is decreased and the new value is
included in the transmitted message. A host that received and considered a warning message,
retransmits the message if this was not previously retransmitted and if the retransmission
counter is higher than zero. The retransmission counter is set to a higher value if the original
issuer of the WAM decides that it is important to disseminate the message in a larger
geographical area, i.e. the default acceptance field is validated. We defined the retransmission
counter based on the value of the maximum number of hosts (i.e. MNH) that can coexist in a
local network at a moment in time. Thus, the retransmission counter is β*MNH, and we have
empirically used β=1 for large area warnings and β=0.5 for warnings within a local network.
Similarly to the routing of BSMs, the same warning message can be received and then resent
simultaneously by a number of hosts. This can create a peak-load on the channel and can lead to
delays and information loss. Therefore, each host delays the transmission of a retransmitted
WAM. One possibility for delaying the retransmission of warning messages is to apply the same
strategy used when forwarding BSMs, i.e. using a retransmission delay randomly chosen
between 0 and a maximum value, e.g. 0.1 s. Another possibility is to adapt the retransmission
delay with regard to the distance to sender. The reason behind this technique is to allow the
distant hosts to relay messages faster, which can lead to a more rapid propagation of the
information in an extended area. In this case, the retransmission delay is inversely proportional
to the distance to the sender. For this technique, we defined the retransmission delay as:
<
<
=
otherwiseTdefer
SATKD
otherwiseWAMT
WAMTWAMTretransD
SATKTdefer
WAMTretrans
,
*,
,max_
max__,**
_
In the equation above D is the distance to the sender, SAT is the communication service area,
Tmax_WAM is the maximum value for the defer time, and Tdefer is a regular value for deferring
the transmission of a WAM.
4.6 Information filtering and network management 4.6 Information filtering and network management 4.6 Information filtering and network management 4.6 Information filtering and network management
Information filtering addresses the consideration and rejection of messages. Network
management addresses the initiation of a local network and the addition and removal of hosts
Chapter 4
72
from a local network. In this section we elaborate on the techniques used by a host for deciding
whether to accept a BSM. When such a message is accepted, certain network operations can be
performed. Additionally, accepted BSM can be forwarded.
We provide below a basic set of rules used for implementing information filtering and the
operations for network management. We note that these rules are a proof of concept, being an
example that we used in our work. This set can be further extended or modified based on
recommendations provided by domain experts (i.e. traffic safety experts). We also note that these
rules are specific to the host-oriented organization, which was considered in this work for the
development of the communication system. The rules use the parameters introduced in the
previous section and evaluate conditions related to the sending and receiving host. When these
conditions are determined to be true, the sender is considered of interest and the currently
received BSM is accepted. The main factors that we considered for defining the rules were:
A. The vehicles in close proximity usually have important data. Their number is limited.
B. Vehicles in front of, or behind, traveling on the same road and in the same direction have data
of interest.
C. Vehicles coming from an opposite direction can constitute a danger on undivided roads.
D. Vehicles can collide if they arrive at an intersection at the same time.
E. Fixed hosts located on the roadside provide services to vehicles.
Aspect A is derived from works in traffic safety, e.g. [KLP+99, ZKV00, MH02]. B is stipulated
within proposals for collision warning systems, e.g. [ZKV00, KCF+03]. C is derived from the
development of head-on collisions, e.g. [NSS+03, USC05] and D from the development of
intersection collisions, e.g. [PJL+00, MH02]. E is derived from our design of the vehicular
network.
Rules for information filtering
We present below the rules used by a receiver to determine if a sender is of interest and thus
accept a received basic safety message. The rules below are presented using natural language
and the logical connectives AND and OR. We use parentheses to delimit multiple clauses.
Case 1. The receiver and the sender are vehicle hosts
Inclusion rule:
(I1) The Euclidean distance between sender and receiver is less than SAT.
Regular rules:
Vehicular communication specifications
75
(R11) The sender and the receiver are traveling on the same road AND have similar heading
AND [the receiver maintains data about less than MNH hosts OR the sender is closer to the
receiver in comparison with the farthest host previously considered].
(R12) The sender and the receiver are on the same undivided road AND have different headings
AND the sender is ahead of the receiver AND [the road status or/and the sender status indicate
the possibility for a danger to occur] AND [the receiver maintains data about less than MNH
hosts OR the sender is closer to the receiver in comparison with the farthest host previously
considered].
(R13) The sender and the receiver are traveling on different roads AND a route contention is
detected AND [the receiver maintains data about less than MNH hosts OR the sender is closer to
the receiver in comparison with the farthest host previously considered].
Case 2. The receiver is a vehicle host and the sender is a fixed host
Inclusion rule:
(I2) The Euclidean distance between sender and receiver is less than SAT.
Regular rule:
(R21) The sender offers a service that is of interest for the receiver AND [the receiver maintains
data about less than MNH hosts OR the sender is closer to the receiver in comparison with the
farthest host previously considered].
Case 3. The receiver is a fixed host and the sender is a vehicle host
Inclusion rule:
(I3) The Euclidean distance between sender and receiver is less than SAT.
Regular rule:
(R31) The receiver maintains data about less than MNH hosts OR the sender is closer to the
receiver in comparison with the farthest host previously considered.
Case 4. The receiver is a fixed host and the sender is a fixed host
Inclusion rule:
(I4) The Euclidean distance between sender and receiver is less than SAT.
Regular rule:
(R41) The receiver maintains data about less than MNH vehicle hosts AND both the sender and
the receiver provide specific additional services.
Rules I1, I2, I3 and I4 are due to aspect A and the space limitation of the communication service
area. We note that vehicles situated at the border of this area may frequently enter and leave the
area. This can create an undesired instability and extensive processing of the information
received by repeated removal and addition of senders to receiver’s local network. Therefore,
when evaluating the relative distance between vehicles we have introduced a hystrerezis around
the area threshold. Rule R11 is due to aspects A and B, and the limitation of the composition of a
local network. Rule R12 is due to aspects A and C and the limitation of the composition of a local
network. Rule R13 is due to aspects A and D and the limitation of the composition of a local
Chapter 4
76
network. Rule R21 and R31 are due to aspects A and E and the fact that the local network is
limited in composition. Rule 41 is due to aspect E, the limitation in composition of the local
network, and the specific functionality of fixed hosts defined within the communication protocol.
The rules presented above have a high degree of generality and can be further specified. For
instance, rule R11 can be completed with clauses that check if the sender is no more than several
vehicles (e.g. 2) behind, or no more than several vehicles (e.g. 4) ahead of, the receiver. The set of
rules used for filtering information can be also extended by adding new rules. For example, rule
R13 can be completed by a condition that checks the value of a time-to-collision parameter for the
possible intersection collision. Only when this parameter is below a certain threshold, the rule
will evaluate true. In our work, we have also used such specializations of the rules. For instance,
rules R12 and R41 were replaced by:
(R12s) The sender and the receiver are on the same undivided road AND have different headings
AND the sender is ahead of the receiver AND [the road is slippery OR the sender status is poor
OR the sender speed is excessive] AND [the receiver maintains data about less than MNH hosts
OR the sender is closer to the receiver in comparison with the farthest host previously
considered].
(R41s) The receiver maintains data about less than MNH vehicle hosts AND the sender and the
receiver provide the WSR service.
Processing of rules
When both the inclusion rule and one of the regular rules hold at the same time, the sending host is
considered of interest and the receiving host accepts the newly received basic safety message. As
previously presented, the same rules can be applied for forwarding of basic safety messages.
Rules for network operations
The network management is provided by network operations that are performed in two cases as
follows:
• When a basic safety message was accepted by a subject host, which indicates that the sender is
of interest.
• When the timer associated with the communication protocol (i.e. T_record) indicates that old
records exist in the database, which indicates that the information about these hosts is obsolete.
We also define a least important host, which is used in the rules. Various definitions can be given
but in this work we consider this host to be the most distant host from the receiver. However, if a
less important host was identified as an existing danger via received WAMs, it would not be
considered less important anymore. The second less important host then becomes the least
important in this case, and so on. For the rules presented below, we use the same syntax as for
the information filtering rules. The generic rules implementing network operations are:
Initiation of a local network: IF a time interval T_Init has passed since a host is active (i.e. since a
vehicle host entered the traffic or since a fixed host was made operational) THEN the host
initiates its own local network.
Vehicular communication specifications
77
Addition of a host to a local network: IF a sender is considered of interest AND it is not registered
within the receiving host database THEN register the sender into the receiver’s local network.
Removal of a host from a local network: [IF a sender is considered of interest AND the receiver
database contains MNH hosts AND the sender is closer to the receiver than the farthest host
previously considered THEN remove the least important host from the receiver local network]
OR [IF the update time T_record of a record describing a sending host has passed THEN remove
the host from the receiver local network].
4.7 An integrated vehicular communication platform 4.7 An integrated vehicular communication platform 4.7 An integrated vehicular communication platform 4.7 An integrated vehicular communication platform
A platform for implementing the proposed networking and communication techniques and for
integrating the resulting communication system within a vehicle is proposed in this section.
Until recently, there has been little focus on developing procedures for organizing vehicular
networks. However, techniques for managing vehicles are essential in order to obtain scalable
and reliable communication, and we envision that the field will develop significantly in the
future. In this area work has mostly been done on group management for vehicles. Thus, in
[BH00] a group management service for sustaining communication in case of traffic jam
notifications is proposed. This service performs and maintains the aggregation of vehicles into
neighboring groups based on information included in small messages that are regularly sent by
vehicles (i.e. Hello messages). These messages contain the identity of a vehicle and its position,
and the vehicle grouping is used to control the dissemination of a notification about a traffic jam
through the network. Reference [MKC+01] introduces a general framework for proximity group
communication, where mobile communicating hosts in an area are grouped according to their
position and functional aspects. Possible traffic applications that are mentioned are grouping
vehicles that approach a traffic light, and grouping vehicles that should give right of way when
an ambulance is approaching. However, the work presents only the general idea and does not
provide details on how to implement these services. The work in [CC05] proposes an
organization of the vehicular networks into groups using two methods: stationary and dynamic.
The stationary approach considers the roads to be previously divided in fixed areas. When
vehicles enter these areas, they belong to the group associated with the area. The dynamic
approach proposes vehicle grouping based on radio coverage. Vehicles that are in each other’s
transmission range form a group. Improvements to this simple approach are grouping close
vehicles into cells and grouping vehicles in a vector on the basis of distance to sender.
Our work can be also categorized as belonging to the group membership area. The vehicles are
grouped into local networks according to their current interest in traffic safety. The information
needed for organizing the network is provided regularly, and we make use of position data and
other contextual information when defining the network organization and management. The
vehicles are then able to dynamically organize the network, which allows support for various
traffic safety applications. Using fixed clusters is an appealing alternative to dynamic
networking. However, this would require some authority to do extensive work on all roads, as
such clusters would need to be defined everywhere there is traffic, and their definition would
need to take into consideration a variety of aspects such as the road type, the driving conditions
and the communication properties (e.g. range). These clusters would need to be updated at
certain intervals, as the traffic conditions can change over time (e.g. weather – dense fog in
certain periods). Additionally, the vehicles would need to be aware of all existing clusters as they
might travel in large areas (e.g. different countries). Even if fixed clusters are defined, there is no
guarantee that the vehicles in the group associated with a cluster will be able to communicate
with each other. Therefore, even in this case some technique for information forwarding must be
developed. Considering these issues, we employed only a pseudo-static formation of clusters by
the fixed hosts. As also mentioned by the authors, our work can be considered complementary to
the work in [CC05] for the dynamic approach, as our local networks can be built on top of the
Chapter 6
150
dynamically formed groups in [CC05]. We note that the networking technique that we propose
did not need such previous grouping of vehicles, but it can make use of it if it exists.
6.3 MAC schemes for vehicular communication 6.3 MAC schemes for vehicular communication 6.3 MAC schemes for vehicular communication 6.3 MAC schemes for vehicular communication
Efficient MAC schemes are essential for developing high-performance communication for
vehicles. This area has recently received a great deal of attention.
Investigations of classic MAC schemes for vehicular use have been conducted, and extensions
to them have been proposed. For example, [WH98b] proposed a CDMA scheme where the
channel access is controlled using the relative location of vehicles, which is supplied by magnetic
sensors installed on roads. In a number of other works, e.g. [Ver97, TAF00, KTT+02, FH02b] or
[SON+02], assessments of the applicability of schemes such as p-persistent and non-persistent
CSMA, ALOHA and R-ALOHA to inter-vehicle communication have been made.
In [YRM05] two extensions to CSMA were proposed for controlling the dissemination of
warning messages. The first scheme uses backoff time spacing for differentiating messages with
different priorities (e.g. messages from closer vehicles have high priority, and messages from
distant vehicles have low priority). The second scheme implements a polling mechanism, where
the receiving vehicle polls only vehicles that are waiting to send messages indicated dangerous
situations. These vehicles are polled only if they are located within a certain distance from the
receiver. The polling operation is done by sending an out-of-band tone on a dedicated channel.
Dedicated MAC schemes for vehicular communication have also been developed. Schemes
using slot reservation mechanisms for UTRA-TDD were proposed in the Fleetnet project
[LHS+00] and the CarTalk2000 project [BCC+03]. Position-based schemes, where medium access
is coordinated using the location of the vehicles, were also investigated (e.g. [NH00+, BV01,
KMR+03]). These schemes require the division of the geographic area into cells that have
associated dedicated communication channels. The vehicles that enter a cell can then
communicate only on the associated channel(s). We note that the idea is similar to the network
organization using fixed clusters and therefore suffers from similar drawbacks.
The IEEE 802.11a MAC scheme is currently the de facto scheme for the Direct Short Range
Communication (DSRC) standard [BTD06], which provides support for road-to-vehicle
communication and for one-hop vehicle-to-vehicle communication. However, this scheme seems
to provide moderate quality for implementing certain safety applications such as collision
avoidance (e.g. [YEH+04]), and it is expected that improved schemes will be produced [CC05]. A
comprehensive analysis of the drawbacks of IEEE 802.11-based schemes and potential
improvements was given in [ZR03].
In our work we used one of the basic schemes (i.e. non-persistent CSMA) proposed for inter-
vehicle communication when performing the evaluation. However, the results clearly indicated
that this scheme could not assure high-quality communication, and the use of more efficient
schemes needs to be further investigated.
Related work
151
6.4 Direct Short Range Communica6.4 Direct Short Range Communica6.4 Direct Short Range Communica6.4 Direct Short Range Communication (DSRC) tion (DSRC) tion (DSRC) tion (DSRC)
Dedicated Short Range Communication (DSRC) is a suite of specifications initially proposed for
vehicle-to-road communication, and recently extended for vehicle-to-vehicle communication
[AST03]. DSRC specifies the MAC layer, the link layer and the radio layer for vehicular
communication systems. The basic standard specifies three types of channels: for vehicle-to-
vehicle communication, for road-to-vehicle services, and for (communication) control. The North
American DSRC program proposed a large variety of applications that can be supported by
DSRC [ZR03]. These are both safety applications and non-safety applications such as traveler
information and rich media content delivery.
However, DSRC does not address multihop communication or network management [CC05].
Our system is complementary to DSRC and can be implemented using the specified DSRC
components. The context-based protocol that we have proposed provides multihop
communication and may be used for augmenting DSRC functionality when implementing safety
applications. Furthermore, the organization of vehicles into local networks can help to improve
communication performance (e.g. by controlling dissemination area), and can ease operations
such as unicast and multicast as the local network’s members have data about each other. The
proposed communication system also integrates road-to-vehicle communication and may be
extended to accommodate services proposed to make use of DSRC.
152
7. Concluding remarks
This chapter presents final remarks on the work in this thesis. Future research directions are also
discussed.
7.1 Final remarks7.1 Final remarks7.1 Final remarks7.1 Final remarks
High casualty rates and extensive property damage make traffic safety a critical problem for
society. The importance of this problem has sparked research into developing systems that could
help reduce the severity of crashes, or even completely avoid collisions between vehicles.
However, although important improvements in traffic safety have recently been achieved, the
number of collisions with severe consequences is still unacceptably high. Therefore, safety
systems that can provide better service to the driver must be developed. Safety vehicular
communication is a promising technology for supporting active safety systems. This technology
allows the collection of data that cannot be acquired using other technologies proposed for safety
systems. It extends the perception of the vehicles, and allows them to correctly identify dangers
in complex traffic situations.
Designing the support system for active safety systems is challenging due to multiple factors
that must be considered. In this work we aimed at providing a generic method that helps the
designer focus on important design aspects, leading to a detailed system design. The risk of
overlooking certain key factors, such as accident development, is that the resulting solution may
not be applicable in various traffic situations. We refer to [YLZ+04] for a system that can provide
an efficient dissemination of emergency notifications in case of rear-end accidents. However, the
system cannot be successfully applied to intersection collisions. The design method that we
propose is certainly general and can be further specified. However, the current results of
analyses, as well as the analysis tools (e.g. ECAM) can be useful in developing other support
systems and extending the currently proposed system. They can also be useful in investigating
other aspects related to traffic. For instance, we employed ECAM for analyzing the possibility of
avoiding intersection accidents that involve drivers of a specific type, namely elderly drivers
[SCA+04, SCA06]. In this thesis we illustrate a specification of the general design method with
analyses of the communication as the enabling technology for active safety systems. We define
properties of the traffic environment in order to derive requirements for communication systems
that provide support to exchange of safety data among vehicles. We also study the operation
mode of active safety systems and analyze accident scenarios in order to identify specific
requirements that apply to safety communication. When analyzing accident scenarios, we also
investigate the limitations of safety systems based on communication. For instance, inter-vehicle
communication may be less effective in lane departure accidents. We note that the same
limitations apply for radar, but not for vision as the enabling technologies. Therefore, the ideal
safety system would augment communication-based mechanisms with other technologies.
Active safety systems that integrate several enabling technologies can be highly effective.
Chapter 7
153
Several communication approaches can be applied for disseminating data among vehicles in
traffic. We analyzed various approaches in order to estimate the level of support each could
provide to safety communication. We also conducted a deeper investigation of the design
components of the communication system, which resulted in specific features that we integrate
in our proposal.
Besides fulfilling strict requirements of safety applications such as collision warning, the
communication system needs to fulfill requirements imposed by the particular properties of the
vehicular environment. In this work, we advocate the use of these unique properties for building
systems that are adaptable to the traffic situation. Two techniques were used to achieve this
behavior in the communication system. First, we propose a method of organizing the vehicular
network by the use of contextual information. Using this method, the vehicles form and maintain
virtual clusters according to their current interest in traffic. This allows the vehicles to be able to
constantly organize a network that reflects their needs. Second, we develop a context-based
protocol for disseminating safety information to vehicles. An anonymous scoped broadcast
protocol is used for delivering specific messages, since the destinations of these messages may
not be known to the senders. The receivers then need to identify the messages that contain data
of interest. To achieve this, they apply a context-based information filter. We propose here a
filtering mechanism based on rules derived from accident situations and guidelines for active
safety systems. A set of rules was used as a proof of concept within a prototype implementation
of the communication system.
Our protocol mainly takes a proactive approach, where vehicles are regularly provided with
safety information. We argue for the effectiveness of this approach in improving traffic safety,
since in this case the safety system is able to identify possible dangers well in advance and
efficiently act towards avoiding them. Two basic methods can be taken for data delivery in
proactive protocols, the fixed rate approach and the adaptive rate approach. We investigate the
performance provided by each, and provide an example of the adaptive rate approach with an
adaptation mechanism based on the velocity of the vehicles. We also investigate different
methods for forwarding information. We subsequently propose a basic routing method based on
the distance to the sender, and then extend it to improve the communication performance.
Similarly to the information filtering, the routing techniques use context information.
Further on, we enhance the communication protocol with a reactive operation mode because
there are situations when traffic safety can benefit from the issuance of specific notifications to
warn vehicles in traffic. Also in this case, we investigate different methods for generating and
forwarding warnings.
For implementing the communication protocol and integrating it within a vehicle, we propose
a vehicular communication platform.
The traffic environment is complex and contains situations that can put very different
demands on communication. Therefore, we investigate the performance of the proposed
communication system under various conditions. We also investigate the system applicability in
helping to avoid specific accidents. A GloMoSim-based simulation system was used for
Concluding remarks
154
performing the simulations. Realistic traffic traces were generated by traffic simulators that we
have developed. We evaluate system performance using delay, packet collisions, send errors, and
dissemination success for warning messages. We also investigate the efficiency of the
information filtering and specific settings of the communication system. We then assess if the
settings that are appropriate for obtaining high-quality communication are realistic by
comparing them against safety applications’ demands and the capabilities of current
communication systems. The results indicate the adaptive approach employed for the proactive
operation mode as most suitable for delivering safety data. They also indicate that forwarding
and filtering of information are essential in obtaining good performance. For instance, the use of
a basic routing protocol resulted in a system with marginal performance for the maximum
latency, which may be difficult to use for informing particular vehicles in time. When the routing
mechanism was extended with a technique similar to message filtering, the system performance
was dramatically improved. For the retransmission of warning messages, the experiments
showed potential for an approach based on the distance to sender, but also revealed that such
techniques might not provide the needed level of reliability. Thus, when we applied a deferring
technique based on distance to sender, it was possible to obtain low delays for delivering
warning messages under specific settings, but some of the vehicles in need did not receive these
notifications. This indicated that improvements are needed for such techniques to function
satisfactorily. A simpler approach using a flooding-oriented technique for retransmitting
warning messages led to better results. These results also indicated that vehicular
communication based on contextual information needs to be carefully designed in order to
represent the traffic characteristics. The filtering of information was significant in all cases, which
indicated that important improvements in information management, i.e. elimination of useless
and misleading data, can be obtained when using contextual information for management of the
communication. The communication performance degrades with the network load, which
indicates the need for more efficient MAC schemes and the importance of further investigation of
transmission and forwarding techniques. We recall that the MAC scheme that we have employed
was previously proposed for vehicular communication. However, the evaluation results
indicated this MAC scheme to be able to provide only moderate quality.
To summarize, safety communication is an essential part of future active safety systems. In
this thesis we propose a method for designing communication and networking techniques for
use in safety vehicular communication. These techniques make use of contextual information for
controlling the communication between vehicles in traffic, which improves the management of
information and results in good communication performance. Thus, timely and reliable
provision of safety data to vehicles can be realized using the proposed communication system.
Chapter 7
155
7.2 Future7.2 Future7.2 Future7.2 Future work work work work
Many aspects of the work presented in this thesis can be extended. Several directions are
presented in the following.
Communication and networking
Medium Access Control
Investigation of more efficient MAC schemes for data exchange in the vehicular environment is
important. Research can also go deeper into this area with the goal of proposing new access
schemes. This is because even the scheme proposed for DSRC is considered only as a provisory
solution [CC05], as it cannot provide the needed level of quality. The performance study on
DSRC in reference [YEY+04] showed that this scheme may achieve low latency for one-hop
communication, but cannot currently fulfill reliability requirements, as a large number of
neighboring vehicles (i.e. more than 40%) may remained uninformed due to information loss.
Information Dissemination
Improved versions of the techniques for transmitting and forwarding data are also important
subjects for further investigation. We have shown that adaptive transmission of BSMs and
efficient routing can have a significant impact on the communication performance. The
adaptation method proposed here can be considered as generic, and further specializations can
be developed. Moreover, schemes that adapt the transmission rate with regard to the road the
vehicles travel on, or with regard to more specific traffic situations should also be investigated.
For instance, for vehicles traveling on divided highways, a combination of the driving
orientation, the number of vehicles in a local network, and the relative distance between vehicles
can be used. Thus, if a vehicle traveling in one direction has only distant neighbors, i.e. neighbors
situated at the border of the communication service area, the transmission rate can be reduced.
Forwarding of information in case of low penetration rate of the system also needs to be
investigated. This is to assess whether or not the protocol can work efficiently in this case and to
identify eventual extensions.
Information Filtering
Information filtering remains an open issue. In this work we have given examples of the
advantages of using contextual information for controlling the communication and we defined
and used a set of rules for filtering received data. However, this is a proof-of-concept and even if
these rules generally apply for most traffic situations, it is important that further investigations of
rules be performed. Aspects such as position inaccuracies, vehicles traveling on parallel roads,
and amount of vehicles that can be considered dangerous should be studied in more depth.
Network organization
Since network organization considerably influences the system performance, it is of interest to
explore alternatives. It would also be interesting to investigate how the network organization
could help to improve the communication performance by performing certain operations such as
controlling access priorities. Also of interest is to investigate how the network organization can
Concluding remarks
156
support the deployment of diverse traffic applications, such as applications that make use of
multicast and unicast communication.
Testing and implementation
The improvements in traffic safety for different deployment rates of the communication system
are of interest for investigation. Certainly, in this case the initial assumptions regarding the
operation of the safety system and the driver interaction with the system will influence the
results. Still, using relevant research results in traffic safety it should be possible to estimate the
level of improvement.
A prototype of the current version of the communication system or an improved future version
using on-market devices is planned for development. By employing field tests, more information
can be gathered about the performance of the system in real operations. However, this may
require the use of devices that do not really satisfy quality requirements imposed by the
vehicular environment. This is because such devices may not be available. For example, DSRC
devices are not currently on the market and WLAN cards, which are most likely to be employed
in field tests, usually provide low quality when used for inter-vehicle communication [CC05]. We
also note that a large number of vehicles would be needed for performing a realistic assessment
of the feasibility and reliability of the proposed communication system. This is because testing
with two or three vehicles, like in previous studies [e.g. [SBS+02, KKR+04, CC05]) can only
provide indications of data delivery latency, packet collisions or throughput. However, such tests
address a specific situation where interference will most probably be low. Also, indications about
the efficiency of the information filtering and the impact of the network organization on the
communication performance can be obtained only when testing with a larger number of vehicles.
The implementation of the proposed communication and networking techniques using DSRC
components would also be worthwhile to investigate in more detail.
Other directions
The protocol that we propose is directed toward safety applications. However, we envision the
possible use of the basic concepts for providing other types of vehicular communication such as
infotainment. To enhance the protocol with such functionality, new techniques for sending and
forwarding data need to be developed. Provision of different traffic services using inter-vehicle
communication is of interest to the community, and relevant research has already been
performed in this direction (e.g. [Wan04b, WLH+05]).
Another possible direction addresses the modeling of accidents and the derivation of
requirements on the support system for active safety systems using temporal logic. We see here a
need for extending the ECAM reasoning system with more advanced models of vehicle
dynamics, driver behavior and safety systems operation modes. The definition of a set of fluents
and events that generally apply to a large variety of traffic scenarios is also of interest. By using
such a set, a standard framework for analyzing accidents and deriving requirements for
supporting technologies for safety systems can be provided. We also see the possibility of
investigating the use of the ECAM system for predicting the occurrence of accidents.
Chapter 7
157
Security and privacy are issues of concern in vehicular networks and we have identified
various security requirements. However, we focus rather on the functionality of the
communication protocol in this thesis, and security remains an open issue.
159
Appendix A: Algorithms for derived
parameters
The decision mechanisms that implement the information filtering make use of primary and
derived parameters. The derived parameters are determined using primary parameters that were
previously extracted from received basic safety messages or were provided by systems located
on a subject host. In Chapter 4 we introduced the algorithms for determining the derived
parameters. This appendix gives details on these methods.
A1. Membership of two hosts to the same road
Let us consider two hosts, H1 and H2, which travel on a road as presented in figure A1.1. The
gray vehicles in the figure represent the current position of the hosts and the white vehicles with
dotted lines represent the previous positions of the hosts. The dotted arrows indicate the
movement of the vehicles between the two points in time.
We use a bidimensional representation (X and Y) of the movement vectors of the hosts. The angle
α between the movement vectors of the considered hosts can be calculated as:
1* 2arccos
| 2 || 1 |
V V
V V
α =
where 12 11
12 11
1x x
Vy y
− = −
and 22 21
22 21
2x x
Vy y
− = −
.
In the previous equation, |X| represents the module of vector X and we have used “*” to
indicate the dot product of two vectors. We used the classical equation for Euclidean distance
when calculating the module of a movement vector based on two successive position indications.
Thus:
2 2
12 11 12 11| 1| ( ) ( )V x x y y= − + − and 2 2
22 21 22 21| 2 | ( ) ( )V x x y y= − + −
Furthermore, the dot product of the movement vectors is calculated as:
12 11 22 21 12 11 22 211* 2 ( ) * ( ) ( ) * ( )V V x x x x y y y y= − − + − −
The angle α in the above equation is calculated in radians and needs to be translated in degrees.
Thus, α [degree] = α [rad] *180/π. If α is close to 0 or 180 degrees, then the hosts H1 and H2 are
considered to be on the same road. Otherwise, they are considered to travel on different roads.
We have considered 10 degrees as the maximum deviation (from 0 or 180 degrees).
Figure A1.1
H1 at P10(x11, y11)
Y
X
H1 at P11(x12, y12)
H2 at P20(x21, y21)
H2 at P21(x22, y22)
∝∝∝∝
V1 projected
V2
V1
160
A2. Relative positioning of two vehicle hosts
The relative positioning of two vehicle hosts indicates if one of the hosts is ahead of or behind the
other. This parameter is evaluated when the hosts are traveling with opposite headings. An
example is illustrated in figure A1.2, where two hosts H1 and H2 are represented at two
successive moments in time.
The gray vehicles represent the current position of the hosts and the white vehicles represent the
initial position. The dotted arrows indicate the movement of the vehicles. We also used a
bidimensional representation (i.e. X and Y) of the movement vectors. The angle β indicated in the
figure was evaluated as follows.
* 1cos
| || 1 |
AuxV V
AuxV Vβ = , where 12 11
12 11
1x x
Vy y
− = −
and 22 12
22 12
x xAuxV
y y
− = −
The angle β is then translated in degree and is compared with a threshold value of 90 degree. If β
is lower than this threshold, the host H2 is considered to be ahead of host H1. Otherwise it is
situated behind H1.
A3. Detection of route contention at an intersection
Route contention indicates the possibility that two vehicles will meet at an intersection. We
considered two vehicle hosts H1 and H2 that travel on different roads as presented in figure A
1.4. We estimated if these vehicles might meet using their positions (e.g. P21 and P11), their
orientations with regard to the horizontal axis (i.e. angles θ1 and θ2), and their velocities (i.e.
VH2 and VH1). We note int 22
int 22
tany y
x x2
−λ = θ2 =
− and int 12
int 12
tany y
x x1
−λ = θ1 =
−
If λ1= λ2 then H1 travels on a path parallel with H2 and they cannot meet at any time point. If
λ1≠ λ2 then:
int 12 1 int 1 12y y x xλ λ− = −
int 22 2 int 2 22y y x xλ λ− = −
Figure A1.2
H1 at P10(x11, y11)
Y
X
H1 at P11(x12, y12)
H2 at P20(x21, y21)
H2 at P21(x22, y22)
ββββ AuxV V1 projected
161
Thus, the estimated coordinates of the possible intersection point are:
[ ]int 1 12 2 22 22 12
1 2
1( )x x x y yλ λ
λ λ= − + −
−
and
[ ]int 1 2 12 22 1 22 2 12
1 2
1( ) )y x x y yλ λ λ λ
λ λ= − + −
−
The vehicles can meet at the intersection point PINT only when they approach this point. This is
the case if the following conditions hold at the same time:
[C1] int 12
12 11
0x x
x x
−>
− and [C2] int 22
22 21
0x x
x x
−>
−
The vehicles can meet at the intersection point only if they reach it at approximately the same
time. The distances to the predicted intersection point for H1 and H2 are calculated as follows: 1/ 2
2 2
11 int 12 int 12( ) ( )INTP P x x y y = − + −
1/ 22 2
21 int 22 int 22( ) ( )INTP P x x y y = − + −
The estimated times t1 and t2 when H1 and H2 are supposed to reach the intersection point are:
111
1
INTP Pt
VH= and 21
22
INTP Pt
VH=
However, the vehicles have a certain length and can collide when both of them arrive at the same
moment at the intersection point, or when one arrives at the intersection point and the other is
passing through it. Therefore, we introduced a time interval when the vehicles might meet at the
intersection. We call this interval Intersection_time_threshold and use this approximation when
comparing the time moments t1 and t2. Thus, the vehicles are considered in danger of meeting at
an intersection when |t1-t2|≤ Intersection_time_threshold
To specify a value for the Intersection_time_threshold we consider the usual length of a vehicle
to be between Lmin = 3 meters and Lmax = 7 meters. We also consider a minimum speed value of
Vmin = 8 km/h (e.g. urban intersection) and a maximum speed value of Vmax = 140 km/h (e.g.
highway junction) for a vehicle. Then, the longest period needed by a vehicle to completely pass
H1 at P10(x11, y11)
H1 at P11(x12, y12)
PINT (xint, yint)
θ2
θ1
H2 at P20(x21, y21)
H2 at P21(x22, y22)
X
Y
VH2
VH1
Figure A1.4
162
through the intersection point can be calculated as Lmax/Vmin and is around 3.2 sec.
Consequently, we selected 3 seconds as the value for Intersection_time_threshold.
163
List of Figures
Figure 1.1 EU fatalities 1995-2004 ..............................................................................................................1 Figure 2.1 Vehicle-to-Road Communication example ............................................................................9 Figure 2.2 Inter -Vehicle Communication example.................................................................................9 Figure 2.3 Collaborative communication concept .................................................................................10 Figure 2.4 Design method .........................................................................................................................11 Figure 2.5 ECAM - Predicates and Axioms ............................................................................................15 Figure 2.6 Conceptual architecture of the ECAM system.....................................................................16 Figure 2.7 Prolog predicates .....................................................................................................................18 Figure 2.8 Common definitions for Prolog predicates..........................................................................18 Figure 2.9 View obstruction followed by tailgate scenario (VOTS) ....................................................19 Figure 2.10 Fluents and events for VOTS ...............................................................................................21 Figure 2.11 Narrative for VOTS ...............................................................................................................25 Figure 2.12 Communication-related entities for VOTS.........................................................................29 Figure 2.13 Communication delay - initial separation distance and initial velocity........................32 Figure 2.14 Intersection accident example..............................................................................................33 Figure 3.1 Vehicular communication based on an infotainment infrastructure................................40 Figure 3.2 Vehicular communication based on a cellular network.....................................................41 Figure 3.3 Direct vehicular communication between vehicles ............................................................43 Figure 4.1 Local networks example .........................................................................................................52 Figure 4.2 Communication example........................................................................................................54 Figure 4.3 Communication protocol functionality - message reception.............................................56 Figure 4.4 Communication protocol functionality – message transmission......................................56 Figure 4.5 Network management overview...........................................................................................57 Figure.4.6 Host-oriented organization example ....................................................................................58 Figure.4.7 Cluster-based organization example ....................................................................................58 Figure 4.8 Example of situation when routing is needed .....................................................................68 Figure 4.9 Inter-network routing example for host-oriented organization........................................69 Figure 4.10 Vehicular Communication Platform (VCP) architecture .................................................78 Figure 5.1 Evaluation environment .........................................................................................................86 Figure 5.2 General scenario.......................................................................................................................90 Figure 5.3 Basic rear-end scenario ...........................................................................................................90 Figure 5.4 Extended rear-end scenario....................................................................................................91 Figure 5.5 Basic intersection scenario......................................................................................................91 Figure 5.6 Extended intersection scenario ..............................................................................................92 Figure 5.7 Average BSMs delay as a function of transmission interval – test case 1 ......................102 Figure 5.8 Maximum BSMs delay as a function of transmission interval – test case 1...................103 Figure 5.9 Average BSMs delay as a function of bandwidth – Test case 1.......................................103 Figure 5.10 Maximum BSMs delay as a function of bandwidth – test case 1 ..................................103 Figure 5.11 Average BSMs delay as a function of communication service area; transmission
power 12 dBm – test case 1 .................................................................................................104 Figure 5.12 Maximum BSMs delay as a function of communication service area; transmission
power 12 dBm – test case 1 .................................................................................................104 Figure 5.13 Average BSMs delay as a function of communication service area; transmission
power 23.5 dBm – test case 1...............................................................................................104 Figure 5.14 Maximum BSMs delay as a function of communication service area; transmission
power 23.5 dBm – test case 1...............................................................................................105 Figure 5.15 Average BSMs delay as a function of network load – test case 1..................................105
164
Figure 5.16 Maximum BSMs delay as a function of network load – test case 1 ............................. 105 Figure 5.17 Average BSMs delay as a function of velocity – test case 1........................................... 106 Figure 5.18 Maximum BSMs delay as a function of velocity – test case 1 ....................................... 106 Figure 5.19 Packet collisions as a function of transmission interval – test case 1 ........................... 108 Figure 5.20 Packet collisions as a function of bandwidth – test case 1............................................. 108 Figure 5.21 Packet collisions as a function of communication service area; transmission power 12
dBm – test case 1 .................................................................................................................. 108 Figure 5.22 Packet collisions as a function of communication service area; transmission power
23.5 dBm – test case 1 .......................................................................................................... 109 Figure 5.23 Packet collisions as a function of network load – test case 1......................................... 109 Figure 5.24 Packet collisions as a function of nodes mobility – test case 1...................................... 109 Figure 5.25 Send errors as a function of transmission interval – test case 1.................................... 110 Figure 5.26 Send errors as a function of bandwidth – test case 1 ..................................................... 111 Figure 5.27 Send errors as a function of communication service area; transmission power 12 dBm
– test case 1 ........................................................................................................................... 111 Figure 5.28 Send errors as a function of communication service area; transmission power 23.5
dBm – test case 1 .................................................................................................................. 111 Figure 5.29 Send errors as a function of network load – test case 1 ................................................. 112 Figure 5.30 Send errors as a function of nodes mobility – test case 1 .............................................. 112 Figure 5.31 Information filtering rate as a function of transmission interval – test case 1 ............ 113 Figure 5.32 Information filtering rate as a function of bandwidth – test case 1.............................. 113 Figure 5.33 Information filtering rate as a function of communication service area; transmission
power 12 dBm – test case 1................................................................................................. 114 Figure 5.34 Information filtering rate as a function of communication service area; transmission
power 23.5 dBm – test case 1.............................................................................................. 114 Figure 5.35 Information filtering rate as a function of network load – test case 1.......................... 114 Figure 5.36 Information filtering rate as a function of nodes mobility – test case 1....................... 115 Figure 5.37 Average BSMs delay as a function of bandwidth – test case 2 ..................................... 117 Figure 5.38 Maximum BSMs delay as a function of bandwidth – test case 2.................................. 118 Figure 5.39 Average BSMs delay as a function of load density – test case 2................................... 118 Figure 5.40 Maximum BSMs delay as a function of load density..................................................... 118 Figure 5.41 Packet collisions as a function of bandwidth – test case 2............................................. 119 Figure 5.42 Packet collisions as a function of load density – test case 2 .......................................... 119 Figure 5.43 Send errors as a function of bandwidth – test case 2 ..................................................... 120 Figure 5.44 Send errors as a function of load density – test case 2 ................................................... 120 Figure 5.45 Average BSMs delay as a function of load density – test case 3................................... 122 Figure 5.46 Maximum BSMs delay as a function of load density – test case 3 ............................... 122 Figure 5.47 Packet collisions as a function of communication area – test case 3 ............................ 123 Figure 5.48 Packet collisions as a function of load density – test case 3 .......................................... 123 Figure 5.49 Average WAMs delay as a function of transmission interval – test case 4................. 128 Figure 5.50 Maximum WAMs delay as a function of transmission interval – test case 4 ............. 128 Figure 5.51 Average WAMs delay as a function of bandwidth – test case 4 .................................. 128 Figure 5.52 Maximum WAMs delay as a function of bandwidth – test case 4 ............................... 129 Figure 5.53 Average WAMs delay as a function of communication service area – test case 4..... 129 Figure 5.54 Maximum WAMs delay as a function of communication service area – test case 4 . 129 Figure 5.55 Average WAMs delay as a function of load density – test case 4 ................................ 130 Figure 5.56 Maximum WAMs delay as a function of load density – test case 4............................. 130 Figure 5.57 Average WAMs delay as a function of mobility of hosts – test case 4 ........................ 130 Figure 5.58 Maximum WAMs delay as a function of mobility of hosts – test case 4 ..................... 131
165
Figure 5.59 Average WAMs delay as a function of transmission interval – test case 4, WAM dissemination within local network ..................................................................................132
Figure 5.60 Maximum WAMs delay as a function of transmission interval – test case 4, WAM dissemination within local network ..................................................................................132
Figure 5.61 Average WAMs delay as a function of bandwidth - test case 4, ...................................132 Figure 5.62 Maximum WAMs delay as a function of bandwidth – test case 4, WAM
dissemination within local network ..................................................................................133 Figure 5.63 Average WAMs delay as a function of communication service area – test case 4,
WAM dissemination within local network.......................................................................133 Figure 5.64 Maximum WAMs delay as a function of communication service area – test case 4,
WAM dissemination within local network.......................................................................133 Figure 5.65 Average WAMs delay as a function of load density – test case 4, WAM dissemination
within local network ............................................................................................................134 Figure 5.66 Maximum WAMs delay as a function of load density – test case 4, WAM
dissemination within local network ..................................................................................134 Figure 5.67 Average WAMs delay as a function of mobility – test case 4, WAM dissemination
within local network ............................................................................................................134 Figure 5.68 Maximum WAMs delay as a function of mobility – test case 4, WAM dissemination
within local network ............................................................................................................135 Figure 5.69 Average WAMs delay as a function of transmission interval – test case 5..................136 Figure 5.70 Maximum WAMs delay as a function of transmission interval....................................136 Figure 5.71 Average WAMs delay as a function of bandwidth – test case 5 ...................................136 Figure 5.72 Maximum WAMs delay as a function of bandwidth – test case 5................................137 Figure 5.73 Average WAMs delay as a function of communication service area – test case 5......137 Figure 5.74 Maximum WAMs delay as a function of communication service area – test case 5 ..137 Figure 5.75 Average WAMs delay as a function of network load – test case 5 ...............................138 Figure 5.76 Maximum WAMs delay as a function of network load – test case 5............................138 Figure 5.77 Average WAMs delay as a function of mobility of the hosts – test case 5...................138 Figure 5.78 Maximum WAMs delay as a function of mobility of the hosts – test case 5 ...............139 Figure 5.79 Average WAMs delay as a function of network load – test case 6 ...............................140 Figure 5.80 WAMs delay as a function of network load – test case 6 ...............................................140
167
List of Tables
Table 3.1 Comparison table for approaches to vehicular communication.........................................44 Table 4.1 Basic Safety Message – vehicle host ............................................................................................61 Table 4.2 Basic Safety Message – fixed host................................................................................................62 Table 4.3 Warning Message..........................................................................................................................67 Table 5.1 Simulation settings....................................................................................................................93 Table 5.2 Common settings for evaluations ...........................................................................................96 Table 5.3 Radio model parameters ..........................................................................................................97 Table 5.4 Results for VOTS and extended VOTS scenarios................................................................141 Table 5.5 Results for intersection and extended intersection scenarios............................................141
169
References [AF96] Aoki M., Fujii H., “Inter-vehicle communication: technical issues on vehicle control application”, IEEE
Communication Magazine, vol. 34, pp. 90-93, Oct. 1996.
[AHK+02] Ayama M., Hasegawa H., Kawaguchi M., Ihata N., Ikegami M., Kasuga M., “A study to measure spare
capacity of driver's attention payable to cognitive subtask”, pp. 279-283, IEEE Intelligent Transportation Systems
Conference, Singapore, Sept. 2002.
[AHR00] Advanced Cruise-Assist Highway System Research Association (AHSRA) Japan, “Smart Cruise 21 – Proving
tests of Smart Cruise systems”, Dec. 2000.
[AHR01] Advanced Cruise-Assist Highway System Research Association (AHSRA) Japan, “Outline of the Primary
Requirements of Advanced Cruise-Assist Highway Systems”, Nov. 2001.
[Alb99] Albers M., ”Information design considerations for improving situation awareness in complex problem solving",
17th International Conference on Computer Documentation, pp. 154-158, New Orleans, USA, May 1999.