J Am Acad Audiol 8 : 203-217 (1997) Communication Scale for Older Adults (CSOA) Harriet Kaplan* Scott Bally* Fred Brandt* Debra Busaccot Janet Pray$ Abstract The Communication Self-Assessment Scales for Older Adults (CSOA) are comprised of a 41-item Communication Strategies scale and a 31-item Communication Attitudes scale . Three-point and 5-point response formats are available . The scales were standardized on a population of 135 independent-living adults with hearing loss, ranging in age from 60 to 88 years . Item analysis, internal consistency reliability, test-retest reliability, normative data, and 95 percent confidence intervals are presented . A sample case illustrates how the scales can be used to evaluate the communication strategies and attitudes of an individual client . In addition, data are presented to show changes in the use of communication strategies and attitudes of a group of clients 3 months and 9 months after completion of aural rehabilitation programs . Key Words: Aural rehabilitation, communication, communication attitudes, communica- tion strategies, Elderhostel, older adults, scale, self-assessment Abbreviations : AR =aural rehabilitation, CSOA= Communication Self-Assessment Scale for Older Adults, DSSC = Denver Scale of Communication Function for Senior Citizens Living in Retirement Centers, HHIE = Hearing Handicap Inventory for the Elderly, RIT = item-total correlation, SE = standard error, SHHH = Self-Help for Hard of Hearing People T here have been few reported attempts to evaluate in a consistent way the effects of any of the various types of aural rehabil- itation (AR) programs on the daily lives of elderly persons, perhaps because there are few evalua- tion protocols to provide the information . A notable exception is the 25-item Hearing Hand- icap Inventory for the Elderly (HHIE), which was developed by Ventry and Weinstein in 1982 to assess the social and emotional effects of hearing impairment on the noninstitutionalized older person . It has excellent statistical char- acteristics and has been used widely to evalu- ate hearing aid use in older adults (Newman and Weinstein, 1988 ; Malinoff and Weinstein, 1989a, b ; Newman et al, 1993 ; Kricos and *Department of Audiology and Speech Language Pathology, Gallaudet University, Washington, DC ; tSundance Rehabilitation Corporation, Hofstra University, New York, NY; $Department of Social Work, Gallaudet University, Wash- ington, DC Reprint requests : Harriet Kaplan, Department of Audi- ology and Speech Language Pathology, Gallaudet Uni- versity, Washington, DC 20002 Holmes, 1996) . The emotional section assesses a client's attitudes and emotional responses to the hearing loss . The social scale evaluates per- ceived effects of hearing loss in a variety of sit- uations . None of the items evaluate communication strategies, however, and only 13 items deal with attitudes related to hearing loss . A scale that evaluates use of communication strategies and contains a larger number of items that probe attitudes about hearing impair- ment may provide a more sensitive tool to eval- uate effects of intervention . Other scales that have been developed for older adults include the Denver Scale of Com- munication Function for Senior Citizens Living in Retirement Centers (DSSC) (Zarnoch and Alpiner, 1977), the Nursing Home Hearing Handicap Index (Schow and Nerbonne, 1977), and the Communication Assessment Procedure for Seniors (Alpiner and Baker, 1981) . These three scales were designed for older adults who live in institutionalized settings . Many older adults with hearing loss are educationally and socioeconomically advantaged and live indepen- 203
Transcript
J Am Acad Audiol 8 : 203-217 (1997)
Communication Scale for Older Adults (CSOA) Harriet Kaplan* Scott Bally* Fred Brandt* Debra Busaccot Janet Pray$
Abstract
The Communication Self-Assessment Scales for Older Adults (CSOA) are comprised of a 41-item Communication Strategies scale and a 31-item Communication Attitudes scale. Three-point and 5-point response formats are available . The scales were standardized on a population of 135 independent-living adults with hearing loss, ranging in age from 60 to 88 years . Item analysis, internal consistency reliability, test-retest reliability, normative data, and 95 percent confidence intervals are presented. A sample case illustrates how the scales can be used to evaluate the communication strategies and attitudes of an individual client . In addition, data are presented to show changes in the use of communication strategies and attitudes of a group of clients 3 months and 9 months after completion of aural rehabilitation programs .
Abbreviations : AR =aural rehabilitation, CSOA= Communication Self-Assessment Scale for Older Adults, DSSC = Denver Scale of Communication Function for Senior Citizens Living in Retirement Centers, HHIE = Hearing Handicap Inventory for the Elderly, RIT = item-total correlation, SE = standard error, SHHH = Self-Help for Hard of Hearing People
T
here have been few reported attempts to evaluate in a consistent way the effects of any of the various types of aural rehabil-
itation (AR) programs on the daily lives of elderly persons, perhaps because there are few evalua-tion protocols to provide the information. A notable exception is the 25-item Hearing Hand-icap Inventory for the Elderly (HHIE), which was developed by Ventry and Weinstein in 1982 to assess the social and emotional effects of hearing impairment on the noninstitutionalized older person . It has excellent statistical char-acteristics and has been used widely to evalu-ate hearing aid use in older adults (Newman and Weinstein, 1988; Malinoff and Weinstein, 1989a, b ; Newman et al, 1993 ; Kricos and
*Department of Audiology and Speech Language Pathology, Gallaudet University, Washington, DC ; tSundance Rehabilitation Corporation, Hofstra University, New York, NY; $Department of Social Work, Gallaudet University, Wash-ington, DC
Reprint requests : Harriet Kaplan, Department of Audi-ology and Speech Language Pathology, Gallaudet Uni-versity, Washington, DC 20002
Holmes, 1996). The emotional section assesses a client's attitudes and emotional responses to the hearing loss . The social scale evaluates per-ceived effects of hearing loss in a variety of sit-uations . None of the items evaluate communication strategies, however, and only 13 items deal with attitudes related to hearing loss . A scale that evaluates use of communication strategies and contains a larger number of items that probe attitudes about hearing impair-ment may provide a more sensitive tool to eval-uate effects of intervention .
Other scales that have been developed for older adults include the Denver Scale of Com-munication Function for Senior Citizens Living in Retirement Centers (DSSC) (Zarnoch and Alpiner, 1977), the Nursing Home Hearing Handicap Index (Schow and Nerbonne, 1977), and the Communication Assessment Procedure for Seniors (Alpiner and Baker, 1981). These three scales were designed for older adults who live in institutionalized settings . Many older adults with hearing loss are educationally and socioeconomically advantaged and live indepen-
203
Journal of the American Academy of Audiology/Volume 8, Number 3, June 1997
dently. Therefore, the appropriateness of these three scales for the larger group of older adults who live independently is not clear. Furthermore, because the scales have been neither standard-ized nor evaluated for reliability, their use to eval-uate change over time is questionable .
The Communication Scales for Older Adults (CSOA) were developed at Gallaudet University as a tool to provide in-depth information about the effects of AR therapy on daily life. One of the scales evaluates communication strategies and the other evaluates how clients feel about hav-ing hearing loss, their adjustments to changed communication, and their perceptions of how others react to them as people with hearing loss . This article is organized into two sections . Section 1 describes the procedures used to develop these scales and presents psychometric data . Section 2 discusses outcome evaluation, including the use of the scales to evaluate par-ticipants in the Gallaudet University Elder-hostel program.
SCALE DEVELOPMENT
time, 49 percent sometimes, and 8 percent almost never. Most did not use assistive technology, nor did they belong to consumer advocacy groups such as Self-Help for Hard of Hearing People (SHHH) . Approximately half of the subjects attended the Elderhostel programs with a friend or spouse .
As is typical of Elderhostelers, these subjects were well educated, interested in new learning experiences, and highly motivated to cope with hearing loss . Although few of the subjects were employed, most were heavily involved in vol-unteer activities . Although some of the subjects suffered from physical problems such as arthri-tis and cardiovascular disorders, all were ambu-latory, lived independently, and were able to complete printed survey forms without assis-tance.
The data presented in this study should be considered applicable only to the independently functioning segment of the older population with hearing loss . Further research needs to be performed to determine whether the CSOA can be applied to people in more institutionalized environments such as assisted living commu-nities or long-term care facilities .
Method
Subjects
The CSOA is designed for older, noninsti-tutionalized adults . It was developed using 135 subjects who attended one of eight Gallaudet Elderhostel programs held between 1993 and 1995 . The Gallaudet Elderhostel is an interdis-ciplinary, client-focused, week-long intensive AR program that includes approximately 40 hours of class, interactive laboratories, individ-ual consultations, and other activities offered during a 6-day period. A description of the Elder-hostel curriculum can be found in Kaplan (1983) and Bally and Kaplan (1988) .
The subjects ranged in age from 60 to 88 years (mean = 75.0, SD = 6.2) . Sixty-nine sub-jects were male and 66 were female . Hearing losses ranged from mild to severe ; all were bilat-eral, sensorineural, or mixed and were acquired during adulthood. The major complaint of the subjects was difficulty understanding speech under difficult communication conditions such as group conversation, distance listening, or noise.
Sixty-five percent of the subjects reported using hearing aids ; of that group, 43 percent reported that they used their aids most of the
Developmental Procedures
Items were written based on review of other scales developed for the elderly hard-of-hearing population and for younger adults (Alpiner et al, 1974; Schow and Nerbonne, 1977; Alpiner and Baker, 1981 ; Ventry and Weinstein, 1982 ; Lamb et al, 1983; Demorest and Erdman, 1987 ; Owens and Raggio, 1988 ; Kaplan et al, 1995), as well as the authors' knowledge of the population . The items were designed to evaluate positive and negative communication strategies ; perceived attitudes and behaviors of family, friends, and others ; and interpersonal and emotional factors related to communication. Item format was mod-eled on the Hearing Performance Inventory (Lamb et al, 1983) and the Communication Pro-file for the Hearing Impaired (Demorest and Erdman, 1987).
The list of items was reviewed for appro-priateness of language and content by a group of communication specialists with experience working with older adults with hearing loss . Items were modified based on these reviews.
Description of Scales
The Appendix contains the 72 items of the CSOA, divided into two scales, Communication
CSOA/Kaplan et al
Strategies (41 items) and Communication Atti-tudes (31 items) ; instructions are included . Two response formats are available: the 3-point con-tinuum shown in the Appendix and a 5-point con-tinuum . The 3-point format offers response choices of (1) almost always, (2) sometimes, or (3) almost never to each item . Choices on the 5-point response format are (1) always, (2) almost always, (3) sometimes, (4) almost never, or (5) never.
Initially, a 3-point item response format was selected because previous research had indicated that a more complex format tended to be too difficult for older adults who frequently used only the endpoints of the scale (Kaplan et al, 1978). Most scales designed for elderly clients use a 3-point or simpler response format (Zarnoch and Alpiner, 1977 ; Alpiner and Baker, 1981 ; Ventry and Weinstein, 1982). However, subjects consistently requested more choices in the response format during the data collection process. Therefore, an additional 5-point response continuum was developed. The 3-point and 5-point response format scales were both evaluated using an N of 79 for the former and 56 for the latter. An investigator or clinician may use either version depending on the needs of the subjects .
The Strategies and Attitudes scales are designed to be administered in pencil-and-paper format and may be used independently of each other. Each item describes a management strat-egy or attitude in simple active, declarative sen-tence format . Clients indicate to what extent the item is perceived to be true .
The Communication Strategies scale describes actual or potential communication breakdowns and specific anticipatory/environ-mental or repair strategies appropriate for each situation. The scale includes evaluation of inap-propriate strategies such as bluffing or avoidance behavior that suggest ineffective handling of communication problems . The following are sev-eral scale items:
0
0
0
You are talking to someone you do not know well . You do not understand . You ask her to repeat . (positive repair strategy) You are talking with one person but are not understanding. You interrupt the person before he finishes to say what you think. (negative repair strategy) You are going to a series of meetings or lec-tures. You ask the speaker to use slides, pictures, or an overhead projector when-ever possible . (anticipatory strategy)
The 31 items of the Communication Atti-tudes scale evaluate the client's attitudes toward hearing loss, toward himself or herself as a hard-of-hearing person, and perception of other people's attitudes. Perceived attitudes of family and nonfamily members are evaluated. The fol-lowing are several scale items :
0
0
0
0
I feel speechreading (lipreading) is helpful to me. (positive attitude) I become angry when people do not speak clearly enough for me to understand . (neg-ative attitude) Sometimes I can't follow conversation at home. I still feel part of family life . (perceived family attitudes) People who know I have a hearing loss think I can hear when I want to . (perceived non-family attitudes)
Procedures
After the scale items had been reviewed and modified, the resultant scales were mailed to Elderhostel participants several weeks before the beginning of their programs . Seventy-nine subjects received the 3-point response format scales and 56 different subjects received the 5-point scales . The scales were again adminis-tered to all subjects on their day of arrival at the Elderhostel before the program began. Results of the two scale administrations were evalu-ated for item analysis and reliability analysis.
Scoring
Communication Strategies Scale. For both scales, a high scale score indicates a high degree of communication difficulty. For most of the items of the Strategies scale, responses of 1 indi-cate little difficulty. However, because responses of 1 indicate a great deal of difficulty for 14 of the items, scoring of these items needs to be reversed in order to keep interpretation consis-tent. For example, for item 2 ("You are talking with two people . You are not understanding. You change the topic so that you can control the conversation."), a response of 1 always indicates an inappropriate strategy. Therefore, it is nec-essary to change the 1 to 3 during the scoring process. The items requiring reversed scoring are marked with an asterisk in the Appendix.
Communication Attitudes Scale. The same scoring procedure as described for the Commu-nication Strategies scale is used for the Attitudes
Journal of the American Academy of Audiology/Volume 8, Number 3, June 1997
scale. However, the numbering for this scale is different from that used for the Communication Strategies scale because 24 of the 31 items are worded so that a response of 1 always or almost always (depending on the response format) indi-cates maximum difficulty. For example, a response of 1 always to item 4 ("I feel stupid when I misunderstand what a person is say-ing:") suggests a problem . Therefore, the response choices for this scale are numbered so that 3 indicates almost always, 2 sometimes, and 1 almost never. For the 5-point response format, 5 indicates always, 4 almost always, 3 some-times, 2 almost never, and 1 never.
A score is computed for each scale by total-ing the item responses after appropriate reversed scoring and then computing a scale mean . A high scale score indicates a high degree of com-munication difficulty. Lowering of scores from one administration of the scale to another indi-cates reduction of reported difficulty. This may take the form of better use of communication strategies, improvement in attitudes toward hearing loss, or both . Although subjects are encouraged to respond to all items, they have the option to not answer questions. In that situation, the scale mean is based on all items answered .
Table 1 Descriptive Statistics of Scale Items: Communication Strategies
A computer disk is available to facilitate scoring for users who do not wish to do hand scor-ing. The user enters the client's score for each item into the computer. The program then reverses the scores for items requiring reversal and computes a mean for the scale. The mean can then be compared with the confidence inter-vals (±2 standard error [SE] ; strategies : 3-point response format = 1 .56-2.28, 5-point response format = 2.91-3.11; attitudes: 3-point response format = 1.53-1.91, 5-point response format = 2.33-2 .61) . A score above the confidence inter-val suggests difficulty.
Results
Item Analysis . Item analyses of the scales administered on day of arrival were performed using an SPSS Reliability Analysis Program (SPSS-X, 1986). For each item, the following measures were obtained : distribution of 1, 2, 3 or 1, 2, 3, 4, 5 responses; means and standard
deviations ; and item-total correlations (RIT). Chronbach alpha coefficients were obtained for each scale and the effect on the Chronbach alpha of deleting each item was determined (Chron-bach et al, 1972). The Chronbach alpha statis-tic is a measure of the internal consistency of a scale; it indicates how well the items relate to each other and how well items measure the same thing. Table 1 shows item means, standard deviations, and RIT for the 3-point and 5-point response format communication strategies scales . Table 2 shows comparable data for the communication attitudes scales .
Items were deleted for the following reasons:
0
0
The distribution of responses was too nar-row. At least 20 percent of the responses to an item had to fall into each of the response categories to be retained. A second indicator of unacceptably narrow response distribution was a standard devi-ation smaller than 0 .5 .
Table 2 Descriptive Statistics of Scale Items : Communication Attitudes
0 There were extremely high or low means. Item means were required to fall between 1.5 and 2.5 for the 3-point response format and 1.5 and 4.0 for the 5-point response for-mat. Elimination of an item would increase coef-ficient alpha. The goal was to maintain a maximum possible coefficient alpha for each of the scales .
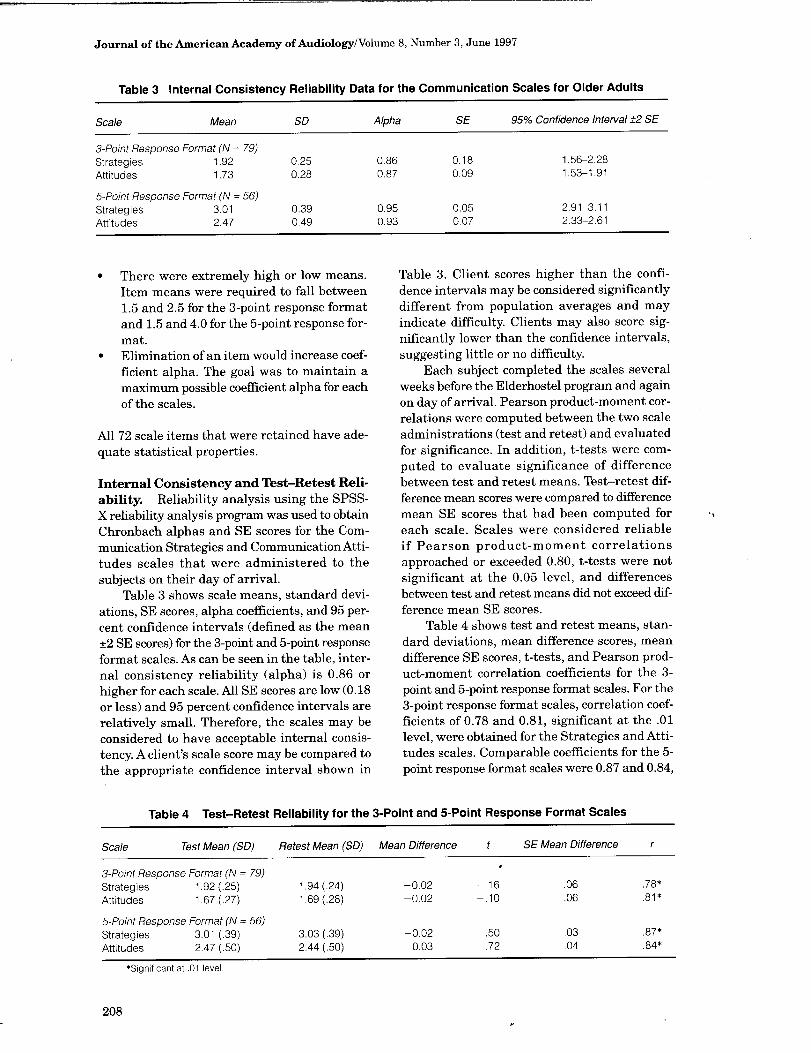
Table 3. Client scores higher than the confi-dence intervals may be considered significantly different from population averages and may indicate difficulty. Clients may also score sig-nificantly lower than the confidence intervals, suggesting little or no difficulty.
Each subject completed the scales several weeks before the Elderhostel program and again on day of arrival. Pearson product-moment cor-relations were computed between the two scale administrations (test and retest) and evaluated for significance . In addition, t-tests were com-puted to evaluate significance of difference between test and retest means. Test-retest dif-ference mean scores were compared to difference mean SE scores that had been computed for each scale. Scales were considered reliable if Pearson product-moment correlations approached or exceeded 0.80, t-tests were not significant at the 0.05 level, and differences between test and retest means did not exceed dif-ference mean SE scores .
Table 4 shows test and retest means, stan-dard deviations, mean difference scores, mean difference SE scores, t-tests, and Pearson prod-uct-moment correlation coefficients for the 3-point and 5-point response format scales . For the 3-point response format scales, correlation coef-ficients of 0.78 and 0.81, significant at the .01 level, were obtained for the Strategies and Atti-tudes scales . Comparable coefficients for the 5-point response format scales were 0.87 and 0.84,
0
All 72 scale items that were retained have ade-quate statistical properties .
Internal Consistency and Test-Retest Reli-ability. Reliability analysis using the SPSS-X reliability analysis program was used to obtain Chronbach alphas and SE scores for the Com-munication Strategies and Communication Atti-tudes scales that were administered to the subjects on their day of arrival.
Table 3 shows scale means, standard devi-ations, SE scores, alpha coefficients, and 95 per-cent confidence intervals (defined as the mean ±2 SE scores) for the 3-point and 5-point response format scales . As can be seen in the table, inter-nal consistency reliability (alpha) is 0.86 or higher for each scale. All SE scores are low (0.18 or less) and 95 percent confidence intervals are relatively small. Therefore, the scales may be considered to have acceptable internal consis-tency. A client's scale score may be compared to the appropriate confidence interval shown in
Table 4 Test-Retest Reliability for the 3-Point and 5-Point Response Format Scales
also significant at the .01 level. T-tests indi-cated that test and retest means were not sig-nificantly different at the 0.05 level. None of the difference scores between test and retest means exceeded the SE difference mean scores . These criteria suggest that t)e scales have acceptable test-retest reliability.
95 Percent Confidence Intervals around the Test Retest Difference Means
4, however, shows that the 5-point response for-mat demonstrated lower SE of measurement for both the Strategies and Attitudes scales and somewhat higher test-retest correlations . In addition, the 5-point scales may provide more information about how a client functions because of the greater number of response options. There-fore, the authors recommend that the 5-point scales be used unless the examiner feels that it would be too difficult for the clients.
Test and retest means for both the 3-point and the 5-point Strategies and Attitudes scales, based on Ns of 79 and 56, were not significantly different at the 0.05 level. Therefore, individual difference scores that fell within the 95 percent confidence interval around the test-retest dif-ference means (mean ±2 SE scores) may be con-sidered within the normal range and those difference scores outside the 95th percentile point may be considered outside the normal range. If an individual's difference score as a function of intervention occurs above the 95th percentile, it is probable that a beneficial change occurred .
Strategies . Table 4 reveals that the test-retest difference mean was -0.02 and the SE was 0.06 for the 3-point scale. The 95 percent confidence interval, defined as the mean ±2 SE, was -0 .14 to 0.10 . Any individual difference score exceed-ing 0.10 may be considered to indicate benefit. The comparable 95 percent confidence interval for the 5-point scale is -0 .08 to 0.04; an indi-vidual difference score exceeding 0.04 may be considered to indicate benefit.
Attitudes. The 95 percent confidence interval for the 3-point scale was also -0.14 to 0.10. The comparable confidence interval for the 5-point scale was -0.05 to 0.11. Any individual differ-ence score exceeding 0.10 or 0.11 (depending on the scale used) may indicate benefit.
Comparison of 3-Point and 5-Point Response Scales
The CSOA is available using two response formats . Both scales demonstrate satisfactory item characteristics, internal consistency, and test-retest reliability. Both have small 95 per-cent confidence intervals, allowing them to be used to evaluate changes in client performance as a function of intervention . Inspection of Table
OUTCOME EVALUATION
T he Communication Strategies and Commu-nication Attitudes scales may be used to
obtain baseline data on a client to identify areas to target in therapy and for counseling about strengths and weaknesses . Later in this paper a case will be presented to illustrate how the scales may be used for this purpose. The scales may also be used to evaluate the results of inter-vention procedures for an individual or a group or to compare groups within a target population . The following study illustrates the use of the scales to evaluate intervention procedures with a group.
GROUP EVALUATION
Purpose
The CSOA was used with clients who attended week-long Elderhostel AR programs to evaluate change in the ability of participants to better cope with their hearing losses 3 months and 9 months after completion of the programs . It was hypothesized that clients would show significantly lower means on the Strategies and Attitudes scales compared to means obtained prior to attendance at the programs .
Method
Subjects
Thirty-nine individuals from three similar AR programs, held between March and Sep-tember 1993, were used as subjects . They com-pleted the Strategies and Attitudes scales immediately before the beginning of their pro-grams, 3 months later, and 9 months later. Sub-jects ranged in age from 60 to 85 years (M = 73 .5, SD = 5.0) . Hearing impairments ranged from mild to moderately severe, were bilateral, sen-
209
Journal of the American Academy of Audiology/Volume 8, Number 3, June 1997
sorineural, or mixed, and were acquired in adulthood. Approximately two-thirds were hear-ing aid users.
Procedures
All subjects completed the Strategies and Attitudes scales of the CSOA immediately before the beginning of their programs, 3 months later, and 9 months later. The 3-point response format scale was used .
Results
Results were analyzed by determining how many individual difference scores exceeded the 95 percent confidence intervals. For both the Strategies and Attitudes scales, any difference score of 0 .10 or higher may be considered to indicate improvement. Difference scores of -0.10 or lower may be indicative of deterioration. Dif-ference scores were computed between (1) base-line data (prior to beginning of the Elderhostel program) and 3 months later; (2) baseline data and 9 months later; and (3) 3-month and 9-month data.
Figure 1 shows difference scores for the Strategies scale between baseline and 3 months and baseline and 9 months . Of the 39 individu-als who completed the scale, 20 showed differ-ence scores of 0.10 or higher 3 months after completion of their Elderhostel programs, sug-gesting improved use of strategies ; 13 of those individuals showed improvement 9 months after Elderhostel.
Figure 2 shows comparable difference scores for the Attitudes scale. Of the 37 individuals who completed the 3-month scale, 17 showed dif-ference scores of 0 .10 or higher 3 months after
Individual Difference Scores Between baseline and 3 months and 9 months administrations; Strategies (n=39)
17
I l
Significant improvement-,l
Baseline vs . 3 mo . n Baseline vs . 9 mo .
Figure 1 Individual difference scores between baseline, 3-month, and 9-month test administrations for the Strate-gies scale.
Individual Difference Scores Between baseline and 3 months (n=37) and 9 months (n=38) :Attitudes
16 1 __
15
Baseline vs . 3 mo . ~Z Baseline vs. 9 mo .
Figure 2 Individual difference scores between baseline, 3-month, and 9-month test administrations for the Atti-tudes scale.
completion of their Elderhostel programs, sug-gesting improved attitudes toward hearing loss ; of the 38 individuals who completed the 9-month scale, 14 showed improvement at the 9-month evaluation .
Figure 3 shows differences scores for both the Strategies and Attitudes scales between the 3-month and 9-month evaluations . Four indi-viduals showed improvement of 0.10 or higher on the Strategies scale and six individuals showed comparable improvement on the Atti-tudes scale. Apparently, these individuals con-tinued to improve in their use of strategies and in their attitudes toward hearing loss . In con-trast, 19 individuals showed negative difference scores greater than -0.10 on the Strategies scale; 10 individuals showed comparable nega-tive differences on the Attitudes scale. These large negative difference scores suggest poorer attitudes and poorer use of strategies 9 months
Individual Difference Scores Between 3 mo . & 9 mo, lests :Strategies (n=39) 8 Attitudes (n=36) Scales
,~ ---Significant improvement -
j Strategies Attitudes
Figure 3 Individual difference scores between 3-month and 9-month test administrations for the Strategies and Attitudes scales .
210
CSOA/Kaplan et al
after completion of the Elderhostel program compared to 3 months .
It is possible that the improvement in use of strategies after 3 months was caused not by an actual improvement in communication but by the ability of the subjects to remember how to answer the questions by reporting appropriate strategies . It is unlikely, however, that invalid responses to scale items would explain compa-rable improvement in the Attitudes scale. Fur-thermore, reduction in self-perceived handicap using the HHIE has been reported by other investigators (Malinoff and Weinstein, 1989a, b; Abrams et al, 1992 ; Newman et al, 1993).
DISCUSSION
dministration of the CSOA to 39 AR par-Aticipants prior to the program, 3 months, and 9 months later revealed similar trends in both the Strategies and Attitudes domains. Large numbers of clients demonstrated improve-ment that exceeded the 95 percent confidence intervals around the test-retest difference means 3 months after completion of the AR program. At 9-months postintervention, however, fewer clients demonstrated such improvement; scores tended to be higher and closer to baseline than at the 3-month evaluation .
These results are consistent with several previous studies. Malinoff et al (1989a), using the HHIE to evaluate hearing aid benefit, found a significant reduction in handicap 3 weeks after dispensing of the hearing aid. In a second study (Malinoff et al, 1989b), they found a significant increase in perceived handicap between the 3-week and 3-month scale administrations and no significant change between 3-months and 1-year postfitting . Newman et al (1993) evalu-ated self-perceived benefit of amplification in new hearing aid users 3 weeks and 6 months after completion of hearing aid fitting. Similar to other investigators, they found significant decrease in self-perceived handicap at the 3-week evaluation and a significant increase in reported handicap between the 3-week and 6-month scale administrations . Abrams et al (1992) used the HHIE to determine whether partici-pation in a 3-week counseling-based AR pro-gram would reduce psychosocial problems more than using a hearing aid alone. The HHIE was given to three groups of clients before inter-vention and 2 months after completion of the AR program. One group received hearing aids and the intervention program, the second group received hearing aids but no therapy, and the
third group received only audiologic evaluation . Significant improvement was found in groups one and two but not in group three. In addition, there was a small but significantly greater reduc-tion of handicap in the intervention group com-pared to the hearing aid group. The investigators did not evaluate self-perceived handicap over a longer term .
All of these studies have demonstrated that communication scales that evaluate self-per-ceived handicap are sensitive to the benefits of amplification and AR. They all demonstrate short-term improvement followed by an increase in handicap with time . These previous data sup-port the results of the present study in which Attitudes and Strategies scales were used to evaluate change as a function of AR over time . Future research needs to address possible fac-tors that might explain why some clients main-tain improvement over time and others do not. In addition, intervention strategies need to be developed that will maintain early improve-ment over the long term .
INDIVIDUAL CLIENT EVALUATION
T he following case illustrates how the scales may be used to identify areas to target in
therapy. RS is a 78-year-old man who completed the
scales upon arrival at an AR program. He had a moderate to severe bilateral sensorineural hearing loss with poor word recognition and moderate speechreading ability. He reported that his hearing had gradually deteriorated dur-ing the past 5 years and that the hearing loss interfered with his ability to communicate in almost all social situations and created stress within the family. His wife reported that he had withdrawn from many social activities in which they had formerly participated. Mr. and Mrs. S came to the program in the hope of learning new ways to communicate and deal with the hearing loss .
RS obtained a mean score of 3.71 on the 5-point response format Strategies scale . Responses to individual items were examined because the scale score exceeded the 95 percent confidence interval of 2.91 to 3.11, suggesting dif-ficulty. Mr. S's responses revealed that he was using no anticipatory or repair strategies . He reported never asking family members or strangers to repeat, spell proper names, use digits to clarify numbers, rephrase messages, or slow the rate of speech . He reported never ask-ing for help in advance (e.g ., requesting an out-
211
Journal of the American Academy of Audiology/Volume 8, Number 3, June 1997
line or visual aids) when he attended a meeting or a class. Negative strategies involving avoid-ance of communication were frequently reported.
Responses to the Attitudes scale resulted in a mean score of 2.06, which was well below the 95 percent confidence interval of 2.33 to 2.61. At first glance, this score seemed to indicate healthy attitudes toward hearing loss and strong self-image. However, this conclusion was inconsis-tent with case history information and reported nonuse of communication strategies . Inspection of responses to individual items revealed that he reported never feeling upset, embarrassed, frus-trated, or angry when he could not follow a con-versation, never feeling angry when a talker spoke too fast or covered his mouth, and never feeling nervous, depressed, or angry about hav-ing a hearing loss . He also indicated that it was only the responsibility of the hard-of-hearing person (not the hearing partner) to facilitate communication . In contrast, case history responses revealed a pattern of withdrawal from social situations because of communication frus-tration and embarrassment. The contradiction between scale item responses and case history data suggested that the low score on the Atti-tudes scale might indicate denial of problems . This hypothesis was further investigated .
Responses to the Strategies scale indicated the need to incorporate work on anticipatory and repair strategies into the therapy program, develop more assertive behavior, and de-empha-size avoidance of difficult communication situ-ations . Despite the low mean score on the Attitudes scale, adjustment counseling was included in the program .
Alpiner JG, Baker B. (1981) . Communication assessment procedures in the aural rehabilitation process. Semin Speech Lang Hear 2:189-204 .
Alpiner JG, Chevrette W, Glascoe G, Metz M, Olsen B. (1974) . The Denver Scale of Communication Function . Unpublished manuscript, University of Denver.
Bally SJ, Kaplan H . (1988) . The Gallaudet University aural rehabilitation Elderhostels . JAcad Rehabil Audiol 21:99-112 .
Chronbach LJ, Gleser GC, Nanda H, Rajaratnam N. (1972) . The Dependability of Behavioral Measurements: Theory of Generalizability for Scores and Profiles. New York: Wiley.
Demorest ME, Erdman SA . (1987) . Development of the Communication Profile for the Hearing Impaired . J Speech Hear Disord 52:129-142 .
Kaplan H . (1983). Elderhostel for the hearing impaired . ASHA 25(7):46-49 .
Kaplan H, Bally SJ, Brandt F. (1995) . Revised Communication Self-Assessment Scale Inventory for Deaf Adults (CSDA) . J Am Acad Audiol 6:311-329 .
Kaplan H, Feeley J, Brown J. (1978) . A modified Denver Scale: Test-retest reliability. J Acad Rehabil Audiol 11(2):15-32 .
Kricos PB, Holmes AE . (1996) . Efficacy of audiologic reha-bilitation for older adults . JAm AcadAudiol 7:219-229 .
Lamb SH, Owens E, Schubert ED . (1983) . The revised form of the Hearing Performance Inventory. Ear Hear 4:152-157 .
Malinoff RL, Weinstein BE . (1989a) . Measurement of hearing aid benefit in the elderly. Ear Hear 10:354-356 .
Malinoff RL, Weinstein BE . (1989b) . Changes in self-assessment of hearing handicap over the first year of hearing aid use by older adults . JAcad Rehabil Audiol 12:54-60 .
SUMMARY
B oth the Strategies and Attitudes scales of the CSOA have good internal consistency and test-retest reliability when used with indepen-dently functioning older adults . The scales are available with 3-point and 5-point response for-mats . They may be used to target behaviors of individual clients that need intervention during therapy. The scales may also be used to evalu-ate client outcomes as a function of rehabilita-tion and to evaluate efficacy of programs . Sample cases illustrate several ways in which the CSOA can be used clinically.
REFERENCES
Abrams HB, Hnath-Chisolm T, Guerreiro MS, Ritterman Si . (1992) . The effects of intervention strategies on self-perception of hearing handicap. Ear Hear 5:371-377 .
Newman CW Hug GA, Wharton JA, Jacobsen GE (1993) . The influence of hearing aid cost on perceived benefit in older adults . Ear Hear 14:285-289 .
Newman CW, Weinstein BE . (1988) . The Hearing Handicap Inventory for the Elderly as a measure of hear-ing aid benefit. Ear Hear 9:81-85 .
Owens E, Raggio M. (1988) . Performance Inventory for Profound and Severe Hearing Loss (PIPSL). J Speech Hear Disord 53 :42-56 .
Schow RL, Nerbonne MA. (1977). Assessment of hearing handicap by nursing home residents and staff. J Acad Rehabil Audiol 10:2-12.
SPSS-X. (1986) . Statistical Package for the Social Sciences. 2nd ed. Chicago: SPSS-X Inc.
Ventry I, Weinstein BE . (1982). Hearing handicap inven-tory for the elderly (HHIE) . Ear Hear 3:128-134 .
Zarnoch JM, Alpiner JG . (1977) . The Denver Scale of Communication Function for Senior Citizens Living in Retirement Centers. Unpublished study.
212
CSOA/Kaplan et al
APPENDIX
Communication Scale for Older Adults (3-Point Response Format)
Communication Strategies
Please read each situation. Decide if the situation is true (1) almost always, (2) sometimes, or (3) almost never; please circle the appropriate answer. PLEASE RESPOND TO EACH QUESTION.
Question #1 You are talking with someone you do not know well . You do not understand . You ask her to repeat . (1) almost always (2) sometimes (3) almost never Question #2 You are talking with two people . You are not understanding. You change the topic so that you can control the conversation . (1) almost always (2) sometimes (3) almost never Question #3 You ask a stranger for directions . You understand part of what he says . You tell him the part you understand and ask him to repeat the rest . (1) almost always (2) sometimes (3) almost never Question #4 A friend introduces you to a new person . You do not understand the person's name . You ask the per-son to spell her name. (1) almost always (2) sometimes (3) almost never Question #5 A stranger spells his name for you. You miss the first two letters. You ask him to say each letter and a word starting with that letter (a as in apple, b as in boy) . (1) almost always (2) sometimes (3) almost never Question #6 A person tells you his address. You do not understand . You ask him to repeat the street number, one number at a time . (1) almost always (2) sometimes (3) almost never 'Question #7 You are talking with one person but are not understanding. You interrupt the person before he fin-ishes to say what you think. (1) almost always (2) sometimes (3) almost never Question #8 Your friend asks you to buy seven hamburgers . You do not understand how many he wants. You ask him to start counting from zero and stop at the correct number. (1) almost always (2) sometimes (3) almost never Question #9 You are at a meeting. The speaker says something you do not understand . You pretend to understand and hope to get the information later. (1) almost always (2) sometimes (3) almost never Question #10 Two people are talking. You do not understand the conversation . You ask them to tell you the topic. (1) almost always (2) sometimes (3) almost never Question #11 You are talking with one person in a restaurant. His face is in the shadows. You know you could under-stand better if you changed seats with him. You ask to change seats. (1) almost always (2) sometimes (3) almost never Question #12 You are visiting the doctor. He tells you what to do for your illness. You do not understand his speech . You ask him to write. (1) almost always (2) sometimes (3) almost never
Journal of the American Academy of Audiology/Volume 8, Number 3, June 1997
'Question #13 You are at a meeting. The speaker does not look at you when he talks . You feel angry but do noth-ing about it . (1) almost always (2) sometimes (3) almost never Question #14 You are at a meeting. You realize you are too far from the speaker to understand . There are empty seats in the front of the room . You change your seat. (1) almost always (2) sometimes (3) almost never 'Question #15 You are at a meeting. You are the only hard-of-hearing person . You are afraid that you will not under-stand but you do not ask for help . You do the best you can. (1) almost always (2) sometimes (3) almost never Question #16 You are talking to the dentist. He speaks very fast . You cannot lipread him. You ask him to slow down . (1) almost always (2) sometimes (3) almost never Question #17 You are taking a class. The teacher talks while she writes on the board. You talk to her after class. You explain that you need to see her face in order to speechread . (1) almost always (2) sometimes (3) almost never Question #18 A speaker likes to move around the room while she lectures . You have problems reading her lips . You ask her after class to lecture from one place in the room . (1) almost always (2) sometimes (3) almost never Question #19 You are going to a series of meetings or lectures . You ask the speaker to use slides, pictures, or the overhead projector whenever possible . (1) almost always (2) sometimes (3) almost never Question #20 You are going to a series of meetings or lectures . You ask the speaker to find a person to take notes for you. (1) almost always (2) sometimes (3) almost never Question #21 You are going to a series of meetings or lectures . You ask for an outline or a reading list . (1) almost always (2) sometimes (3) almost never Question #22 You are going to a play. You read the play or reviews of the play before you see it . (1) almost always (2) sometimes (3) almost never Question #23 You are talking with a clerk at the bank . A fire truck goes by. You ask him to stop talking until the noise stops. (1) almost always (2) sometimes (3) almost never 'Question #24 You ask a person to repeat because you don't understand. He seems annoyed. You stop asking and pretend to understand . (1) almost always (2) sometimes (3) almost never Question #25 You ask a stranger for directions to a place. You really want to understand his speech. You ask very specific questions like "Is this place north or south of here?" (1) almost always (2) sometimes (3) almost never Question #26 You need to ask directions . You avoid asking a stranger because you think you will have trouble under-standing him. (1) almost always (2) sometimes (3) almost never
CSOA/Kaplan et al
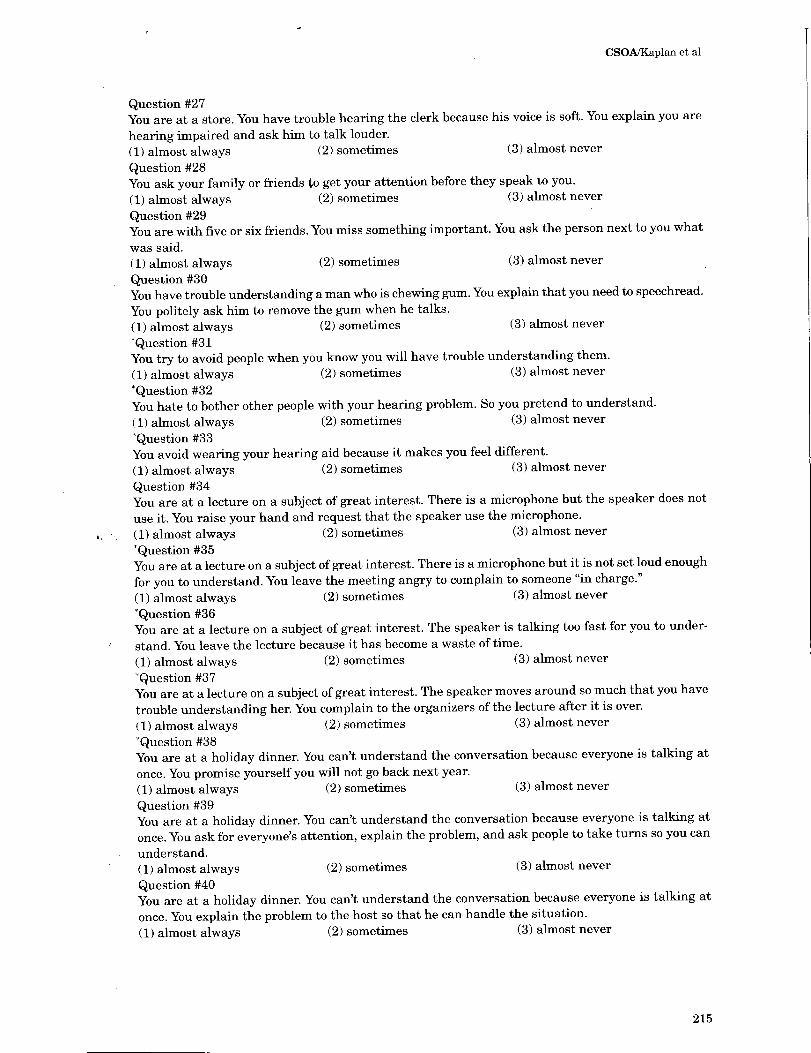
Question #27 You are at a store. You have trouble hearing the clerk because his voice is soft . You explain you are
hearing impaired and ask him to talk louder. (1) almost always (2) sometimes (3) almost never
Question #28 You ask your family or friends to get your attention before they speak to you.
(1) almost always (2) sometimes (3) almost never
Question #29 You are with five or six friends. You miss something important. You ask the person next to you what
was said . (1) almost always (2) sometimes (3) almost never
Question #30 You have trouble understanding a man who is chewing gum. You explain that you need to speechread .
You politely ask him to remove the gum when he talks. (1) almost always (2) sometimes (3) almost never
*Question #31 You try to avoid people when you know you will have trouble understanding them .
(1) almost always (2) sometimes (3) almost never
*Question #32 You hate to bother other people with your hearing problem. So you pretend to understand .
(1) almost always (2) sometimes (3) almost never
*Question #33 You avoid wearing your hearing aid because it makes you feel different.
(1) almost always (2) sometimes (3) almost never
Question #34 You are at a lecture on a subject of great interest . There is a microphone but the speaker does not
use it . You raise your hand and request that the speaker use the microphone .
(1) almost always (2) sometimes (3) almost never *Question #35 You are at a lecture on a subject of great interest . There is a microphone but it is not set loud enough
for you to understand . You leave the meeting angry to complain to someone "in charge ." (1) almost always (2) sometimes (3) almost never *Question #36 You are at a lecture on a subject of great interest . The speaker is talking too fast for you to under-
stand. You leave the lecture because it has become a waste of time .
(1) almost always (2) sometimes (3) almost never
*Question #37 You are at a lecture on a subject of great interest . The speaker moves around so much that you have
trouble understanding her. You complain to the organizers of the lecture after it is over.
(1) almost always (2) sometimes (3) almost never
*Question #38 You are at a holiday dinner. You can't understand the conversation because everyone is talking at
once . You promise yourself you will not go back next year.
(1) almost always (2) sometimes (3) almost never
Question #39 You are at a holiday dinner . You can't understand the conversation because everyone is talking at
once . You ask for everyone's attention, explain the problem, and ask people to take turns so you can
understand. (1) almost always (2) sometimes (3) almost never
Question #40 You are at a holiday dinner . You can't understand the conversation because everyone is talking at
once . You explain the problem to the host so that he can handle the situation.
(1) almost always (2) sometimes (3) almost never
Journal of the American Academy of Audiology/Volume 8, Number 3, June 1997
'Question #41 You are at a holiday dinner . You can't understand the conversation because everyone is talking at
once . However, you don't say anything because you are glad to be at the party.
(1) almost always (2) sometimes (3) almost never
Communication Attitudes
Please read each situation. Decide if the situation is true (3) almost always, (2) sometimes, or (1) almost
never; please circle the appropriate answer. PLEASE RESPOND TO EACH QUESTION .
Question #1 I feel embarrassed when I don't understand someone.
(3) almost always (2) sometimes (1) almost never
Question #2 I get upset when I can't follow a conversation . (3) almost always (2) sometimes (1) almost never
Question #3 I become angry when people do not speak clearly enough for me to understand .
(3) almost always (2) sometimes (1) almost never
Question #4 I feel stupid when I misunderstand what a person is saying .
(3) almost always (2) sometimes (1) almost never
Question #5 It's hard for me to ask someone to repeat things . I feel embarrassed.
(3) almost always (2) sometimes (1) almost never
Question #6 Most people think I could understand better if I paid more attention.
(3) almost always (2) sometimes (1) almost never
Question #7 I get angry when people speak too softly or too fast .
(3) almost always (2) sometimes (1) almost never
Question #8 Sometimes I can't follow conversations at home . I still feel part of family life .
(3) almost always (2) sometimes (1) almost never
Question #9 I feel frustrated when I try to communicate with people .
(3) almost always (2) sometimes (1) almost never
Question #10 Most people do not understand what it is like to be hard of hearing. This makes me angry.
(3) almost always (2) sometimes (1) almost never
Question #11 I am ashamed of being hearing impaired . (3) almost always (2) sometimes (1) almost never
Question #12 I get angry when someone speaks with his mouth covered or with his back to me.
(3) almost always (2) sometimes (1) almost never
Question #13 I prefer to be alone most of the time . (3) almost always (2) sometimes (1) almost never
Question #14 My hearing loss makes me nervous . (3) almost always (2) sometimes (1) almost never
Question #15 My hearing loss makes me depressed. (3) almost always (2) sometimes (1) almost never
CSOA/Kaplan et al
Question #16 My family does not understand my hearing loss . (3) almost always (2) sometimes (1) almost never Question #17 I get annoyed when people shout at me because I have a hearing loss . (3) almost always (2) sometimes (1) almost never Question #18 People treat me like a stupid person when I don't understand their speech . (3) almost always (2) sometimes (1) almost never Question #19 Hard-of-hearing and hearing people often have difficulty communicating. It is only the responsibil-
ity of the hearing person to improve communication. (3) almost always (2) sometimes (1) almost never Question #20 Hard-of-hearing and hearing people often have difficulty communicating. It is only the responsibil-
ity of the hard-of-hearing person to improve communication. (3) almost always (2) sometimes (1) almost never
Question #21 Members of my family get annoyed when I have trouble understanding them .
(3) almost always (2) sometimes (1) almost never
Question #22 People who know I have a hearing loss think I can hear when I want to . (3) almost always (2) sometimes (1) almost never
Question #23 Members of my family leave me out of conversations. (3) almost always (2) sometimes (1) almost never
*Question #24 Hearing aids don't always help people understand speech but they can help in other ways .
(3) almost always (2) sometimes (1) almost never *Question #25 I feel speechreading (lipreading) is helpful to me. (3) almost always (2) sometimes (1) almost never
Question #26 Even though people know I have a hearing loss, they don't help me by speaking clearly or repeat-
ing. (3) almost always (2) sometimes (1) almost never
*Question #27 My family is willing to make telephone calls for me. (3) almost always (2) sometimes (1) almost never
*Question #28 My family is willing to repeat as often as necessary when I don't understand them.
(3) almost always (2) sometimes (1) almost never
Question #29 Hearing people get frustrated when I don't understand what they say. (3) almost always (2) sometimes (1) almost never
*Question #30 Members of my family make it easy for me to speechread them. (3) almost always (2) sometimes (1) almost never
*Question #31 Strangers make it easy for me to speechread them. (3) almost always (2) sometimes (1) almost never
The response format for the 5-point scale is (1) always, (2) almost always, (3) sometimes, (4) almost never, (5) never. *Need for reversed scoring .