FDIC QUARTERLY 41 Introduction An increase in mergers and a dearth of new charters in the post-crisis period have renewed interest among researchers in banking industry consolidation. The rate of voluntary attri- tion increased sharply following the financial crisis as a wave of post-crisis failures receded. Voluntary attrition increased from 2.2 percent of existing charters per year in 2009 to a 15-year high of 4.9 percent in 2015 (Chart 1). 1 Nearly all of the increase in attrition represents voluntary mergers between unaffiliated institutions. The vast majority of merger participants are community banks (91 percent). 2 However, community banks make up the vast majority of institutions (92 percent). In fact, the propor- tion of community banks among total banking charters has actually increased since 1985 and remains stable today. 1985 Voluntary Mergers Have Increased Since the Crisis Annual Rates of Voluntary Attrition, 1985 to 2016, as a Percentage of Charters Reporting at Previous Year-End Source: FDIC. Percent Other Closings Intracompany Consolidation of Charters Voluntary Intercompany Mergers -9 -8 -7 -6 -5 -4 -3 -2 -1 0 1988 1991 1994 1997 2000 2003 2006 2009 2012 Average: 1985 to 1992 –3.3 Average: 1993 to 2001 –5.4 Average: 2002 to 2015 –3.5 : –4.3 –4.9 –4.2 2016 Chart 1 Community banks also make up the vast majority of merger participants on both sides of the deal. Most community banks that are acquired merge with other community banks (Chart 2), which results in a community banking sector composed of somewhat larger institutions that continue to provide essential financial services within a limited geographic market. This analysis extends the research of Kowalik et al. that compared acquired community banks with nonacquired community banks. 3 We refine other researchers’ definitions of community banks by applying the FDIC’s functional definition, and we control for asset size, geography, and lending specialty in selecting the peers of acquired banks. Using the refined definitions of community banks and peers of acquired banks, we compare community banks acquired between 2010 and 2016 with their peers using key metrics of financial performance, credit quality, and balance sheet structure. Past research on bank mergers has examined acquirer motives, explored characteristics that increase the value of an institution to an acquirer, compared acquired banks with their acquirers, and compared acquired banks with nonacquired peers. 4 COMMUNITY BANK MERGERS SINCE THE FINANCIAL CRISIS: HOW ACQUIRED COMMUNITY BANKS COMPARED WITH THEIR PEERS 1 Voluntary attrition includes mergers between unaffiliated institutions (intercompany mergers), consolidation of charters within the same holding company (intracompany mergers), liquidations not involving an acquisition, and institutions relinquishing FDIC insurance. The latter two events are not common, accounting for an average of 0.1 percent of institutions per year between 1985 and 2016. 2 For the FDIC’s definition of community bank, see Chapter 1 of the FDIC Community Banking Study (2012), https://www.fdic.gov/regulations/resources/cbi/study.html. 3 Michal Kowalik, Troy Davig, Charles S. Morris, and Kristen Regehr, “Bank Consolidation and Merger Activity Following the Crisis,” Federal Reserve Bank of Kansas City Economic Review 100, no. 1 (2015): 31–49. 4 “Bank” means any FDIC-insured bank or thrift.
Transcript
FDIC QUARTERLY 41
Introduction An increase in mergers and a dearth of new charters in the post-crisis period have renewed
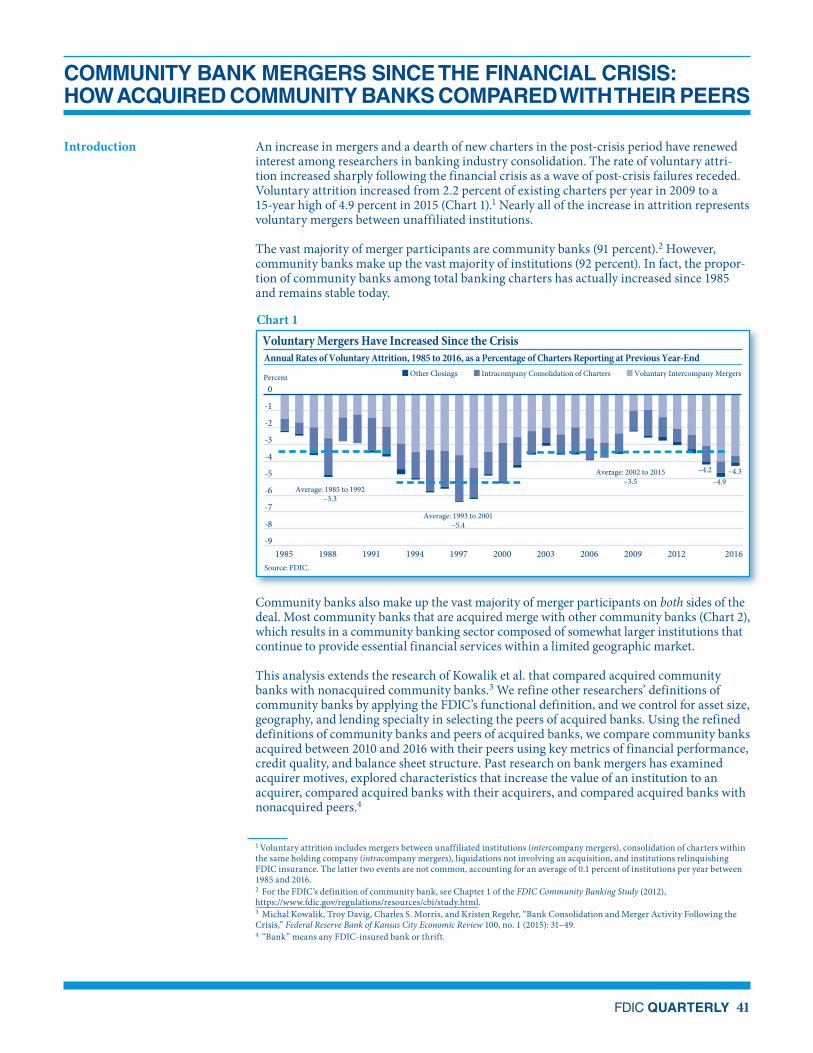
interest among researchers in banking industry consolidation. The rate of voluntary attri-tion increased sharply following the financial crisis as a wave of post-crisis failures receded. Voluntary attrition increased from 2.2 percent of existing charters per year in 2009 to a 15-year high of 4.9 percent in 2015 (Chart 1).1 Nearly all of the increase in attrition represents voluntary mergers between unaffiliated institutions.
The vast majority of merger participants are community banks (91 percent).2 However, community banks make up the vast majority of institutions (92 percent). In fact, the propor-tion of community banks among total banking charters has actually increased since 1985 and remains stable today.
1985
Voluntary Mergers Have Increased Since the CrisisAnnual Rates of Voluntary Attrition, 1985 to 2016, as a Percentage of Charters Reporting at Previous Year-End
Source: FDIC.
Percent Other Closings Intracompany Consolidation of Charters Voluntary Intercompany Mergers
-9
-8
-7
-6
-5
-4
-3
-2
-1
0
1988 1991 1994 1997 2000 2003 2006 2009 2012
Average: 1985 to 1992–3.3
Average: 1993 to 2001–5.4
Average: 2002 to 2015–3.5
: –4.3–4.9
–4.2
2016
Chart 1
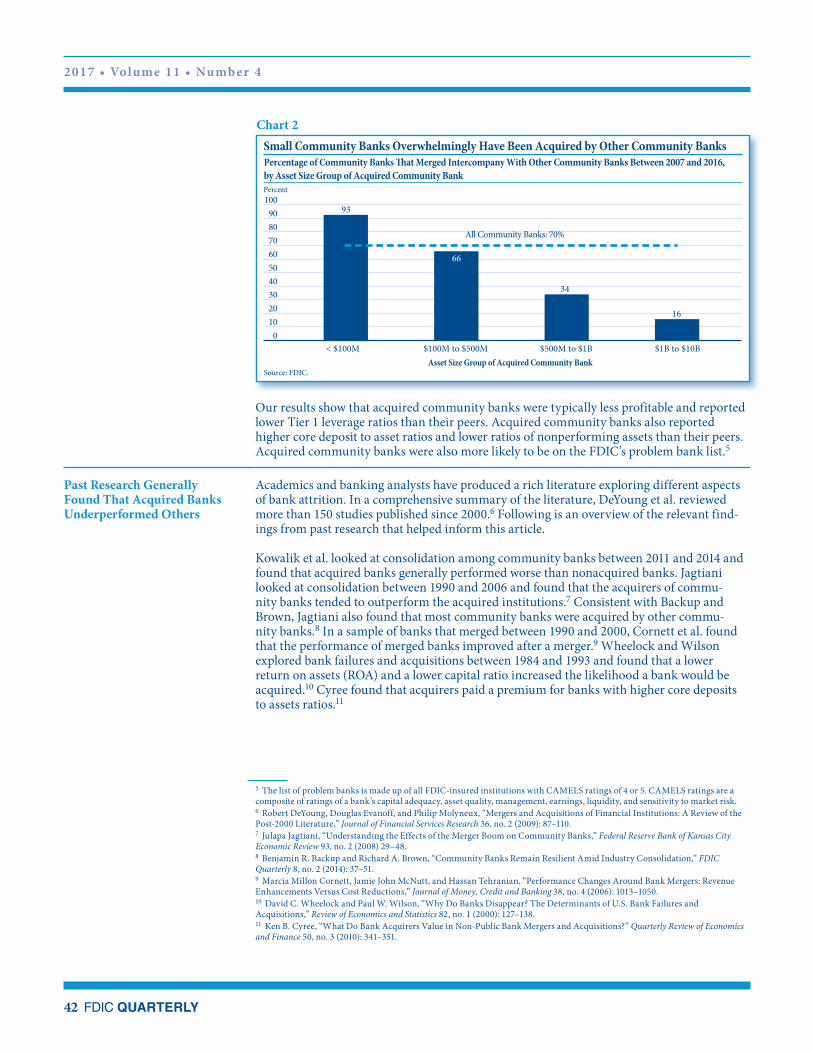
Community banks also make up the vast majority of merger participants on both sides of the deal. Most community banks that are acquired merge with other community banks (Chart 2), which results in a community banking sector composed of somewhat larger institutions that continue to provide essential financial services within a limited geographic market.
This analysis extends the research of Kowalik et al. that compared acquired community banks with nonacquired community banks.3 We refine other researchers’ definitions of community banks by applying the FDIC’s functional definition, and we control for asset size, geography, and lending specialty in selecting the peers of acquired banks. Using the refined definitions of community banks and peers of acquired banks, we compare community banks acquired between 2010 and 2016 with their peers using key metrics of financial performance, credit quality, and balance sheet structure. Past research on bank mergers has examined acquirer motives, explored characteristics that increase the value of an institution to an acquirer, compared acquired banks with their acquirers, and compared acquired banks with nonacquired peers.4
COMMUNITY BANK MERGERS SINCE THE FINANCIAL CRISIS:HOW ACQUIRED COMMUNITY BANKS COMPARED WITH THEIR PEERS
1 Voluntary attrition includes mergers between unaffiliated institutions (intercompany mergers), consolidation of charters within the same holding company (intracompany mergers), liquidations not involving an acquisition, and institutions relinquishing FDIC insurance. The latter two events are not common, accounting for an average of 0.1 percent of institutions per year between 1985 and 2016.2 For the FDIC’s definition of community bank, see Chapter 1 of the FDIC Community Banking Study (2012), https://www.fdic.gov/regulations/resources/cbi/study.html.3 Michal Kowalik, Troy Davig, Charles S. Morris, and Kristen Regehr, “Bank Consolidation and Merger Activity Following the Crisis,” Federal Reserve Bank of Kansas City Economic Review 100, no. 1 (2015): 31–49.4 “Bank” means any FDIC-insured bank or thrift.
Small Community Banks Overwhelmingly Have Been Acquired by Other Community BanksPercentage of Community Banks �at Merged Intercompany With Other Community Banks Between 2007 and 2016, by Asset Size Group of Acquired Community Bank
Source: FDIC.
93
34
16
0102030405060708090
100
< $100M $100M to $500M $500M to $1B $1B to $10BAsset Size Group of Acquired Community Bank
All Community Banks: 70%
Percent
66
Chart 2
Our results show that acquired community banks were typically less profitable and reported lower Tier 1 leverage ratios than their peers. Acquired community banks also reported higher core deposit to asset ratios and lower ratios of nonperforming assets than their peers. Acquired community banks were also more likely to be on the FDIC’s problem bank list.5
Past Research Generally Found That Acquired Banks Underperformed Others
Academics and banking analysts have produced a rich literature exploring different aspects of bank attrition. In a comprehensive summary of the literature, DeYoung et al. reviewed more than 150 studies published since 2000.6 Following is an overview of the relevant find-ings from past research that helped inform this article.
Kowalik et al. looked at consolidation among community banks between 2011 and 2014 and found that acquired banks generally performed worse than nonacquired banks. Jagtiani looked at consolidation between 1990 and 2006 and found that the acquirers of commu-nity banks tended to outperform the acquired institutions.7 Consistent with Backup and Brown, Jagtiani also found that most community banks were acquired by other commu-nity banks.8 In a sample of banks that merged between 1990 and 2000, Cornett et al. found that the performance of merged banks improved after a merger.9 Wheelock and Wilson explored bank failures and acquisitions between 1984 and 1993 and found that a lower return on assets (ROA) and a lower capital ratio increased the likelihood a bank would be acquired.10 Cyree found that acquirers paid a premium for banks with higher core deposits to assets ratios.11
5 The list of problem banks is made up of all FDIC-insured institutions with CAMELS ratings of 4 or 5. CAMELS ratings are a composite of ratings of a bank’s capital adequacy, asset quality, management, earnings, liquidity, and sensitivity to market risk.6 Robert DeYoung, Douglas Evanoff, and Philip Molyneux, “Mergers and Acquisitions of Financial Institutions: A Review of the Post-2000 Literature,” Journal of Financial Services Research 36, no. 2 (2009): 87–110.7 Julapa Jagtiani, “Understanding the Effects of the Merger Boom on Community Banks,” Federal Reserve Bank of Kansas City Economic Review 93, no. 2 (2008) 29–48.8 Benjamin R. Backup and Richard A. Brown, “Community Banks Remain Resilient Amid Industry Consolidation,” FDIC Quarterly 8, no. 2 (2014): 37–51.9 Marcia Millon Cornett, Jamie John McNutt, and Hassan Tehranian, “Performance Changes Around Bank Mergers: Revenue Enhancements Versus Cost Reductions,” Journal of Money, Credit and Banking 38, no. 4 (2006): 1013–1050.10 David C. Wheelock and Paul W. Wilson, “Why Do Banks Disappear? The Determinants of U.S. Bank Failures and Acquisitions,” Review of Economics and Statistics 82, no. 1 (2000): 127–138.11 Ken B. Cyree, “What Do Bank Acquirers Value in Non-Public Bank Mergers and Acquisitions?” Quarterly Review of Economics and Finance 50, no. 3 (2010): 341–351.
FDIC QUARTERLY 43
C OM M U N I T Y BA N K M E RG E R S SI NC E T H E F I NA NC IA L C R I SI S
The authors above used several methods to compare acquired banks with other institutions. Kowalik et al. compared acquired banks with all nonacquired banks. Jagtiani compared acquired banks with their acquirers. Cornett et al. compared their sample of banks with others located in the same Federal Reserve district and asset size class. Wheelock and Wilson used a statistical method that compared banks that failed or were acquired with those that were not. Finally, Cyree included adjustments to control for industrywide trends.
Applying the FDIC’s Community Bank Definition and Refining the Definition of Peer
We analyzed community bank mergers that occurred between 2010 and 2016. These merg-ers occurred between institutions that were not part of the same bank holding company as of one year before the merger. We used the FDIC’s functional definition of community bank to select both the acquired institutions and their peers. This definition goes beyond asset size to take into account the activities and geographic scope of an institution. In using this definition, we excluded from our analysis small institutions whose primary business model is not based on local deposit gathering and lending, while we retained somewhat larger institutions whose business model is just that. Using this definition provides a more precise picture of community bank mergers than using a definition of community banks based solely on asset size.
We refined the definition of peer institutions so that each comparison group closely matched the acquired community bank.12 In addition to the requirement that the acquired banks and their peers were community banks and were similar in asset size, the acquired banks and their peers also belonged to the same lending specialty group and were headquartered in the same type of area: metropolitan (metro) or nonmetropolitan (nonmetro).13 Controlling for size improved the accuracy of financial performance comparisons, as certain performance ratios correlate with asset size. We applied the same logic to lending specialty groups, as business model plays an important role in performance ratios.14 For example, earnings at agricultural-lending specialists tend to be higher than earnings among mortgage-lending specialists. Controlling for lending specialty also accounted for discrepancies between lend-ing specialty group performance associated with the Great Recession. Finally, we controlled for geography to account for regional differences in performance.
Once we matched the acquired community banks to groups of like peers, we compared their financial performance, credit quality, and balance sheets as of a year before the merger. We compared pretax ROA, net interest margin (NIM), noninterest income as a percentage of average assets, and the efficiency ratio to explore differences in financial performance. We used net charge-off rates and the nonperforming asset ratio to compare credit quality.15 To compare balance sheets, we explored differences in the Tier 1 leverage ratio, the loan-to-assets ratio, and core deposits as a percentage of assets. We calculated flow items, such as the efficiency ratio, over four quarters ending one year before the merger. We calculated stock items, such as the loan-to-asset ratio, as of one year before the merger.
12 See the Appendix for a detailed description of the peer selection criteria.13 The U.S. Office of Management and Budget designates clusters of counties as metropolitan statistical areas (MSAs) based on the population size of the urban cores and on socioeconomic integration. MSAs have an urban core of at least 50,000 people. Counties outside of MSAs are nonmetropolitan.14 Lending specialty groups include commercial real estate, commercial and industrial, agricultural, mortgage, consumer, multi-specialists, and no lending specialty. See Chapter 5 of the FDIC Community Banking Study (2012), https://www.fdic.gov/regulations/resources/cbi/study.html.15 The nonperforming asset ratio is defined as all past-due and nonaccrual loans and leases, plus other real estate owned, as a share of total assets.
For each ratio, we performed a sign test to determine if the median difference between the acquired banks and their peers was statistically significant.16 A median difference that was statistically significant and positive suggested that acquired banks had higher values of the ratio compared with peers. A median difference that was statistically significant and nega-tive suggested that acquired banks had lower values compared with peers. We compared acquired banks and peers across three dimensions: the overall sample of acquired banks and peers, acquired banks and peers by type of area, and acquired banks and peers by lending specialty group.
Our Sample of Acquired Banks
Between 2010 and 2016, 1,106 community banks were acquired. We excluded 139 banks (12.6 percent) from this population, which brought the final count of community banks analyzed to 967. We excluded 118 of the 139 institutions because we found no peers for them using our refined definition of peer. The remaining 21 banks were excluded because they acquired another institution within two years of their own acquisition.
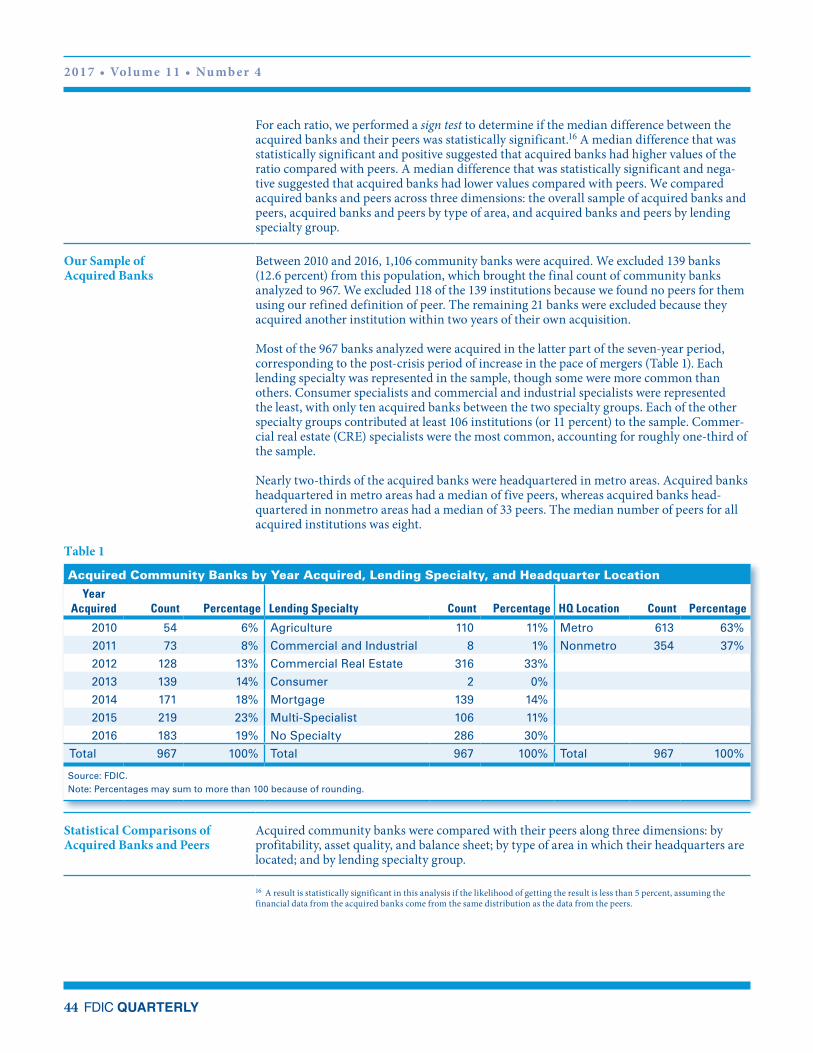
Most of the 967 banks analyzed were acquired in the latter part of the seven-year period, corresponding to the post-crisis period of increase in the pace of mergers (Table 1). Each lending specialty was represented in the sample, though some were more common than others. Consumer specialists and commercial and industrial specialists were represented the least, with only ten acquired banks between the two specialty groups. Each of the other specialty groups contributed at least 106 institutions (or 11 percent) to the sample. Commer-cial real estate (CRE) specialists were the most common, accounting for roughly one-third of the sample.
Nearly two-thirds of the acquired banks were headquartered in metro areas. Acquired banks headquartered in metro areas had a median of five peers, whereas acquired banks head-quartered in nonmetro areas had a median of 33 peers. The median number of peers for all acquired institutions was eight.
Table 1
Acquired Community Banks by Year Acquired, Lending Specialty, and Headquarter Location
Source: FDIC.Note: Percentages may sum to more than 100 because of rounding.
Statistical Comparisons of Acquired Banks and Peers
Acquired community banks were compared with their peers along three dimensions: by profitability, asset quality, and balance sheet; by type of area in which their headquarters are located; and by lending specialty group.
16 A result is statistically significant in this analysis if the likelihood of getting the result is less than 5 percent, assuming the financial data from the acquired banks come from the same distribution as the data from the peers.
FDIC QUARTERLY 45
C OM M U N I T Y BA N K M E RG E R S SI NC E T H E F I NA NC IA L C R I SI S
Overall Comparisons of Acquired Banks and Their Peers
Acquired banks underperformed on measures of profitability, reported better asset quality, and reported balance sheets that differed from those of their peers. All of these differences were statistically significant. We discuss each in turn.
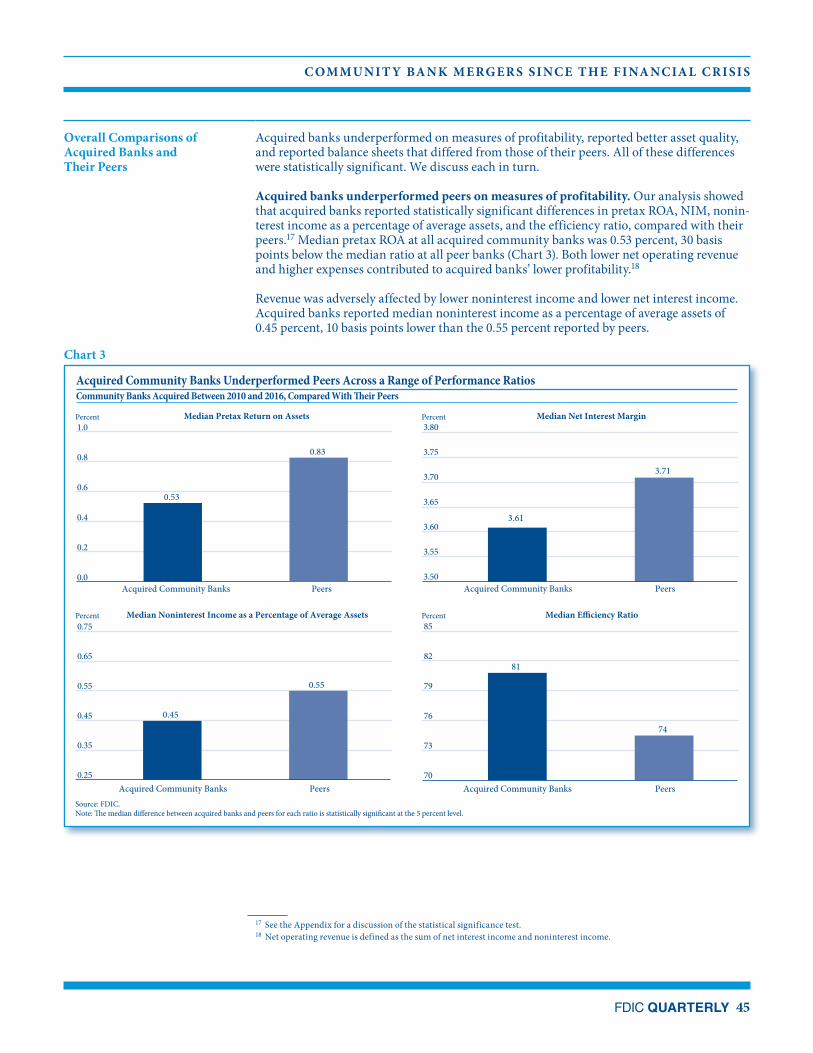
Acquired banks underperformed peers on measures of profitability. Our analysis showed that acquired banks reported statistically significant differences in pretax ROA, NIM, nonin-terest income as a percentage of average assets, and the efficiency ratio, compared with their peers.17 Median pretax ROA at all acquired community banks was 0.53 percent, 30 basis points below the median ratio at all peer banks (Chart 3). Both lower net operating revenue and higher expenses contributed to acquired banks’ lower profitability.18
Revenue was adversely affected by lower noninterest income and lower net interest income. Acquired banks reported median noninterest income as a percentage of average assets of 0.45 percent, 10 basis points lower than the 0.55 percent reported by peers.
81
74
70
73
76
79
82
85
Acquired Community Banks Peers
Percent
Acquired Community Banks Underperformed Peers Across a Range of Performance RatiosCommunity Banks Acquired Between 2010 and 2016, Compared With �eir Peers
Percent
Percent Percent
Source: FDIC.Note: �e median di�erence between acquired banks and peers for each ratio is statistically signi�cant at the 5 percent level.
Median Pretax Return on Assets Median Net Interest Margin
Median Noninterest Income as a Percentage of Average Assets Median E�ciency Ratio
0.53
0.83
0.0
0.2
0.4
0.6
0.8
1.0
Acquired Community Banks Peers
3.61
3.71
3.50
3.55
3.60
3.65
3.70
3.75
3.80
Acquired Community Banks Peers
0.45
0.55
0.25
0.35
0.45
0.55
0.65
0.75
Acquired Community Banks Peers
Chart 3
17 See the Appendix for a discussion of the statistical significance test.18 Net operating revenue is defined as the sum of net interest income and noninterest income.
2017 • Volume 11 • Number 4
46 FDIC QUARTERLY
Net interest income of acquired banks as a share of average assets was also below that of peers: a median of 3.31 percent at acquired banks, compared with 3.41 percent at peer insti-tutions. Underperformance was highlighted by two factors. First, acquired banks reported NIM below peers. The median NIM at acquired banks was 3.61 percent, 10 basis points below the peer median of 3.71 percent. Second, acquired institutions reported a slightly smaller earnings base—defined as earning assets as a share of total assets—than peers. The median earnings base at acquired banks was 92.7 percent, compared with 93.5 percent at peers. The combination of lower margins and lower shares of earning assets led to the under-performance in net interest income as a share of assets.
A smaller earnings base among acquired banks compared with their peers also contributed to the fourth underperforming profitability metric shown in Chart 3—the efficiency ratio.19 Acquired banks were far less efficient than peers and reported a median efficiency ratio of 81 percent, compared with just 74 percent at peers. Efficiency ratios increase as expenses rise, net operating revenue declines, or some combination of the two. Our analysis showed that the higher efficiency ratios of acquired banks resulted primarily from lower revenues, while higher expenses played a smaller role.
Asset quality at acquired banks was better than at peers. While acquired banks under-performed peers on measures of profitability, they had stronger asset quality than peers. Chart 4 shows acquired banks reported a lower net charge-off ratio and nonperforming asset ratio than peers.
Our results regarding asset quality differed from those reported in Kowalik et al. One possi-ble reason for this difference is that we used the FDIC’s community bank definition, which resulted in a different sample of acquired institutions and peers. Another possible reason is that our peer group definition differed from that used by other researchers. For example, we did not include all nonacquired community banks in our peer group definition, as other researchers did.
Acquired Community Banks Reported Stronger Asset Quality �an Did PeersCommunity Banks Acquired Between 2010 and 2016, Compared With �eir Peers
Source: FDIC.Note: �e median di�erence between acquired banks and peers for each ratio is statistically signi�cant at the 5 percent level.
Percent PercentMedian Net Charge-O� Ratio Median Nonperforming Asset Ratio
Acquired Community Banks Peers Acquired Community Banks Peers
0.23
0.33
0.00
0.10
0.20
0.30
0.40
0.50
1.22
1.44
1.10
1.15
1.20
1.25
1.30
1.35
1.40
1.45
1.50
Chart 4
19 The efficiency ratio is defined as noninterest expense as a share of net operating revenue. Higher values indicate an institution is less efficient.
FDIC QUARTERLY 47
C OM M U N I T Y BA N K M E RG E R S SI NC E T H E F I NA NC IA L C R I SI S
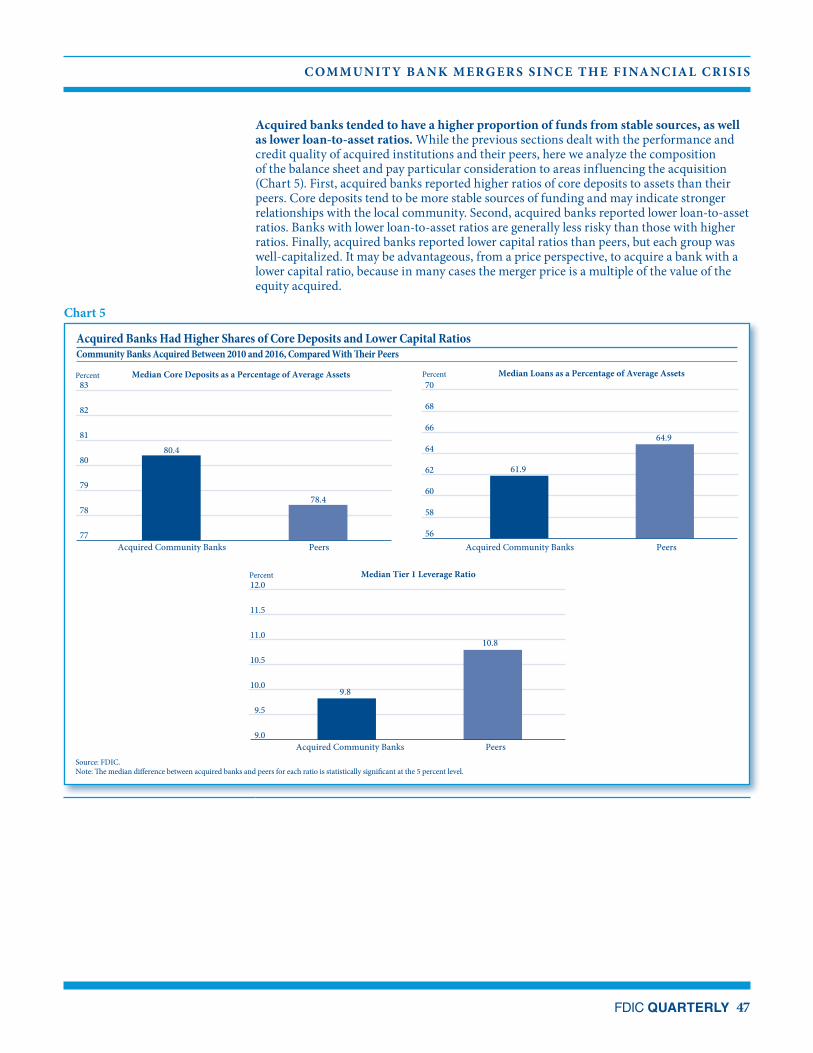
Acquired banks tended to have a higher proportion of funds from stable sources, as well as lower loan-to-asset ratios. While the previous sections dealt with the performance and credit quality of acquired institutions and their peers, here we analyze the composition of the balance sheet and pay particular consideration to areas influencing the acquisition (Chart 5). First, acquired banks reported higher ratios of core deposits to assets than their peers. Core deposits tend to be more stable sources of funding and may indicate stronger relationships with the local community. Second, acquired banks reported lower loan-to-asset ratios. Banks with lower loan-to-asset ratios are generally less risky than those with higher ratios. Finally, acquired banks reported lower capital ratios than peers, but each group was well-capitalized. It may be advantageous, from a price perspective, to acquire a bank with a lower capital ratio, because in many cases the merger price is a multiple of the value of the equity acquired.
Percent
Acquired Banks Had Higher Shares of Core Deposits and Lower Capital RatiosCommunity Banks Acquired Between 2010 and 2016, Compared With �eir Peers
Percent Percent
Source: FDIC.Note: �e median di�erence between acquired banks and peers for each ratio is statistically signi�cant at the 5 percent level.
Median Tier 1 Leverage Ratio
Median Core Deposits as a Percentage of Average Assets Median Loans as a Percentage of Average Assets
Acquired Community Banks Peers
Acquired Community Banks Peers Acquired Community Banks Peers
9.8
10.8
9.0
9.5
10.0
10.5
11.0
11.5
12.0
80.4
78.4
77
78
79
80
81
82
83
61.9
64.9
56
58
60
62
64
66
68
70
Chart 5
2017 • Volume 11 • Number 4
48 FDIC QUARTERLY
Comparisons Within Metro and Nonmetro Locations
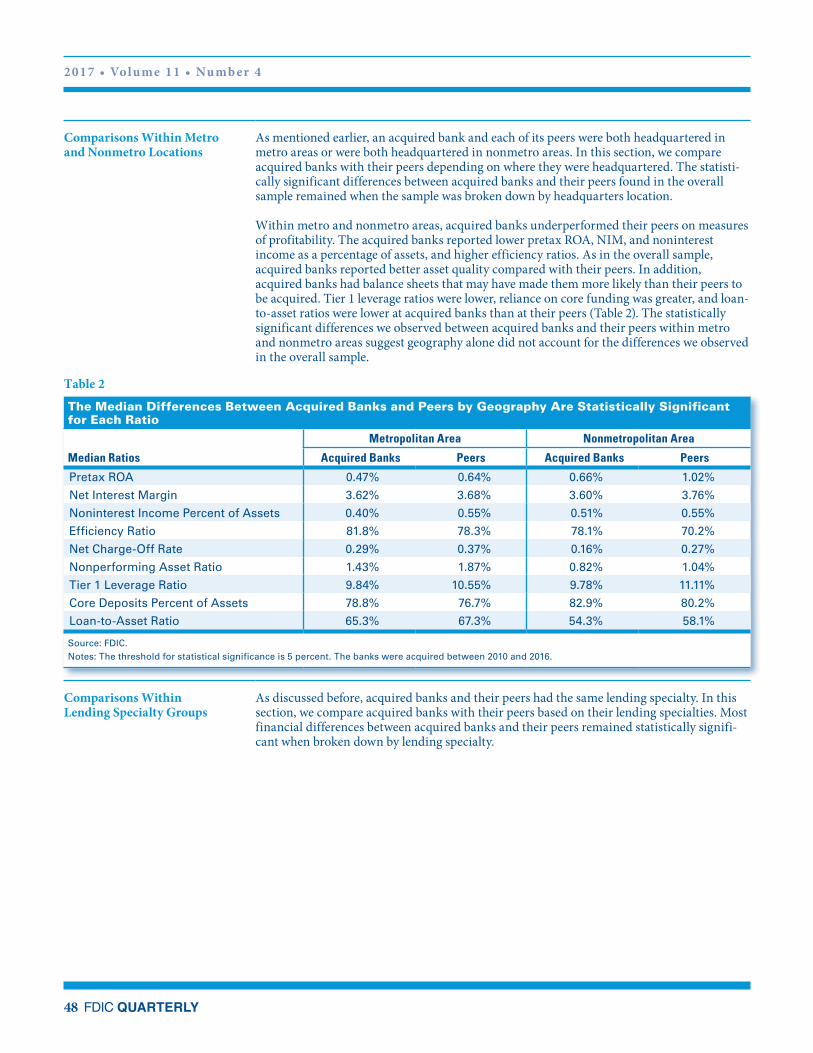
As mentioned earlier, an acquired bank and each of its peers were both headquartered in metro areas or were both headquartered in nonmetro areas. In this section, we compare acquired banks with their peers depending on where they were headquartered. The statisti-cally significant differences between acquired banks and their peers found in the overall sample remained when the sample was broken down by headquarters location.
Within metro and nonmetro areas, acquired banks underperformed their peers on measures of profitability. The acquired banks reported lower pretax ROA, NIM, and noninterest income as a percentage of assets, and higher efficiency ratios. As in the overall sample, acquired banks reported better asset quality compared with their peers. In addition, acquired banks had balance sheets that may have made them more likely than their peers to be acquired. Tier 1 leverage ratios were lower, reliance on core funding was greater, and loan-to-asset ratios were lower at acquired banks than at their peers (Table 2). The statistically significant differences we observed between acquired banks and their peers within metro and nonmetro areas suggest geography alone did not account for the differences we observed in the overall sample.
Table 2
The Median Differences Between Acquired Banks and Peers by Geography Are Statistically Significant for Each Ratio
Median Ratios
Metropolitan Area Nonmetropolitan Area
Acquired Banks Peers Acquired Banks Peers
Pretax ROA 0.47% 0.64% 0.66% 1.02%
Net Interest Margin 3.62% 3.68% 3.60% 3.76%
Noninterest Income Percent of Assets 0.40% 0.55% 0.51% 0.55%
Efficiency Ratio 81.8% 78.3% 78.1% 70.2%
Net Charge-Off Rate 0.29% 0.37% 0.16% 0.27%
Nonperforming Asset Ratio 1.43% 1.87% 0.82% 1.04%
Tier 1 Leverage Ratio 9.84% 10.55% 9.78% 11.11%
Core Deposits Percent of Assets 78.8% 76.7% 82.9% 80.2%
Loan-to-Asset Ratio 65.3% 67.3% 54.3% 58.1%
Source: FDIC.Notes: The threshold for statistical significance is 5 percent. The banks were acquired between 2010 and 2016.
Comparisons Within Lending Specialty Groups
As discussed before, acquired banks and their peers had the same lending specialty. In this section, we compare acquired banks with their peers based on their lending specialties. Most financial differences between acquired banks and their peers remained statistically signifi-cant when broken down by lending specialty.
FDIC QUARTERLY 49
C OM M U N I T Y BA N K M E RG E R S SI NC E T H E F I NA NC IA L C R I SI S
The results we discussed in the preceding two sections remained broadly unchanged when we analyzed acquired banks and their peers by lending specialty. Acquired banks tended to underperform their peers on measures of profitability, report better asset quality, and report different balance sheet structures. Financial underperformance among the acquired banks compared with their peers was concentrated in agricultural-lending specialists, mortgage-lending specialists, and banks with no lending specialty. However, the differences between acquired bank and peer pretax ROA were statistically significant at institutions of every specialty except CRE. Credit quality differences between acquired banks and their peers appeared to be driven primarily by agricultural-lending specialists, CRE lenders, and banks with no lending specialty. Differences in balance sheet structure between acquired banks and their peers were most prominent among agricultural-lending specialists, CRE lenders, and banks with no lending specialty. Acquired banks and their peers were most similar among mortgage lenders and multi-specialists (Table 3).
These results suggest that controlling for lending specialty is important for determining whether genuine differences exist in financial performance, asset quality, and balance sheet structure between acquired banks and their peers.
Table 3
Summary of Comparisons and Statistical Significance: Median Ratios From Acquired Banks and Peers by Lending Specialty
Median Ratios
AgricultureCommercial Real Estate Mortgage Multi-Specialist No Specialty
Source: FDIC.Notes: For highlighted ratios, the median difference between acquired banks and peers is significant at the 5 percent level. The banks were acquired between 2010 and 2016.
2017 • Volume 11 • Number 4
50 FDIC QUARTERLY
Conclusion The results of this research are consistent with past findings that acquired community banks generally underperform their peers. The only exception is that acquired institutions reported stronger asset quality than their peers, particularly among agricultural and CRE lending specialists. The balance sheets of acquired banks showed a greater reliance on core funding and a lower loan-to-assets ratio, which suggest a less-risky asset mix and an institution with strong community ties.
Our results cannot be disassociated from the post-crisis environment. Prominent among the concerns of community banks in the post-crisis period were asset quality and low net interest margins, which influenced merger decisions. How these results were influenced by economic conditions is an area for future research.
The peer group methodology in this research can be applied to other analyses compar-ing groups of banks. Financial institutions, even community banks, differ widely. Future research could use peer group criteria to compare acquirers with peers, both before and after acquisition.
Authors:
Eric C. Breitenstein Economic Analyst Division of Insurance and Research
Nathan L. Hinton Economic Analyst Division of Insurance and Research
FDIC QUARTERLY 51
C OM M U N I T Y BA N K M E RG E R S SI NC E T H E F I NA NC IA L C R I SI S
Appendix:Matching Methodology
This is an observational study of FDIC-insured community banks that were voluntarily acquired by unaffiliated institutions between 2010 and 2016. We compare them with a sample of peers that were chosen based on their similarity to the acquired institutions.
Both the acquired banks and peers met the following criteria as of one year before the acquisition:
• Were community banks 20
• Were chartered more than three years earlier
• Had the same lending specialty 21
• Were headquartered in one of the 50 states or the District of Columbia, and were both headquartered within metropolitan areas or were both headquartered outside of metro-politan areas:
– If both were headquartered in metropolitan areas, the headquarters of the banks were within 100 miles of each other.
– If both were headquartered outside of metropolitan areas, the headquarters of the banks were within 300 miles of each other.
• Asset size criteria:
– For acquired banks that had less than $100 million in assets, the asset size of the peer had to be within $50 million.
– For acquired banks that had $100 million in assets or more, the asset size of the peer had to be within 50 percent of the acquired bank’s asset size.
• Neither the acquired banks nor their peers had themselves purchased any other banks during the two years before the merger of the acquired bank.
Finally, peer banks must have continued to file Call Reports for at least one year following the acquisition of the bank of which they were peers.
Although our results indicate that statistically significant differences exist between acquired banks and their peers, this does not mean that acquisitions have caused such differences. For example, while we attempted to control for geographic differences in economic perfor-mance by ensuring that acquired banks and their peers were headquartered near each other, acquired banks may be likely to do more business in economically struggling areas relative to their peers.
20 For the FDIC’s definition of community bank, see Chapter 1 of the FDIC Community Banking Study (2012), https://www.fdic.gov/regulations/resources/cbi/study.html.21 Lending specialty groups include commercial real estate, commercial and industrial, agricultural, mortgage, consumer, multi-specialist, and no lending specialty. See Chapter 5 of the FDIC Community Banking Study (2012), https://www.fdic.gov/regulations/resources/cbi/study.html.
Data We calculated flow variables over the four quarters ended one year before the acquisition. We also calculated five-quarter averages of assets, earning assets, and gross loans and leases based on the five quarters ended one year before the acquisition. We then divided the annual flow item by the appropriate average. For acquired banks with multiple peers, the peers’ financial data were aggregated to create one weighted average. The variables pretax return on assets, net interest margin, noninterest income, efficiency ratio, and net charge-off rate were constructed in this manner.
We measured stock variables as of one year before the acquisition and included the nonper-forming asset ratio, Tier 1 leverage ratio, core deposit ratio, and loan-to-asset ratio. For acquired banks with multiple peers, the peers’ financial data were aggregated to create one weighted average.
Once we calculated financial ratios for each acquired bank and its aggregate peer, we calcu-lated the difference between them. We performed a statistical test on these paired differences to determine whether the acquired banks performed better or worse than their peers.
Statistical Test We used the sign test on the paired differences in the financial ratios described above to determine whether the performance of acquired banks was statistically different from the performance of their peers. The sign test is used to determine whether the distribution of data from one group differs from that of another, when the variable of interest does not follow a normal distribution and is also skewed. If the test shows that the distributions of data from acquired banks and peers are different, then we have reason to believe that their performance is different.22 For each test, our threshold for statistical significance is 5 percent.
22 See Dennis D. Wackerly, William Mendenhall III, and Richard L. Scheaffer, Mathematical Statistics With Applications, 7th ed., Brooks/Cole (2008).