107
Community Forestry in Myanmar: Progress & Potentials Kyaw Tint, Oliver Springate-Baginski and Mehm Ko Ko Gyi

Community Forestry in Myanmar:
Progress & Potentials Kyaw Tint, Oliver Springate-Baginski and Mehm Ko Ko Gyi


i
Community Forestry in Myanmar:
Progress & Potentials
Kyaw Tint, Oliver Springate-Baginski and Mehm Ko Ko Gyi
1 Ecosystem Conservation and Community Development Initiative, Yangon, Myanmar
2 School of International Development, University of East Anglia, UK
August 2011 - [A4 format version]

ii
About the authors:
Dr. Kyaw Tint: Professor of Forestry and Director-General of the Forest Department (retired), Republic
of the Union of Myanmar- specialized in forest inventory and management, and growth and yield
modelling. Currently chairman of ECCDI and MERN (Mangrove and Environmental Rehabilitation
Network). Email: [email protected]
Dr. Oliver Springate-Baginski: Lecturer in Natural Resources at the School of International
Development, University of East Anglia, UK; specialising in integrated forest governance, tenure reform
and community forestry particularly in South and South East Asia. Email: [email protected]
Mr. Mehm Ko Ko Gyi: Director (retired), Forest Department, Republic of the Union of Myanmar and
former Teaknet Coordinator, Asia-Pacific Region- specialized in teak silviculture. Currently vice-
chairman of ECCDI. Email: [email protected]
Acknowledgements
Our highest gratitude and sincerest thanks go to the many local women and men, both FUG members
and others, who have made this study possible by generously giving their time and energies to cooperate
with us. Thanks for welcoming us, explaining their experiences, and patiently putting up with the endless
questions. We hope our study goes some way to justify their efforts.
We are also very grateful to the many Forest Department headquarters and township staff who helped.
Special thanks go to U Aye Myint Maung, Director-General of the Forest Department, Ministry of
Forestry for his support and encouragement. Special thanks also to U Win Maung, Director, Magway
Region of the Dry Zone Greening Department, for his hospitality during our visit to his region.
Thanks also to all those who attended and participated in the „CF study design workshop‟ held in
November 2010 at the Kandawgyi Palace Hotel, and whose suggestions and contributions have been
invaluable.
Thanks to the ECCDI field research teams. Forest resource survey teams led by U Khin Maung Nyunt
and U Tin Ohn and social survey teams led by Daw Naw Hser Wah and Daw Ni Ni Win under the
supervision of Daw Khin Hnin Myint. Thanks also to the ECCDI support team at ECCDI headquarters.
Thanks to the Pyoe Pin team for funding and enthusiastically guiding and supporting this study
throughout. Our gratitude and thanks go to Gerry Fox, Khin Maung Yin, Dr. Maung Maung Than and
Ms. Siu Sue Mark. Many thanks also to the Pyoe Pin support team, particularly Daw War War Hlaing for
great patience in facilitating the project logistics.
Special thanks to U Win Myo Thu at EcoDev for assisting the project from the start.
Oliver would particularly like to thank my excellent support staff at International Development UEA,
especially Ms. Jane Bartlett, Karen Parsons and Jo Jones.

iii
CONTENTS
Summary ..................................................................................................................................................................... vii
Chapter 1: The Context for Community Forestry in Myanmar .................................................................. 1
Chapter 2: Our Research Approach .................................................................................................................. 11
Chapter 3: The Policy, Legal and Institutional context of Community Forestry Implementation ...... 17
Chapter 4: The Pre-Community Forestry situation and the Formation process .................................... 29
Chapter 5: Community Forest Management: Plans and Practice ............................................................. 35
Chapter 6: Community Forest Condition ........................................................................................................ 39
Chapter 7: Economic Analysis Of Community Forestry ............................................................................... 49
Chapter 8: Livelihoods and Equity Issues in Community Forestry ............................................................. 53
Chapter 9: FUG Sustainability .............................................................................................................................. 63
Chapter 10: Overall Conclusions: Policy, Legal and Institutional Issues and Recommendations. ..... 69
Appendix I: Community Forestry Instruction 1995 ......................................................................................... 85
Appendix II: Forest Survey Procedure ................................................................................................................ 89
Appendix III: Regressions Between Tree Parameters ...................................................................................... 92
Appendix IV: Codes of tree species ..................................................................................................................... 93
iv
PLATES, BOXES, TABLES, FIGURES, MAPS
Plates
Plate 6.1: A CF established in natural forest in Shan State ................................................................................. 41
Plate 6.2:: A successful plantation established in CF in Kachin State ............................................................... 43
Plate 6.3: Measuring ecological status of CF at Nar Daung Hla ........................................................................ 44
Plate 6.4: Water sources reappeared at Wuyan CF in Kachin State ................................................................... 46
Plate 7.1: 9-yr old thame plantation, War Gon CF, Ayeyawady Region ............................................................. 49
Plate 8.1: Plate 8.2: CF at Byant Gyi Gon that protected the village from Cyclone Nargis .......................... 58
Plate 10.1: Plate10.1: Rank-wise assessment of the Forest Department staff .................................................. 74
Boxes
Box 1.1: Forest Administrative Categories .............................................................................................................. 5
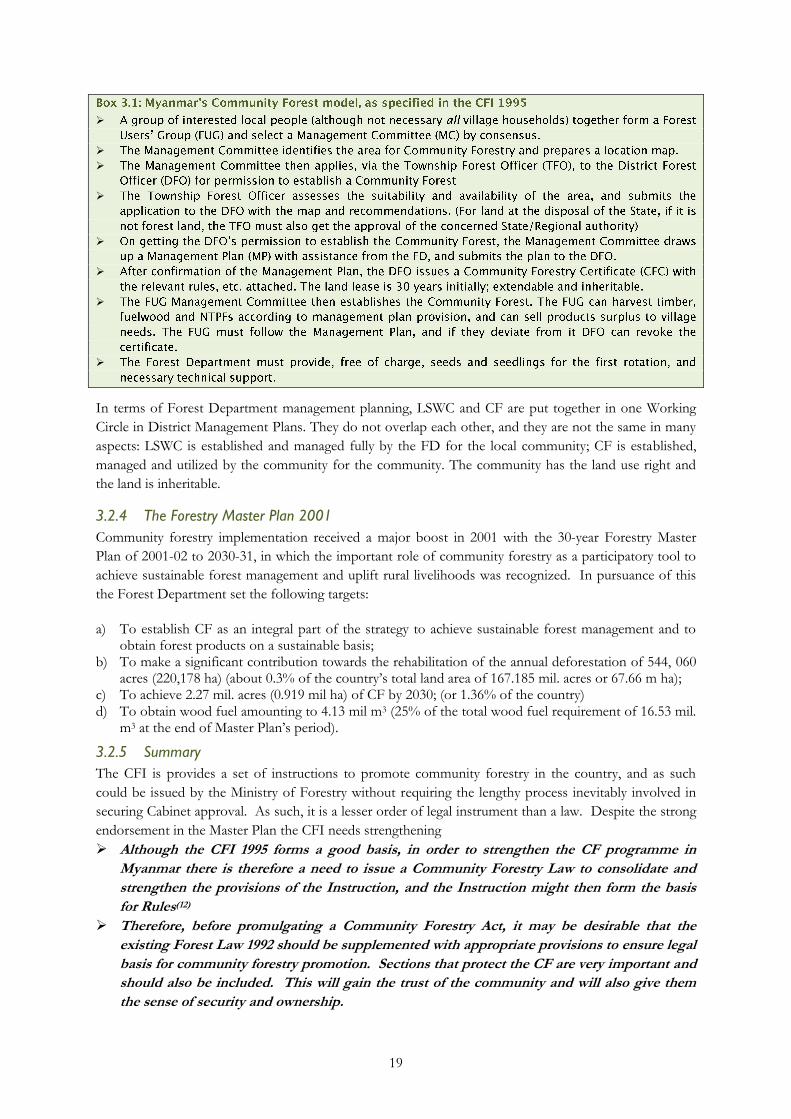
Box 3.1: Myanmar‟s Community Forest model, as specified in the CFI 1995 ................................................ 19
Box 3.2: Donor Supported CF projects ................................................................................................................. 22
Box 6.1: Method note: Calculating stand ............................................................................................................... 39
Box 7.1: Calculation and Interpretation of Internal Rate of Return (= FRR or ERR) .................................. 52
Box 8.1: Livelihoods concepts ................................................................................................................................. 53
Box 10.1: A Namibian example of Community Forest management ............................................................... 76
Tables
Table 1.1: Status of Permanent Forest Estate in year 2005-2006 ........................................................................ 5
Table 1.2: Forest categories (from 2006/07 data) .................................................................................................. 5
Table 2.1: Wealth ranking categories ...................................................................................................................... 13
Table 2.2: Selected States/Regions, Townships and Community Forests........................................................ 13
Table 3.1: Trainings conducted by COMFORT (2004-2006) ............................................................................ 21
Table 3.2: Details of Donor-Funded Project for CF Implementation .............................................................. 21
Table 3.3: Cumulative area of community forests and donor contribution (acres) ........................................ 23
Table 3.4: CF implementation by State / Region (FUGs granted certificate by 31 May 2010) .................... 24
Table 4.1: Diversity in study sites (by State/ Region) .......................................................................................... 29
Table 4.2: Basic Details of the Study Forest Users‟ Groups ............................................................................... 29
Table 4.3: Pre-CF formation forest situation ........................................................................................................ 30
Table 4.4: Study FUG Characteristics .................................................................................................................... 31
Table 4.5: Institutionalisation of Study FUGs ...................................................................................................... 32
Table 5.1: Community Forest management practices .......................................................................................... 36
Table 6.1: Summary of forest data .......................................................................................................................... 41
Table 6.2: Survival of CF plantations ..................................................................................................................... 44
Table 6.3: Forest condition by various indicators ................................................................................................. 45
Table 7.1: Inputs: Costs of thame plantation (Kyats per acre) .......................................................................... 50
Table 7.2: Outputs- Forest products collected from thame plantation ............................................................ 51
Table 7.3: Unit values of forest products ............................................................................................................... 51
Table 7.4: Cash flow of benefits .............................................................................................................................. 51
Table 7.5: Cash flows of one-acre thame plantation ............................................................................................ 51
Table 8.1: Possible costs and benefits to households from Community Forestry .......................................... 56
Table 8.2: Change in Forest Benefits for FUG Member households ............................................................... 57

v
Table 8.3: Equity in Forest Users‟ Groups: an initial assessment ...................................................................... 59
Table 9.1: Indicators of Institutional Sustainability of Study FUGs .................................................................. 63
Table 9.2: Conflict issues in Study FUGs .............................................................................................................. 65
Table 9.3: Support relationships ............................................................................................................................. 66
Table 9.4: Issues for the future ................................................................................................................................ 67
Table 10.1: Summary of FUG indicators: .............................................................................................................. 69
Table 10.2: Issues and Recommendations relating to FUGs and CF ............................................................... 73
Table 10.3: Township-wise assessment on understanding and commitment on CF by FD staff ................ 74
Table 10.4: Assessment of understanding and commitment on CF by FD staff level ................................... 75
Table 10.5: Community Forestry Issues: in relation to the Forest Department .............................................. 77
Table 10.6: Issues and Recommendations relating to Updating the CFI ......................................................... 81
Figures
Figure 1.1: Change of forest cover from 1925 to 1999 (NFMP) ......................................................................... 4
Figure 1.2: Myanmar land cover (based on data from FAO 2010) ........................................................................... 4
Figure 1.3: Community forestry – development over time ................................................................................... 8
Figure 2.1: Organogram of Community Forest Research Field Process .......................................................... 15
Figure 3.1: Community forest areas established from 1996 to 2010 ................................................................ 23
Figure 3.2: Distribution of Community Forests across the States and the Regions ....................................... 26
Figure 3.3: Distribution of Community Forests by Forest Category ................................................................ 26
Figure 5.1: CF size and management regime ......................................................................................................... 36
Figure 6.1: Stand tables of plantation and natural forest, Wuyan CF ................................................................ 40
Figure 6.2: Stock table for Wuyan CF: Timber volume of all species (m3/ acre) by size class ..................... 40
Figure 6.3: Mean diameter of CF plantation against its age ................................................................................ 40
Figure 6.4: Growing stocks of natural and planted forests by CF (Volume/ha, m3) ...................................... 42
Figure 6.5: Mean Annual Increment of CF plantations (v/ha/yr in m3) .......................................................... 43
Figure 7.1: Stand structure of thame plantation (War Gon CF) – number /ha of different size classes of
trees .............................................................................................................................................................................. 50
Figure 7.2: Costs, benefits and net cash flow of the 1 acre plantation (kyat / year) ....................................... 51
Figure 8.1: Wealth rank of FUG and non-FUG member households: number by FUG sites. .................... 55
Figure 10.1: Summary of Study FUG‟s performance indicators ........................................................................ 70
Maps
Map 1.1: Forest Cover Status of Myanmar 2007 .................................................................................................... 3
Map 1.2: Teak-bearing forests in Myanmar ............................................................................................................. 6
Map 2.1: The study sites for this research .............................................................................................................. 14
Map 3.1: Distribution of Forest Users‟ Groups by Township (with study sites numbered) ......................... 25

vi

vii
SUMMARY
This paper is the main output of a research project initiated by Pyoe Pin, and led by ECCDI with support
from the University of East Anglia, whose aim has been to fill the gap in knowledge over the progress of
Community Forestry in Myanmar through a systematic study. This paper presents the key data and
findings, and offers policy recommendations based on these.
Of Myanmar‟s 67.6 m ha land area, forests currently cover around 48%, although there has been a
declining trend for the last century (they covered over 65% early in the 20th Century). The declining trend
is particularly dramatic for dense forests, which have more than halved in the last twenty years, from
covering 45.6% of land in 1990, the single largest land use, to now just 19.9%.
The long -term decline in forests, is due to a combination of factors; change of land use (especially land
hunger from the growing population), commercial timber harvesting (and the indirect effect of increasing
accessibility through road construction), and also intensifying pressure on remaining forests for livelihood
needs especially fuelwood.
Forest reservation was initiated by the British from 1856, creating a national forest estate but taking over
control of many villages‟ forests in the process. Community Forestry has been a successful policy around
the world for communities to protect and sustainably manage their forests and derive livelihood benefits.
It was encompassed in Myanmar‟s colonial era policies to some extent through the creation of Local
Supply Working Circles. However, these were under Forest Department management and have not been
a success, with most becoming encroached or degraded.
Returning control of the management rights and responsibilities for village forests to the villages became
seen by policy makers as critically important in the 1990s both to mobilise communities to protect and
regenerate adjacent forests, and also to ensure that they fulfil their forest product needs locally. Hence,
the Community Forestry Instruction (CFI) was issued in 1995, and initiated the promotion of Community
Forestry in Myanmar.
Implementation of the Community Forestry Instruction began immediately, and was promoted by
international donor projects (e.g. UNDP / JICA / DFID) as well as through Forest Department
promotion, and in some cases self-organization by communities. Implementation received a major boost
through the Forestry Master Plan (2001) which mandated that 2.27 mil. acres (1.36% of the country) be
handed over to FUGs by 2030-31.
Annual progress of Community Forest establishment since 1995 had averaged 6,943 acres (2,810 ha), and
there are now 572 Forest Users‟ Groups with certificates, managing 104,146 acres of forest, (with more
awaiting their certificate). Implementation progress has been highest in Shan, Rakhine, Magway and
Mandalay, most of which have been under UNDP project support.
However, the rate of CF handover has been far lower than that needed to meet the Master Plan‟s 30-year
target (i.e. 2.27 million acres by 2030). For this we would need to hand over 50,000 acres (approx. 20,000
ha) per year, a rate almost ten times higher. (The FD also aims to obtain 4.13 million m3 of wood fuel
from community forests, amounting to 25% of the country‟s total wood fuel requirement of 16.53 million
m3 by 2030, another target unlikely to be achieved at the current rate).
After 15 years of Community Forestry in Myanmar, there are a wide range of experiences which have
significant implications for sustainable forest management and community and livelihood development.
To understand how community forestry is working we developed a detailed inter-disciplinary research
design with a range of stakeholders in late 2010. Having finalised our method we then selected two States

viii
and two Regions (Kachin, Mandalay, Shan, Ayeyawady) for study, and objectively selected 16 FUGs
within these, using a statistically sound sampling method to reflect the diverse environments where CF is
happening. We then conducted field work in 16 Community Forests and associated villages. This started
in the second week of October and was completed by the end of December 2010. The community
forests were assessed, the local Forest Users‟ Group institution researched, and a total of 272 households
interviewed.
Our 16 study CFUGs comprised a very wide range of different local situations,
from very small to very large villages (populations from 171 to over 39,000),
from very small to very large FUG membership (from 5 to 263 households),
from very small to very large Community Forests (from 33 to 1200 acres).
from young to old FUGs (from 4 to 16 years).
What was the pre-formation situation?
Although we lacked baseline data, most all our groups (13 out of 16, or 81%) told us the areas now under
Community Forest had been relatively degraded forests prior to formation. They were degraded mainly
because they were effectively open access and the village lacked the authority to regulate their use within
sustainable levels by users both within and beyond the village. In the remaining FUGs (19% of the
sample) the forests were in moderate condition prior to CF but the trend was uncertain. However this
aspect of our study is not entirely conclusive as we were not able to spend significant time on
investigating the issue of pre-CF land use, tenure situation and condition. This issue therefore demands
further investigation in future studies.
Are FUGs becoming institutionalised?
Almost all of the FUGs were initiated in the context of donor project support, although two were self
initiated. Villagers were motivated to protect them to improve their condition, ensure environmental
services (like water supply), basic needs (fuelwood and grazing etc.) and for income earning opportunities
We found 50% of the study FUGs to have been well institutionalised at the time of formation, and a
further 31% to have been moderately well institutionalised. But for 3 FUGs (19% of the sample) the
institutionalisation has been seriously flawed; particularly due to elite capture problems. The ostensible
„self selection‟ of FUG membership runs the risk of elite capture - some were formed from a handful of
households leading to inequity in control and use of community resources.
Study villages show a spectrum of equality-inequality. In some cases it is clear the poorest were
depending on these resources –so they may have borne the brunt of restrictions for regeneration.
Are FUGs protecting and managing forests effectively?
FUGs have introduced management regimes involving areas under collective plantation, protection,
harvesting and individual plots. Species choice is a critically important issue in planning, and it seems that
planting options may have been limited, or unclear. For instance the legal marketing status of teak is
unclear to many villagers. Forest protection remains a challenge, as outsiders continue to try to harvest
forest products: many villages don‟t want to get into conflictual relations, but FD staff are often not
backing them up. So overall our findings indicate almost all FUGs have introduced effective management
and protection
Has CF management actually led to regeneration and / or improvement in forest condition?
The forest study data shows us that forest regeneration is occurring across virtually all villages. 13 of the
16 study sites have forests showing overall good or moderately good forest health (by composite
indicators).

ix
The success of CF plantations has been adequate but sub-optimal: in most the mean annual increment is
below desirable levels, although survival rates for saplings are generally good. However in the Dry zone
conditions are particularly adverse: all our Mandalay FUGs are struggling to ensure their plantation efforts
succeed: and survival rates are significantly lower than elsewhere in 2 study FUGs (36% and 54%).
Across almost all CF sites improved „ecosystem services‟ have been observed e.g. water supply, soil
condition and biodiversity habitat. One of the most dramatic ecosystem services has been storm
protection in the delta region: in one site the regeneration of the community forest seems to have been
the decisive factor in protecting the lives of villagers when cyclone Nargis hit in 2008.
Communities are thus significantly contributing to the national re-greening objectives enshrined in the CF
Instructions.
Has forest regeneration led to livelihood benefits becoming available, and are they being shared?
We found almost all FUGs have regenerated their forests, thereby providing a range of timber, fuelwood,
fodder, Non Timber Forest Products and ecosystem services (particularly water and soil nutrient cycling).
The patterns are complex, depending on the forest type and condition, and the livelihood practices, but
the overall picture is very positive.
There is undoubtedly much potential here for enhancing the livelihood benefits through both livelihood
oriented forest management and also value addition and marketing development. We performed an
economic „cost-benefit‟ analysis of one plantation at a study site in the Delta region. This illustrates a very
high positive net return. The net cash flow across the 9-year old plantation has shown a FRR of 24.28%,
meaning that one Kyat invested in the plantation over the project period has generated K 0.24 per year
for every year that the K1 remains committed to the project. Since the rotation has been set at 10 years,
if the plantation is clear- felled at the 10th year, there will be large lump sum revenue and in consequence
the profit will increase significantly.
Is the distribution of benefits (and costs) from CF fair and equitable, and in particular are the
poor and most needy receiving benefits?
Overall we found half of our 16 study FUGs were moderately and 37.5% were highly equitable in their
practices. Only 12.5% were found to be inequitable. We also found that several villages were initiating
wider community development initiatives, such as building community infrastructure like schools and
bridges, using timber and cash generated from the community forest.
Are the FUGs’ achievements sustainable?
In terms of sustainability we found 3 of our 16 study sites to be stagnated and inactive. They were in Shan
and Mandalay, which also have a higher proportion of ‟moderately active‟ FUG sites. Kachin and
Ayeyawady FUGs are performing better, and this is probably related to better formation and post
formation support from projects, NGOs and government staff, as well as better environmental
conditions (especially more rainfall) for forestry to succeed.
We found only 5 of our study sites (31%) are actually submitting their annual reports. Even otherwise
well-performing FUGs are neglecting this duty, and the benefits of doing so seem unclear to them.
Record keeping is also worryingly poor, indicated by lack of a management plan in 7 of the study sites
(44%).
Conflicts exist in 11 (69%) of our study sites and these are serious problems in 5 (31%). The most
prevalent problem is conflict over enforcing regulations on extraction. However, there are also conflicts
to do with perceived inequitable exclusion from FUG membership in 3 sites (19%).

x
Post-formation support is generally perceived to be moderate (44% of sites) or poor (31%), with only 2,
both relatively recent FUGs in Kachin experiencing a „good‟ level (12.5%). The level of support was
unclear in 2 sites but likely to be mediocre.
Thus, sustainability is a serious challenge, and demands improved post-formation support to be secured.
In terms of policy legal and institutional issues, we found a relatively high level of understanding of the
Community Forestry Instruction and CF concepts across Forest Department staff in the townships where
we conducted the field study. The most senior level had the clearest understanding (averaging „excellent‟)
and the Forest Guards and day wagers had the next highest score (75% had a „very good‟ understanding
and level of commitment). The other levels averaged a majority of „very good‟ level of understanding.
Overall we concluded that of the 16 FUGs we studied, 8 were working well according to the above
criteria. A further seven were working moderately well but are having some problems (and are in need of
post formation support). So overall we can conclude 94% of FUGs are working well or moderately well.
Only one was clearly dysfunctional.
Limitations of this study and issues for future research: tenure, food security, gender
This study has been the first of its kind, to attempt to systematically assess how Community Forestry has
been working in the field in Myanmar. It was conducted with modest resources over about 3 months of
fieldwork. Devolving natural resource governance to the local level, through policies like Community
Forestry, involves complex and multi-facetted processes. Whilst we are satisfied with the significant
achievements we feel the study has made, we recognise there are several areas which, under the resource
constraints, we have not been able to assess conclusively, and which therefore demand further
examination with a more detailed social science approach:
We have focussed primarily on the performance o community forestry according to its own terms – i.e.
the increase in forest cover in areas labelled community forests and the possibility of benefit sharing from
those areas. We have not examined the more complex land use dynamics which introducing community
forestry may precipitate. Local people have a range of responses to the proposition of introducing
community forestry, and the changes that it leads to. The threat to the continuity of fallows cultivation in
upland land use mosaics when they become labelled as „degraded forests‟ threatens the food security for
some households. On the other hand, despite the restrictions, introducing CF may still be attractive to
villagers as a route to more secure land tenure, especially as taungya cultivation typically lacks tenure
security. Even within households, the pros and cons are likely to be different between men and women,
who use the local village lands in different ways according to their culturally ascribed roles.
The issue of the relationship between the state and the village is a delicate on in Myanmar, and CF
inevitably affects this relationship in ways we have not examined.
Thus what we might call the „micro-politics‟ of Community Forestry and the ways it changes land use
practices, the livelihood coping strategies and the effects on food security are still; somewhat unclear, and
demand more detailed and systematic further investigation.

xi
Policy recommendations:
IMPROVE THE LEGAL AND POLICY ENVIRONMENT:
The current policy environment for CF, based on the CFI 1995, has limited force as it lacks the status of
policy or law. To improve the CF programme, the CFI should be strengthened and its provisions
enhanced:
The legal basis of CF should be strengthened – from Instruction to a new Law
CFUGs should be socially inclusive – they should be formed from all of the village as far as possible, not just a self-
selected group
There should be a specific gendered and pro-poor approach in policy and support for equity
SUSTAIN AND ACCELERATE FUG FORMATION
Donor-funded projects have been the main initiator of CF formation (UNDP, JICA, DFID), although
NGOs, the FD, and committees themselves have played significant initiating roles as well. Donor
support is not, however, sustainable, and having effectively developed and demonstrated the CF model
can work, projects in this sector have declined, leaving an uncertain funding future for sustained CF
handover and post-formation support. Myanmar‟s main CF challenge is now how to sustain progress in
the absence of widespread donor support.
There are numerous diverse location-specific enterprise / commercial opportunities that might also
provide a strong incentive for communities, NGOs and the private sector to invest in long term CF
support. Other funding opportunities may arise from payment for ecosystem service, particular REDD
and other carbon forestry schemes.
The government needs to prioritise the accelerated handover of Community Forests, and develop strategies, mechanisms
and targets for doing this.
The government and other partners should develop initiatives responding to the changing national and international
opportunities.
Practical steps to scale up CF to meet the national target by 2030 should include:
1. The Ministry identifying and allocating regional targets for the final percentage of forest to be put under Community
Forestry, and interim annual targets towards their achievement.
2. The allocation of the appropriate financial and staff resources to achieve this. Forest Department regional offices
should create FUG formation support teams, to develop expertise in facilitating handover according to best practice.
A sufficient number of staff will be needed to be able to fulfil the annual targets identified. There should be incentives
associated with the fulfilment of the plan, and disincentives for non-achievement.
3. A national level awareness raising media campaign to villages to understand the CF programme, roles,
responsibilities and opportunities. The campaign should motivate rural people towards demanding Community
Forestry, and indicate their next steps (i.e. apply to the forest office).
4. All stakeholders, whether NGOs, CBOs and FUG networks, and any other organisations should be encouraged to
help implement this, and stakeholder coordination should be facilitated on a regular basis at the regional and
township level.
STRENGTHEN SUPPORT PROVISION TO FUGs ONCE FORMED:
The leading CFUGs are institutionally robust: their forests have matured, leading to improved ecosystem
services and livelihood benefits. They are leading Myanmar‟s CF programme into a „second generation‟
phase of more active forest management for multiple benefits, more equitable benefit distribution and
are exploring new areas of activity like enterprise development and network development.
The best FUGs need to be supported as they move into new areas of activity and develop networks which can provide
support to other FUGs.
xii
Most FUGs are in urgent need of support, however, across a range of issues: institutional mentoring;
conflict resolution; enforcement of forest protection and so on. The weakest groups need re-formation.
But support needs are not being met: after initial formation, support has declined as so far the FD has not
reoriented adequately to fulfilling this role, leaving a „support vacuum‟ in which many CFUGs are
stagnating.
The FD must play the lead role in the post donor scenario. A renewed initiative from Government is vital to
consolidate the achievements of existing FUGs.
IMPROVE ADAPTIVE CO-LEARNING AND MONITORING PROCESSES:
This study, conducted in a short space of time on limited resources, has only scratched the surface of the
many complex and location specific experiences and issues.
A sustained co learning programme, ideally based around Participatory Action Research with CFUGs is needed, and
this could be linked to a need-based FD support service.
1
Chapter 1: THE CONTEXT FOR COMMUNITY FORESTRY IN MYANMAR
1.1 Introduction
This chapter reviews the context in which Community Forestry has emerged in Myanmar, covering the
physical and historical context, and declining forest cover trends and explanations.
1.2 Geographical and Historical Context
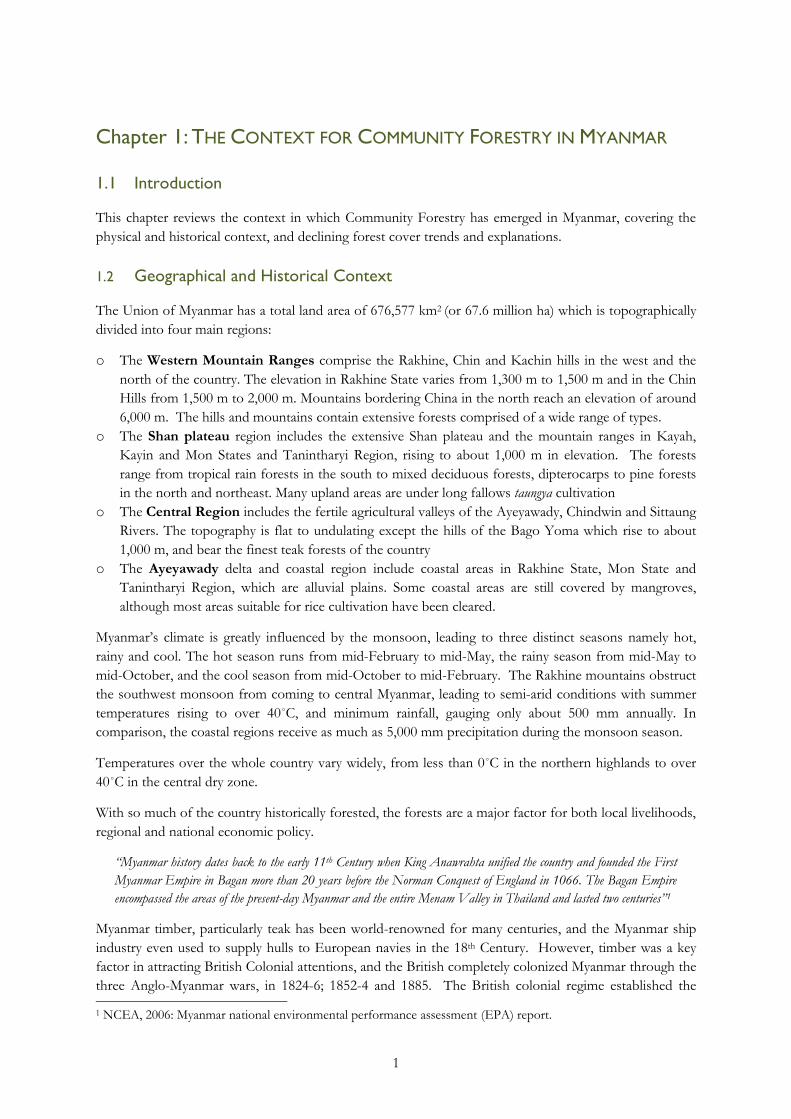
The Union of Myanmar has a total land area of 676,577 km2 (or 67.6 million ha) which is topographically
divided into four main regions:
o The Western Mountain Ranges comprise the Rakhine, Chin and Kachin hills in the west and the
north of the country. The elevation in Rakhine State varies from 1,300 m to 1,500 m and in the Chin
Hills from 1,500 m to 2,000 m. Mountains bordering China in the north reach an elevation of around
6,000 m. The hills and mountains contain extensive forests comprised of a wide range of types.
o The Shan plateau region includes the extensive Shan plateau and the mountain ranges in Kayah,
Kayin and Mon States and Tanintharyi Region, rising to about 1,000 m in elevation. The forests
range from tropical rain forests in the south to mixed deciduous forests, dipterocarps to pine forests
in the north and northeast. Many upland areas are under long fallows taungya cultivation
o The Central Region includes the fertile agricultural valleys of the Ayeyawady, Chindwin and Sittaung
Rivers. The topography is flat to undulating except the hills of the Bago Yoma which rise to about
1,000 m, and bear the finest teak forests of the country
o The Ayeyawady delta and coastal region include coastal areas in Rakhine State, Mon State and
Tanintharyi Region, which are alluvial plains. Some coastal areas are still covered by mangroves,
although most areas suitable for rice cultivation have been cleared.
Myanmar‟s climate is greatly influenced by the monsoon, leading to three distinct seasons namely hot,
rainy and cool. The hot season runs from mid-February to mid-May, the rainy season from mid-May to
mid-October, and the cool season from mid-October to mid-February. The Rakhine mountains obstruct
the southwest monsoon from coming to central Myanmar, leading to semi-arid conditions with summer
temperatures rising to over 40˚C, and minimum rainfall, gauging only about 500 mm annually. In
comparison, the coastal regions receive as much as 5,000 mm precipitation during the monsoon season.
Temperatures over the whole country vary widely, from less than 0˚C in the northern highlands to over
40˚C in the central dry zone.
With so much of the country historically forested, the forests are a major factor for both local livelihoods,
regional and national economic policy.
“Myanmar history dates back to the early 11th Century when King Anawrahta unified the country and founded the First
Myanmar Empire in Bagan more than 20 years before the Norman Conquest of England in 1066. The Bagan Empire
encompassed the areas of the present-day Myanmar and the entire Menam Valley in Thailand and lasted two centuries”1
Myanmar timber, particularly teak has been world-renowned for many centuries, and the Myanmar ship
industry even used to supply hulls to European navies in the 18th Century. However, timber was a key
factor in attracting British Colonial attentions, and the British completely colonized Myanmar through the
three Anglo-Myanmar wars, in 1824-6; 1852-4 and 1885. The British colonial regime established the 1 NCEA, 2006: Myanmar national environmental performance assessment (EPA) report.

2
Forest Department in 1856 to manage and regulate the orderly exploitation of Myanmar timber (see
Bryant 1997), after which Forests were gradually reserved, including village forests. The extensive social
injustices of the colonial period were documented at the time by Sayar San (1932) who went on to lead an
insurrection.
Myanmar was devastated by the Japanese occupation from 1942 to 1945 during the Second World War.
Regaining independence on 4 January 1948 after 62 years under colonial rule, Myanmar has had an
extremely difficult post colonial reform and state-building process, with continued civil conflicts,
particularly in forested areas of the country, which persist in some areas until today.
The country was under democratic administration until on 7 July, 1962 Myanmar Armed Forces
(Tatmadaw) took over state duties. Following introduction of the 2008 State Constitution, the State Peace
and Development Council (SPDC) (Tatmadaw Government) held General Parliamentary Elections on 7
November 2010. The SPDC subsequently transferred its State powers to the newly formed government
on 29 March 2011.
The Union of Myanmar has a population of 55.4 million (2005-2006 census), including over one hundred
indigenous races with distinct dialects, and an annual population growth rate of 2.02%2.
1.3 Forests: Status and Trends
Due to a wide range of topography, soil, rainfall and temperature, the vegetation types, fauna and flora are
also diverse. Practically, all the forests in Myanmar are natural forests, which are commonly categorised
by eight major forest types, namely
1) tidal forests 2) beach and dune forests 3) swamp forests
4) tropical evergreen forests 5) mixed deciduous forests 6) dry forests
7) dipterocarp forests 8) hill and temperate evergreen
forests
Each forest type provides rich biodiversity, high value timbers, land for cultivation (both shifting and
sedentary), ecosystem services like water supplies and a range of non-timber forest products. The mixed
deciduous forest type comprises 40%of the country‟s remaining forests3 and is seen as economically most
important, as these forests contain teak and other valued tree species such as pyinkado (Xylia dolabriformis),
padauk (Pterocarpus macrocarpus), binga (Mitragyna rotundifolia) and hnaw (Adina cordifolia).
Myanmar‟s national forest cover is currently estimated at 47% (31.773 m ha according to FAO 2010), of
which closed forests are estimated to be 19.9%. (See Map 1 below for the geographical distribution)
However, forests have shown a gradual decline over time, particularly dense „closed‟ forests. According
to the National Forest Master Plan (NFMP) of the Forest Department, the forest cover has decreased
from 65.8% of the total area of the country in 1925 to 52.3% in 19994 (see Fig.1.1). As of the year 2004-
2005, Myanmar‟s forest area stood as shown in Fig. 1.2 and Tables 1.1 and 1.2.
2 Central Statistical Organization, 2008: Statistical Year Book 2007. 3 Anon, 2000: Forestry in Myanmar, Forest Department, Myanmar. 4 Tint Dr. Kyaw, 2002: Review of forestry and related legislation, policies and practices and their impacts / implications on sustainable forest management (SFM) and on the model forest approach to SFM in Myanmar.

3
Map 1.1: Forest Cover Status of Myanmar 2007
4
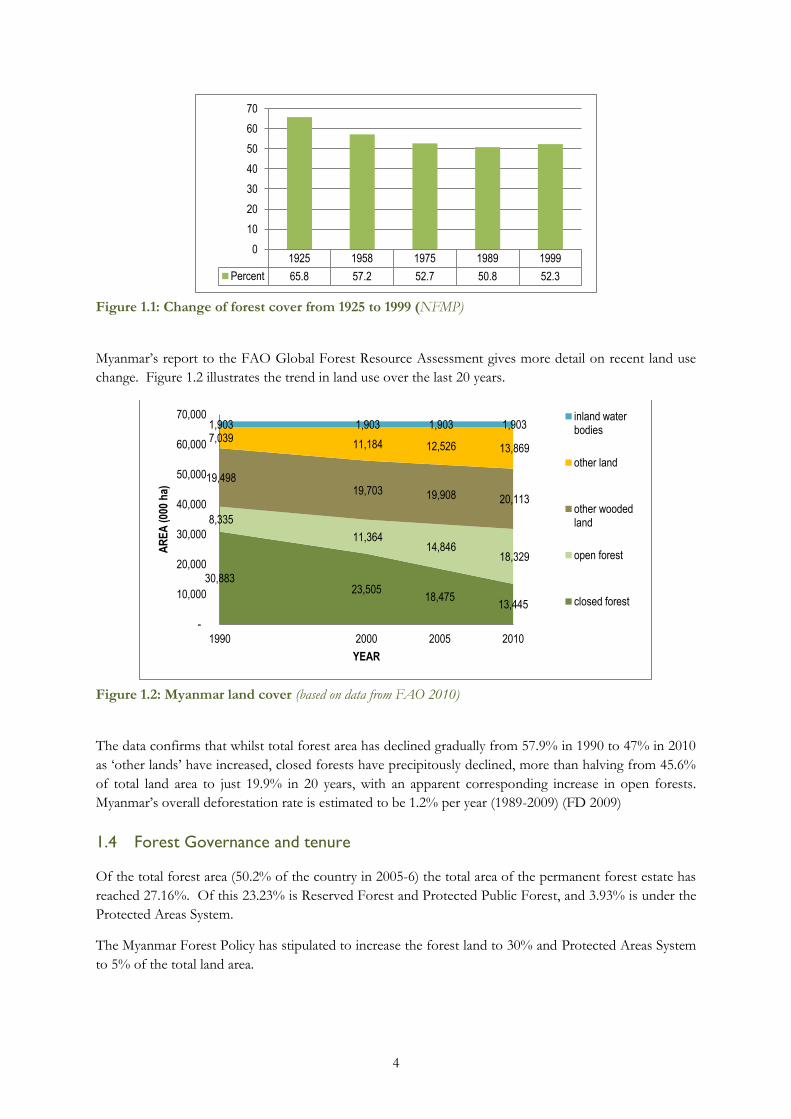
Figure 1.1: Change of forest cover from 1925 to 1999 (NFMP)
Myanmar‟s report to the FAO Global Forest Resource Assessment gives more detail on recent land use
change. Figure 1.2 illustrates the trend in land use over the last 20 years.
Figure 1.2: Myanmar land cover (based on data from FAO 2010)
The data confirms that whilst total forest area has declined gradually from 57.9% in 1990 to 47% in 2010
as „other lands‟ have increased, closed forests have precipitously declined, more than halving from 45.6%
of total land area to just 19.9% in 20 years, with an apparent corresponding increase in open forests.
Myanmar‟s overall deforestation rate is estimated to be 1.2% per year (1989-2009) (FD 2009)
1.4 Forest Governance and tenure
Of the total forest area (50.2% of the country in 2005-6) the total area of the permanent forest estate has
reached 27.16%. Of this 23.23% is Reserved Forest and Protected Public Forest, and 3.93% is under the
Protected Areas System.
The Myanmar Forest Policy has stipulated to increase the forest land to 30% and Protected Areas System
to 5% of the total land area.
1925 1958 1975 1989 1999
Percent 65.8 57.2 52.7 50.8 52.3
0
10
20
30
40
50
60
70
30,883 23,505
18,475 13,445
8,335
11,364 14,846
18,329
19,498 19,703 19,908 20,113
7,039 11,184 12,526 13,869
1,903 1,903 1,903 1,903
-
10,000
20,000
30,000
40,000
50,000
60,000
70,000
1990 2000 2005 2010
AR
EA
(00
0 h
a)
YEAR
inland water bodies
other land
other wooded land
open forest
closed forest

5
Table 1.1: Status of Permanent Forest Estate in year 2005-2006
Total land area (km2) Permanent Forest Estate (km2)
Reserved Forest &
Protected Public Forest
Protected Area System (PAS) Total forest estate
676,577 157,205 26,620 183,825
100% 23.23% 3.93% 27.16%
Source: Statistical Year Book, 2007 p.137
Table 1.2: Forest categories (from 2006/07 data)
Land Extent (km2) Percent of total
Total land area 676,577 100.00%
1.Forest covera 339,666 50.20%
Closed forest 247,042 36.51%
Open forest 92,624 13.69%
2. Permanent forest estateb 183,825 27.17%
Reserved forest and protected public forest 157,205 23.24%
Protected areas system 26,620 3.93%
Public forest (1-2) 155,841 23.03%
Source: a FAO (2006); b Statistical Yearbook (2007)
The forests and forest lands are controlled by the Ministry of Forests. Other land is managed by the
Department of Settlement and Land Records under the Ministry of Agriculture and Irrigation. Land is
convertible to any use.
Virtually, all the countries‟ natural forests are managed under the Myanma Selection System (MSS), the
salient points of which include adopting a 30-year selective felling cycle, based on fixing exploitable sizes
of trees, and improvement fellings.
1.5 Deforestation and degradation
Loss of forests is a serious problem for a number of reasons, including decline of availability of both
forest products, timber, fuelwood and non-timber forest products, and also decline in ecosystem services;
biodiversity and habitat, hydrological services and so on. Forest degradation is also a grave problem:
average volume of woody material in the growing stock fell from 145m3/ ha in 1990 to 33m3 in 2000
(FAO 2001).
The principal cause of deforestation has been land use change and the principle causes of forest
degradation have been overexploitation for timber and non-timber forest products.

6
“Since 1989, about 460,000 ha of natural forest were lost on average each year. And wood removal per thousand ha of
forest cover nearly doubled from 624 m3 in 1975 to 1,232 m3 in 2000”5
1.5.1 Logging – legal and illegal:
Much of Myanmar‟s forests contain valuable timber species, most particularly teak. Natural teak
distribution occurs in the semi-evergreen forests, mixed deciduous forests and deciduous dipterocarp or
Indaing forests, illustrated in Map 1.2.
Commercial legal logging being done by the Myanma
Timber Enterprise (MTE) fluctuates around, but it is
believed does not consistently violate, the annual
allowable cut (AAC) fixed under the Myanma Selection
System (MSS). It may therefore degrade the forest but
not leading to deforestation.
“Available data do not support the notion that commercial logging
operations systematically violated existing annual allowable cut
(AAC) regulations. For instance, AAC for teak was 350,000 and
226,954 hoppus tons respectively before and after 1996 periods but
annual extraction of teak during 1975 to 2001 ranged from 203,122
to 489,109 hoppus tons p.a. In case of hardwood species, AACs
fixed for periods before and after 1996 were 1.3 and 1.8 million h.
tons respectively and actual felling has never exceeded the AAC
limits6.
However, since the private sector has been allowed to
export timber after 1988, extraction has increased
sharply, and harvestable teak has become scarce, leading
to a switch to the logging of the lowland evergreen
forests7. The construction of roads for logging and
transportation also has adverse impacts on the forest
ecosystem health, and facilitates subsequent illicit logging
in the selectively logged areas.
Illegal logging is a serious problem, particularly in remote
and insecure areas, and has proved very difficult to
control. It is a major cause of both deforestation and
forest degradation.
1.5.2 Rural livelihood use and fuelwood
Most rural communities are very much dependent on timber and non-timber forest products for their
livelihoods: communities‟ wood and non-wood forest needs include fuel, poles, posts and foods. In the
absence of alternate fuels, local domestic firewood needs are high and increase every year. It was
estimated to be almost 14 times the official extraction of teak and hardwoods in 2005-2006, total
production of firewood being 20.54 million cubic tons and the total extraction of logs 1.48 million cubic
tons(1). Thus, firewood extraction had been a major, perhaps the major, threat to forest conservation,
which demands a constructive policy response.
5 NCEA 2006 Ibid. 6 NCEA 2006 Ibid. 7 Win Myo Thu 2011 National Biodiversity Strategic Action Plan Myanmar (draft)
Map 1.2: Teak-bearing forests in Myanmar
Source: Mehm Ko Ko Gyi and. Kyaw Tint 1995

7
1.5.3 Expansion of agriculture and infrastructure development
Another major driver is clearance for shifting cultivation, agricultural expansion and development of
infrastructure. Agricultural sown area had increased from 24.6 mil acres in 1988 to 37.14 mil acres in
2004(9).
The number of dams had increased from 138 in 1988 to 162 in 2004. In 2004, 32 dams were under
construction and 44 were under planning stage8. Construction of dams in the forests had not only directly
reduced the forest cover but also compounded deforestation and forest degradation by making the forests
more accessible to illicit timber cutters.
1.5.4 Conversion for commercial plantation
Security of land tenure is a particular problem as there is increasing interest from private companies to
appropriate land for commodity production, mining and infrastructure development. However, data is
currently limited on this phenomenon.
1.5.5 Summary
The overall picture is that drivers of deforestation and degradation involve primarily land conversion for
agriculture and other uses, illicit logging, particularly as forests become more accessible, combined with
poorly managed or regulated livelihood use.
1.6 Rural Livelihoods and Village Forests
The patterns of rural livelihoods depend in a range of ways on forests – particularly fuel wood, pastures
and tree fodder, compost materials, timber, posts and poles for construction & sale, a wide range of non
timber forest products (including wild foods and medicines) which can provide both seasonal incomes
and a safety net function. Forests also provide local people with a range of ecosystem services,
particularly water supply for domestic use and agriculture, and also pollination, soil nutrient cycling and
storm protection. Both poverty and malnutrition are a serious problem in Myanmar; therefore, food
security needs to be treated as a priority.
Because forests play such an important role in livelihoods, there has been a long history of their local
management as a common property resource (as with many other resources e.g. grazing lands, fisheries,
irrigation, parks, wildlife habitats and hunting grounds). Historically, customary community control of
village forests has been a ubiquitous phenomenon internationally, wherever people have lived at a forest /
agriculture interface.
In Myanmar, common property regimes began to be disrupted from the 19th century by the Colonial era,
particularly through forest reservation (Bryant 1996). As the colonial state extended its interest in timber
it has taken over control of forests, superseding village authority. Village forest areas often became
effectively open access leading to a „tragedy of the commons‟. However, some „informal‟ commons
management seems to have persisted. This includes protection of forests on private / community land,
grazing lands, sacred groves, woodlots in and around Buddhist monasteries and shrines, and private
watershed forests in the Shan State and so on.
Sacred groves for instance remain fairly widespread (typically devoted to local Nats or spirit guardians).
Communities enforce strict prohibition on any exploitation. These groves therefore form community
biodiversity reserves.
8 Anon 2004 Ibid. 9Anon 2004 Myanmar building a modern state

8
Collective action is also prevalent. Many villages all over the country have formed community
development groups. Local rural people are skilled in cultivating, planting and protecting trees on home
plots and field edges
From this discussion it seems that rural communities are ready for Community Forestry, and the
government simply needs to provide an enabling policy environment and support.
1.7 Community Forestry
Informal common property regimes lack legal or administrative back-up and are, therefore, vulnerable to
powerful interests. With increasing forest degradation around the world, governments have been
rethinking forest governance since the 1970s, seeking to return control of forests to communities in order
to achieve the twin goals of sustainable resource management and poverty alleviation.
Community Forestry simply involves communities receiving formal endorsement and rights from the
administration to assume control, management and use of forests local to them. The basic logic for CF is
as follows:
1. In forests adjacent to villages which have become degraded through being open access, the first
step is to (re-) establish village institution regulating use and investing efforts in protection,
regeneration and management. This often takes outside initiation and facilitation support, and
also long-term back up.
2. Over time, the forest condition will gradually improve, leading to increased availability of desired
forest products and services valuable to the local community.
3. Although households will have to reduce their forest use in the early years, often leading to
hardship for those most dependent on the forest, in time there should be a higher level of
sustainable forest product availability for them (see Fig. 1.3)
This model however is not applicable to areas where the label of „degraded forest‟ does not fit. In many
upland areas land use is a mosaic of agriculture (often rotational fallows), grazing meadows and
woodlands, and imposing „forest‟ as a land use objective can significantly compromise pre-existing
livelihood practices.
Community Forestry has been highly successful in a range of counties, most famously Nepal (see Bhatta
2007) where virtually 100% of mid-hill forests are now under community management, and Mexico (see
Time - years
1. Institutional efforts 2. Forest condition 3. Livelihood benefits
Figure 1.3: Community forestry – development over time

9
Bray et al. 2006). In most cases this is leading to both regenerated and thriving forests, high levels of
sustainable benefits for communities, and also tax revenues to the government.
1.8 Emergence of Community Forestry in Myanmar
In Myanmar it had become increasingly apparent that unless the basic needs of the local forest dependent
poor especially the need for wood fuel can be met, sustainable forest management would remain elusive.
Sustainable forest management demands sustainable management of the forest‟s entire ecosystem which
will also includes forest dependent communities. To achieve sustainable and effective forest management,
the forest development and management system must involve the target community‟s participation, give
the community a sense of ownership and address its needs.
In actual fact this element was originally conceived during the initial stages of the scientific forestry in the
country. Forest district working plans used to include Local Supply Working Circles (LSWCs). These
were created in forests in the vicinity of the villages for easy access and were managed to provide the local
community with fuel wood, poles, posts, small timber and a variety of NTFPs. However, encroachments
from agriculture, settlements and infrastructural developments and overexploitation proved
uncontrollable, ultimately resulting in their disappearance.
Despite the LSWC experience, it is clear that revived community involvement is essential. A community
forestry policy was considered the right choice for Myanmar in the mid-1990s, and consequently, the
Community Forestry Instructions were formulated in 1995, and approved by the Minister of Forestry and
instructed by the Director-General of the Forest Department for implementation throughout the country
starting from 1996 onwards.
The key advance from the LSWC to the Community Forests (CF) is that LSWC was managed by the
Forest Department (FD) to satisfy the basic needs of the local community, whereas the CF is managed by
the local community themselves. The revised Forest Management Manual adopted in 1996 prescribes LSWC
and CF in the same category as LSWC/CF.
Other references
Anon, 2004 Myanmar: Building a modern state.
Bryant, R.L., 1997 The Political Ecology of Forestry in Burma, 1824-1994, (London: C. Hurst & Co.)
Bhatta, Binod 2007 Community Forestry in Nepal (Kathmandu: Winrock)
Barton-Bray David, Leticia Merino-Pérez, and Deborah Barry (ed.s) 2005 The Community Forests of
Mexico Managing for Sustainable Landscapes (Austin: UT Press)


11
Chapter 2: OUR RESEARCH APPROACH
2.1 Rationale for study
One and a half decades have passed since 1996, the year of the establishment of the first Community
Forest in the country. Many working in community forestry implementation have extensive personal
experiences, and there are also anecdotal reports and some modest review studies (e.g. Lin 2005).
However there has been no comprehensive assessment till now, particularly incorporating the
institutional, social and livelihood aspects.
The need for a systematic study of CF was formally recognised at the First National CF Workshop in
2008. (EcoDev 2008). Evaluation of the CF performance is critically needed on legal, institutional,
ecological, economic and social aspects to identify its gaps, constraints and opportunities in order that CF
process can be improved and its progress sped up.
Having recognized the need for a systematic study of CF, ECCDI a leading Yangon based NGO,
encouraged and supported by Pyoe Pin Programme of (FCO/DFID) organized a community forest
research project design workshop at the Chatrium Hotel in Yangon, in September 2010. ECCDI
presented a proposed CF research methodology which participant stakeholders reviewed, improved and
approved. The method was then finalised and implemented through field study.
2.2 Research questions
At the outset of this study we identified some key objectives and research questions. The overall objective
of the research was to appraise community forests in the context of the following aspects:
o Ecological aspect
o Policy/Legal/Institutional aspects
o Social aspect, and
o Financial/Economic aspect
We also identified a number of specific sub-questions:
1. What was the pre-formation situation (the „base line‟ from which to measure change)?
2. Are FUG groups actually being formed properly, becoming institutionalised; continuing to work
once formed, and are they receiving adequate post-formation support?
3. Have they been able to manage and protect forests effectively?
4. Has CF management actually led to regeneration and / or improvement in forest condition?
5. Has forest regeneration led to livelihood benefits becoming available, and are they being shared?
6. Is the distribution of benefits (and costs) from CF fair and equitable, and in particular are the
poor and most needy getting benefits?
7. Are responsible FD staffs adequately aware of and committed to community forestry and CFI
1995, and are they performing their responsibilities well?
Additionally we wanted to understand:
What is the future potential of CF?
Can CF be scaled up, in the context of limited external funding support?

12
2.3 Approach and sampling
To address these objectives and questions we sought to apply a mixed method across a representative
range of FUGs across the country, to represent the diversity of different CFs. We therefore developed a
„nested‟ research approach, in which we selected four states / regions across the country, then around 4
FUGs in each, and a sample of households within these to study a manageable number of FUGs in
depth. Stratified multi-stage sampling was applied to select CFs for appraisal, and sixteen community
forests and forest users‟ groups (FUGs) were chosen. In every selected CF both forest resource and social
surveys were undertaken. The selection procedure was as follows.
2.3.1 Region / State Stratification (First stage selection)
Out of the 7 States and the 7 Divisions constituting the Union of Myanmar, two States and two Regions
were purposively selected based on the abundance and importance of the CFs. The following were
chosen:
1. Kachin State
2. Shan State
3. Mandalay Region,
4. Ayeyawady Region.
2.3.2 Selection of townships (Second stage selection)
Eight townships were selected objectively, according to the frequency of FUGs in the selected states and regions. Although we aimed to have two townships per region or state, only one township could be selected in Kachin State where there are fewer FUGs, while three townships in Shan State, two each in Mandalay and Ayeyawady Regions were selected with probability proportional to the number of CFs in the townships.
2.3.3 Selection of CFs (Third stage selection)
Within each selected township two CFs were selected at random. They were the ultimate units where all
observations necessary for the analysis were made. They are presented in Table 3.2. The selection of CFs
or FUGs in each selected township was made at random. In planning the sampling design we selected 3
CFs, the third one as a reserve in each township.
Among the 16 FUGs randomly selected at this stage, when we visited the site of Saung Myint FUG in
Nyaung Shwe Township, Shan State, it was found to have had dispersed. The FUG and the whole village
had 13 households with only about 7 elderly men. When 2 of them died of sickness, the villagers decided
to move to nearby villages where they had relatives, so the FUG became inactive, but the CF remained
intact, functioning well. It had an area of 364 acres of natural forest established in December 2001 and
had already got its Community Forest Certificate. So, we moved to an alternate site: Nar Daung Hla CF
which has been selected as a reserve CF at the planning stage.
2.3.4 Household sampling - stratification by wealth ranking
For the social aspects of the research, within each FUG we selected about 20% of households for
interview. In order to ensure our selection reflected the range of socio-economic groups we followed a
random sampling approach, stratified by subjective wealth ranking. The wealth ranking was done by the
participants by completing the following matrix for each household after discussion and having agreed
among themselves-

13
Table 2.1: Wealth ranking categories
Food secure Food insecure
Land holding 2 – ‘rich’ 1 – ‘moderate’
Landless 1 – ‘moderate’ 0 – ‘poor’
The wealth ranking system is as follows-
If a household has land holding and food is secure, then the wealth rank is “2” – „rich‟
If a household is landless but food is secure, then the wealth rank is “1” „moderate‟.
If a household has land holding but food is insecure, then the wealth rank is “1” „moderate‟
Finally, if a household is landless and food is also insecure, then the wealth rank is “0” – „poor‟
After stratifying the village by wealth rank, 20% of households in each stratum were selected for
questionnaire survey. A total of 272 households in 16 selected CFs had been surveyed by the two social
survey teams.
Table 2.2: Selected States/Regions, Townships and Community Forests
State/Region Townships selected Community forests selected
Kachin Waing Maw 1. Wuyan 2. Gweyutan
Mandalay Pyin U Lwin 3. Sin Gaung Lay 4. Pa De Thar Myothyit
Nyaung U
5. Myay Thin Twin 6. Let Pan De
Shan (south)
Pindaya 7. Mine In 8. Pway Hla
Nyaung Shwe 9. Lwai Nyeint 10. Nar Daung Hla
Pinlaung 11. Kone Shine 12. 2. Taung Kya- 1
Ayeyawady Laputta 13. Nyaung Ta Bin 14. Byant Gyi Gon
Phyarpon 15. Te Bin Seik 16. War Kon
Total: 4 S/R 8 townships 16 community forests
Maps 2.1 and 3.1 below show sites of selected community forests.
2.4 Methods
Field work in 16 CFs and villages started in the first week of October and completed by the end of
December 2010. Research work was organized as shown in the Organogram in Figure 3.2.
We developed a multi-disciplinary method, involving forest assessment, community institutional
assessment, and household livelihood assessment. At each site we applied a combined method: Forest
Survey (described in detail in Appendix 3.1) and Social survey. Data collection involved four teams – two
forest ecosystem survey teams and two social survey teams. They visited each selected CF and its FUG,
and collected forest resource, ecological, economic and social data/information.
2.4.1 Forest Survey
The forest ecosystem at each site was studied in detail by the forest survey team – full details are
presented in Appendix 3.1. A forest survey team comprised a staff officer, a deputy ranger, two foresters
and three field assistants. Deputy Ranger and foresters were provided by the concerned Township Forest
Department.

14
Map 2.1: The study sites for this research
2.4.2 Social Survey
Data was collected using a combination of village level PRA and other assessment, environmental
inventory, household interview. Data instruments are available on request. Two social survey teams each
comprising three social scientists carried out the social survey. Each team visited eight villages (or
CFUGs). The teams used the following PRA tools
1. Wealth ranking
2. Venn diagram

15
3. Seasonal calendar
4. Mind mapping, and
5. Problem analysis
The PRA covered issues concerning CFUG‟s awareness on CF, FD‟s and NGO‟s supports to CF, FUG‟s
institution and management, economics, sociality, environment and marketing.
2.5 Merits and constraints of the method
Our study faced a number of constraints. Perhaps the major one has been that we lack baseline data in
order to understand the extent of change. So we are obliged to rely on approximating the „pre-CF
situation, triangulating from various sources. Further, villagers were reluctant to be interviewed by
strangers from Yangon, which could have impacted on the quality of the data.
Nevertheless, overall and considering the rapid nature of the study, we are relatively confident that the
research is representative due to a statistically sound sampling method in the selection of the sample CFs.
However, there is no doubt each region will have a distinct experience – and so to develop regionally
appropriate policies each region needs to be considered.
Due to resource constraints we were not able to include non-FUG villages to compare. We were also not
able to conduct interviews with other stakeholders, such as local authorities, NGOs and so on.
Figure 2.1: Organogram of Community Forest Research Field Process
Notes: AD= Assistant Director; SO = Staff officer; FRSST = Forest Resource Survey Sub-Team; SSST = Social Survey Sub-Team
Research Coordinator
Research Team Research
Director
Field Team 1 (AD 1)
FRSST (SO 1)
Field Team 2 (AD 1)
Field assistants 3
Foresters 2
Deputy Ranger 1
Social surveyors 2
Interview FD Staff
Resource Assessment
Wealth Ranking
FGD KI/N-FUG
FGD FUG
Case study
HH Quest.
Village Meeting
Research Advisory Committee
SSST (SO 1)
FRSST (SO 1)
SSST (SO 1)


17
Chapter 3: THE POLICY, LEGAL AND INSTITUTIONAL CONTEXT OF
COMMUNITY FORESTRY IMPLEMENTATION
3.1 Introduction
This section reviews the emergence of community forestry in Myanmar, and its relationship with the
overall forestry policies and laws. It then looks at the implementing partners and particularly the role of
donors in supporting implementation. We finally consider the overall progress in implementation and
compare different regions.
3.2 Communities, Forestry and Policies
Myanmar‟s long tradition of scientific forestry was initiated by Dr Dietrich Brandis, the German Scientist,
who was appointed as Superintendant of Forests for Bago province in 1856, and who introduced the first
working plan for Bago in 1857 with the object of sustainable forest management. Brandis developed the
so-called Brandis Selection System.
Brandis proposed in 1856 that the chief objectives of forest management in Myanmar should be:
1. To protect and, as far as possible, to improve the forests, to arrange the cuttings so as to
keep well within the productive powers of the forests, and to ensure a permanent and
sustained yield from them.
2. To keep the inhabitants of the forests and the people in the vicinity friends and allies.
3. To produce an annual surplus revenue as soon as possible.
Objective 2 indicates that the concept of involving the local community in forestry has been considered
since the very initial stage of scientific forestry in Myanmar. Following from this, Working Plans
formulated for each forest district in the country included Local Supply Working Circles (LSWCs) in
addition to the Teak Selection Working Circle and Commercial Supply Working Circle, etc.
3.2.1 The 1995 Myanmar Forest Policy
The current Myanmar Forest Policy 1995 sets out the nation‟s forest management aims as: protection,
conservation, efficient utilization and sustainable development of forest resources and natural ecosystems
to ensure environmental, social and economic prosperity of the people of Myanmar while contributing to
global environmental stabilization. It underlines sustainable forest management without impairing the
production capacity, while meeting social and community needs and conserving biological diversity and
environmental stability (Anon, 1995).
The 1995 Policy, keeping in view principles adopted at the 1992 UN Conference on Environment and
Development (UNCED) and the Government„s political commitments and national development policy,
identifies six imperatives. Of these, regarding community forestry, two imperatives are „participation‟ and
„public awareness‟. „Participation‟ clarifies that by way of practicing community forestry or agro-forestry,
communities are to be involved in national and local efforts for:
o Achieving sustainable development of forests;
o Meeting their basic needs; and
o Increasing non-farm incomes.

18
The imperative „public awareness‟ clarifies that public awareness on the vital role of trees, forests and
wildlife in national socio-economic development is to be raised.
3.2.2 The 1992 Forest Law and 1995 Rules
The Government enacted the new Forest Law in 1992, superseding the previous 1902 Forest Act. The
new Law has 58 Articles; however, it does not have any provisions relating to community forestry except
Article 15 which states:
“the Director-General of the Forest Department may grant permission to establish, with stipulation, the following village-
owned firewood plantations in a reserved forest or protected public forest or on land at the disposal of the Government in
the vicinity of the village
a) firewood plantations established by the Forest Department for a certain period and then transferred to be maintained
and used as village-owned;
b) village-owned firewood plantation established, maintained and used by the village by collective labour”.
Forest Rules were issued by the Ministry of Forestry in 1995 for the implementation of the Forest Law
1992, according to the empowerment stipulated by the Article 57 (b) of the Forest Law. The Forest Rule
No. 42 to implement the Article 15 (a) of the Forest Law states:
a) Forest Department has to undertake all the first-year activities of firewood plantation to be established;
b) The villagers concerned should carry out all the necessary maintenance and tending works of the firewood plantation
starting from the second year till the harvest with the technical assistance provided by the Forest Department;
c) Tax shall be levied by the Forest Department on the villagers if the harvest is used for commercial purpose.
The Forest Rule No. 43 to implement the Article 15 (b) of the Forest Law articulates:
a) Forest Department has to distribute seedlings which are suited to the local conditions for the establishment year;
b) Starting from the establishment year till the harvest, the villagers should carry out all the necessary works of the
firewood plantation following the technical guidance provided by the Forest Department;
c) Forest Department should also provide and demonstrate agro-forestry techniques to the villagers;
d) The villagers can harvest for their own use free of charge at the harvest time prescribed by the Forest Department.
There is no single expression of community forestry or community forest in the whole of the Forest Law.
Only Section 15 of the Forest Law mentions about the establishment of village-owned firewood
plantations established either by FD or by the villages by collective labour. These village-owned firewood
plantations cannot be termed as community forests due to the lack of coordination between FD and the
villages in establishing and managing these firewood plantations. Thus, to promote Community Forestry
new provisions were needed.
3.2.3 The 1995 Community Forestry Instruction
The major shift towards local community participation in managing Myanmar‟s forest resources formally
commenced with the Community Forestry Instructions (CFI), issued by the FD in December 1995 as a
policy response to the widespread forest degradation and the increased demand of growing rural
communities for forest products and services. Multilateral agencies were also encouraging the Forest
Department to create an enabling policy environment for participatory resource management. The
Deputy Director General of the Planning and Statistics Dept. at the Ministry of Forestry (the lead author
of the present paper, Dr Kyaw Tint) initially formulated the CFI, and when he became the Director
General was able to adopt the Instruction and direct all the forest staff to implement it. Myanmar‟s CF
model is described in the Box below-(The CFI 1995 text is shown in Appendix I)
19
In terms of Forest Department management planning, LSWC and CF are put together in one Working
Circle in District Management Plans. They do not overlap each other, and they are not the same in many
aspects: LSWC is established and managed fully by the FD for the local community; CF is established,
managed and utilized by the community for the community. The community has the land use right and
the land is inheritable.
3.2.4 The Forestry Master Plan 2001
Community forestry implementation received a major boost in 2001 with the 30-year Forestry Master
Plan of 2001-02 to 2030-31, in which the important role of community forestry as a participatory tool to
achieve sustainable forest management and uplift rural livelihoods was recognized. In pursuance of this
the Forest Department set the following targets:
a) To establish CF as an integral part of the strategy to achieve sustainable forest management and to obtain forest products on a sustainable basis;
b) To make a significant contribution towards the rehabilitation of the annual deforestation of 544, 060 acres (220,178 ha) (about 0.3% of the country‟s total land area of 167.185 mil. acres or 67.66 m ha);
c) To achieve 2.27 mil. acres (0.919 mil ha) of CF by 2030; (or 1.36% of the country) d) To obtain wood fuel amounting to 4.13 mil m3 (25% of the total wood fuel requirement of 16.53 mil.
m3 at the end of Master Plan‟s period).
3.2.5 Summary
The CFI is provides a set of instructions to promote community forestry in the country, and as such
could be issued by the Ministry of Forestry without requiring the lengthy process inevitably involved in
securing Cabinet approval. As such, it is a lesser order of legal instrument than a law. Despite the strong
endorsement in the Master Plan the CFI needs strengthening
Although the CFI 1995 forms a good basis, in order to strengthen the CF programme in
Myanmar there is therefore a need to issue a Community Forestry Law to consolidate and
strengthen the provisions of the Instruction, and the Instruction might then form the basis
for Rules(12)
Therefore, before promulgating a Community Forestry Act, it may be desirable that the
existing Forest Law 1992 should be supplemented with appropriate provisions to ensure legal
basis for community forestry promotion. Sections that protect the CF are very important and
should also be included. This will gain the trust of the community and will also give them
the sense of security and ownership.

20
3.3 Organisations and Institutions Implementing Community Forestry
Implementation of CF has typically involved a partnership between local communities, the Forest
Department, and donor-supported projects
3.3.1 The Forest Department
The Forest Department, which was formally constituted in 1906, issued the CFI and is the main
institution responsible for its implementation. The FD comprises 557 officials and 14,591 support staff
making a total of 15,148 staff members (Anon. 2003). It does not yet, however, have a separate division
or section specifically tasked with the community forestry responsibilities. Rather district-level FD staffs
mobilize and sensitize the community and establish community forests in their areas.
As with many countries, adapting to the new policy has been a major challenge to the forest
administration. Implementing CF has required a change in working practices; both in terms of providing
the technical services for formation (awareness raising, forest boundary delineation, mapping; inventory,
management planning and establishment support, paperwork regarding application for certificate); as well
as post-formation support.
3.3.2 Dry Zone Greening Department
The Dry Zone Greening Department (DZGD) was established in 1997 with the main responsibility for
taking all necessary measures to prevent and check the degradation of the harsh environment of the
Central Dry Zone of Myanmar. The majority of this department‟s activities are implemented through
community participation and community forestry. The department comprises 137 officials and 3,094
subordinate staff to make a total staff of 3,231 members (Anon. 2003)
3.3.3 Training Centres
In order to raise the capacity of the staff of the FD and DZGD, FD together with JICA, implemented a
project called Community Forestry Training and Extension (COMFORT) from 2004-2005 to 2005-2006.
The project was stationed at Pathein Gyi and was an extension of the Central Forestry Development
Training Centre (CFDTC), Hmawbi. A total of 25 trainings were conducted during the project period
(2004 – 2006) and 424 forest staffs from different levels were trained. Although the project had some to
an end, FD is still continuing with the training. Moreover, CF is also taught as part of the course on
Social Forestry at the University of Forestry, Yezin.
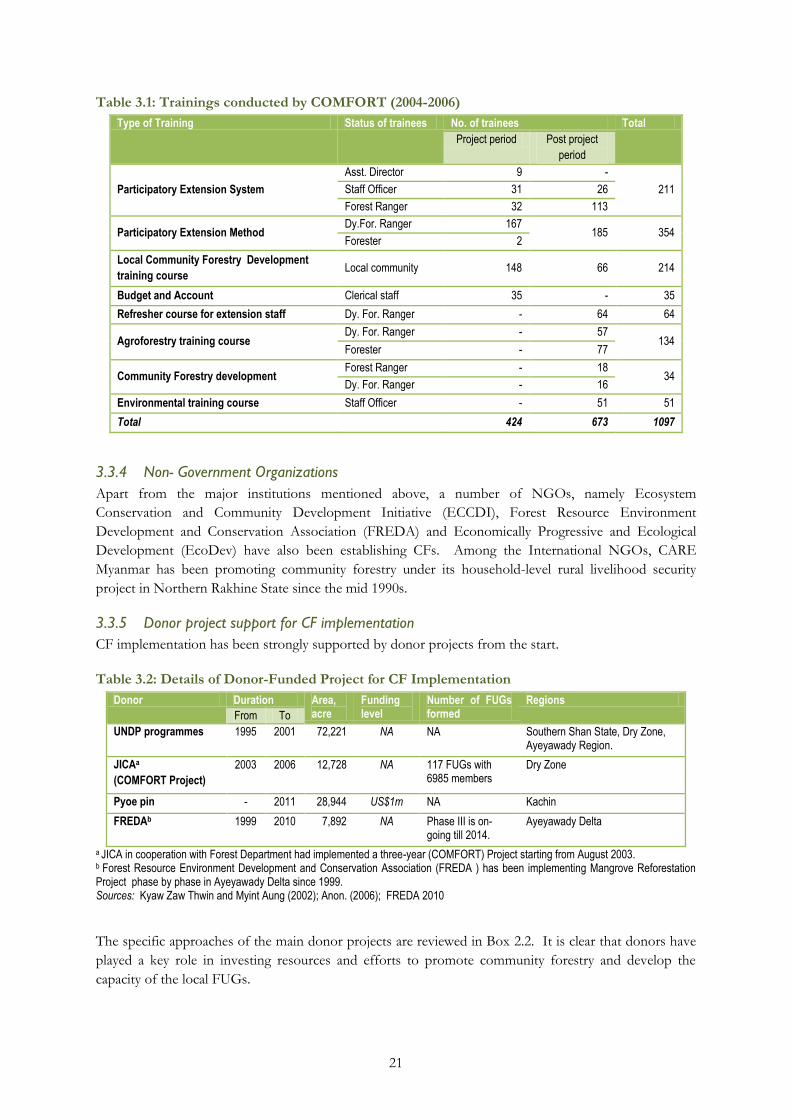
21
Table 3.1: Trainings conducted by COMFORT (2004-2006)
Type of Training Status of trainees No. of trainees Total
Project period Post project
period
Participatory Extension System
Asst. Director 9 -
211 Staff Officer 31 26
Forest Ranger 32 113
Participatory Extension Method Dy.For. Ranger 167
185 354 Forester 2
Local Community Forestry Development
training course Local community 148 66 214
Budget and Account Clerical staff 35 - 35
Refresher course for extension staff Dy. For. Ranger - 64 64
Agroforestry training course Dy. For. Ranger - 57
134 Forester - 77
Community Forestry development Forest Ranger - 18
34 Dy. For. Ranger - 16
Environmental training course Staff Officer - 51 51
Total 424 673 1097
3.3.4 Non- Government Organizations
Apart from the major institutions mentioned above, a number of NGOs, namely Ecosystem
Conservation and Community Development Initiative (ECCDI), Forest Resource Environment
Development and Conservation Association (FREDA) and Economically Progressive and Ecological
Development (EcoDev) have also been establishing CFs. Among the International NGOs, CARE
Myanmar has been promoting community forestry under its household-level rural livelihood security
project in Northern Rakhine State since the mid 1990s.
3.3.5 Donor project support for CF implementation
CF implementation has been strongly supported by donor projects from the start.
Table 3.2: Details of Donor-Funded Project for CF Implementation
Donor Duration Area, acre
Funding level
Number of FUGs formed
Regions
From To
UNDP programmes 1995 2001 72,221 NA NA Southern Shan State, Dry Zone, Ayeyawady Region.
JICAa
(COMFORT Project)
2003 2006 12,728 NA 117 FUGs with 6985 members
Dry Zone
Pyoe pin - 2011 28,944 US$1m NA Kachin
FREDAb 1999 2010 7,892 NA Phase III is on-going till 2014.
Ayeyawady Delta
a JICA in cooperation with Forest Department had implemented a three-year (COMFORT) Project starting from August 2003. b Forest Resource Environment Development and Conservation Association (FREDA ) has been implementing Mangrove Reforestation Project phase by phase in Ayeyawady Delta since 1999. Sources: Kyaw Zaw Thwin and Myint Aung (2002); Anon. (2006); FREDA 2010
The specific approaches of the main donor projects are reviewed in Box 2.2. It is clear that donors have
played a key role in investing resources and efforts to promote community forestry and develop the
capacity of the local FUGs.

22
3.3.6 Forest Users’ Groups (Community-Based Organizations)
The key local institutions in Community Forestry are the Forest Users‟ Groups (FUGs), which are
Community-based organizations (CBOs) which establish and manage community forests (CFs). They are
the on-site managers of forests surrounding them whilst their daily life and forest resources are tightly
coupled together. However, from a review of existing literature, observations and discussions with
stakeholders there is a clear consensus that the FUGs are suffering from a number of limitations:
o Many of the FUGs are not properly aware of the CFI and community forestry. They have not been
adequately trained in this context.
o Generally, FUGs are too weak technically. They need various technical trainings such as planning,
reporting, accounting and book keeping.
o Basically they are hand to mouth people with limited resources; therefore, they need early returns for
their subsistence or livelihood support to participate in the establishment of CF. It will be difficult
for them to wait for 5 or 6 years to benefit from the forest.
o They need follow-up support from FD both technically and legally. They need legal support to
protect the forests, forest land and their rights.
o Currently, most of the management committees of FUGs do not include any village administration
personnel. The inclusion of local authority in the management committee will lift its status and
facilitate management.

23
3.4 Progress in Implementation of Community Forestry
As of 31 May 2010, after almost 15 years of implementation, 572 CFs have been awarded CFCs, covering
104,148 acres (42,148 ha) (as indicated in Figure 2.1 below) and involving 40,062 forest users. Formation
peaked in 2001-2, followed by another relatively high year in 2003-4, but has been declining since then.
The total area is 104,148 acres (approx. 42,148 ha).
Figure 3.1: Community forest areas established from 1996 to 2010
Source: Planning and Statistics Division, Forest Department
The peak hand-over level of over 39 thousand acres handed over for community forests, occurred in
2001-2002 due to the high inputs from the Human Development Initiative (HDI) project of the United
Nations Development Programme (UNDP) in the Dry Zone, Southern Shan State and the Ayeyawady
Region(11).
Table 3.3: Cumulative area of community forests and donor contribution (acres)
1996 to 2001* 1996 to 2003** 1996 to 2010# Remarks (7) Non-
donor (2)
Donor support (3)
Total area (4)
Total area (Mix of donor and non-donor) (5)
Total area (Mix of donor and non-donor) (6)
5,629 72,221 77,850 - - Donor is UNDP. Of 5629 ac. by non-donor implementation, 97% is natural forest CF.
81,732 - Natural forest CF represents 78%
104,146 572 user groups with 40,062 members
Sources: *Kyaw Zaw Thwin and Myint Aung 2002; **Kyi Maung 2004 ; #Forest Department
During the period 1996 – 2001 (column 4), a total of 77,850 acres of community forest was formed, of
which 92.8% represented donor-supported CFs with the remaining 7.2% representing non-donor, the
yearly average area was 12,975 acres. The primary donor organization during this period was UNDP
which included a community forestry component in its Human Development Initiative (HDI)
Programme.
During the period of 1996 to 2003, as shown in column (5), a total area of 81,732 acres of community
forest was formed by FD and donors. Thus, only 3,882 acres of CF could have been established in 2002
and 2003; the yearly average was therefore 1,941 acres. This sharp drop in the yearly average was
attributable to the lack of capacity of UNDP in community forest establishment in the Integrated
Community Development Project under its HDI IV Programme.
1996-97
1997-98
1998-99
1999-00
2000-01
2001-02
2003-03
2003-04
2004-05
2005-06
2006-07
2007-08
2008-09
2009-10
Area (acre) 3428 1374 12516 6587 8088 39506 7650 16150 6235 5812 2302 2843 2717 105
0
5000
10000
15000
20000
25000
30000
35000
40000
45000
Are
a, a
cres
Financial years
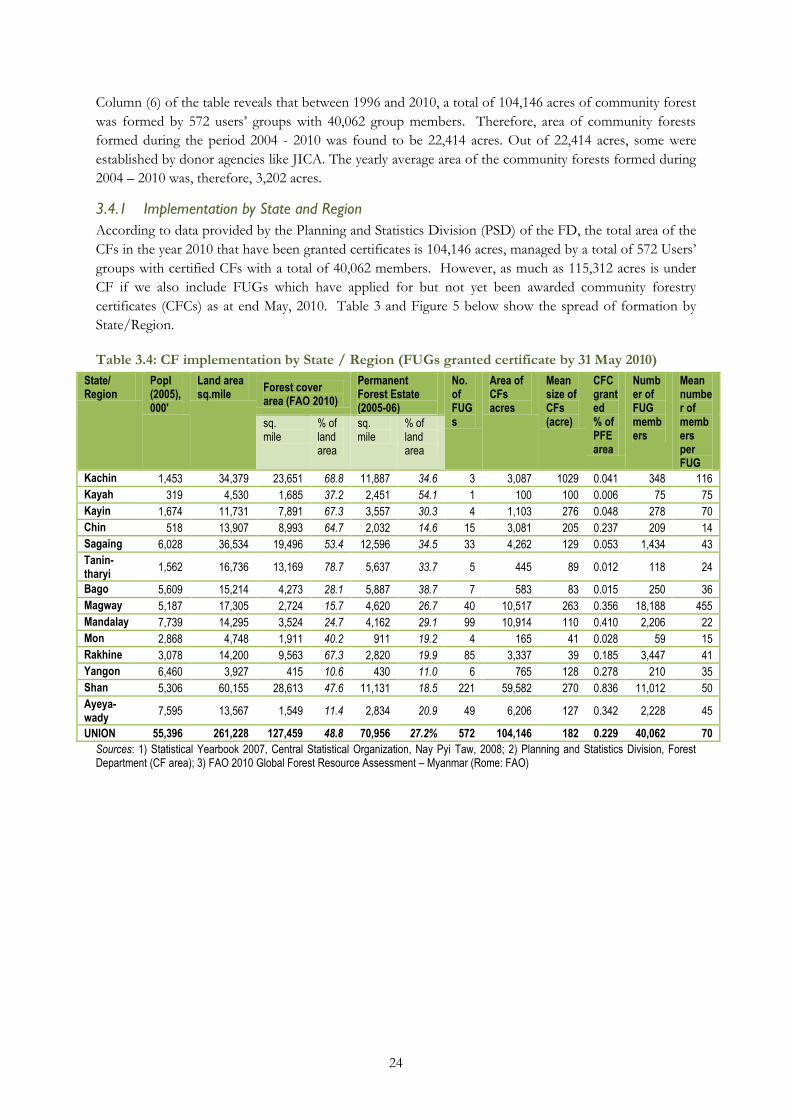
24
Column (6) of the table reveals that between 1996 and 2010, a total of 104,146 acres of community forest
was formed by 572 users‟ groups with 40,062 group members. Therefore, area of community forests
formed during the period 2004 - 2010 was found to be 22,414 acres. Out of 22,414 acres, some were
established by donor agencies like JICA. The yearly average area of the community forests formed during
2004 – 2010 was, therefore, 3,202 acres.
3.4.1 Implementation by State and Region
According to data provided by the Planning and Statistics Division (PSD) of the FD, the total area of the
CFs in the year 2010 that have been granted certificates is 104,146 acres, managed by a total of 572 Users‟
groups with certified CFs with a total of 40,062 members. However, as much as 115,312 acres is under
CF if we also include FUGs which have applied for but not yet been awarded community forestry
certificates (CFCs) as at end May, 2010. Table 3 and Figure 5 below show the spread of formation by
State/Region.
Table 3.4: CF implementation by State / Region (FUGs granted certificate by 31 May 2010)
State/ Region
Popl (2005), 000'
Land area sq.mile
Forest cover area (FAO 2010)
Permanent Forest Estate (2005-06)
No. of FUGs
Area of CFs acres
Mean size of CFs (acre)
CFC granted % of PFE area
Number of FUG members
Mean number of members per FUG
sq. mile
% of land area
sq. mile
% of land area
Kachin 1,453 34,379 23,651 68.8 11,887 34.6 3 3,087 1029 0.041 348 116
Kayah 319 4,530 1,685 37.2 2,451 54.1 1 100 100 0.006 75 75
Kayin 1,674 11,731 7,891 67.3 3,557 30.3 4 1,103 276 0.048 278 70
Chin 518 13,907 8,993 64.7 2,032 14.6 15 3,081 205 0.237 209 14
Sagaing 6,028 36,534 19,496 53.4 12,596 34.5 33 4,262 129 0.053 1,434 43
Tanin-tharyi
1,562 16,736 13,169 78.7 5,637 33.7 5 445 89 0.012 118 24
Bago 5,609 15,214 4,273 28.1 5,887 38.7 7 583 83 0.015 250 36
Magway 5,187 17,305 2,724 15.7 4,620 26.7 40 10,517 263 0.356 18,188 455
Mandalay 7,739 14,295 3,524 24.7 4,162 29.1 99 10,914 110 0.410 2,206 22
Mon 2,868 4,748 1,911 40.2 911 19.2 4 165 41 0.028 59 15
Rakhine 3,078 14,200 9,563 67.3 2,820 19.9 85 3,337 39 0.185 3,447 41
Yangon 6,460 3,927 415 10.6 430 11.0 6 765 128 0.278 210 35
Shan 5,306 60,155 28,613 47.6 11,131 18.5 221 59,582 270 0.836 11,012 50
Ayeya-wady
7,595 13,567 1,549 11.4 2,834 20.9 49 6,206 127 0.342 2,228 45
UNION 55,396 261,228 127,459 48.8 70,956 27.2% 572 104,146 182 0.229 40,062 70
Sources: 1) Statistical Yearbook 2007, Central Statistical Organization, Nay Pyi Taw, 2008; 2) Planning and Statistics Division, Forest Department (CF area); 3) FAO 2010 Global Forest Resource Assessment – Myanmar (Rome: FAO)

25
Map 3.1: Distribution of Forest Users’ Groups by Township (with study sites numbered)
approximate position of an FUG

26
Figure 3.2: Distribution of Community Forests across the States and the Regions
Among the States/Regions Shan, Magway, Rakhine, Mandalay, and Ayeyawady have achieved most, and
all excepting Rakhine happened to fall in the UNDP and JICA projects, where both material and
technical inputs had been available. Rakhine CFs were supported by CARE.
Shan State had been most active with 59,582 acres (24,113 ha) of CF while Kayah State was the most
inactive with only 100 acres (247 ha). Mon State also was very inactive having accomplished 165 acres (67
ha) only in the last 15 years. (See 2.5).
Each FUG has 70 members on average. Average number of participants in a FUG varies greatly from 15
households in Mon State to 455 in Magway Region.
Figure 3.3: Distribution of Community Forests by Forest Category
CF sizes vary from 5 acres (2.02 ha) to 2,850 acres (1,153 ha) with a mean size of 182 acres for the
country as a whole. Mean membership size varies from 14 to 455, with an overall mean of 70. The ages
for community forest plantations range from only a few months to about 15 years. Community natural
forests mostly occupy large areas.
3 1 4 15 33 5 4 3 40
99
4
85
6
192
15 14 49
0
20
40
60
80
100
120
140
160
180
200 N
um
ber
of
FU
Gs
Kachin
Kayah
Kayin Chin Sagai
ng Tanintharyi
Bago Mandalay
Magway
Mon Rakhi
ne Yang
on Shan
Ayeyawad
y
RF/PPF (acre) 3087 0 0 575 410 245 583 9652 1714 165 788 765 25099 6206
PF (acre) 0 100 1103 2506 3852 200 0 1263 8803 0 2550 0 34482 0
0
5000
10000
15000
20000
25000
30000
35000
40000
RF/PPF (acre)
PF (acre)
Are
a,
acre
s.

27
The community forests have been established in RFs (reserved forests), PPFs (protected public forests)
and PFs (public forests). The total area of CFs in RF/PPF and PF respectively is 49,289 acres (19,947 ha)
and 54,859 acres (22,201 ha).
3.4.2 Inadequate pace of implementation
The annual progress of CF establishment in the country in the last 15 years had averaged only 6,943 acres
(2,810 ha). This is which is undoubtedly too slow to meet the 30-year target set in the FD‟s Master Plan.
For this we would need to hand over 50,000 acres (approx. 2,000.ha) per year.
At this rate it is impossible to achieve 2.27 million acres by 2030 as targeted in the Master Plan. FD also
aims to obtain wood fuel amounting to 4.13 million m3 from community forests, i.e. 25% of the country‟s
total wood fuel requirement of 16.53 million m3 by 2030.
Thus, there is an evident need to scale up the CF process many fold to meet the national targets. The
main hold-ups are likely to include: insufficient interest and prioritisation, mobilization and commitment
from FD staff, delays in approval of applications, lack of communities‟ trust in land tenure and CF values.
Section References
Anon. 1995a: Myanmar Forest Policy. Forest Department Anon. 1995b: Community Forestry Instructions. Forest Department Anon. 2002: Facts about Myanmar. Ministry of Information 2002. Anon. 2002: Myanmar Facts and Figures 2002. Ministry of Information, Union of Myanmar Anon. 2003: Forestry in Myanmar. Forest Department, Myanmar. Anon. 2006: Lessons learnt from the project. Community Forestry Training and Extension Project.
Forest Department, 2006 Anon. 2008: Statistical Year Book 2007. Central Statistical Organization, Nay Pyi Taw, Myanmar. 2008 Brandis, D. 1896: The Burma Teak Forests. Garden and Forest, Vol. IX. Asia Pacific Forest Industries FREDA 2010: Information about FREDA, 2010. Ko Ko Gyi, M and Kyaw Tint 1995: Management status of natural teak forests (FAO: Rome)
Kyaw Tint. 2008:Forestry for the people (In Myanmar)
Kyaw Zaw Thwin & Myint Aung. 2002: Study on Community Forestry Development (In Myanmar). Forest Department, Ministry of Forestry, Myanmar
Lindsay, J.M. 1995: Community Forestry Rules for Myanmar. TSS-2 Report, MYA/93/005,FAO. Negi, S.S. 1991: Sir Dietrich Brandis, Father of Tropical Forestry. Bishan Singh Mahendra Pal Singh, 23-
A, Connaught Place, Dehra Dun-248001
.

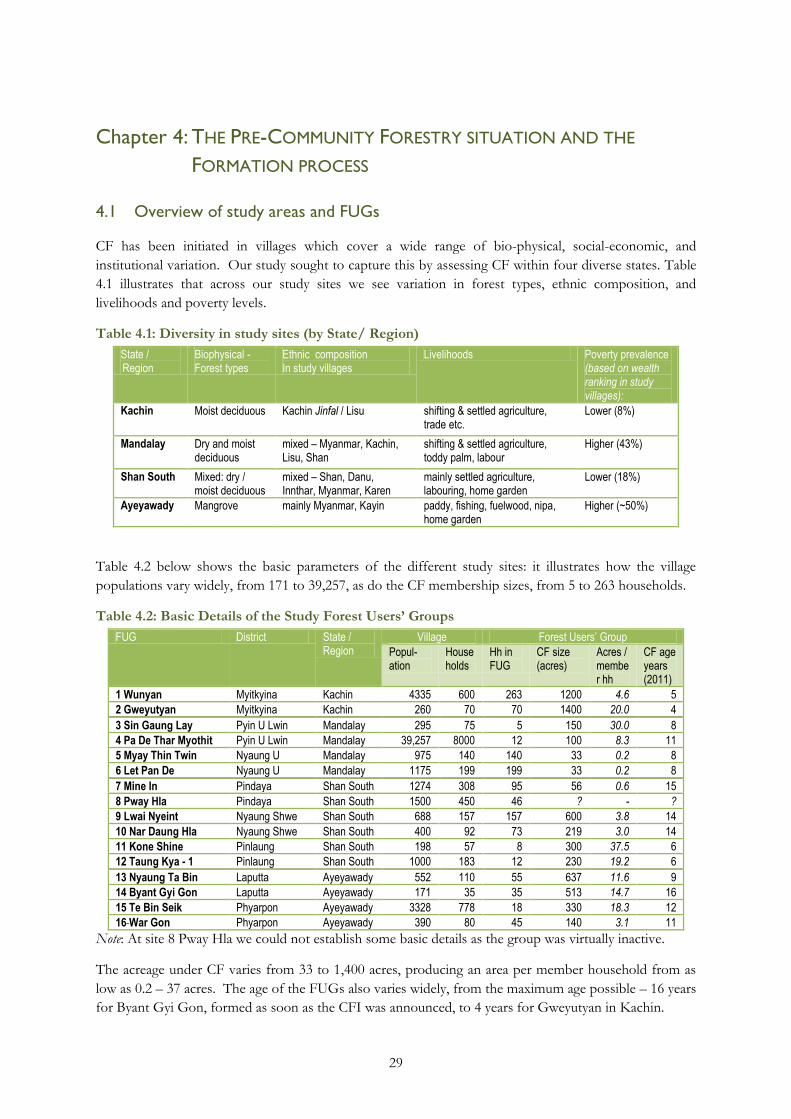
29
Chapter 4: THE PRE-COMMUNITY FORESTRY SITUATION AND THE
FORMATION PROCESS
4.1 Overview of study areas and FUGs
CF has been initiated in villages which cover a wide range of bio-physical, social-economic, and
institutional variation. Our study sought to capture this by assessing CF within four diverse states. Table
4.1 illustrates that across our study sites we see variation in forest types, ethnic composition, and
livelihoods and poverty levels.
Table 4.1: Diversity in study sites (by State/ Region)
State / Region
Biophysical - Forest types
Ethnic composition In study villages
Livelihoods Poverty prevalence (based on wealth ranking in study villages):
Kachin Moist deciduous Kachin Jinfal / Lisu shifting & settled agriculture, trade etc.
Lower (8%)
Mandalay Dry and moist deciduous
mixed – Myanmar, Kachin, Lisu, Shan
shifting & settled agriculture, toddy palm, labour
Higher (43%)
Shan South Mixed: dry / moist deciduous
mixed – Shan, Danu, Innthar, Myanmar, Karen
mainly settled agriculture, labouring, home garden
Lower (18%)
Ayeyawady Mangrove mainly Myanmar, Kayin paddy, fishing, fuelwood, nipa, home garden
Higher (~50%)
Table 4.2 below shows the basic parameters of the different study sites: it illustrates how the village
populations vary widely, from 171 to 39,257, as do the CF membership sizes, from 5 to 263 households.
Table 4.2: Basic Details of the Study Forest Users’ Groups
FUG District State / Region
Village Forest Users’ Group
Popul-ation
House holds
Hh in FUG
CF size (acres)
Acres / member hh
CF age years (2011)
1 Wunyan Myitkyina Kachin 4335 600 263 1200 4.6 5
2 Gweyutyan Myitkyina Kachin 260 70 70 1400 20.0 4
3 Sin Gaung Lay Pyin U Lwin Mandalay 295 75 5 150 30.0 8
4 Pa De Thar Myothit Pyin U Lwin Mandalay 39,257 8000 12 100 8.3 11
5 Myay Thin Twin Nyaung U Mandalay 975 140 140 33 0.2 8
6 Let Pan De Nyaung U Mandalay 1175 199 199 33 0.2 8
7 Mine In Pindaya Shan South 1274 308 95 56 0.6 15
8 Pway Hla Pindaya Shan South 1500 450 46 ? - ?
9 Lwai Nyeint Nyaung Shwe Shan South 688 157 157 600 3.8 14
10 Nar Daung Hla Nyaung Shwe Shan South 400 92 73 219 3.0 14
11 Kone Shine Pinlaung Shan South 198 57 8 300 37.5 6
12 Taung Kya - 1 Pinlaung Shan South 1000 183 12 230 19.2 6
13 Nyaung Ta Bin Laputta Ayeyawady 552 110 55 637 11.6 9
14 Byant Gyi Gon Laputta Ayeyawady 171 35 35 513 14.7 16
15 Te Bin Seik Phyarpon Ayeyawady 3328 778 18 330 18.3 12
16 War Gon Phyarpon Ayeyawady 390 80 45 140 3.1 11
Note: At site 8 Pway Hla we could not establish some basic details as the group was virtually inactive.
The acreage under CF varies from 33 to 1,400 acres, producing an area per member household from as
low as 0.2 – 37 acres. The age of the FUGs also varies widely, from the maximum age possible – 16 years
for Byant Gyi Gon, formed as soon as the CFI was announced, to 4 years for Gweyutyan in Kachin.
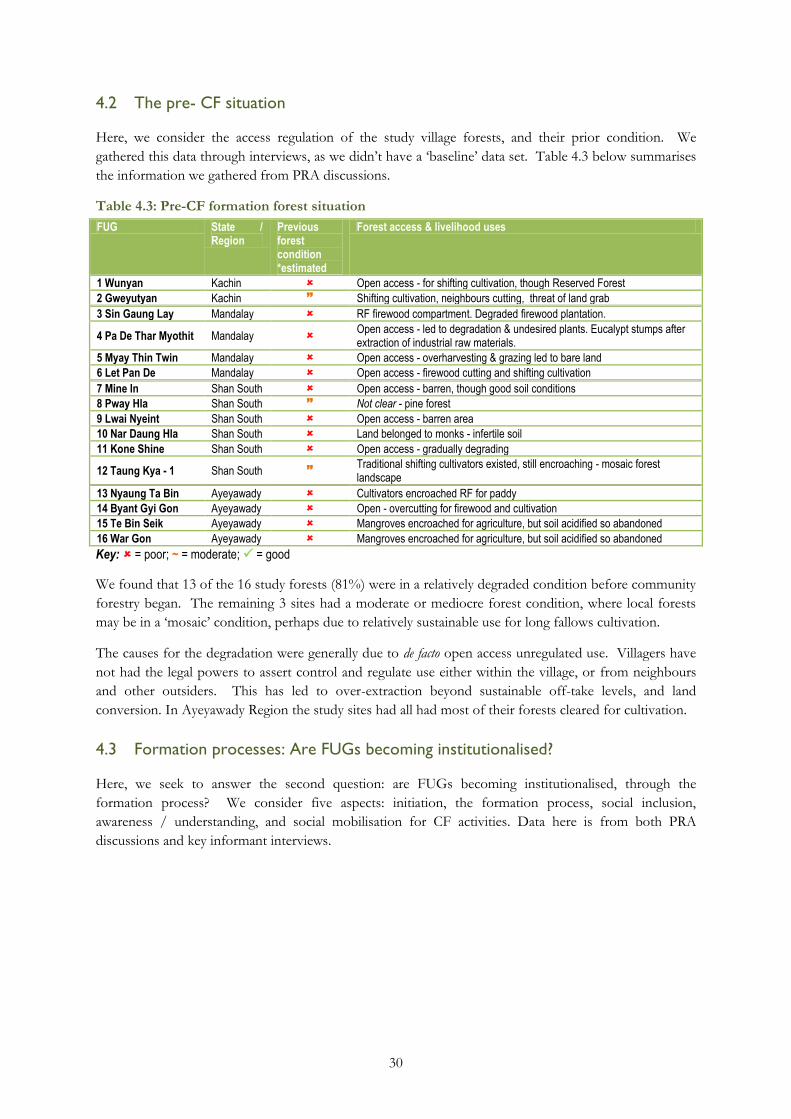
30
4.2 The pre- CF situation
Here, we consider the access regulation of the study village forests, and their prior condition. We
gathered this data through interviews, as we didn‟t have a „baseline‟ data set. Table 4.3 below summarises
the information we gathered from PRA discussions.
Table 4.3: Pre-CF formation forest situation
FUG State / Region
Previous forest condition *estimated
Forest access & livelihood uses
1 Wunyan Kachin Open access - for shifting cultivation, though Reserved Forest
2 Gweyutyan Kachin Shifting cultivation, neighbours cutting, threat of land grab
3 Sin Gaung Lay Mandalay RF firewood compartment. Degraded firewood plantation.
4 Pa De Thar Myothit Mandalay Open access - led to degradation & undesired plants. Eucalypt stumps after extraction of industrial raw materials.
5 Myay Thin Twin Mandalay Open access - overharvesting & grazing led to bare land
6 Let Pan De Mandalay Open access - firewood cutting and shifting cultivation
7 Mine In Shan South Open access - barren, though good soil conditions
8 Pway Hla Shan South Not clear - pine forest
9 Lwai Nyeint Shan South Open access - barren area
10 Nar Daung Hla Shan South Land belonged to monks - infertile soil
11 Kone Shine Shan South Open access - gradually degrading
12 Taung Kya - 1 Shan South Traditional shifting cultivators existed, still encroaching - mosaic forest landscape
13 Nyaung Ta Bin Ayeyawady Cultivators encroached RF for paddy
14 Byant Gyi Gon Ayeyawady Open - overcutting for firewood and cultivation
15 Te Bin Seik Ayeyawady Mangroves encroached for agriculture, but soil acidified so abandoned
16 War Gon Ayeyawady Mangroves encroached for agriculture, but soil acidified so abandoned
Key: = poor; ~ = moderate; = good
We found that 13 of the 16 study forests (81%) were in a relatively degraded condition before community
forestry began. The remaining 3 sites had a moderate or mediocre forest condition, where local forests
may be in a „mosaic‟ condition, perhaps due to relatively sustainable use for long fallows cultivation.
The causes for the degradation were generally due to de facto open access unregulated use. Villagers have
not had the legal powers to assert control and regulate use either within the village, or from neighbours
and other outsiders. This has led to over-extraction beyond sustainable off-take levels, and land
conversion. In Ayeyawady Region the study sites had all had most of their forests cleared for cultivation.
4.3 Formation processes: Are FUGs becoming institutionalised?
Here, we seek to answer the second question: are FUGs becoming institutionalised, through the
formation process? We consider five aspects: initiation, the formation process, social inclusion,
awareness / understanding, and social mobilisation for CF activities. Data here is from both PRA
discussions and key informant interviews.

31
Table 4.4: Study FUG Characteristics
FUG State /
Region
Initiation by? Year
form
ed
Age (years
from
formation)
Year
certificate
received
Delay in
receiving
certificate
1 Wuyan Kachin DfID / NGO /FD 2006 5 2007 1 year
2 Gweyutyan Kachin DfID / NGO / FD 2007 4 2007 -
3 Sin Gaung Lay Mandalay Self 2003 8 2003 -
4 Pa De Thar Myothit Mandalay Self 2000 11 2002 2 years
5 Myay Thin Twin Mandalay JICA / NGO / FD/DZGD 2003 8 2003 -
6 Let Pan De Mandalay JICA / NGO / FD/DZGD 2003 8 2003 -
7 Mine In Shan South UNDP/FD 1996 15 1996 -
8 Pway Hla Shan South UNDP/FD 2000 11 ? Not Known
9 Lwai Nyeint Shan South UNDP/FD 1997 14 2000 3 years
10 Nar Daung Hla Shan South UNDP/FD 1997 14 1997 -
11 Kone Shine Shan South UNDP/FD 2005 6 2005 -
12 Taung Kya - 1 Shan South UNDP/FD 2005 6 2006 1 year
13 Nyaung Ta Bin Ayeyawady JICA / NGO / FD 2002 9 2003 1 year
14 Byant Gyi Gon Ayeyawady Self initiated / FD 1995 16 1996 1 year
15 Te Bin Seik Ayeyawady FREDA NGO / FD 1999 12 2001 2 years
16 War Gon Ayeyawady JICA / NGO / FD 2000 11 2000 -
4.3.1 Who Initiated formation?
Three FUGs (Sin Gaung Lay, Pa De Thar Myothit and Byant Gyi Gon) in our study were „self-initiated‟.
The leader of Byant Gyi Gon (site 14) heard the announcement of the CF Instruction on the radio news,
and immediately consulted with the local Forest Department staff to initiate a group. This is also the
oldest of our study FUGs, being 16 years old. The other „self initiated‟ groups, Sin Gaung Lay (site 3) and
Pa De Thar Myothit (site 4) seem to be small groups of outside elites using the CFI to take over valuable
state forest land.
One FUG was formed with local NGO support (15. Te Bin Seik). This was through a local NGO -
FREDA with some resource support from a Japanese NGO.
The remaining 12 FUGs (81%) were formed in the context of donor supported projects working with the
Forest Department and local NGOs. This illustrates that the CF implementation has been largely donor-
driven.
o In Kachin DfID has been supporting local NGOs to facilitate formation.
o In Shan South, half of the study sites were formed around 1996-7 during the UNDP programme, a
further two in 2005, and one was unclear.
o In Mandalay Region two FUGs (in Pyin U Lwin Township) were formed by the FD while the other
two CFs (in Nyaung U Township) were formed by DZGD in conjunction with JICA in 2003.
o In Ayeyawady Region 2 of the 4 CFs were formed under JICA programme support to local NGOs,
one was through a local NGO (FREDA), and one self initiated.
It goes without saying that the FD and DZGD field staffs have played a key role in the process
For the formation process of CF, see “Myanmar’s CF model according to CFI 1995” in Chapter 2 above.
From Table 4.3 we can see that in 8 FUGs the certificate is granted in the same year that the Group is
initially formed, although in 7 groups there was delay of more than a year between initially forming the
group and receiving the approved CF Certificate (one group could not recall what happened). Where
there has been a delay for most groups it was only for one year, however, for 3 groups it was 2-3 years.

32
According to CFI 1995, the Community Forest must be officially established only after the Forest Users‟
Group has actually received the CFC. Therefore, strictly speaking FUGs should not establish CFs before
they get the CFCs (as no citizen has the right to transform a public forest into a CF at his own will). In
some cases, for instance in Kachin the FD staff have expressed concern that communities went ahead to
establish CFs without properly consulting with the concerned township FD staff or awaiting a certificate:
rather it is said that they established a de facto CF, and only then applied for permission. This creates
dissatisfaction with the local forest staff.
It is important to follow the sequential process of formation of a group, application for a CF
certificate and receipt of the certificate allowing commencement of Community Forest. It
requires clear communication between the local community, the township FD staff, and any
donors and NGOs involved.
A further issue here is land tenure: Not only the Forest Department but also the Settlement and Land
Record Department handle land management including land tenure. Villagers are struggling to get land
tenure rights for establishment of community forests due to the „red tape‟ procedure of the line
departments.
Securing land title for community land should be made more straightforward, with the
appropriate safeguards against elite capture.
4.3.2 The Formation process
Has formation actually led to effective FUG institutions? We have chosen to consider two indicators:
1. Are the appropriate households included in the group?
2. Are members mobilised for CF activities – meetings and forest activities?
Methodologically it is difficult to really know what happened several years ago, in some cases as long as
16 years ago, so the findings must be treated as somewhat approximate. Table 4.5 below indicates our
assessment based on PRA discussions.
Table 4.5: Institutionalisation of Study FUGs
FUG State/ Region
FUG membership
Appro-priate members included?
Members mobilised?
FUG initial institutionalised?
Comment
% of village
# hhs
1 Wuyan Kachin 33% 200 Inclusive & well organised
2 Gweyutyan Kachin 100% 70 Inclusive & well organised
3 Sin Gaung Lay Mndly 6% 5 ~ Mis-formed: elite capture
4 Pa De Thar Myothit Mndly 0.3% 11 ~ Small dynamic village sub-group
5 Myay Thin Twin Mndly 100% 166 ~ ~ Lack of clarity but initial efforts
6 Let Pan De Mndly 100% 222 ~ ~ Poor grasp of CF but initial efforts
7 Mine In Shan S 15% 47 ~ ~ Poor grasp of CF but initial efforts
8 Pway Hla Shan S ? ? ? Not launched: no-one understood
9 Lwai Nyeint Shan S 100% 157 ~ ~ Poor grasp of CF but initial efforts
10 Nar Daung Hla Shan S 67% 73 ~ ~ Lack of clarity but initial efforts
11 Kone Shine Shan S 100% 57 Despite vague grasp good efforts
12 Taung Kya - 1 Shan S 6.5% 12 ~ Mis-formed: elite capture
13 Nyaung Ta Bin Ayrwdy 44% 55 Inclusive & well organised
14 Byant Gyi Gon Ayrwdy 91% 32 Inclusive & well organised
15 Te Bin Seik Ayrwdy 2% 18 ~ Small dynamic village sub-group
16 War Gon Ayrwdy 62% 50 Inclusive & well organised

33
4.3.3 Are appropriate members included? Social inclusion in FUG
According to the CF Instruction, formation involves a „self-selection‟ process: those who want to
participate can form an FUG. During the formation process there is a need to ensure all are fully aware
of the opportunity, and what it entails, before they make an informed decision whether to join or not.
The „self-selection‟ formation approach differs from many other counties‟ CF approach, and is intended
to ensure only the motivated participate. Many of the poorest households live „hand to mouth‟ and so
cannot afford the time or financial inputs to participate, or the risk they may not benefit from their
efforts. However, there are risks of their non-inclusion as they may depend on the land which comes
under the FUG which may then exclude their use.
From the study sites, we found an average of 55% of the villagers is members of the FUGs.
o In six sites (37.5%) between 90 and 100% of households are included.
o In six sites (37.5%) a third or less of the village compose the FUG.
o In four cases this is a subgroup taking initiative when no one else expressed interested.
o But in two CFs this seems to be dysfunctional „elite capture‟ of village land.
Overall we found that 11 of the FUGs seemed to include the appropriate members, and not unduly
exclude suitable members. However in two cases there seemed to be moderate concerns over social
exclusion, and in two cases severe problems with „elite capture‟ of village lands.
The FUG membership selection process for FUG members is a lacuna in the CFI. The CFI
does not mandate whether the whole village should be included or indeed all the current
users of the forest, even those beyond the village. Neither does it say definitely how many
acres a household must be allowed at maximum. This weakness has allowed subgroups to
take over control of common property resources. .
One concern arising is the possible need to ‘reform’ the FUG to give membership to those
non members who want to join. At the moment there seems no such normal process for this.
4.3.4 Awareness and understanding
A fundamental part of CF formation is imparting an understanding of the basic concepts, roles and
responsibilities, across the village, FUG members and committee members. However, as we cannot
know exactly the extent of awareness and understanding at the time of formation, we cannot really assess
this effectively and have decided not to speculate here. Rather we consider later the current levels of
awareness and understanding and their implications for sustainability of FUGs.
4.3.5 Mobilisation
Despite the limitations of limited awareness or inclusion problems, it seems that half the groups showed
good initial mobilisation, and 7 of the 16 moderate mobilisation – only one being poor.
4.4 Overall
From our indicators we found 8 FUGs (50% of the sample) to be well institutionalised – mainly in
Kachin State and Ayeyawady delta. We found 5 FUGs to be moderately established (31%), but with
some problems. And we found 3 FUGs to be poorly institutionalised (19%). Significant problems have
arisen from a lack of inclusive inception activities and a lack of effective awareness-raising. So, in answer
to the research question most FUGs are getting relatively effectively institutionalised.


35
Chapter 5: COMMUNITY FOREST MANAGEMENT: PLANS AND PRACTICE
5.1 Introduction
Here, we consider whether FUGs have managed and protected forests effectively. Having brought a
forest users‟ group together their first challenge is to draft a management plan for the forest in question,
as it is a prerequisite to get the Forest Department permission to establish the Community Forest. The
Management Plan prescribes the methods of planting, silvicultural treatments and management,
protection and harvesting, amongst other things. It is of course vital that Management Plan prescriptions
are actually implemented in a timely and effective manner for the success and sustainability of the CF.
5.2 Management planning
5.2.1 Formulation of MP
Management planning needs technical skills:
o In case of an existing forest to be transferred to community management, the preparation of the
management plan will involve preparation of a management map and a stock map of the forest,
detailed procedure of rehabilitating degraded gaps in the natural forest, silvicultural treatments,
method of extraction and distribution of forest products. For natural forests Myanma Selection
System (i.e. selection felling not clearfelling) should be practiced.
o In the case of creating a new forest plantation, the preparation of the management plan will involve
detailed procedure of establishing a forest plantation, activities for protection and maintenance,
adoption of a rotation, method of harvest and distribution of forest products. For plantations, any
clear cutting system can be applied after fixing a suitable rotation
5.2.2 Management regimes in practice
Across our study we found a wide range of different sizes and types of community forests, and a range of
different management regimes. The four main regime types are:
1. Collectively managed protection for natural regeneration
2. Collectively managed production - plantation
3. Individually managed taungya agroforestry plots (planting trees with initial understorey of
agricultural crops)
4. Collective management on individually owned plots (only Ayeyawady).
In principle, the management committee (MC) is authorised to manage the CF collectively. Although CF
management should be collective as under CFI 1995, in practice it has been found to be more effective if
the CF area is split into individual plots and allocated to member households to operate and manage their
plots.
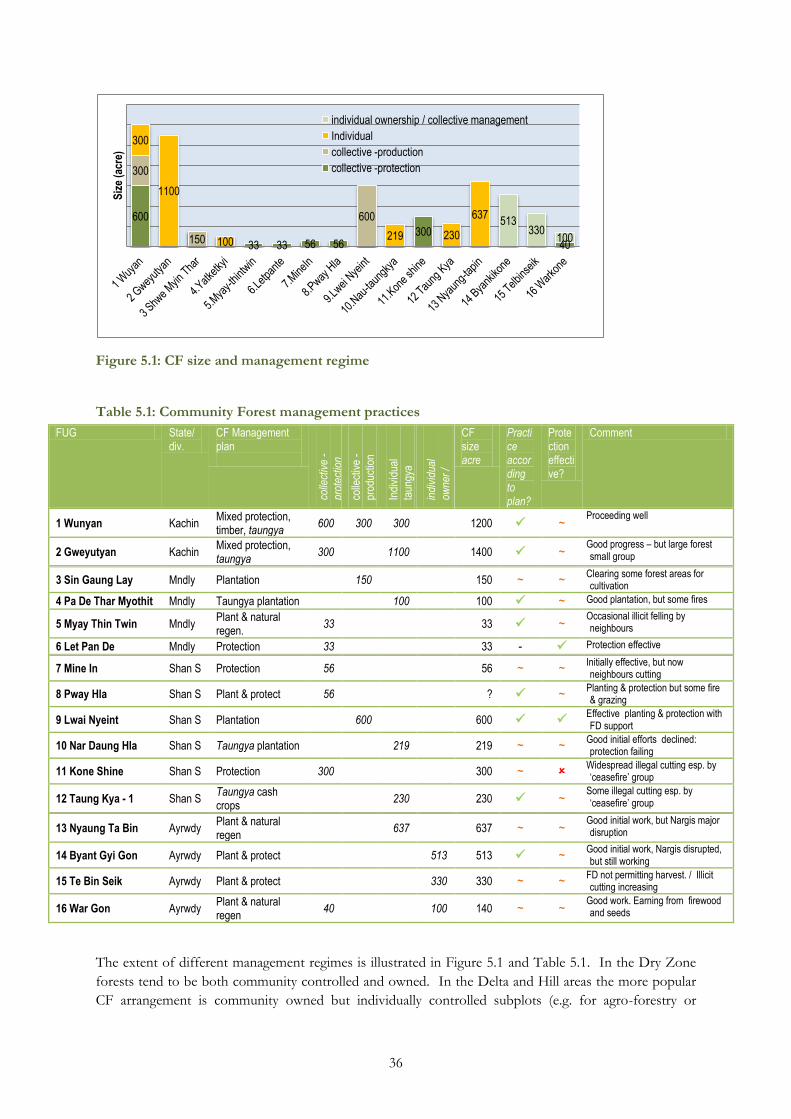
36
Figure 5.1: CF size and management regime
Table 5.1: Community Forest management practices
FUG State/ div.
CF Management plan
colle
ctiv
e -
prot
ectio
n
colle
ctiv
e -
prod
uctio
n
Indi
vidu
al
taun
gya
indi
vidu
al
owne
r /
colle
ctiv
e
man
age
CF size acre
Practice according to plan?
Protection effective?
Comment
1 Wunyan Kachin Mixed protection, timber, taungya
600 300 300 1200 ~ Proceeding well
2 Gweyutyan Kachin Mixed protection, taungya
300 1100 1400 ~ Good progress – but large forest small group
3 Sin Gaung Lay Mndly Plantation 150 150 ~ ~Clearing some forest areas for cultivation
4 Pa De Thar Myothit Mndly Taungya plantation 100 100 ~ Good plantation, but some fires
5 Myay Thin Twin Mndly Plant & natural regen.
33 33 ~ Occasional illicit felling by neighbours
6 Let Pan De Mndly Protection 33 33 - Protection effective
7 Mine In Shan S Protection 56 56 ~ ~ Initially effective, but now neighbours cutting
8 Pway Hla Shan S Plant & protect 56 ? ~ Planting & protection but some fire & grazing
9 Lwai Nyeint Shan S Plantation 600 600 Effective planting & protection with FD support
10 Nar Daung Hla Shan S Taungya plantation 219 219 ~ ~ Good initial efforts declined: protection failing
11 Kone Shine Shan S Protection 300 300 ~ Widespread illegal cutting esp. by ‘ceasefire’ group
12 Taung Kya - 1 Shan S Taungya cash crops
230 230 ~Some illegal cutting esp. by ‘ceasefire’ group
13 Nyaung Ta Bin Ayrwdy Plant & natural regen
637 637 ~ ~ Good initial work, but Nargis major disruption
14 Byant Gyi Gon Ayrwdy Plant & protect 513 513 ~ Good initial work, Nargis disrupted, but still working
15 Te Bin Seik Ayrwdy Plant & protect 330 330 ~ ~ FD not permitting harvest. / Illicit cutting increasing
16 War Gon Ayrwdy Plant & natural regen
40 100 140 ~ ~ Good work. Earning from firewood and seeds
The extent of different management regimes is illustrated in Figure 5.1 and Table 5.1. In the Dry Zone
forests tend to be both community controlled and owned. In the Delta and Hill areas the more popular
CF arrangement is community owned but individually controlled subplots (e.g. for agro-forestry or
600
33 33 56 56 300
40
300
150
600
300
1100
100 219 230
637 513
330 100
Siz
e (a
cre)
individual ownership / collective management
Individual
collective -production
collective -protection

37
woodlot plantation). In hill areas larger CFs may be split into a mix of some collectively controlled and
some individual plots, Wuyan being a good example – there are three different management regimes
across this large Community Forest.
5.2.3 Species selection
In the majority of CFs, it has been the FD staff who had largely controlled the planning and species
selection process. Under UNDP programme species were selected and promoted by FD to ensure
regeneration. In the Dry Zone for instance fast growing exotics such as Eucalyptus were trialled and only
the most resilient were chosen for large scale plantation. In recent years there has been recognition that
monocultures are not so suited to either village needs or ecological imperatives and so there has been an
encouragement of more mixed planting to include local and locally valued species, and also teak for sale
(e.g. CFs in Kachin State).
Teak is the species selected by the FUG, even though it is not allowed under CFI 1995. There has
been some legal change (The 1992 Forest Law stipulates that any person or any organization has the
right to cultivate and maintain forest plantations with the permission from the Government (Section
14). But a standing teak tree wherever situated in the State is owned by the State (Section 8). So, if
someone wants to plant teak he must get the permission of the Cabinet. And CFI 1995 allows only
farm level production to meet the basic needs of the community. Forests established aiming at
developing the locality and large scale forest operations to supply wood-based industries do not
qualify as CFs according to the 1995 CFI.)
Ensuring the right species mix for the community is essential, both to serve their needs and
also to motivate them to protect and manage the forest. In the future there is a need to
ensure the species composition of Community Forests reflects the priories of the villagers,
particularly taking account of marginalised groups and women. It may be that the species
mix can be adapted over time.
Teak is clearly a priority species for villagers – the FD staff should clarify the legal situation
and encourage them to plant and harvest following the Government’s standing orders.
5.3 Forest management activities
From our study we found that 9 FUGs had implemented their management plans effectively, and the
remaining 7 were doing moderately well, despite some challenges.
The local FD offices had provided the necessary seedlings or saplings and technical support as required
by the CFI 1995. However, according to the villagers, FD follow-up support, supervision, monitoring and
evaluation urgently need strengthening.
5.3.1 Is forest protection effective?
The major threats to community forest management are:
o forest conversion for agriculture
o grazing, particularly in the early years as saplings are not yet established
o over- extraction and or illicit cutting for timber and/or firewood as the trees mature
Watching / patrolling are the common protection methods to guard against these and challenge
contraventions. However, no-one really wants to get into conflict over the forests, especially if they are
not sure whether they will receive help from either the FD or other Government line agencies if the
situation escalates.
From our study we found that in almost all of the FUGs there remain problems with effective protection.
Most groups struggle to exclude outsiders from cutting, especially as they don‟t want to get into

38
intractable conflicts with neighbouring villages. It seems that rule-breaking increases where enforcement
becomes lax, and so becomes a less credible deterrent. The more frequent pattern is that FUGs are
reluctant to challenge as they are frightened to get into conflicts; they request FD‟s back up. Controlling
fire from spreading from adjacent agricultural land is a very tricky protection issue.
In general, however, we find protection is good in 2 CFs; moderately effective in 14. So, overall
protection seems to be working, more or less satisfactorily.
5.4 Conclusions
Although CFI 1995 articulates collective management, production and utilization, FUGs have been
practicing other management regimes as well. Collective management and protection of CF split into
individually owned plots seem to prove more effective and efficient than operating every step of the CF
collectively since sense of ownership is a driving force for progress.
In spite of many threats, FUGs had protected their CFs to the best of their abilities, and as a result most
forests have improved so much so that non-members who previously were not interested have applied
for membership or tried to create another CF. Examples are Kone Shine and Taung Kya-1 CFs in Shan
State. They have the problems of land tenure and illicit logging, but still they are appealing to non-
members, because the forests are thriving and agricultural crops are generating good incomes.
Many CFs are threatened by outsiders clearing land for agriculture and cutting trees for firewood. To
prevent such unlawful acts, FUGs desperately need FD‟s support. Given FD‟s back-up, FUGs will trust
FD better and be encouraged to scale up the CF.
There are a sizeable number of issues relating to forest management planning and practice which CFs
have to address in practice. Foresters, NGOs and researchers need to listen to FUGs, assess their
problems and seek solutions.

39
Chapter 6: COMMUNITY FOREST CONDITION
6.1 Introduction
We present primary data from detailed field survey on the actual condition of the community forests, the
outcome of management, applying a range of forestry assessment methods. As this report is aimed at
both a specialist and a general audience, we have tried to make these methods as transparent and explicit
for the general audience as possible, and have sought to reduce technical jargon to a minimum.
To summarise – the main issues to understand the forest condition include:
a) the stand (no. of trees by species and by size classes) and the stock (volume of trees by species
and by size classes) of the CF
b) the annual growth and the mortality of the trees, and
c) the forest health – measured by a range of indicators
The above forestry assessment methods have been developed for commercial scale plantation-based
timber production. However, for community forestry the local people are typically interested in multiple
uses of forests, so assessment requires adaptation for smaller scale and often natural multi-aged forests,
managed for mixed livelihood objectives. Specifically for multi-purpose forests we would also like to
assess the non- timber forest products (i.e. shrubs, herbs, bush meat, etc.) and other ecosystem services,
although development of detailed methods for this has been beyond the scope of this study.
6.2 The Stand and the Stock of Community Forest
We conducted a complete count and measurement of the trees on sample plots laid at random in each of
the selected community forests, and categorised them according to their size class. From these we
derived „stand tables‟ showing the mean frequency of different size classes of trees per acre of forest.
Based on the stand tables, we developed stand basal area tables and the stock tables for all the CFs. Fig.
6.1 shows an example of stand table for Wuyan CF, Kachin State. It shows that the stand structure of the
plantation is satisfactory, but that of the natural forest needs improvement in the smaller diameter classes,
as they are currently low.

40
Figure 6.1: Stand tables of plantation and natural forest, Wuyan CF
Note: P = plantation forest; N= Natural forest
Figure 6.2 shows the timber stock table which we have derived from the stand table above.
Figure 6.2: Stock table for Wuyan CF: Timber volume of all species (m3/ acre) by size class
6.2.1 Mean tree
The „mean tree‟ indicates the average size (or age) of trees in a forest. It will assist in making a
comparative assessment of various stand parameters of different community forests. The mean tree was
calculated from quadratic mean diameter, and the mean trees of CFs are presented in Table 6.1 and
summarized in Figure 6.3 below.
Figure 6.3: Mean diameter of CF plantation against its age
.01 - 19 20-39 40-59 60-79 80- 99 100-119
120-139
140-159
160-179
180+
P (n/ac) 2 102 169 148 98 60 19 15 8 2
N (n/ac) 27 84 79 54 33 27 21 17 5 41
0
25
50
75
100
125
150
175
nu
mb
er o
f tr
ees
/acr
e
dbh, mm
P (n/ac)
N (n/ac)
.01 - 19 20-39 40-59 60-79 80- 99 100-119
120-139
140-159
160-179
180+
v,m3/ac 0.00119 0.52669 2.41846 4.15497 4.5467 4.19079 1.81653 1.88102 1.38061 0.47772
0
1
2
3
4
5
Tim
ber
Vo
lum
e (m
3/ac
)
DBH (mm)
7.7
9.5
3.4 3.0
4.9
2.2
5.6
6.9
5.2
8.1
0.0 1.0 2.0 3.0 4.0 5.0 6.0 7.0 8.0 9.0
10.0
Axis Title
d, cm
CF and its age, yrs

41
The figure tells us that Gweyutyan CF plantation is
the best having achieved a mean diameter of 9.5 cm
in 3 years followed by Wuyan (7.7 cm in 4.3 years
and Nyaung Ta Bin (5.6 cm in 6 years). Let Pan De
CF plantation is the poorest with an average
diameter of 2.2 cm in 7 years. The forest was
established with JICA support. The case witnessed
the unsustainability of the donor funded CFs that
were established without community interest and
commitment.
Table 6.1: Summary of forest data
CF Type of forest Age (yrs)
No. of trees per ha (all species)
Basal area per ha, m2
Volume per ha, m3
Mean tree
Mean Annual Increment /ha
Main species * see appendix IV
for codes dbh, cm
basal area, m2
volume, m3
1. Wuyan
Plantation 4 1,539 7.24 52.87 7.7 1.67 12.21 1,2,35,81,84,98,195,270,304,339
Natural forest - 909 7.10 51.81 10.0 na na 24, 90, 98, 145, 148, 166, 173, 195, 213, 339, 437, 450, 478
2. . Gweyutyan Plantation 3 902 6.41 46.81 9.5 2.14 15.60 1,2,41,90,98,195
Natural forest - 494 4.28 31.23 10.5 na na 48,57,90,98,103,142,175,213,270,339,349
3. Sin Gaung Lay
Plantation (Yemane)
6 684 0.62 4.51 3.4 0.10 0.75 41, 157, 195, 383, 478
Natural forest - 2,293 4.65 33.91 5.1 na na 20,28,50,63,157,266,361,405
4. Pa De Thar Myothit
Plantation (Yemane)
8 4,371 3.09 22.56 3.0 0.39 2.82 195,414
Natural forest - 1,339 4.33 31.57 6.4 na na 36,361,405
5. Myay Thin Twin Plantation 7 279 0.52 3.77 4.9 0.07 0.54 4,98
Natural forest - 1,137 0.99 7.22 3.3 na na 157,236,441,478
6. Let Pan De Plantation 7 94 0.04 0.27 2.2 0.01 0.04 4,478
Natural forest
504 3.19 23.30 9.0 na na 4,47,138,193,476
7. Mine In Natural forest - 702 2.46 17.94 6.7 na na 157,242,319,362
8. Pway Hla Natural forest - 143 3.43 25.03 17.5 na na 325
9. Lwai Nyeint Natural forest - 1,102 6.07 44.33 8.4 na na 58,118,141,232,236,269,285,319,378,393
10. Nar Daung Hla Natural forest - 546 5.17 37.74 11.0 na na 118, 195, 236, 319, 437
11. Kon Shine Natural forest - 726 8.18 59.73 12.0 na na 86, 204, 257, 405, 434
12 Taung Kya-1 Natural forest - 262 6.53 47.64 17.8 na na 83,120,148,265
13. Nyaung Ta Bin Plantation 6 3,707 9.13 66.63 5.6 1.52 11.11 47,408,411
Natural forest - 2,399 0.97 7.06 2.3 na na 64,122,169,206,369,472,473,478
14. Byant Gyi Gon Plantation 12 4,371 16.34 119.28 6.9 1.36 9.94 122,291,473
Natural forest - 2,046 4.51 32.90 5.3 na na 47,64,153,169,291,473
15. Te Bin Seik Plantation 9 3,865 8.19 59.75 5.2 0.91 6.64 47
16. War Gon Plantation 9 3,660 19.04 138.96 8.1 2.12 15.44 47,65,408
Natural forest - 2,281 10.67 77.87 7.7 na na 47,65,122,411,478
Plate 6.1: A CF established in natural forest in Shan State

42
6.2.2 Comparison of ‘growing stocks’
A comparison of the growing stocks of the CFs is shown in Fig. 6.4. It shows that of the total 16 CFs in
the study, nine CFs have both natural and planted forests, all the six CFs in Shan State contain natural
forests only, and also Te Bin Seik CF in Ayeyawady region does not have natural forest.
Figure 6.4: Growing stocks of natural and planted forests by CF (Volume/ha, m3)
The CF plantations have growing stocks ranging from 0.3 m3/ha (Let Pan De) to 139 m3/ha (War Gon).
Let Pan De has the lowest while War Gon has the highest stand density.
Let Pan De CF is seven years old, but the original Yinma plantation had disappeared, and Sha and eucalypt
plantation have suffered 28% mortality. However, because the FUG has protected the CF, natural
regeneration has occurred. However, it is still very young with a mean diameter of about 2.3 cm only.
The CFs in Kachin State and Ayeyawady Region are very promising. The natural forests in these CFs are
also in good condition, although the existing stocks are still much below the average norms. However,
since they are still very young, their stocking can increase rapidly with increasing age and the appropriate
treatments. The reasons for their success so far include the interest and active participation of the local
people and, not less, the various support provided by local organisations and international donors.
CFs in the Dry Zone, particularly Myay Thin Twin CF and Let Pan De CF have shown a poor
performance, in terms of growing stocks. They will require financial and technical supports in order to
improve their performance. Regular visits, technical assistance and monitoring the CF process by the
responsible forest staff could help to encourage the users.
6.3 Growth of CF Plantations
As the age of each CF plantation was available, mean annual increments were estimated for all CF
plantations. They are shown below by CF (Fig.6.5). Note that all the six CFs visited in the Shan State do
not have plantations; they are natural forests. Obviously, prediction of growth of natural forest is
impossible with one short inventory since its age is unknown.
Wuyan
Gweyutyan
Sin gaung
Lay
Pa De Thar
Myothit
Myay Thin Twin
Let Pan De
Mine In
Pway Hla
Lwai Nyeint
Nar Daung Kya
Kon Shine
Taung Kya-1
Nyaung Ta Bin
Byant Gyi Gon
Te Bin Seik
War Gon
Plantation 52.9 46.8 4.5 22.6 3.8 0.3 0.0 0.0 0.0 0.0 0.0 0.0 66.6 119.3 59.7 139.0
Natural forest 51.8 31.2 33.9 31.6 7.2 23.3 17.9 25.0 44.3 37.7 59.7 47.6 7.1 32.9 0.0 77.9
0.0
20.0
40.0
60.0
80.0
100.0
120.0
140.0
volu
me/
ha,
m3

43
Figure 6.5: Mean Annual Increment of CF plantations (v/ha/yr in m3)
For the sample CF plantations, their ages range from 3 to 12 years. Number of trees of all species per
acre varies between 38 (94 trees/ha) in Let Pan De and 1,769 (4,371 trees/ha) in Byant Gyi Gon,
depending on the age, spacing and species.
The mean trees of CF plantations ranged from about 2.2 cm in dbh in Let Pan De to 8.2 cm in War Gon
CF.
Mean Annual Increment was highest in Gweyutyan CF with 15.6 m3/ha at the age of 3 years, second
highest in War Gon CF with 15.44 m3/ha at the age of 9 years, and lowest in Let Pan De CF with 0.04
m3/ha at the age of 7 years.
Excepting Gweyutyan and War Gon CFs, the MAIs are not considered satisfactory, compared to what
would normally be expected (e.g. over 15m3/ha/year). The slow increment might be due to insufficient
initial stock, poor site, planted species not matching the planting site and lack of proper silvicultural
treatments.
6.3.1 Survival rates
Survival rates of trees have a significant effect on forest ecosystem. Information on the dead and missing
trees was available for all CF plantations. Mortality/survival rates were calculated for all of them. They are
shown in Table 6.1 below.
Wuyan Gweyutya
n Sin gaung
Lay
Pa De Thar
Myothit
Myay Thin Twin
Let Pan De
Nyaung ta Bin
Byant Gyi Gon
Te Bin Seik
War Gon
MAI/ha, m3 12.21 15.60 0.75 2.82 0.54 0.04 11.11 9.94 6.64 15.44
0.00
4.00
8.00
12.00
16.00
Mea
n A
nn
ual
Incr
emen
ent
(m3/
ha/
yr)
Plate 6.2:: A successful plantation established in CF in
Kachin State
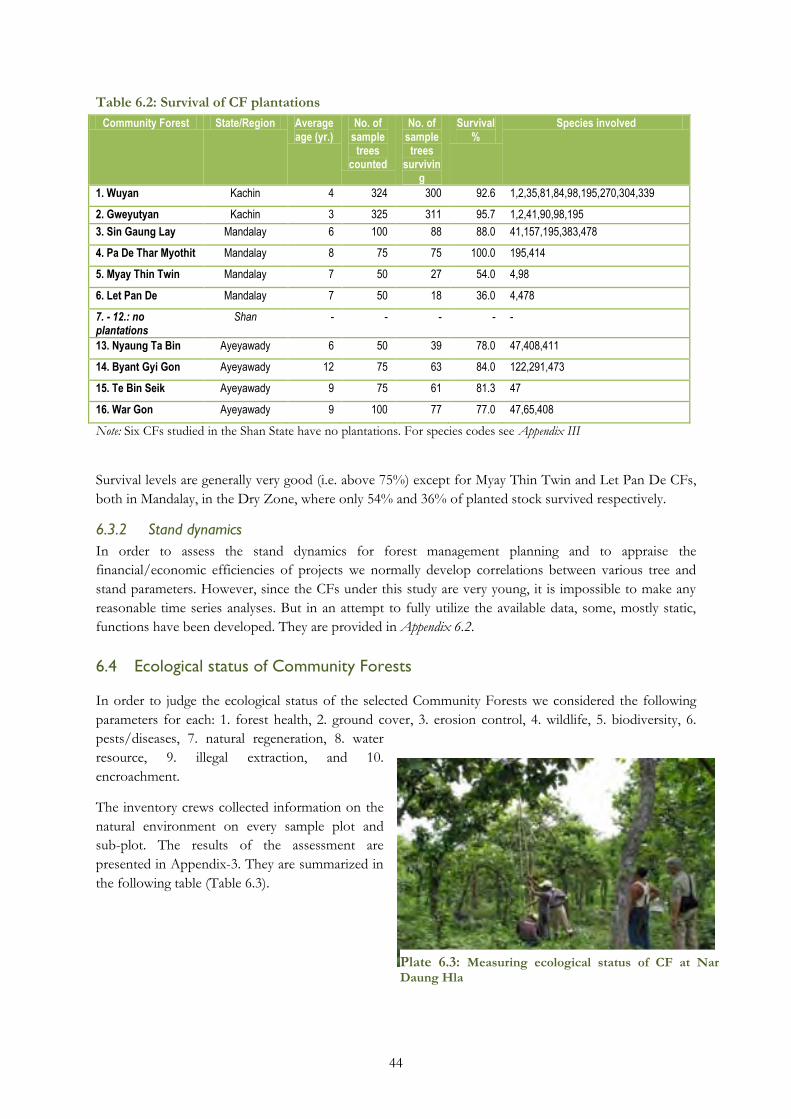
44
Table 6.2: Survival of CF plantations
Community Forest State/Region Average age (yr.)
No. of sample trees
counted
No. of sample trees
surviving
Survival %
Species involved
1. Wuyan Kachin 4 324 300 92.6 1,2,35,81,84,98,195,270,304,339
2. Gweyutyan Kachin 3 325 311 95.7 1,2,41,90,98,195
3. Sin Gaung Lay Mandalay 6 100 88 88.0 41,157,195,383,478
4. Pa De Thar Myothit Mandalay 8 75 75 100.0 195,414
5. Myay Thin Twin Mandalay 7 50 27 54.0 4,98
6. Let Pan De Mandalay 7 50 18 36.0 4,478
7. - 12.: no plantations
Shan - - - - -
13. Nyaung Ta Bin Ayeyawady 6 50 39 78.0 47,408,411
14. Byant Gyi Gon Ayeyawady 12 75 63 84.0 122,291,473
15. Te Bin Seik Ayeyawady 9 75 61 81.3 47
16. War Gon Ayeyawady 9 100 77 77.0 47,65,408
Note: Six CFs studied in the Shan State have no plantations. For species codes see Appendix III
Survival levels are generally very good (i.e. above 75%) except for Myay Thin Twin and Let Pan De CFs,
both in Mandalay, in the Dry Zone, where only 54% and 36% of planted stock survived respectively.
6.3.2 Stand dynamics
In order to assess the stand dynamics for forest management planning and to appraise the
financial/economic efficiencies of projects we normally develop correlations between various tree and
stand parameters. However, since the CFs under this study are very young, it is impossible to make any
reasonable time series analyses. But in an attempt to fully utilize the available data, some, mostly static,
functions have been developed. They are provided in Appendix 6.2.
6.4 Ecological status of Community Forests
In order to judge the ecological status of the selected Community Forests we considered the following
parameters for each: 1. forest health, 2. ground cover, 3. erosion control, 4. wildlife, 5. biodiversity, 6.
pests/diseases, 7. natural regeneration, 8. water
resource, 9. illegal extraction, and 10.
encroachment.
The inventory crews collected information on the
natural environment on every sample plot and
sub-plot. The results of the assessment are
presented in Appendix-3. They are summarized in
the following table (Table 6.3).
Plate 6.3: Measuring ecological status of CF at Nar Daung Hla

45
Table 6.3: Forest condition by various indicators
CF Forest health
Ground cover
Erosion control
Wildlife Biodiv-ersity
Pests/ Diseases
Nat. Regeneration
Water re-source
Illegal extract-ion
Encroachment
OVER-ALL
1. Wuyan F G G PR F PR F PR PR A G
2. Gweyutyan F G G PR P PR G PR A A G
3. Sin Gaung Lay G G G PR G A F PR A A G
4. Pa De Thar Myothit G F G PR G PR F A A A G
5. Myay Thin Twin F F F PR F A F A A A F
6. Let Pan De F P F PR F A F A A A P
7. Mine In P F G PR P PR G A PR PR P
8. Pway Hla P F G PR P PR F PR PR A F
9. Lwai Nyeint F G G PR P PR G PR PR PR F
10. Nar Daung Hla P P G PR P A F A PR A P
11. Kon Shine F G G PR P PR G PR PR PR F
12. Taung Kya-1 G G G PR F PR G PR PR A G
13. Nyaung Ta Bin G G G PR F A G PR PR A G
14. Byant Gyi Gon F F G PR F A G PR PR A G
15. Te Bin Seik F F G PR F A F PR PR A F
16. War Gon G G G PR F A G PR PR A G
Good (%) 31.25 50.00 87.50 - 12.50 - 50.00 - - - 50.00
Fair (%) 50.00 37.50 12.50 - 50.00 - 50.00 - - - 31.25
Poor (%) 18.75 12.50 0 - 37.50 - - - -- - 18.75
Present (%) - - - 100.00 - 50.00 - 68.75 68.75 18.75
Absent (%) - - - - - 50.00 - 31.25 31.25 81.25
Note: G=good; F=fair; P=poor; PR=present; A=absent
6.4.1 Forest health
Forest health was judged by crown, crown cover, vigour, absence/presence of disease or insect attack, soil erosion, natural regeneration, and categorised for each CF as good, fair or poor. Forest health was found to be satisfactory (i.e. fair or good) in 13 of our study sites (81%).
6.4.2 Ground cover and erosion control
CFs create good ground cover and hence no serious erosion has occurred in all 16 CFs. (Ground cover is assessed by the density of the vegetative growth on the forest floor).
6.4.3 Wildlife and biodiversity
Small wildlife especially has returned to all CFs whether natural or planted. Biodiversity is satisfactory in more than 72 % of the community forests. Mono-plantations are less diverse biologically than natural forests. (The biodiversity assessment was based on the number of different species of flora and fauna).
6.4.4 Pests and diseases
The occurrence of pests and diseases has been noticed in half of the CFs being studied.
6.4.5 Natural regeneration
Natural regeneration has taken place in all types of
forests of CF.

46
6.4.6 Water sources
About 69% of CFs have water sources. But it is impossible to infer that CFs are attributable to their appearance since previous data does not exist except for Wuyan CF in the Kachin State where water sources have reappeared three years ago. They had disappeared when the dense natural forests were depleted.
6.4.7 Illegal extraction
Illegal extraction of forest products has been taking place in about two thirds of the inspected CFs. Non-FUG members are usually responsible for such illegal activities. They cut firewood and poles, and collect mangrove seeds in the delta CFs illegally.
6.4.8 Encroachment
Encroachment for taungya (shifting cultivation) and agriculture is a concern for approximately 19% of FUGs.
6.4.9 Overall summary of forest ecosystem
The overall assessment of forest ecosystem of each and every CF was made subjectively based on the
conditions of its individual indicators classifying them in three categories as Good „G‟, Fair or Moderate
‟F‟ and Poor „P‟. See table 6.3. It shows that in 8 out of 16 CFs (50%) the overall state of forest
ecosystem is good, 5 CFs (31.25%) have moderately improving forests and 3 CFs (18.75%) are poor. The
three poor CFs namely Let Pan De in Nyaung U Township, Mine In and Nar Daung Hla both in Pindaya
Township had been established with donor supports. It seemed that FUGs concerned lost interest when
external support had stopped.
In general, CFs are protected well. Communities are thus significantly contributing to the national re-
greening objectives enshrined in the CF Instruction `
6.5 Harvesting and ecosystem services
Since CFs are still very young, timber has not been harvested as yet; only a very few of them have started
providing poles, firewood, seeds and some NTFPs. But because FUGs had not kept proper records,
information on production, expenditure and income, etc. from CFs is sketchy and mostly not good
enough for analysis. Extraction of poles and firewood will need regulation or advice of FD.
At the other end, all FUGs have been enjoying improved ecosystem services of their CFs in terms of
water supply, improvement of soil fertility, erosion control, improving habitats for wildlife, wild plants
and fisheries, and protection against adverse impacts of strong winds and waves.
Increased carbon sequestration and storage due to increased forest cover through CFs is an implicit
intangible value of the established community forests in the country.
6.6 Conclusions
During the last 15 years the community forests have increased the national effective forest cover by about
2,800 hectares annually (42,147 ha in 15 years). It means that the Forest Department and local people
together have been able to restore and effectively protect more than one hundred thousand acres (more
than forty two thousand hectares) of degraded forests during the period.
The community forests have also been providing goods and environmental services in the interests of the
local communities - including promotion of the forest‟s capacity of absorbing and storing atmospheric
Plate 6.4: Water sources reappeared at Wuyan CF in Kachin State

47
carbon. Some CFs represent success stories. Provided rightful awareness, interest and active participation
of the community, CFs are successful. Otherwise, community forestry fails.
It is vital that the responsible forest staff educate and mobilize the community and secure its trust in this
context in order to be able to speed up the progress of CF development. The current pace of progress is
far from adequate to meet the long term national target.


49
Chapter 7: ECONOMIC ANALYSIS OF COMMUNITY FORESTRY
7.1 Introduction
Although the data on forest ecology/ resource, social and environmental aspects presented above has
sufficed for respective appraisals, data gathered on the economic aspects of CF tended to be sketchy for
almost all the FUGs. The only exception was War Gon CF. Because War Gon CF has had a reasonable
time series of recorded expenditures and incomes it was suited to more detailed study. War Gon CF is a
mix of plantation and natural forest, and one-acre thame (Avicenia officinalis) plantation has been chosen
here to study the financial implications of the Community Forest as a test case.
7.2 Background
Wargon CF is located in compartment 56 of Pyindaye Reserved Forest, Phyarpon Township, Ayeyawady
Region (Division, formerly) (at North latitude 15˚80˝ and East longitude 95˚92˝). The CF was established
on the 16th of February, 2001, and consists of 65 acres of plantation and 75 acres of natural mangrove
forest. Before it became CF it had been encroached for agricultural land. FREDA initiated the CF,
assisting in formulating the Management Plan, and gave technical advice and agricultural inputs . FUG
members gradually became active and enthusiastic.
The planted species include byu (Bruguiera cylindrica),
kambala (Sonneratia apetala) and thame ( Avicenia
officinalis) . The thame plantation has enjoyed a 64%
survival rate. The rotational felling period of the
plantation was set at ten years. The natural mangrove
forest in the CF also contains the same mangrove
species. Other species, including nwai-net (Derris
trifoliata) and hnget-kyi-taung (Monolylla correa) which are
medicinal and edible, were found among the
undergrowth. Wildlife in the CF includes little egrets,
water fowl, jungle fowl, wild cats, birds and crocodiles.
The FUG has 45 members, who are now getting
incomes from the sale of firewood, seeds and
propagules (cuttings for tree propagation) which they collect in the CF. However, there is the problem of
encroachment for land from non-members.
7.3 Study approach
The forest survey team conducted an inventory in the CF and the social survey team conducted socio-
economic assessment in the CF village from 16 to 21 November, 2010. Costs and incomes of the CF
were recorded to assess its financial profitability. (See Chapter 3 for method details)
7.4 Stand and stock tables
Stand and stock tables of the plantation were developed based on the inventory (See figure 7.1).
Plate 7.1: 9-yr old thame plantation, War Gon CF, Ayeyawady Region

50
Figure 7.1: Stand structure of thame plantation (War Gon CF) – number /ha of different size classes of trees
The inventory tells us that the plantation has:
o 3,611 trees per hectare and a growing stock of 97 m3/ha,
o A mean tree diameter at breast-height of 7 cm and a mean tree height of 6.2 m,
o A mean annual increment of 10.8 m3/ha at the age of 9 years.
7.5 Financial analysis of incomes, expenditure and net cash-flows
The FUG members have been collecting and selling firewood and seeds from the plantation since 2007.
We here estimate overall income, expenditure and net cash flows.
7.5.1 Input table
The input table shows the costs incurred for the CF during the study period. The costs include cost of
plantation establishment and administrative cost.
Cost of plantation establishment was high in the initial year amounting to K29,650 including estimated
annual administrative cost of K1,000. Weeding was done in the following two years. No silvicultural
treatments had been undertaken until year 2010. If the plantation were clear-felled at the rotation age of
ten years, there will be cost of harvest and revenue from the final harvest of forest products. Now
because the plantation is being kept growing, no such costs and revenues have occurred as yet. However,
there should be intermediate costs which would have incurred in collecting firewood and mangrove seeds.
They have been ignored here probably because the activity had not involved hired labour and the cost
was negligible.
Table 7.1: Inputs: Costs of thame plantation (Kyats per acre)
Activities Years Total
2001 2002 2003 2004 2005 2006 2007 2008 2009 2010
Site preparation 3,000 0 0 0 0 0 0 0 0 0 3,000
Staking 1,800 0 0 0 0 0 0 0 0 0 1,800
Planting 1,800 0 0 0 0 0 0 0 0 0 1,800
Weeding- 2 times 3,600 2,970 1,570 0 0 0 0 0 0 0 8,140
Patching 300 0 0 0 0 0 0 0 0 0 300
Nursery 18,150 0 0 0 0 0 0 0 0 0 18,150
Administrative 1,000 1,000 1,000 1,000 1,000 1,000 1,000 1,000 1,000 1,000 10,000
Total costs 29,650 3,970 2,570 1,000 1,000 1,000 1,000 1,000 1,000 1,000 43,190
Source: The cost data for plantation establishment were collected by Dr. Maung Maung Than, Consultant at Pyoe Pin Programme.
380
1,331 1,140
380 380
0
200
400
600
800
1,000
1,200
1,400
20-39 40-59 60-79 80-99 100-119
Nu
mb
er /
ha
Size class of trees dbh mm

51
7.5.2 Output table
Thame plantation has been producing firewood since 2007 and seeds since 2009. The following table
shows the outputs of the plantation by types of products and years.
Table 7.2: Outputs- Forest products collected from thame plantation
Products Measurement unit Years
2001 2002 2003 2004 2005 2006 2007 2008 2009 2010
Thame seeds Basket 0 0 0 0 0 0 0 0 1.0 3.9
Firewood Ton 0 0 0 0 0 0 2.1 2.4 9.826 9.270
7.5.3 Unit value table
Unit values of the forest products are presented in the following table. They were market values at site.
Table 7.3: Unit values of forest products
Products unit Years
2001 2002 2003 2004 2005 2006 2007 2008 2009 2010
Thame seeds Kyat/basket - - - - - - - - 1500 1500
Firewood Kyat/ton - - - - - - 8300 8300 8700 8700
7.5.4 Cash flow of incomes or benefits
From the output table and the unit value table (tables 7.2 and 7.3) benefits are calculated and presented in
the following table.
Table 7.4: Cash flow of benefits
Years 2001 2002 2003 2004 2005 2006 2007 2008 2009 2010 Total
Benefits (K) 0 0 0 0 0 0 17,430 19,920 86,990 86,500 210,840
This shows that after the forest becomes productive it yields almost 87,000 kyat / acre per year.
7.5.5 Net cash flow
The net cash flow is constructed by subtracting the costs from their corresponding benefits. It is shown
in the following table:
Table 7.5: Cash flows of one-acre thame plantation
Years 2001 2002 2003 2004 2005 2006 2007 2008 2009 2010 TOTAL TO DATE
Benefits (K)
0 0 0 0 0 0 17,430 19,920 86,990 86,500 210,840
Costs (K) 29,650 3,970 2,570 1,000 1,000 1,000 1,000 1,000 1,000 1,000 43,190
Net cash flow (K)
-29,650 -3,970 -2,570 -1,000 -1,000 -1,000 16,430 18,920 85,990 85,500 167,650
Figure 7.2: Costs, benefits and net cash flow of the 1 acre plantation (kyat / year)
-50000
0
50000
100000
1 2 3 4 5 6 7 8 9 10
Kya
ts p
er y
ear
Year
Benefits (K) Costs (K) Net cash flow (K)

52
As has been mentioned earlier, costs include costs of plantation establishment and administration, while
incomes (or benefits) were received mainly from the sale of firewood and to a lesser extent from
mangrove seeds. The net cash flow has shown-
a Financial Rate of Return (IRR/FRR) of 24.28% , and
a Cost-Benefit Ratio (BCR) of 2.47 at 10% discount rate. 10% is the current bank interest rate set by
the Government of Myanmar.
7.6 Conclusions
Given the available data on the costs and benefits, the thame plantation is highly financially profitable.
The monetary benefits could even increase with increasing age of the plantation. Furthermore, since the
plantation has not been clear-felled, the capital is growing.
On the other hand, there are also the opportunity costs that might have occurred because of establishing
the plantation and at the same time there are the intangible values of the forest as well, which should be
taken into consideration in deciding land use change or efficiency of a development project. They have
not been covered by the current exercise. The intangible values could be exposed only through economic
analysis in terms of Economic Rate of Return (ERR).
NPWs negative and positivebetween difference absolute
NPW positive
discount) of ratesboth between e(differenc discount) of rate(lower FRR
1001
n
E
RIRR

53
Chapter 8: LIVELIHOODS AND EQUITY ISSUES IN COMMUNITY FORESTRY
8.1 Introduction to livelihood issues
Community Forestry affects local people‟s livelihoods in complex ways. Household‟s livelihood strategies
in forested landscapes are themselves complex.
o
o
o
o
o
The role of forests in these activities varies according to the household, their assets and skills. Forests
provide a wide range of products and services to the different users, and the benefit (and cost) is
themselves fluctuating for environmental and social reasons. Benefits include a range of different
products and services.
Products include:
timber, poles etc
fuelwood,
fodder
bush meat
wild foods (fruits,
vegetables & tubers,
honey etc.)
crops from agro-
forestry systems
medicinal and aromatic
plants
a wide range of other
„niche‟ NTFPs
Ecosystem services include:
water – e.g. recovering springs
soil protection and nutrient cycling
pollination
habitat (e.g. for fish spawning in delta)
storm protection in the delta reducing
damage and potentially saving lives
The introduction of CF affects livelihoods in subtle as well as obvious ways. Impacts can be differential,
particular between members and non-members, but also within FUGs by wealth ranking, occupation,
gender, location in village (remote and more central) and so on. Impacts even vary within households – if
grazing land is converted to forests then those who tend the animals will have to spend more time and

54
travel further. The management plan for instance is an outcome of negotiations between the FUG
addressing different priorities, in which the more powerful are likely to prevail.
Community Forestry impacts must be understood according to their sequence in time and in relation to
the pre-CF situation and trends (where open access use may even lead to higher incomes, but on an
unsustainable level),
the „during regeneration‟ stage may involve tight restrictions on use for regeneration to take place;
this will affect those who are more forest-dependent the hardest.
finally a post or regenerated stage, where the forest is more productive, but is used only within
sustainable levels. Sustaining improvements in the long term, of course, demands that communities
overcome all sorts of challenges.
Finally, many aspects of forest use are informal, some even illegal. Shift in extraction of forest products,
for instance, from the new Community Forest typically occurs as restrictions are applied, but
understanding whether the pressure just shifts to other adjacent forests is difficult unless these are studied
in as much detail. These are very difficult to capture in brief research visits.
Beyond tangible changes in forest product and services flows, more intangible changes in social cohesion
are difficult to quantify and understanding them depends on lengthy anthropological investigation.
In this brief study we are only able to sketch the outlines of how livelihoods are affected, mainly for FUG
members, and to make tentative conclusions regarding the effects of community forestry.
In order to thoroughly understand livelihood change due to community forestry, we would need a more
in-depth study. A baseline dataset to measure change from the initial situation and consideration of some
control villages to compare with the FUG study groups, to see how much their livelihoods have changed
over the period without community forestry. Further, at the study FUGs we would ideally be able to
contrast the livelihood changes of FUG members with non-members, both in the village and in
neighbouring areas. Unfortunately, this is beyond the scope of the current study.
Below, we discuss the context, the range of possible changes due to community forests and then discuss
our findings for the study villages.
8.2 The rural livelihood context
According to the UNDP / Ministry of National Planning & Economic Development Household Living
Conditions Survey (2007: 3) 10% of the population falls below the „Food Poverty Line‟ or FPL (i.e.
enough income to pay for adequate nutrition), with incidence as high as 40% below in Chin State and
only slightly less in Shan North and East, and Kachin, Ayeyawady and Mandalay are closer to the average
level of below FPL incidence.
Rural livelihoods and food security are heavily dependent on agricultural production which may be
sedentary in lowland areas but often involves long fallows in hill areas for nutrient cycling. Agriculture
may be complemented by pastoralism, forest product collection and also artisanal production, trading,
labouring and so on. The UNDP survey indicates that average landholding is 6.1 acres, and that
landholdings correlate with poverty. Landholdings are lower in hill areas, and one quarter of agricultural
families are landless (UNDP 2007: 8).
There are underlying changes already going on in rural livelihoods in Myanmar. Farmers report
increasing vulnerability due to depressed rice prices, and increasingly erratic rains leading to stagnant and

55
even declining productivity. Livestock fodder management is a significant issue: as livestock populations
increase but pasture land is disappearing.
8.2.1 Livelihoods and wealth rank profile of villages
In our study we conducted wealth-ranking exercises for each village, categorising households into rich/
well-off; medium; and poor according to land holding. (Of course income levels are not consistent
between villages, and a „poor‟ household in one village may be significantly better off than one in
another.)
The figure below (Fig. 8.1) illustrates that, for three of the study FUGs, (19% of the sample) )
membership includes the whole village (groups 1; 5; 6), whereas for most of the study FUGs (10 groups
or 62%), the FUG membership is a significant part of the village. In the three remaining cases only a
small fraction of the whole village are members, (19% of the sample: groups 3, 11, 15) excluding the
majority of village households. There seems to be no significant pattern of exclusion of poor from
membership.
Figure 8.1: Wealth rank of FUG and non-FUG member households: number by FUG sites.
8.2.2 Benefits & costs/ use
Although Community Forestry can lead to a range of livelihood benefits, this depends on improvements
to the forest condition, and also on households being able to access the forest. There may also be a range
of costs involved particularly at the outset when access to the forest may be restricted, and when efforts
and investment are required.
The table below (Table 8.1) illustrates the range of possible costs and benefits to different households
FUG
Non-
FUG
FUG
Non-
FUG
FUG
Non-
FUG
FUG
Non-
FUG
FUG
Non-
FUG
FUG
Non-
FUG
FUG
Non-
FUG
FUG
Non-
FUG
FUG
Non-
FUG
FUG
Non-
FUG
FUG
Non-
FUG
FUG
Non-
FUG
FUG
Non-
FUG
FUG
Non-
FUG
FUG
Non-
FUG
FUG
Non-
FUG
1. Wu Yan 2. Gwe Yut Yan 3. Shwe Myin
Tha 4. Pa De Tha
Myothit 5. Myay Thin
Twin 6. Let Pan De 7. Mine In 8. Pwe Hla 9. Lwai Nyeint 10. Nadaung Hla 11. Kone Shine 12. Taung Kya
13. Nyaung Ta Bin
14. Byant Gyi Gon
15. Te Bin Seik 16. War Gon
Poor 71 0 6 6 0 23 0 0 140 0 69 0 9 47 0 0 25 25 21 36 0 21 0 183 27 83 17 17 12 536 14 41
Medium 60 0 36 36 5 51 12 0 89 0 75 0 37 165 0 0 75 75 27 29 0 21 2 163 22 15 17 17 6 217 29 38
Rich 132 0 28 28 0 1 0 0 51 0 55 0 48 96 0 0 57 57 25 27 8 15 10 20 6 12 1 1 0 25 2 1
0
100
200
300
400
500
600
700
800
Rich Medium Poor

56
Table 8.1: Possible costs and benefits to households from Community Forestry
Factor Possible costs (-) Possible benefits (+)
Land use - Loss of previous land use forestry (especially grazing, fallows and cultivation)
- Obstructed access routes through forests
+ More sustainably productive use of land than open access
+ Legitimate access to forest, either collective or individual plots
Time use - Additional time required for deliberation and management
- Further travel for forest products due to access restrictions
+ Time saved in collecting forest products more easily + Time used in value addition of forest products
increases productivity
Forest product flows
- Restrictions of forest product extraction + Products for own use and sale + Products for community development (e.g. timber
for school building) + Job opportunities from enterprise development
Cash - Investment expenses for plantation etc. - Loss of revenues where forest product sale
becomes restricted
+ Incomes from product sale
Ecosystem services
- Loss of water sources due to high water demand from fast growing exotics (esp. dry zone)
+ Range of local ecosystem services, e.g. water supply improvement, soil conservation and nutrient cycling
+ Extreme weather event protection
Social ‘capital’ / cohesion
- Exclusion from FUG - Social conflict between FUG members and non
members, including neighbours and outsiders
+ Improved social cohesion + Development of community development planning
and management skills + Conflict resolution skills
8.3 Are there livelihood benefits from CF?
At the study sites we found a wide range of benefits being enjoyed, as well as the anticipation of future
ones. Across the study sites the general pattern is that community forest protection and regeneration is
leading to a range of available livelihood benefits. The table below illustrates the complex range.
However, most FUGs are too young for the forests to achieve the maximum sustainable productivity yet.
We see a general pattern of increase in forest benefits to members in 13 of the 16 sites (81.25%).
Plate 8.1: Social survey being carried out in the
Shan State
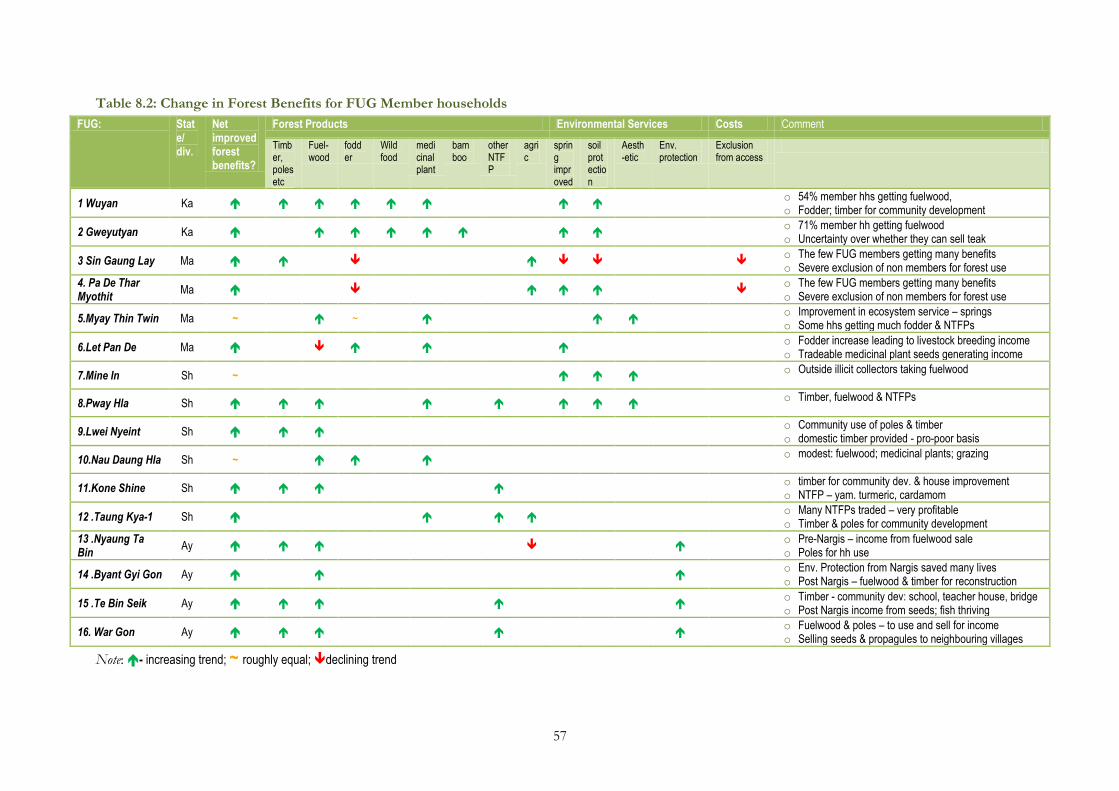
57
Table 8.2: Change in Forest Benefits for FUG Member households
FUG: State/ div.
Net improved forest benefits?
Forest Products Environmental Services Costs Comment
Timber, poles etc
Fuel-wood
fodder
Wild food
medicinal plant
bamboo
other NTFP
agric
spring improved
soil protection
Aesth-etic
Env. protection
Exclusion from access
1 Wuyan Ka
o 54% member hhs getting fuelwood, o Fodder; timber for community development
2 Gweyutyan Ka
o 71% member hh getting fuelwood o Uncertainty over whether they can sell teak
3 Sin Gaung Lay Ma
o The few FUG members getting many benefits o Severe exclusion of non members for forest use
4. Pa De Thar Myothit
Ma
o The few FUG members getting many benefits o Severe exclusion of non members for forest use
5.Myay Thin Twin Ma ~
~
o Improvement in ecosystem service – springs o Some hhs getting much fodder & NTFPs
6.Let Pan De Ma
o Fodder increase leading to livestock breeding income o Tradeable medicinal plant seeds generating income
7.Mine In Sh ~
o Outside illicit collectors taking fuelwood
8.Pway Hla Sh
o Timber, fuelwood & NTFPs
9.Lwei Nyeint Sh
o Community use of poles & timber o domestic timber provided - pro-poor basis
10.Nau Daung Hla Sh ~
o modest: fuelwood; medicinal plants; grazing
11.Kone Shine Sh
o timber for community dev. & house improvement o NTFP – yam. turmeric, cardamom
12 .Taung Kya-1 Sh
o Many NTFPs traded – very profitable o Timber & poles for community development
13 .Nyaung Ta Bin
Ay
o Pre-Nargis – income from fuelwood sale o Poles for hh use
14 .Byant Gyi Gon Ay
o Env. Protection from Nargis saved many lives o Post Nargis – fuelwood & timber for reconstruction
15 .Te Bin Seik Ay
o Timber - community dev: school, teacher house, bridge o Post Nargis income from seeds; fish thriving
16. War Gon Ay
o Fuelwood & poles – to use and sell for income o Selling seeds & propagules to neighbouring villages
Note: - increasing trend; ~ roughly equal; declining trend

58
Although we lack precise quantified data, this includes the following products:
o An apparent increase in sustainable timber and poles offtake in 50% of sites.
o An apparent increase in sustainable fuelwood offtake in 11 sites (69%), though a reduction in one
site.
o An apparently balanced picture in terms of fodder, with 2 sites increasing, two reducing availability,
and one stable.
o Increasing wild food harvesting in two sites.
o Increasing medicinal plant harvesting in 7 (44%).
o Increasing bamboo harvesting in one site.
o Increasing harvesting of „other‟ NTFPs in five sites (31%) – these vary by forest type, and include
yam, turmeric, cardamom, seeds and propagules.
o In three sites agro-forestry cultivation has increased for commercial crops.
Environmental services are also improving:
o Six study FUGs (37.5%) reported improving
water supplies, a particularly important issue in
dry zone areas. However, one site experienced
declining supplies.
o Seven study sites (44%) experienced improved
soil protection benefits, including reduced soil
erosion and improved soil condition and nutrient
cycling.
o All the delta FUGs experienced improved
Environmental Protection from storms, and of
course in the context of Nargis the community
forests saved many lives in these villages.
o Finally three groups expressed the aesthetic
benefits from improved forest condition.
The environmental protection function of community forestry has been most evident at Byant Gyi Gon
FUG. The village leader personally initiated formation of CFUG after hearing a radio report about the
CF initiative in 1995.Thirteen years later, when Cyclone Nargis hit the Delta region in 2008 the mature
community forest took the brunt of the impact, and all the villagers survived, whereas in neighbouring
villages without CF over 30% of people were killed.
8.4 Wider social benefits
Although more difficult to measure there are a range of social benefits which seem to be emerging from
Community Forestry. Perhaps the major one is security of access / tenure to the forest resource – local
people can again regulate use to ensure resource use within sustainable levels.
There is also the prospect that managing the forest collectively allows experience of deliberative social
processes. As Myanmar is undergoing constitutional reform this may be a particularly critically valuable
„training for democracy‟ process, as it has been in Nepal. Several of the study villages reported improved
social cohesion and confidence, skill development including leadership skills and conflict management
skills, and the effective organisation of social development initiatives.
On the other hand, there are exceptions to this where users are excluded, where conflicts are not being
effectively managed, and where a lack of post formation support is leading to stagnation.
Plate 8.1: Plate 8.2: CF at Byant Gyi Gon that protected the village from Cyclone Nargis

59
8.5 Is the benefit distribution (and costs) equitable?
Equity is synonymous with fairness or justice, and two aspects are commonly identified: equity in
procedures and equity in outcomes. In relation to Community Forestry there are three evident
dimensions:
Intra household equity: male and female especially – do women‟s priorities like reducing fuelwood
collection times get reflected in management?
Within the Forest Users‟ Group: i.e. are all members able to participate?; are costs and benefits shared
fairly?; is there a fair relationship between the Management Committee and the general body?, etc.).
Within the village and across different occupational groups: i.e. has the formation process been fair in
giving all an equal opportunity to join?; are particular occupational groups (e.g. pastoralists, fishers
etc) or non-members unfairly excluded from benefits? and so on).
Inter-village: are neighbouring villages treated unfairly, or do neighbours treat the FUG unfairly or
disrespectfully?
In our brief study we have not been able to assess each of these aspects in detail. We have, however,
been able to gather from PRA discussions and household interviews an overall sense of the FUG
members‟ perceptions of fairness and satisfaction, as shown in table 8.3.
Table 8.3: Equity in Forest Users’ Groups: an initial assessment
FUG State / Region
Equity assessment
Remarks
1 Wuyan Ka Good: All village satisfied
2 Gweyutyan Ka Good within FUG
3 Sin Gaung Lay Ma Mis-formed small group benefiting at cost of large village
4.Pa De Thar Myo Thit Ma ~ Good within FUG but dissatisfaction with non-members
5.Myay Thin Twin Ma Inclusive group
6.Let Pan De Ma ~ Fairly good
7.Mine In Sh ~ Rich donated land, but now neighbours taking benefits
8.Pway Hla Sh ~ Fuelwood shared equally but overall unclear
9.Lwai Nyeint Sh Equitable & pro poor
10.Nar Daung Hla Sh ~ Moderately fair
11.Kone Shine Sh ~ Earlier fair, now MC taking more
12 .Taung Kya-1 Sh Small FUG taking benefit, wider village loosing
13 .Nyaung Ta Bin Ay ~ Households lost paddy lands before CF – product distribution fair
14 .Byant Gyi Gon Ay ~ Not all benefits equally shared across village – poorest can’t participate
15 .Te Bin Seik Ay Very fair: Poorest households are non-members: they are also getting
substantial benefit from seed & propagule sale
16. War Gon Ay Very fair- -non members get needs too
o 6 of the 16 study sites (37.5%) indicate equity in their practices. The best of these are both highly
inclusive and actually pro-poor in ensuring the poorest households‟ needs are considered.
o Half the study FUGs (50%) get a „moderate‟ assessment: whereby there are some good aspects (e.g.
equal sharing, inclusion etc.) but these are balanced by some less equitable aspects (e.g. non members,
sometimes the poorest feel excluded, neighbouring villagers or the management taking the benefits of
regeneration).
o A small number (2 or 12.5%) show poor levels of equity. These groups are very small FUGs who
have taken over forest land from the larger village, and are benefiting from it significantly but at the
expense of the non-members.

60
Overall there is a clear tendency for poorer households to participate less in CF as they are too
preoccupied with food security, and lack the time to participate. They are also likely to depend of the
forest more as they lack private assets like their own land, from which they might get tree products etc.
Some FUGs have been socially inclusive, and ensured that the poorest are involved and get an equal share
of benefits even if they are not able to invest their time. However, some FUGs have not been able, or
have not tried to include the poorest.
For the future it should be made a priority to ensure the poorest are included and that their
livelihoods benefit from CF, and certainly are not negatively affected. This can be achieved
at formation by ensuring all community members are made part of the FUG, and
encouraging the FUG to have pro-poor benefit sharing provisions. It may also require
reformation of group membership to include the poor. It may also require regular
monitoring to ensure the poor are benefiting and are not suffering from the CF process.
A particular concern is the cases where CF has been introduced on land where households have been
cultivating e.g. Taungya cultivation in hill areas or paddy in the Delta). We recommend that CF should not
be used as to „territorial control of land use, for both equitable and practical reasons – it is likely to lead to
counter-productive conflicts. Rather it should emerge from a consensus. The self-selecting membership
of CFUGs is a serious problem for social inclusion – as it is highly vulnerable to opportunistic elite
capture.
8.6 Further issues
There are several issues which have been beyond the scope of the current study.
8.6.1 Wider social development initiates
In several FUGs we are seeing wider social development processes emerging. These include community
development initiatives (i.e. school building and timber support), pro-poor and even pro-non-member
initiatives (e.g. in Ayeyawady). In some groups there are social inclusion processes emerging in order to
form new groups for non-members.
8.6.2 Is CF Pro-poor?
We have not in this study tracked the livelihoods of non-FUG members, and therefore it is hard to assess
whether poorer non-member households are enduring hardship due to CF.
8.6.3 Gender issues
Due to ascribed gender roles in rural societies women and men are likely to have different objectives from
forests. As men predominate in village positions, do women‟s priorities get considered? We have not
been able to explore these issues in adequate depth to draw conclusions at this stage.
8.6.4 Livestock & grazing issues
There are reports citing growing livestock numbers across Myanmar, but declining grazing land
availability. CF may contribute to / exacerbate this by converting grazing land into forest plantation. On
the other hand, planting fodder species, which once established will allow grazing, may contribute to
solving this challenge. We have not, however, been able to develop a clear picture of grazing issues
across our sites, so this must await future study.

61
8.7 Conclusions
The overall picture is complex: generally there are substantial benefits becoming available through
improvement in the forest condition from improved protection and management. Often these benefits
are being distributed fairly. But in some villages the FUG seems to be being mis-used, and so benefits are
as yet being unfairly shared, sometimes amongst a small group at the expense of restricting the rest of the
village households‟ use of the forest.
The self-selecting group structure may have been ideal to get FUG going as only the
interested and motivated participate. But this has led in a handful of cases to elite capture
and inequity; Inclusive FUG formations and reformation is essential;
Poorer households lack time and resources to participate and invest, but they are more likely
to depend on the forest resources. Therefore they need to be included and or have alternate
livelihood opportunities;
There is undoubtedly much potential here for enhancing the livelihood benefits through both
livelihood oriented forest management and also creation of value added products and
marketing development.
.


63
Chapter 9: FUG SUSTAINABILITY
9.1 Overview
We reviewed in Chapter 4 the extent to which FUGs are institutionalised at formation. Here we ask, have
they subsequently remained institutionalised? This question is of course critically important for the
overall prospects of the CF initiative in Myanmar. We need to know how many „survive‟ beyond the
initial formation phase, and the critical threats to them for which they need support.
We use a number of indicators to assess this: current activity level, fulfilment of reporting requirements,
level of awareness and understanding of CF, and conflict issues. Our assessments are shown in Table 9.1
below:
Table 9.1: Indicators of Institutional Sustainability of Study FUGs
FUG: State /
region
Initially
Institutionalised
Currently
active?
Annual
report to FD?
Awareness &
understanding
Absence of
conflicts
1. Wuyan Ka
2. Gweyutyan Ka ~
3. Sin Gaung Lay Ma
4. Pa De Thar Myothit Ma
5. Myay Thin Twin Ma ~ ~ ~ ~
6. Let Pan De Ma ~ -
7. Mine In Sh ~
8. Pway Hla Sh -
9. Lwai Nyeint Sh ~ ~
10. Nar Daung Hla Sh ~ ~ ?
11.Kone Shine Sh ~ ~ ~
12 .Taung Kya-1 Sh
13 Nyaung Ta Bin Ay ~ ~ ~
14 Byant Gyi Gon Ay ~
15 .Te Bin Seik Ay ~ ~ ~
16. War Gon Ay ~ ~
9.2 Are Formed FUGs Currently Active?
Compared with initial institutionalisation, we consider here whether FUGs have continued to work once
formed up to the present. Indicators include: are they meeting, protecting and managing the forest and
so on.
o Half the study FUGs (50%) are currently functioning well.
o Five of 16 FUGs (31%) are functioning moderately well, but with significant problems.
o Three of the 16 sites (19%) are stagnant (3 of 16) with little sign of collective activity.
By region Kachin and Ayeyawady are performing well (no „stagnant‟ FUGs), whereas Mandalay has one
and Shan has two. In the Shan study, well functioning FUGs are in the minority.
One might have expected Nargis, being a major shock, to have fatally disrupted the new CF practices in
the Delta region. But it seems that because environmental protection proved such a major benefit, and
also that the more productive CFs have provided a range of products and services valuable for recovery,
Delta FUGs have redoubled their efforts and are highly motivated despite the hardship and devastation
caused by Nargis.

64
The current activity can best be explained in relation to the formation process. The 3rd column in Table
9.1 shows the assessment of the initial formation. No groups that were scored highly for their initial
formation have failed in their sustainability assessment. However, some are now having problems. It is
the villages that had a mediocre formation processes that have now stagnated. Note that although we
assessed two groups as having poor formation processes this was because of „elite capture‟ and these
small groups function effectively, partly because they are highly motivated.
To ensure FUGs survive the FD must first effectively monitor their ‘health’ on a regular
basis;
Support should be urgently focussed on those that are struggling, to help them back to
‘health’;
Stagnated FUGs need revitalisation support.
9.3 Are FUGs Submitting Annual Reports?
There is a low level of submission overall: only 5 study FUGS (31%) are reliably submitting their annual
reports. These are all active FUGs. The rest of our study group (11 of 16 FUGs or 69%) are not
regularly submitting, including three otherwise highly active FUGs.
This seems to be symptomatic of a weak relationship between the District Forest Office and the FUGs.
We might question whether the FUGs know why they are supposed to submit them, and whether the FD
exerts a „demand pull‟ to receive them. The answer is probably not (although we need to explore this
further). There don‟t seem to have been any repercussions from not submitting, nor benefits from
submitting. Thus there is little incentive or disincentive. On the other hand, the annual reporting could
form the key basis for communication and monitoring between the Township Forest Office and the
FUGs, as it does in many other countries.
There is also concern regarding other forms of record keeping. Seven FUG management committees out
of a total of sixteen do not have the management plans with them anymore and four FUG management
committees have only the photocopies of the Community Forestry Certificates (CFCs) with them.
The annual reporting process should be revitalised and strengthened to form a key
communication and monitoring information flow, and database for tracking FUG progress
and support needs;
FUG record keeping practices need to be part of reporting and monitoring. Records need to
be kept up-to-date, with FD staff assistance as necessary.
9.4 Awareness and Understanding.
We are interested here in the breadth of awareness across the village and FUG members, and also the
depth of understanding regarding Community Forestry regulations and roles, particularly in the
Management Committee. The FD is fully responsible to raise awareness of and educate the FUGs on
CFI and CF issues at the formation stage. We found
o A&U is good in 5 of our study FUGs. The villagers have a clear grasp of the principles, and the
Management Committees have detailed understanding of the issues and regulations.
o A&U is at a mediocre to poor level in 4 of our study sites. Most people may be aware of CF and they
may be vaguely aware of the basics, but they lack a clear grasp of the fundamental principles and do
not have a detailed understanding

65
o It is very poor in 7 sites. This is 44% or almost half the study sites. Villagers and even the
Management Committee do not have a grasp of what CF is, and feel it doesn‟t apply to them, even
when they may be members!
Ongoing awareness-raising is probably needed to maintain understanding across the MC
and general body.
9.5 Conflicts and conflict management
Some degree of social conflicts in community forestry is inevitable: as the management regime changes
and regulated use is enforced there are inevitably disagreements. Prevalent issues across FUGs include
conflicts over illicit product extraction and land occupation.
o Four sites (25%) have no conflicts – and in two sites conflicts have been effectively resolved with
active FD support.
o In 6 sites (37.5%) there is a moderate level of conflict.
o In 5 study sites (31%) there is more serious conflict.
o In one site (6%) we could not establish the level of conflict.
Table 9.2: Conflict issues in Study FUGs
FUG: State / region
Absence of conflicts
Comment
1. Wuyan Ka No apparent conflicts
2. Gweyutyan Ka ~ Disputes with neighbours, Struggling to control some outsiders from cutting
3. Sin Gaung Lay Ma Exclusion: complaint on CF Certificate by non-members
4. Pa De Thar Myothit Ma Exclusion: Conflicts with village non-members
5. Myay Thin Twin Ma ~ Disputes with neighbours, but FUG wants the FD to handle it
6. Let Pan De Ma No apparent conflicts
7. Mine In Sh Disputes with neighbours, illicitly taking fuelwood, but want FD to handle it
8. Pway Hla Sh ? Not known
9. Lwai Nyeint Sh Resolved disputes with neighbours extracting with FD support
10. Nar Daung Hla Sh Resolved disputes with neighbours extracting with FD support
11.Kone Shine Sh ~ Some illicit cutting and occupation for shifting cultivation
12 .Taung Kya-1 Sh Exclusion: Small FUG group excluding wider village who want to participate
13 Nyaung Ta Bin Ay ~ Some illicit cutting
14 Byant Gyi Gon Ay Much illicit cutting
15 .Te Bin Seik Ay ~ Some illicit cutting
16. War Gon Ay ~ Some illicit cutting by neighbours
There are only two main causes of conflict. These are:
1. Exclusion from membership: elite capture is a serious cause of conflicts with non-members within
the village. In these cases the FD needs to help re-organise the FUG membership.
2. The struggle to enforce cutting regulations, particularly to exclude outsiders but also with villagers,
especially those occupational groups more dependent on their traditional forest use.
The challenge to manage conflicts fairly and effectively requires a confident FUG with support and back-
up when needed from FD. If conflicts continue unmanaged they may dissipate the village‟s interest in
Community Forestry as a whole.
Forest Users’ Groups need to feel backed-up by FD field staff in order to cope with conflicts
confidently. The FD should play a more active role in conflict resolution.

66
9.6 Support relationships
What sort of support can and do FUGs get? Table 9.3 shows that across our study sites support is quite
limited.
o Only the two FUGs in Kachin (12.5% of the sample) receive „good‟ support.
o Seven FUGs ( 44%) receive moderate / mediocre support.
o Five FUGs (31%) feel they receive poor support. Limited support becomes a problem when there are
crises that only the FD can resolve – like enforcing regulations against illicit felling.
o For 2 FUGs (12.5%) support levels were unclear.
Table 9.3: Support relationships
FUG: State / region
Support
1. Wuyan Ka NGO (Shalom) and FD both supporting. Also involved in FUG network
2. Gweyutyan Ka NGO (Shalom) supporting. Also involved in FUG network
3. Sin Gaung Lay Ma FD not enforcing rules despite contraventions (elite pressure likely cause)
4. Pa De Thar Myothit Ma ~ Claim don’t need – although conflict with non members persisting
5. Myay Thin Twin Ma ~ FD visits but not significant help; NGO support
6. Let Pan De Ma No apparent support
7. Mine In Sh Poor back-up from the FD
8. Pway Hla Sh None beyond seedling supply
9. Lwai Nyeint Sh ~ Some support from FD but more needed to protect trees as they mature
10. Nar Daung Hla Sh - Not clear
11.Kone Shine Sh - Not clear
12 .Taung Kya-1 Sh ~ Limited support from FD
13 Nyaung Ta Bin Ay ~ Previously JICA project, now limited
14 Byant Gyi Gon Ay Villagers want effective legal action from FD to enforce protections
15 .Te Bin Seik Ay ~ Limited help, but limited need
16. War Gon Ay ~ NGO (FREDA) giving agricultural inputs support
Some key issues arise from the question of FUG support.
The FD role in CF support seems unclear, and the terms of reference between FUGs and the
FD field office need clarifying for the long term. Has FD had sufficient budget allocation to
fund these CF support activities? Has CF become part of FD field office normal
responsibilities, or some sort of marginal duty they have no time for?
FUGs in Kachin have formed FUG mutual support networks to help themselves. This sort of
initiative should receive substantial support in order to grow, as it is the most practical way
FUGs can secure the support they need without depending on other agencies
9.7 FUGs aims and issues for the future
During the PRA discussions we asked the FUG members what their action plans were for the future.
They are summarised in Table 9.4.

67
Table 9.4: Issues for the future FUG: State /
region
1. Wuyan Ka Members uncertain whether they will really get the benefits from their efforts
2. Gweyutyan Ka -
3. Sin Gaung Lay Ma Non-members want to participate now it is clear CF can be trusted
4. Pa De Thar Myothit Ma -
5. Myay Thin Twin Ma Alternative energy supply for jaggery production sought instead of fuelwood
6. Let Pan De Ma Improve communications -want to understand CF principles better
7. Mine In Sh Revitalise and form local network as all FUGs groups face similar issues
8. Pway Hla Sh Youth group want to reform the FUG – very enthusiastic regarding CF
9. Lwai Nyeint Sh They want to strengthen their institution in order to sustain achievements
10. Nar Daung Hla Sh Want to revitalise & conduct plantation, better choosing species
11.Kone Shine Sh Improve coordination with FD for enforcement. Train 2nd line leaders
12 .Taung Kya-1 Sh Revise FUG to include those excluded
13 Nyaung Ta Bin Ay Renovate forest condition and include non-FUG members
14 Byant Gyi Gon Ay -
15 .Te Bin Seik Ay Plantation to improve species composition
16. War Gon Ay Non members want to form their own FUGs
The points raised can be divided into two areas:
1. Basic institutionalisation issues – three groups (sites 7, 8, 10) wish to revitalise their FUGs which are
struggling
2. Further FUG development – the rest of the groups are planning to improve their institution or forest
management practices in a range of ways.
9.8 Conclusions
From our sample - most FUGs remain reasonably well functioning – the dominant pattern is that they are
institutionally effective at the outset– but with lack of effective support, stagnation and loss of impetus
become a serious problem.
However, the problem of FUG stagnation may be worse than it seems from this study. Some Forest
Department regional directors have reported that they guess that as few as 10% of formed FUGs are
active in their division. But without an effective monitoring system it is impossible to know.


69
Chapter 10: OVERALL CONCLUSIONS: POLICY, LEGAL AND
INSTITUTIONAL ISSUES AND RECOMMENDATIONS.
10.1 Overview
In this final section we cover three main areas: we sum up our findings from the FUG study and draw
out the main insights, conclusions and policy recommendations. We then consider the Forest Department
institution, the level of understanding and commitment of FD staff, and we again draw up policy
recommendation; and thirdly we review the legal framework and give some key recommendations based
on our learning from the field study.
10.2 Forest Users’ Groups: Conclusions and Recommendations
We have now discussed all the main aspects of community forestry for our study sites. Our findings are
summarised in table 10.1 below:
Table 10.1: Summary of FUG indicators:
FUG: State/
Regio
n.
1 Prior
Forest
condition
(table
4.3)
2 Institut-
ionalised?
(table 4.5)
3 Forest
protection
effective?
(table 5.1)
4 Forest
Condition
(table 6.3)
5 Improved
Benefits
(table 8.2)
6
Equitable
(table 8.3)
7. Currently
active?
(table 9.1)
1. Wuyan Ka ~
2. Gweyutyan Ka ~ ~
3. Sin Gaung Lay Ma
4. Pa De Thar Myothit Ma ~ ~
5. Myay Thin Twin Ma ~ ~ ~ ~ ~
6. Let Pan De Ma ~ ~
7. Mine In Sh ~ ~ ~ ~
8. Pway Hla Sh ~ ~ ~ ~
9. Lwai Nyeint Sh ~ ~ ~
10. Nar Daung Hla Sh ~ ~ ~ ~ ~
11.Kone Shine Sh ~ ~
12 .Taung Kya-1 Sh ~
13 Nyaung Ta Bin Ay ~ ~ ~
14 Byant Gyi Gon Ay ~ ~
15 .Te Bin Seik Ay ~ ~ ~
16. War Gon Ay ~
good - 50% 19% 50% 81% 38% 50%
~ moderate 19% 31% 69% 31% 19% 50% 31%
poor 81% 19% 12% 19% - 12% 19%
The aggregate performance of the FUGs studied is summarised in figure 10.1 below. It shows that, for
indicators 2 to 7 over 80% of study FUGs are classed as „moderate‟ / „medium‟ or „good‟.

70
Figure 10.1: Summary of Study FUG’s performance indicators
The policy challenge is therefore twofold: Firstly, how to fulfil the Master plan targets by scaling up
Community Forestry handover. And secondly how to ensure all FUGs fulfil their potential – i.e. can be
moved from poor or medium to „good‟ for each of these indicators.
We offer some evidence-based recommendations here:
10.2.1 Critical mass of FUGs not yet reached
There has been significant formation / handover, however this is insufficient to lead to a „critical mass‟
that can become a general movement. The handover process has been too slow and inadequately
resourced. The process itself seems prohibitively difficult / expensive for the village and FD to manage
alone, without donor funding. The policy challenge is how to scale up the CF handover process to help
achieve a „critical mass‟ of Community Forestry.
Policy should make FUG formation streamlined so that more ‘self-initiated’ FUGs can
emerge.
More resources should be allocated for CF formation, both by government, donors and
others.
10.2.2 Sub-optimal FUGs and Post-formation support
Overall the FUGs are functional, albeit at a sub-optimal level, and their sustainability is threatened. Much
of the substantial achievements in terms of improved forest management and protection, which led to
improved forests and livelihood benefits, are threatened by declining activity.
We have observed a wide variety of village level CF processes. In some cases we have noted a remarkably
dynamic performance. Groups show a significantly stronger performance in Kachin State and
Ayeyawady Region. The general performance is weaker across Mandalay and Shan. Successful CFUGs are
often found where there is a combination of dynamic leadership, good social cohesion and effective
support provision. Overall, we can see that where CF works, it delivers a „win-win‟ outcome of
sustainable environmental management and community development. The most dynamic groups may
now be moving into a „second generation‟ phase of enhanced active forest management, village to village
demonstration /extension support / networking etc., community and livelihood development etc.
0%
10%
20%
30%
40%
50%
60%
70%
80%
90%
100%
Per
cen
t o
f st
ud
y si
tes
poor
medium
good
71
But at the other end of the spectrum some groups are in complete stagnation or working very poorly.
Reasons for this include: lack of clear understanding conveyed at the outset by FD, limited leadership
capacity, unchallenged illicit cutting / grazing, lack of support, esp. after donor project support ends.
Some groups exhibit „elite capture‟ of the major benefits (e.g. Shan)
Most FUGs are somewhere in the middle – they are not performing exceptionally well, however, they are
not failing, and are able to carry out most CF operations. FUGs face major challenges post formation /
post project, which without adequate support leads to stagnation:
o Conflict, especially over illicit extraction
o Delay in getting FD permission for timber harvesting
o Disruptions which are difficult to recover from (esp. leadership change)
Therefore, a key policy challenge is how to shift the faltering CFUGs onto a more robust development
path. Projects provide funds for intensive village development, but when they finish, new village
institutions like CF have to function with much more limited support. There has been a lack of FD
capacity for post-formation support, but FUGs require back-up from FD.
The critical challenge is strengthening FD’s post-formation support provision, including
o Awareness raising
o Monitoring
o Management support / harvesting endorsement
o Conflict resolution
o Reform of dysfunctional groups
o Inclusion of non-members in the process: (either review of FUG membership or new group formation)
o Pro-poor inclusion and support from FUG benefits
o Need for improved general post-formation support to maintain dynamism of CFUGs and
avoid stagnation. A key cause of stagnation is identified as a lack of FD enforcement back up
to CFUGs when they try to challenge illicit cutting and land grabbing. FD must give legal
backup and enforce punishments.
FD must provide back-up and support CFUGs, especially when there is illicit felling.
CFUGs need to diversify sources of support – and network between themselves.
10.2.3 Identifying and revitalising stagnating CFUGs
The study found 19% of groups were experiencing a degree of stagnation, but without a monitoring
system it is impossible to know how many groups are losing impetus and experiencing declining
productivity throughout Myanmar.
Need for a nationwide monitoring system as part of post-formation support.
Need to identify stagnating groups and take remedial action when stagnation occurs.
10.2.4 Raising Awareness and Understanding CF concepts, roles and responsibilities
Many villages have failed to grasp key principles because they were not trained effectively, sometimes by
teams who themselves do not clearly understand the subject matter.
Need for more effective reorientation and training of FD staff. CFDTC provides training to
FD staff, but anecdotal reports suggest they themselves lack field experience in the ‘nitty-
gritty’ of actually carrying out FUG formation and post-formation support.
NGOs can play valuable complementary support, facilitation and a training role for
communities

72
10.2.5 CF not yet pro-poor but potential exists
We need to find ways to ensure poor are not excluded and pushed deeper into poverty by restrictions on
their resource use. Where there is individual plot ownership approach – support is needed for fast return
crops for the poorest households.
Social inclusion of the poorest households must be prioritised. It is recommended that all
interested households in the village are included, rather than self-selection as practised
currently.
Alternative livelihood options and enterprise development. Concessions on allowing the
poorest to continue to access the resource.
10.2.6 Inadequate Legal basis for CF.
The CF Instruction was passed in order to rapidly initiate CF without undergoing the lengthy processes
required to develop a law. But Forest Users‟ Groups cannot compete for land against other departmental
claims as effectively as if the CFI were enshrined in law. Furthermore, appropriate laws could include
detailed and binding rules for implementation.
Need to evolve CF Instruction into new Law and Rules.
Need for policy revitalisation and renewed emphasis from senior staff.
10.2.7 Forest Users’ Group – Policy recommendations summarised
The following are our observations of the strengths and weaknesses of FUGs and our recommendations
to address the weaknesses (Table10.2)

73
Table 10.2: Issues and Recommendations relating to FUGs and CF
Strengths Weaknesses Recommendations
1. FUG Formation & membership eligibility
Formation of FUG is easy and flexible
Self selection for FUG, inclusion of opportunists and elites, non-eligible members, exclusion of poorest and customary right holders are not in accordance with CFI 1995.
Self-selection creates conflicts within MC and between FUG and other members, predominance of elites and inequitable distribution of benefits.
Eligibility criteria for membership of FUG should be set clearly.
The membership should be targeted to the poorest and customary
right holders residing in the locality.
The whole village, if feasible, should be included in FUG, and local
authority in MC.
Proposed CF area and list of members of FUGs should be notified to
local communities to seek feedback from them in a reasonable period
as in Reservation procedure.
2. Awareness of CFI
Most FUGs, are not well aware of the CFI, but still protect and maintain their CFs effectively.
Awareness is generally weak: Out of 16 FUGs, 6 is good, 5 moderate and 5 poor.
Some members know nothing about CF, and think they are forming forests for the government. They have never been properly sensitized on CF.
FD should explain to the villagers about CF and CFI in detail before
forming CF, and train them on planning, management, conservation,
silvicultural treatments and utilization of forest.
3. Practices and Capacity
Most CFs have been effectively institutionalized.
Despite having received CFCs, and been managing their CFs well, some FUGs have very poor or even absence of record keeping and reporting.
Nearly half of the study FUGs do not have original MPs; 40% have copies.
Most FUGs do not submit annual reports to FD.
FUGs lack capacity to face encroachers. They are reluctant to conflict with outsiders.
The capacity of the FUG in the context of record keeping, preparation
of income-expenditure accounts should be raised through trainings
and demonstrations.
FD should provide follow-up support, monitor the performance and
assist FUG to prevent illegal acts and resolve conflicts.
FD should encourage FUGs to submit annual reports, and give some
benefit / clear reason to FUGs for doing so.
Simplified report format for completion of each CF activity, the one
which CFI miss, should be delivered to FUGs.
4. Adaption of Membership
Successful FUGs are generally reluctant to accept new members
FUGs should be carefully ‘reformed’ and made accessible to all
eligible villagers.
5. Conflicts
Some of the best FUGs can resolve conflicts effectively
Conflicts occur between MC and other members, between members and non-members within village, and between villages
FUG should include all villagers especially poor and woman-headed
households, and MC formed with consensus.
Internal regulations of FUG should be developed with consensus
facilitated by FD staff.
Roles and responsibilities of Chairman, Secretary and other members
of MC should be well identified before selecting candidates for MC with
consensus.
6. Additional issues
Follow up activities in collectively managed CFs are insufficient and not sustainable
Activities of some donor-supported CFs stopped after the project.
Measures to ensure food security of the members should be integrated
in the establishment of CF at the very beginning.
FD’s material and technical supports should continue.
MCs should be educated to abide by their duties, responsibilities and
regulations.
Capacity of FUG should be promoted continuously.
10.3 Forest Department: Findings and Recommendations
10.3.1 Assessment of the understanding of, and commitment to, Community Forestry by FD staff
In order to study the understanding and commitment of the Forest Department (FD) staff regarding CF,
questionnaires were given to all the FD staff in the 8 townships where the study was carried out.
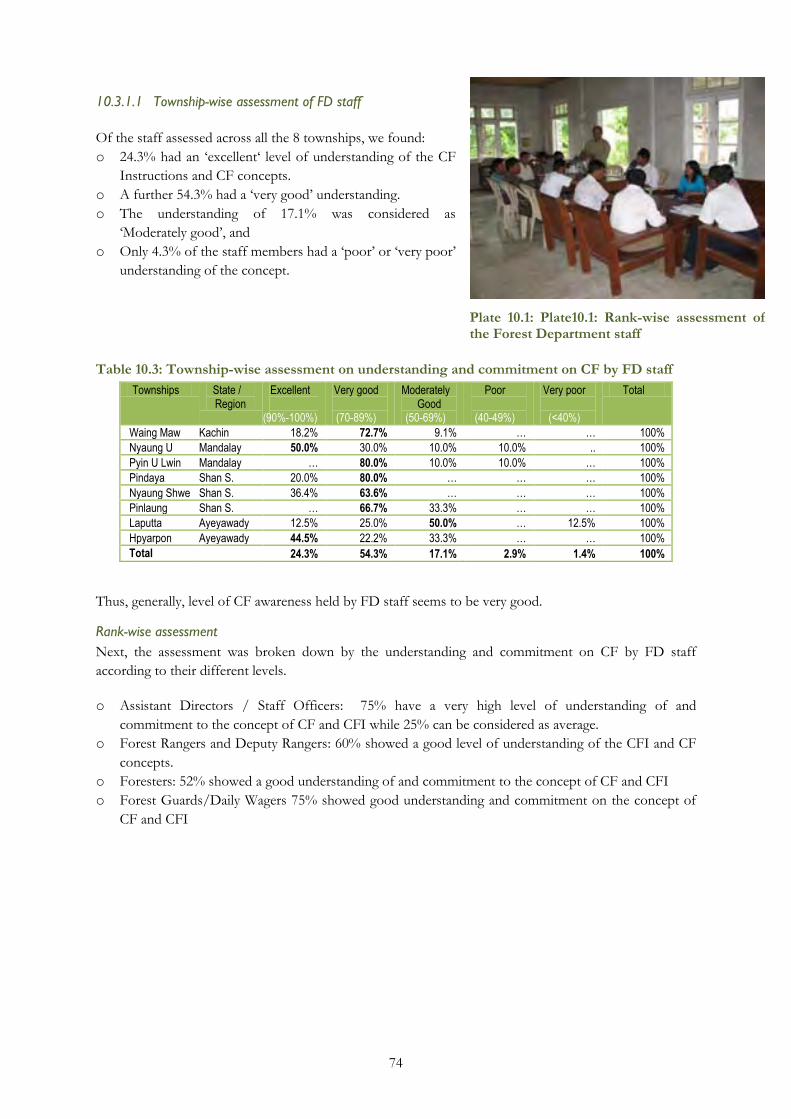
74
10.3.1.1 Township-wise assessment of FD staff
Of the staff assessed across all the 8 townships, we found:
o 24.3% had an „excellent„ level of understanding of the CF
Instructions and CF concepts.
o A further 54.3% had a „very good‟ understanding.
o The understanding of 17.1% was considered as
„Moderately good‟, and
o Only 4.3% of the staff members had a „poor‟ or „very poor‟
understanding of the concept.
Table 10.3: Township-wise assessment on understanding and commitment on CF by FD staff
Townships State / Region
Excellent
(90%-100%)
Very good
(70-89%)
Moderately Good
(50-69%)
Poor
(40-49%)
Very poor
(<40%)
Total
Waing Maw Kachin 18.2% 72.7% 9.1% … … 100%
Nyaung U Mandalay 50.0% 30.0% 10.0% 10.0% .. 100%
Pyin U Lwin Mandalay … 80.0% 10.0% 10.0% … 100%
Pindaya Shan S. 20.0% 80.0% … … … 100%
Nyaung Shwe Shan S. 36.4% 63.6% … … … 100%
Pinlaung Shan S. … 66.7% 33.3% … … 100%
Laputta Ayeyawady 12.5% 25.0% 50.0% … 12.5% 100%
Hpyarpon Ayeyawady 44.5% 22.2% 33.3% … … 100%
Total 24.3% 54.3% 17.1% 2.9% 1.4% 100%
Thus, generally, level of CF awareness held by FD staff seems to be very good.
Rank-wise assessment
Next, the assessment was broken down by the understanding and commitment on CF by FD staff
according to their different levels.
o Assistant Directors / Staff Officers: 75% have a very high level of understanding of and
commitment to the concept of CF and CFI while 25% can be considered as average.
o Forest Rangers and Deputy Rangers: 60% showed a good level of understanding of the CFI and CF
concepts.
o Foresters: 52% showed a good understanding of and commitment to the concept of CF and CFI
o Forest Guards/Daily Wagers 75% showed good understanding and commitment on the concept of
CF and CFI
Plate 10.1: Plate10.1: Rank-wise assessment of the Forest Department staff

75
Table 10.4: Assessment of understanding and commitment on CF by FD staff level
Rank Number Excellent (90%-100%)
Very good
(70-89%)
Moderately Good
(50-69%)
Poor
(40-49%)
Very poor
(<40%)
Assistant Director / Staff Officer 4 75% .. 25% … …
Forest Ranger 15 20% 60% 7% 13% …
Deputy Ranger 20 25% 60% 15% … …
Forester 27 22% 52% 26% … …
Forest Guard/Daily Wager 4 … 75% … … 25%
Total 70 24.3% 54.3% 17.1% 2.9% 1.4%
The overall picture that emerges is that the majority of the forest officers understand the CFI well and are
committed to the concept of CF, while over 50% of the staff at Forest Ranger level and below also
showed good understanding and commitment on the concept of CF and CFI.
Field observation
The above evidence shows that the foresters‟ understanding of and commitment to CF and CFI are
found to be good. However, observations and discussions with the FUGs in the 16 CFs surveyed
showed that there are nevertheless weaknesses to overcome.
Ba Kaung (2006) also carried out a survey at 3 CFs in the Central Dry Zone of Myanmar. He found that
generally, most of the CFs in the Dry Zone were established with the support of FD, Dry Zone Greening
Department (DZGD) or organizations like UNDP, JICA, Community Forestry Training Project
(COMFORT), etc. Ba Kaung stated that there were very high inputs from UNDP and JICA, and the CFs
were successful during the project period but were not sustainable. Inputs were very low in CFs
established by FD and COMFORT. However, COMFORT supported 60 motorbikes to target FD
Townships for mobilizing and sensitizing the communities. This raised the awareness of the community
and prompted them to request the establishment of CFs by themselves.
Myanmar‟s CF process may benefit from comparison with some international experiences. We have
chosen to compare with Namibia (see Box 10.1) in particular, because CF in Namibia is very successful
and the benefits made by the users‟ group is increasing every year.

76
10.3.2 Institutional Aspect of Community Forestry – issues, strengths and weaknesses
Community Forestry Issues: in relation to the Forest Department
The following are our observations of the strengths and weaknesses of the concerned forest staff we
interviewed and our recommendations on how to address the weaknesses (Table 10.5)

77
Table 10.5: Community Forestry Issues: in relation to the Forest Department
Strengths Weaknesses Recommendations
1. Policy Framework
FD ‘s 30-year
Master Plan
prioritized CF to
contribute to SFM
and national fuel
wood demand.
There is a lack of clearly defined national CF
policy supported by Law
Lack of partnership mechanism between
related ministries
Insufficient budget allocation
Formulate national CF policy, amend 1992 Forest Law as
appropriate and promulgate CF Rules as a matter of urgency to
scale up community forestry in the country.
To remove land-use related conflicts between Ministries and speed
up CF hand over, it is crucial for MOF to partner with other related
ministries, e.g. through creation of a National CF Task Force
Poor FUGs need support to initiate CFs, and so also FD and DZGD
for CF operations. So, sufficient budget allocation should be claimed
from the national capital budget.
2. FD Capacity to Support FUGs
FD has staff of
15,148 and DZGD
3,231: they are
strong, qualified and
well equipped
organizations to
implement CF
across the country.
Need more effective reorientation and
training of forest staff
Post formation support and monitoring for
FUGs insufficient – they need dynamic
leadership from FD
Lack of a unit within FD specifically assigned
to CF
CF not yet part of normal field
responsibilities, still remains sort of marginal
and optional duty
FD traditionally more concerned about
timber than social, conservative and
restrictive
Frequent shift of trained personnel disrupts
rapport between FD staff and FUGs
The foresters should recognise and accept that: o the basic needs of local communities for wood and NTFPs are to
be satisfied from local forests; and o community forestry is a participatory approach to arrest
deforestation and forest degradation, and to satisfy the basic needs of the community contributing to SFM.
FD should regard community forestry as a part of its mainstream forestry with long-term perspective.
A Special FD Unit specifically tasked with CF should be formed. CF planning should start from the bottom: to address and seek to
satisfy community needs. FD should monitor and evaluate the performance of the CFs
regularly providing support as necessary. Concrete notes should be made for handing over of CF activities in
case of shift of trained staff. FD should develop rules of thumb for quick transfer of CF land use
rights to the communities. Rules should be site and objective specific.
3. Training
CFDTC has been
continuously giving
in-service CF
trainings to foresters
of FD and DZGD .
CF is an ongoing co-learning process, and
so far training has not fulfilled this need
adequately. Much more training is needed
at all levels to raise awareness, clarify
confusions and motivate and empower
Training should be ongoing at every step of CF & experience-based.
Training of dedicated staff should be prioritized.
Training should transform and update foresters’ attitude from being
classical forest managers focussed on protection, law enforcement
and commandeering, to become social workers and facilitators.
Training should also be provided on the FUGs.
Periodic revision of training curriculum should be exercised to cope
with dynamic nature of field reality.
4. Partnerships & collaboration
INGOs, NGOs and
UN organizations
have supported FD
to conduct trainings
and establish CFs.
Much more could be achieved with further
collaboration
FD should enhance collaboration with NGOs and other
organizations, and mobilize technical and financial resources.
Participatory monitoring system should be developed with support of
NGOs.
5. Re-orientation
Over 78% of FD
staff are well aware
of and committed to
CFI & CF concepts
Lack of bottom-up approach in CF planning
and establishment
FD staff act as managers, not as facilitators
No needs assessment and prioritization of
community needs in MP
Bottom-up approach should be adopted in the CF planning and
establishment.
Staff of FD should serve as facilitators and not as managers.
Need assessment and prioritization of community needs should be
considered in MP.
6. Forest User training
Forest field staff
have imparted CF
concepts to
communities,
especially during
FUG formation
Failed to effectively raise awareness of the
community on CF and CFI
Failed to train FUG on CF principles, CFI
1995, management, silvicultural treatment,
protection and harvesting of CF
Communities’ awareness on CF and CFI should be raised.
FUG should be trained on CF principles, CFI 1995, management,
silvicultural treatment, protection and harvesting.

78
7. Formation processes
Many FUGs formed
by FD staff
Weak to supervise and advise in forming
FUG- (to consider gender, poorest,
predominance of powerful, inclusion of
ineligible, exclusion of eligible)
Capacity of the FD staff should be strengthened through local and
international trainings and workshops.
FD should supervise FUG formation so that it includes all those who
are eligible and exclude those who are not eligible. The inclusion of
women and poor should be prioritized.
As mentioned in the CFI, FUG should be formed with interested
households. Not with individual persons.
Individual hh profile should be recorded to consider the appropriate
amount of land for particular hh by DFO in case of agro-forestry
plantation in CF.
8. Post-formation monitoring and support
Foresters routinely
interact with FUGs
once they have
formed
Slow handover of land
Failed to monitor the performance of CF and
FUG
Failed to provide need-based post-formation
support
Lack of capacity to provide assistance to
FUG in protecting CF against unlawful acts
of outsiders- in solving conflicts
Failed to protect against land grabbing by
elites and business men in some cases
FD should make it a point to monitor the performance of CF and
FUG.
FD should provide post-formation support.
FD staff should be trained to provide assistance to FUG in protecting
CF against unlawful acts of outsiders and in solving conflicts.
Amend forest law as appropriate and enforce it.
Simplify CF certification procedure.
Speed up land acquisition through a CF task force.
9. Responding to problem FUGs
Most FUGs
continuing to
function
There are FUGs that have stopped
functioning.
Need to monitor and reform dysfunctional FUGs

79
10.4 Policy and Legal Aspects of Community Forestry
To promote CF, a pathway should be mandated and guided by policy.
10.4.1 Policy Measures Recommended
Regarding community forestry, Myanmar‟s Forest Policy 1995 has identified „participation‟ and „public
awareness‟ as two imperatives, among others.
The „participation‟ imperative clarifies that by way of practicing community forestry or agro-forestry,
communities are to be involved in national and local efforts for:
o Achieving sustainable development of forests; o Meeting their basic needs; o Increasing non-farm incomes; and o Enhancing food security and alleviating poverty.
The imperative „public awareness‟ asserts that public awareness is to be raised regarding the vital role of
trees, forests and wildlife in national socio-economic development.
In adopting policy, measures as guidance for CF development should-
Reflect the above-mentioned two national policy imperatives; Recognize that local communities have significant local knowledge about the management
of trees and forests surrounding or adjacent to them; Recognize that local communities have a right to utilize forest products both wood and non-
wood for their basic livelihood needs and household income; Recognize that there is a need to change the role of foresters from being agents of
enforcement and protection to those of extension, facilitation and servicing; Recognize that community forestry should promote food security, value addition and
commercialization; and Recognize that CF policy should be market-oriented and needs to be integrated into
national development plan.
Taking the above considerations into account, community forestry policy measures that suit the country-
specific conditions may include:
Creation of enabling conditions for local communities to establish and manage community forests in a sustainable manner;
Security of community basic needs and early returns to reduce poverty, and ecological integrity by forming both artificial and natural community forests (CFs);
Security of the sustainability and legitimacy of community forests through built-in measures and legislation;
Setting policy target of say 20 percent of the permanent forest estate area to be transferred to the communities as community forests; and
Value addition and commercialization of CF products in harmony with social and environmental stability to enhance food security and contribute to local and national economies.
10.4.2 Strategic Approaches Recommended
In order to implement the policy measures, the following strategic approaches may be identified:
To sensitize and mobilize local communities to participate in community forestry through advocacy, extension, education and community consultation;
To form community forests to meet national fuel-wood requirement as stipulated in the 30-year master plans of Forest Department and Dry Zone Greening Department;

80
To integrate agriculture, livestock breeding and fisheries into forestry in establishing CFs to enhance food security and income and for value addition and commercialization;
To enhance the capacity of local communities in support of self-reliance and sustainability; To create opportunities for increased collaboration with assistance from government
agencies, NGOs and, donor and financial institutions during the establishment phase; and To amend the existing Forest Law 1992 and promulgate National Community Forestry
Rules.
10.4.3 Updating or Amending the Existing Forest Law, 1992
In order for the land tenure to be secure and the community forests sustainable, community forestry
needs legal support. The CFI 1995 was issued by the Ministry of Forestry without requiring Cabinet
approval, and is therefore a lesser order of legal instrument (JM Lindsay, FAO legal consultant, 1995).
The Forest Law enacted in 1992 has no provisions concerning establishment and management of
community forests. Only Section 15 of the Forest Law mentions about village-owned firewood
plantations established either by FD or by the villages by collective labour. Strictly, these village-owned
firewood plantations are not community forests according to CFI 1995.
Therefore, it is a matter of urgency to amend the Forest Law 1992 to provide for community forestry and
promulgate CF Rules as appropriate. The CFI 1995 may be used as the basis for drafting the CF Rules.
The 1992 Forest Law amended in respect of community forestry, as a matter of urgency, should-
Clearly define local community and community forestry reflecting country-specific conditions; Define scope of CF; Terms of land lease; and rights and responsibilities of FUG among others.
10.4.4 Updating the CFI 1995
The following are our observations of the strengths and weaknesses of the CFI 1995 and our
recommendations to address the weaknesses (Table 10.6).

81
Table 10.6: Issues and Recommendations relating to Updating the CFI
Strengths Weaknesses Recommendations
1. Legal basis
The instructions are admirably flexible, and serve as a good basis for CF Rules (Lindsay, 1995)
Instructions are a lesser order of legal instrument. Hence, CF is vulnerable.
Legal uncertainty constrains the pursuit of CF strategies (Lindsay 1995)
Strengthen legal framework to ensure land tenure and sustainability of CF.
2. Management plan - adaptation
Because DFO is empowered by DG to issue CFC, the CF process is short and simple, and to get permission to establish CF can be quick.
The contents of MP as stipulated by CFI are too rigid.
They may not be appropriate in some localities and some communities may not be able to write.
Simplify management plan and adapt CF to local conditions.
3. Paper-work
Formation of FUG with consensus of all users is sound and democratic.
Record-keeping requires excessive detail so compliance difficult.
Excessive reporting sends message to community that it is not controlling process.
Reduce record keeping to minimum. Train FUG on accounting, book-keeping and
report writing. Let FUG keep income-expenditure accounts
properly.
4. Right to revoke CFC
The right to create CF on any land subject to approval incentivises; community participation in forestry.
CF rights are subject to easy termination. Even a minor infraction of CFI can lead to the withdrawal of the CFC by the department.
CF rights should be terminated only for repeated serious violations and for failure to undertake remedial measures in disregard of FD warnings.
CFC should be revoked only by DG. FUG should have the right to appeal.
5. Eligibility
30-year land lease which is extendable and inheritable is reasonable, attractive and compares well with international practices.
CFI fails to define user eligibility. It seems anybody wherever he/she lives
can become a member of FUG or any traditional user of the designated land can be excluded.
CFI should clearly define the eligibility criteria for the villagers to become members of FUG.
The traditional users and the poorest of close geographic connection should be targeted.
6. Scope of CF management
The technical and material assistance to be provided by FD free of charge is critical to CF promotion.
CF scope to meet basic needs for fuel wood and other forest products and to generate food, household utilities and income at the farm level only has become out-dated now.
CF should also encompass environmental, social and economic aspects on a broader scale.
CF should be market oriented (whilst sustainable) Access to ecosystem services, value addition and
commercialization of products should be promoted
7. Livelihood integration
Forest users get more secure and sustainable product flows through CF.
CFI fails to integrate forestry with agriculture and/ or livestock breeding and fisheries to enable FUG to enhance food security and income.
Trees bring benefits only after a lapse of a few years.
CFs established with forest trees only cannot attract poor communities who have to work daily for food.
Food availability and income must be realized as early as possible and on a continuous basis.
In view of this, forestry should be integrated with agriculture, livestock breeding and fisheries wherever possible.
Site specific design of agro-forestry should be
adopted for food security and better income for
FUG without losing sight of environmental
stability.
8. Top-down or bottom up?
FD and FUGs both plan activities Management planning usually starts from the top ignoring the needs and wishes of the grassroots poor especially women.
FD should assess the needs of the potential users first, and involve them in formulating CF management plan to address their needs and wishes.
CFI should prioritize community needs and clearly mandates involvement of all users including housewives in management planning.
9. FD-village relationship
FD / community relationship gradually improving through CF
CFI fails to build trust between FD / government and the local community
FD should raise advocacy campaigns and work intimately with FUG not as its manager but as facilitator and advisor.

82
10.5 Conclusions
According to the forest cover appraisals conducted by the Forest Department, per capita actual forest
area available was estimated at 6.84 acres in 1931 and it had fallen to 1.36 acres in 1997 due obviously to
deforestation (land use change) and population growth (Tint 2008). Population was 14.7 million in 1931
and 46.4 million in 1997 (Anon. 2002). The annual deforestation rate in the last few decades stood at 0.54
million acres. Forest cover loss and population growth have led to a dwindling supply of forest products
as against the rise in demand. The requirement to fulfil the need of the local community and to work
together with them was in the mind of foresters since the beginning of scientific forestry in this country
in 1856. However, community forestry as a participatory forest management approach to restore forests
and meet the basic needs of local communities, particularly fuel-wood only came into being in 1995.
The current study of Community Forestry has found that:
84% of studied FUGs are working either moderately or very well;
Most of the studied CFs have shown good forest, good regeneration and good forest health; they
have been providing the communities with a multitude of benefits such as improved ecosystem
services, small timber, fuel wood, fodder, seeds and NTFPs thereby enhancing household incomes
and livelihoods;
The level of understanding of CFI 1995 and CF concepts across FD staff is relatively high;
The FD and the DZGD field staff have played a key role in the CF process;
Donor contributions have been vital especially in the initiation of many CFs across the country;
A cost-benefit analysis of a CF plantation has shown a very positive financial net return.
On the other hand, there are also issues to address which include-
Insecurity of land tenure: there are cases of land grabbing by elites, agricultural encroachment,
development of infrastructure on forest land and so on;
Poor CF formation: a number of cases of poor adherence to the correct sequential process of FUG
formulation and CF creation by donor agencies emerged. This creates dissatisfaction on the part of
the concerned forest staff and delays in handing over the land to FUGs. Most importantly it
adversely affects the sustainability of the established CFs;
Illicit cuttings and intrusions by neighbours: many FUGs have struggled to enforce access
regulations, and need FD‟s support to resolve, which is generally lacking;
Too low rate of CF establishment: since the 1995 CFI was issued, the rate of formation has been far
too low to meet FD‟s 30-year Master Plan target;
Insufficient monitoring and post-formation support by FD staff: FD‟s monitoring and support are
crucial to build trust of the FUGs and sustainably develop CFs, but are generally lacking;
Lack of community awareness on Community Forestry principles: poor understanding of the basic
concepts and local arrangements has discouraged community participation in the CF activities;
Weak legal basis of the CF instructions;
Need of good governance by both FD and FUG.
The CFI 1995 had been issued in 1995 primarily to address the basic needs of local communities and
environmental stability. It defines community forestry as neither regional development forestry nor an
industrial enterprise based on forest products. It aims at providing only the bare necessities of rural lives.
But, now it is realized that the scope of community forestry needs to expand in order to support food
security and poverty reduction through increased food production and income generation, in other words
from subsistence to enterprise. On account of its expanding scope, activities of the present-day
community forestry should integrate agricultural, fishery and livestock farming activities with re-
afforestation, collection of NTFPs, and timber harvesting on a significantly larger scale.
83
Many factors influence the success of community forestry, and they include the communities‟ technical
and managerial capacities, access to finance, institutional support, equipment, legal resources and market
information as well as integration within and between FUGs. Capacity building of FUGs being an
important necessity for the long-term viability of community forests should be exercised in a continuous
manner.
Access to external support was shown to facilitate the development of community forests, but it should
not be a factor to entice the community to establish CF. Sustainability of the CF depends upon the
understanding and commitment of the FUG on CFI.
The limitations of the current legislation should be transformed into a driving force for the sustainable
development of community forestry, and devolution of decision-making power to FUGs in managing
community forests shall have to be ensured and expedited. Legal framework and institutional
arrangements are to be in place to ensure legal authority and institutional support for CF processes.
While FD will take the role of leader as well as facilitator, and instil a sense of ownership within local
communities, mutual support and trust between FD and the communities is vital.
In essence, the main actor for the success of community forestry in the country is the FD under the
Ministry of Forestry which involving all related ministries and stakeholders should endeavour its best with
the realization that CF is a real necessity to achieve SFM while uplifting the lives of the local forest
dependent poor.
10.6 Further research agenda
We hope that this study has helped improve gaps in understanding of the CF process in Myanmar, its
progress to date and the measures needed to ensure it achieves its best potential in the future. There
remain several areas where further investigation is needed:
The key need is for detailed action research to work further with FUGs, NGOs and Forest
Department staff to understand the dynamics of the social processes which can lead to FUGs
‘taking off’ onto a sustainable institutional development path, and detailed insights into how
FUGs can overcome challenges and succeed.
How to achieve low cost scaling up of CF implementation. There are a number of areas to
work on: streamlining the formation process, promoting ‘self-initiation’ through awareness
raising and local support, promoting FUG networks for self-help, involving the private sector
for incentivising formation through offering incomes for producing desired forest products,
and so on.
How to ensure FUGs integrate effectiveness in forest management, efficiency in set up and
management costs, and equity and pro-poor benefit (and cost) distribution.
What sort of enterprise opportunities are there, and how can CF support and promote rural
enterprise development? What products can be produced, and how can FUGs assume a
more entrepreneurial role in forest product supply, processing and marketing?
What have been, and could be, the effects of CF on poverty alleviation and therefore what
should the role of Community Forestry be in the respective national poverty policies?
To what extent can Community Forestry play a role in biodiversity conservation and
management?
84
Section References
Anon. 2002: Facts about Myanmar. Ministry of Information, 2002
Anon. 2004: Advances in Community Forestry in Asia. Outcome of a RECOFTC Board of Trustees
Meeting, 2 November, 2004. RECOFTC, Thailand (Unpublished)
Anon. 1995a: Myanmar Forest Policy. Forest Department
Anon. 1995b: Community Forestry Instructions. Forest Department
Anon. 1996: Guideline for Management Plan, Forest Department, Ministry of Forestry
Anon. 1997: Myanmar Agenda 21. National Commission for Environmental Affairs
Anon. 2006: Lessons learnt from the project. Community Forestry Training and Extension Project.
Forest Department, 2006
Anon. 2008: Community Forestry in Namibia. Equator Prize 2008, Nomination of Community
Forestry in Namibia (CFN) project
Arnold, J.E.M.,1992: Community Forestry: ten years in review, FAO, Rome.
Ba Kaung 2006: Proposals on Modifications and Amendments of CFI, for Successful Community
Forestry Establishment in the Central Dry Zone of Myanmar
Gilmour, D., Malla, Y. and Nurse, N., 2004 : Linkages between Community Forestry and Poverty,
Position paper, RECOFTC, Thailand
Tint, Dr. Kyaw 2010: An Appraisal of the Ecological Aspect of Community Forest in Myanmar, Paper
presented at the CF Research Workshop, Yangon. 2010.
Tint, Dr. Kyaw 2007: Community forestry: Evolution, Opportunities and Constraints- A Myanmar
example.
Tint, Dr. Kyaw 2008: Forestry for the people (In Myanmar)
Kyi Maung. 2004: Community Forestry Practice in Myanmar. Bagan, Myanmar
Lindsay, J.M., 1995: Community Forestry Rules for Myanmar. TSS-2 Report. MYA/93/005, FAO.
Additional References
Bhatta, B 2007in Springate Baginski, O & PM Blaikie „Forest, People and Power: The Political Ecology of Reform in South Asia (Earthscan: London)
Bryant, R.L. 1996. The political ecology of forestry in Burma, 1824-1994. University of Hawaii‟i Press, Honolulu. 257 pp.
Ecodev 2009 Proceedings of First National CF Workshop Lin, Htain 2005 Community Forestry initiatives in Myanmar: an analysis from a social perspective in
International Forestry Review Vol.7 (1), 2005 Ministry of Forestry 1995. Myanmar forest policy, 1995. Yangon, Union of Myanmar. 54 pp. State Law And Order Restoration Council 1992. Forest law – 1992. The Union of Myanmar. 27pp. Tint, K. 1995. Community forestry. National workshop on "Strengthening re-afforestation programmes
in Myanmar"

85
APPENDIX I: COMMUNITY FORESTRY INSTRUCTION 1995
Introduction
1. For the purposes of regaining environmental stability and addressing basic needs of local
communities, active participation by the rural population is urgently needed to plant trees in barren
lands and to reforest degraded areas. To achieve these goals Community Forestry Instructions are
issued by the Forest Department prior to the formal enactment of the Community Forestry Rules.
Definition
2. Community Forestry means:
Afforestation of areas where there is not sufficient fuelwood or other forest products for
community use
Planting of trees and exploiting of forest products to obtain food supplies, consumer products
and incomes.
3. Community Forestry is neither a regional development forestry nor an industrial enterprise based on
forest products.
Suitable Areas for the Establishment of Community Forest
4. Community forests can be established in the following areas:
a. Reserved and non reserved forests authorized by the government and the lands which could be
managed by the government
b. Village owned firewood plantations established with the permission of the Director General of
the Forest Department.
c. Private lands permitted by their owners and lands which are owned by governmental or non-
governmental organizations
Areas permitted for the Establishment of Community Forests
5. Community Forests will be permitted to be established in the following:
a. In deforested areas where natural regeneration is difficult.
b. In areas where it is possible to meet the local demand of forest products
c. Areas Suitable for the Establishment of Community Forest due to the need for Conservation
Activities
d. Natural forests which for various reasons should be managed by the community
e. Forest lands traditionally managed by the community
Application for the Establishment of Community Forestry
6. Households who would like to establish the community forestry shall form the users‟ group.
7. By consensus a management committee will be formed from the users‟ group. This committee will
consist of a chairman, a secretary, and 3 members.
8. On behalf of the users‟ group the Chairman has to apply to the District Forestry Officer through the
Township Staff Officer for the establishment of a community forest.
9. If the application is accepted, the district forestry officer has to identify the place and issue the paper
of permission. He will submit the detailed data and a map of the area to the State/Regional Forestry
Officer. Copies should be forwarded to the Director General and Director of the Planning and
Statistics section of the Forest Department. If the land is not under the management of Forest
Department, the District Forest Officer has to undertake instructions from the district forest
conservation committee.
10. The Director General of the Forest Department will give authority to the district forest officers
according to the Section 15 of the Forest Law.

86
Allotment of Lands for the Establishment of Community Forests
11. In the allotment of land to members of the users‟ group, the District Forest Officer has to determine
the size of the land according to the climate, the type of soil, trees to be planted and the degree of
conservation that could be accorded.
Duration of Land Lease for Community Forest
12. The duration of land lease for the establishment of Community Forest is set initially for 30 years.
13. After the period of 30 years, the District Forestry Officer will, with the approval of the Director
General of the Forest Department, determine whether or not to extend the lease depending on the
performance and the desire of the users‟ group.
Preparation of the Management Plan
14. Upon receiving the permission to establish a Community Forest, the users‟ group has to draw a
management plan according to the form (annex 2) presented by the Forest Department, with the
advice of responsible Forest Department personnel and forwarded to the District Forestry Officer
for confirmation.
Community Forest Establishment Certificate
15. After confirmation of the management plan, the District Forestry Officer will issue the Community
Forest Establishment Certificate (Annex 3). Forest rules, instructions, and restrictions relevant to the
Community Forest will be attached.
16. If the users‟ group is found to neglect or to violate the existing laws and acts of the Forest
Department, the directives, regulations and prescriptions of the management plans, the District
Forestry Officer has the right to revoke the issue of the certificate.
Assistance from the Forest Department
17. The Forest Department has to provide the users‟ group:
a. Seeds and seedlings necessary for the first period of extraction from the Community Forest
b. Technical assistance and expertise necessary for the establishment, management, conservation
and development of Community Forest
Responsibilities and Duties of the Users’ Group
18. The responsibilities and duties of the users‟ group are as follows:_
a. Establishment of tree plantations in barren areas
b. Using natural methods of conservation rehabilitation in forested areas
c. Protection against fire hazards
d. Development of forest plantation, and natural forests
e. Protection against indiscriminate cutting, felling, girdling, pruning, removal of barks etc.
f. Protection against extraction of stones, sands, earth and metals in the designated area
g. Prevention of illegal land use activities
h. Methodical utilization to avoid undue losses of forest products
i. Protection against soil erosion and environmental deterioration
j. After the primary extraction period, the users‟ group shall, under the supervision of the
Department of Forest, engaged in collecting seeds, establishing nurseries planting seedlings and
conserving the soil
k. Implementing activities as described in the management plan
Prohibitions
19. No members of the users‟ group will engage in the following:
a. Activities not prescribed in the management plan
b. Selling and renting of the community forest

87
c. Metal extraction and other activities that would cause forest degradation
d. Construction of houses or sheds not meant for the conservation of the community forest
e. Land allotted for community forest development should not be used for gardening or shifting
cultivation purposes, with the exception of agroforestry
Exploitation of Forest Products from Community Forest
20. Users‟ group can exploit the forest products of the community forest in accordance with the
prescription of the management plan
21. No tax shall be levied on the users‟ group or members of the users‟ group concerning the forest
products exploited from the community forest
22. Surplus forest products can be sold to non members of the village at reasonable prices. Taxation shall
be exempted from the sale of these products
23. The users‟ group can market the surplus forest products to areas outside the village
24. For marketing, for marketing of the forest products to areas outside the village, tax shall be conferred
to the Forest Department at specified rates
25. The users‟ group will use the incomes mainly for the implementation of the management plan and for
the development of the community forest
26. Surplus incomes can only be used for social welfare and economic development of members of the
users‟ group with the wish of the members.
27. The users‟ group can utilize forest products of the community forest and surplus cash to develop
business enterprises that produce high quality products
Funds
28. The fund of the users‟ group will be managed as follows:
a. The Secretary of the management committee will keep a detailed account on particulars
pertaining to the funds
b. The Secretary can, with the approval of the management committee, keep a certain amount of
money. Funds excess of that amount shall be kept in the bank or in a secure place.
c. The bank account must be opened jointly by the chairman and the secretary.
d. The Secretary must submit the particulars of the financial accounts at least once a year to the
users‟ group.
Price Setting
29. The users‟ group can sell the products of the community forests at current market prices
Receipts
30. For all the products sold from the community forest, the users‟ group shall issue receipts. For the
products that are to be transported to areas outside the township a set of three receipts would have to
be prepare. The buyer will retain one, another will be submitted to the Township Forest Department
and the last one be kept with the management committee. For forest products that are to be
transported within the township, a set of two receipts must be prepared. One will be issued to the
buyer and the other be retained by the management committee.
Transportation of forest products from the Community Forests
31. Forest products from the community forest can be transported within the township with the receipt
of the users‟ group.
32. Forest products of the community forest that are to be transported to areas outside the township,
need a pass in accordance with forest law section 23. They must not be transported together with
forest products obtained from other sources.
Offenses and Penalties

88
33. Users‟ group must adhere to the directives and instructions issued for the community forest, forest
laws, regulations and instructions periodically issued by the forest department.
34. Violation of the above mentioned laws, directives, regulations and instructions can lead to legal
actions which include the termination of the community forestry enterprises.
35. Any violation of the above mentioned laws and regulation will result in punishment in accordance to
the terms mentioned in them.
Records
36. The secretary of the management committee will keep a detailed record concerning tree planting,
pruning and production activities in forms attached to the management plan.
37. The Township Forest Officer, and the District Forest Officer will inspect the community forest and
its records as conditions permit. Instructions and corrections are to be provided when they are
deemed to be necessary.
Report
38. By the end of the budget year the management committee must submit the progress report to the
District Forest Officer through the Township Officer within the period of one month.
39. The District Forest Officer shall submit the progress report of the users‟ group together with his
comments and recommendations to the Regional/Divisional director of Forest. A true copy will be
forwarded to the Director of the Planning and Statistics section of the Forest Department.
Director General
Forest Department

89
APPENDIX II: FOREST SURVEY PROCEDURE
Sample plots
Because the selected CFs covered both plantations and natural forests, sample plots (SPs) were designed
separately for plantations and for natural forests.
Sample plot for plantations
The sample plot for plantations was a square matrix of 5 x 5 initial pegs where the seedlings had been
transplanted. Thus, the size of a SP varied with the original spacing of the plantation. For example, with
9‟ x 9‟ spacing, the size was 45‟ x 45‟ or 2,025 sq. ft. and with 12‟ x 12‟ spacing it was 60‟ x 60‟ or 3,600 sq.
ft. There was a sub-plot in the middle of the SP to enumerate useful herbs and shrubs and to assess
parameters of the forest ecosystem. The sub-plot was 9‟ wide and 45‟ long for 9‟ x 9‟ spacing. The SP
together with its sub-plot is shown in Fig. 2.1.
Figure 2.1: Sample plot for plantation
A square matrix of 5 x 5 initial pegs (trees) where the seedlings had been
transplanted.
Sample plot for natural forests
The sample plot for natural forests was a strip 33‟ wide and 330‟ long making an area of 10,890 sq. ft. or
0.25 acre. The SP was laid with its length lying across the contour. There was a sub-plot formed along the
centre line. The sub-plot was 10‟ in width (5‟ on either side of the centre line) and 330‟ in length. In the
sub-plot all useful shrubs and herbs were enumerated and the forest ecosystem was assessed.
The SP together with its sub-plot is shown in Fig. 2.2.
330 ft
33ft 10 ft
Sub-plot
(330’ x 10’)
Centre line of subplot and direction of enumeration
Figure 2.2: Sample plot for natural forest (SP is 330’ x 33’ and SSP is 330’ x 10’ in size)
Locating and establishing sample plots -Plantation
Sample plots were laid at the rate of one SP per 50 acres of the plantation in the selected CF. If the area
of the plantation was less than 50 acres two SPs were laid. Locations of the SPs were selected at random.
o o o o o
o o o o o
o o o o o
o o o o o
o o o o o
Map showing locations of selected CFs Map 2: Location of Study Sites

90
Natural forest
Sample plots were laid randomly at the rate of one SP per 100 acres of the natural forest in the selected
CF. If the area of the natural forest was less than 100 acres two SPs were laid. Locations of the SPs were
selected at random.
Activities on the sample plots
Activities undertaken on each sample plot and sub-sample plot are -
(A) Activities on the sample plots:
i. Measurement of dbh of all trees in millimetres and recording them on the enumeration sheet by
species;
ii. Measurement of mid-diameters (in mm) and total height (in meter) of the five trees standing
along the centre column;
iii. Enumerating dead and missing trees;
iv. Assessing health and quality of the forest (good, fair, poor, well looked after or neglected, ground
cover, soil erosion, presence of other crops, pests and diseases, etc.);
v. Recording the presence or absence of wildlife or wild birds;
vi. Assessing natural regeneration
vii. Inspecting boundary demarcation
viii. Appraising the status of water resource (present, absent, improved, etc.)
ix. Recording illegal extraction and encroachment
x. Recording the location of the CF using GPS.
(B) Activities on the sub-plots:
i. Enumerating all useful shrubs and herbs, especially medicinal plants;
ii. Assessing soil condition (whether erosion is taking place or not, etc.);
iii. Assessing soil cover (dense, fair, poor or absent).
iv. Inspection for pests (present or not):
v. Inspection for diseases (present or not, if present to describe type of disease);
vi. Assessing wildlife (present or not, if present to identify species);
vii. Assessing biodiversity (fauna and flora rich, fair or poor)
viii. Inspecting water resources (yes or nil, improving or no difference);
ix. Assessing aesthetic appreciation (pleasant to observe, enjoyable, etc.).
Financial Analysis – Procedure and Data Collection
To enable the analysis of financial profitability of CF, the following tables were completed at the meetings
with the users.
Input table
This is the table showing cash flow of expenditure.
Output table
This table records yearly outputs of the CF by type of product. CF might have been producing wood,
non-wood, agricultural and other products.
Unit value table
The table shows market values by respective years of the products recorded in the OUTPUT TABLE.
Combining the OUTPUT TABLE with the UNIT VALUE TABLE produced cash flow of income.
91
Stakeholder Interviews (with Forest Department Staff)
The main objective of this exercise was to assess the understanding and commitment of the FD staff in
the context of community forestry and CFI 1995.
At the termination of the field work in the township, meeting with all township forest department staff
was organized at the office of the Township Forest Officer. TFO was briefed on the findings of the field
survey.
Then, the participants of the meeting completed the questionnaire (Questionnaire For The FD Staff)

92
APPENDIX III: REGRESSIONS BETWEEN TREE PARAMETERS CF Species Regression Function R2 Data range No. of
obser-vations
dbh, mm h, m
1.Wuyan
All species Dbh- Height 429.0238.1 dh 0.360 1-200 2-20 91
Yemane Dbh- Height 593.0649.0 dh 0.768 1-200 2-14 13
Yemane Age - Dbh 899.011.31 Ad 0.814 40-160 3-6 6
2.Gweyutyan
All species Dbh-Height 663.0351.0 dh 0.622 1-150 1.5-16 47
Teak (planted) Dbh-Height 018.1101.0 dh 0.825 10-100 1-10 36
3.Pa De Thar Myothit
All species Dbh-Height 718.0253.0 dh 0.662 10-110 1-8 81
Yemane Dbh-Height 640.0325.0 dh 0.995 10-50 1-4 4
4. Sin Gaung Lay All species Dbh-Height 535.0506.0 dh 0.717 1-150 1-9 107
5. Myay Thin Twin All species Dbh-Height 424.0620.0 dh 0.360 5-70 1-5 26
6. Let Pan De
All species Dbh-Height 372.0773.0 dh 0.736 1-150 1-5 22
Eucalypts Dbh-Height 536.0595.0 dh 0.962 10-35 2-4 5
7. Mine In All species Dbh-Height 677.0303.0 dh 0.924 1-500 1-20 13
8. Pway Hla Pine Dbh-Height 003.1046.0 dh 0.992 200-450 5-20 4
9. Lwai Nyeint All species Dbh-Height 745.0173.0 dh 0.606 20-120 1-8 31
10. Nar Daung Hla All species Dbh-Height 836.0097.0 dh 0.522 50-130 2-7 13
11. Kone Shine All species Dbh-Height 631.0603.0 dh 0.158 100-220 5-25 15
12. Taung Kya- 1 All species Dbh-Height 593.1002.0 dh 0.591 100-300 10-25 10
13. Nyaung Ta Bin All species Dbh-Height 685.0365.0 dh 0.671 5-60 1-8 51
14.Byant Gyi Gon
All species Dbh-Height 575.0511.0 dh 0.604 1-80 1-7 58
Madama Dbh-Height 588.0431.0 dh 0.316 7-15 1-3 9
15. Te Pin Seik Thame (planted) Dbh-Height 390.0046.1 dh 0.692 1-150 2-8 19
16. War Gon
All species Dbh-Height 528.0721.0 dh 0.582 1-200 2-14 66
Byu Dbh-Height 333.0827.1 dh 0.578 10-100 4-9 20
Thame Dbh-Height 539.0642.0 dh 0.791 10-200 2-14 21
Thame (planted) Dbh-Height 447.0912.0 dh 0.696 20-150 3-9 12
Kambala (planted) Dbh-Height dh 088.0 0.577 80-140 6-13 6
Note: In the above regressions d is diameter at breast height (dbh in millimeter) and h is total tree height in meter.

93
APPENDIX IV: CODES OF TREE SPECIES
Code Botanical name Myanmar name Code Botanical name Myanmar name
1 Tectona grandis Kyun 193 Glochidion spp. Tamasok/Buzo
2 Xylia xylocarpa Pyinkado 195 Gmelina arborea Yemane
4 Acacia oatechu Sha 204 Helicia erratica Daukyat-gyi
24 Alstonis scholaris Taung-me-ok/Letpan-
ga/Tettok, Thinbon
206 Heritiera fomes Kanazo/Pinle-kanazo
35 Anthocephalux
cadamba
Ma-U-Lettan-she 213 Holarrhena
antidysenterica
Lettok-gyi/Lettok
36 Antiaris toxicaria Hmyaseik 232 Lagerstroemia speciosa Pyinma
41 Aquilaria agallocha Akyaw 236 lLennea grandis Nabe
44 Artocarpus lakoocha Myauk-lok 242 Litsaea glutinosa Ondon/Tagu, Tagu-shaw
47 Azadirachta indica Tama/Tama-kha 257 Mangifera caloneura Taw-thayet
48 Baccaurea sapida Kanaso 265 Markhamia stipulata Mahlwa
57 Berrya spp. Pet-wun 269 Melanorrhoea usitata Thitsi
58 Betula alnoides Cherry-bo/Layaung
(kachin)
270 Melia burmanica Pantama/Taw-tamaga
64 Bruguiera conjungata Byu-u-talon 285 Millettia pendula Thinwin
65 Bruguiera cylindrica Byu 291 Mitragyna rotundifolia Binga
78 Barallia brachiata Mani-awga 304 Oroxylum indicum Kyaung-sha
81 Cassia fistula Ngu/Ngu-shwe 319 Pentacme siamensis Ingyin
83 Cassia renigera Ngu-sat/Pwabe 325 Pinus merkusii Hna-khwa-tinyu
84 Cassia siamea Mezali 339 Protium serrata Thadi
86 Castanopsis spp. Thit-e/Gon/Kat 349 Pterospermum
semisagittum
Nagye
90 Cedrela multijuga Taung-tama 361 Quercus serrata Nyan
98 Chukrasia tabularis Yinma 362 Quercus spicata Sagat
103 Cinnamomum
obtusifolium
Nalingyaw 369 Rhizophora candelaria Byu-chidauk/Payon-apo
118 Dalbergia cultrata Yindaik 378 Salmalia malabarica Letpan
120 Dalbergia kurzii Thitpok 393 Schleichera oleosa Gyo
122 Dalbergia ovata Madama/Wun-byaung 405 Shorea oblongifolia Thitya
138 Diospyros montana Gyok 408 Sonneratia apetala Kambala
141 Dipterocarpus
tuberculatus
In 411 Sonneratia griffithii Laba
142 Dipterocarpus spp. Kanyin 414 Sterculia spp. Shaw/Shawa
145 Dolicahndrone
spathacea
Hingut 434 Terminalia belerica Thitsein
148 Duabanga grandiflora Myauk-ngo/Thit-kazaw 437 Terminalia chebula Panga
157 Emblica officinalis Zibyu 441 Terminalia oliveri Than
166 Eugenia spp. Thabye 450 Tristania burmanica Taungthabye
169 Excoecaria agallocha Kayaw/Thayaw 472 Xylocarpus granatum Pinle-on
173 Ficus cunia Thadut/Ka-on, Ye-ka-on 473 Xylocarpus moluccensis Kyana/Kyat-nan
175 Ficus glomerata Thapan/Ye-thapan 476 Zizyphus mauritiana Zi
478 Zizyphus rugosa Myauk-zi/Zi-ganauk


